
Abstract
Ansolabehere and Hersh and others have examined the reported voting behavior of survey respondents using a variety of validation methods, including matching with national voter files provided by outside vendors. This analysis provides the first examination of a thirty-year national longitudinal study and compares the insights obtained from this longitudinal analysis to two 2016 national cross-sectional studies of voting behavior using structural equation modeling. We find that respondents of the longitudinal study overreport at lower rates than respondents in our 2016 samples, and the traditional predictors of overreporting such as political interest, engagement, and partisanship predict overreporting among respondents in both our longitudinal and 2016 short-term panel studies, but our longitudinal data include novel predictors of overreporting such as parent socialization factors. We conclude with a discussion of the phenomenon of overreporting in surveys and how survey accuracy becomes increasingly important for both the public and policymakers in an era of decreasing trust in institutions and expertise.
Keywords
Introduction
In recent decades, there has been growing concern about the accuracy of self-reported survey responses about election participation. Previous studies have found that participants misreport 1 voting by double-digits (Ansolabehere and Hersh 2012; Berent, Krosnick, and Lupia 2016; Clausen 1968; Enamorado and Imai 2018b; Traugott and Katosh 1979) and blame this survey error on a variety of factors, including nonresponse bias among survey target samples, social desirability, survey mode, panel attrition, and errors in government records or the matching process (Berent, Krosnick, and Lupia 2011; Burden 2000; DeBell et al. 2018; Jackman and Spahn 2019). Misreporting leads to inaccurate survey estimates of turnout rates, with these estimates significantly exceeding the turnout rate reported by official election results (Ansolabehere and Hersh 2012). A recent analysis of the 2016 American National Election Study (ANES) and Cooperative Congressional Election Study (CCES) studies found the self-reported turnout rate to be at least 15 percentage points higher than the official turnout rate (Enamorado and Imai 2018b). This observation is not limited to U.S. election studies, as one meta-analysis observed an average 13 percent gap in reported versus official turnout in 130 studies across forty-three countries (Selb and Munzert 2013).
For the first time in the validation literature, we use election survey data from a thirty-year national longitudinal study to estimate and analyze vote overreporting in the 2016 presidential election. The availability of three decades of longitudinal information about residence location, education, marital status, and political engagement provides an important framework for examining self-reported voting activity. The insights into overreporting in our national longitudinal sample reflect the three decades—from middle school into their mid-40s—of socialization and life course experience that is unparalleled in the voting validation literature. We compare our findings from the longitudinal analysis to two national cross-sectional surveys of adults (age 18 and older) conducted by NORC AmeriSpeak to examine the level of misreporting and to explore the reasons for misreporting.
Primary Data Sets Used
The Longitudinal Study of American Life
The longitudinal study used for this analysis is the Longitudinal Study of American Life (LSAL). The study was funded by the National Science Foundation (NSF) 2 in 1985 to assess the scientific knowledge and characteristics of America’s youth. Originally called the Longitudinal Study of American Youth (LSAY), the study was launched in the fall of 1987 using a sample of seventh- and tenth-grade public school students. Both cohorts were selected through a multistage probability sample 3 and are a national representation of public school students in those grades in 1987. In 2013, NSF support for the LSAY was not renewed; however, new support was secured from the National Institute on Aging (NIA) to continue the study, 4 and the study was renamed the Longitudinal Study of American Life. Of the 5,945 students in the initial 1987 sample, approximately 5,100 are still eligible to participate. Approximately 4,100 have completed two or more surveys 5 since 2007.
This analysis uses survey responses from 3,150 young adults who completed the LSAL questionnaire in 2016 and provided information about their participation in the 2016 presidential election, focusing primarily on the approximately 800 individuals who did not vote. These young adults were forty-two to forty-six years of age in 2016 and represent the middle of the Generation X age 6 distribution. The data from the LSAY/LSAL are deposited in the Inter-university Consortium for Political and Social Research (ICPSR) and are available for secondary analysis. To date, more than forty dissertations and 200 refereed articles have been written by secondary analysts using LSAL data (see www.lsay.org). An extended description of the LSAY/LSAL study is included in the Supplemental Materials (SM hereafter).
Two National Cross-Sectional Studies
To provide a reference point to the literature, which is built primarily on cross-sectional surveys and short-term panel studies, we use two panel studies carried out by NORC AmeriSpeak 7 in 2016 and 2017 that included election questions using the same wording as the 2016 LSAL survey. The 2016 survey was a two-wave panel study, with a national probability sample of adults aged 18 and older, conducted in February and November of 2016. Election questions were included in the November wave of the 2016 panel (N = 2,270) and in the February wave of the 2017 panel (N = 2,925), the latter of which used a new national cross-sectional sample.
Although there was some sample erosion 8 in the 2016 AmeriSpeak panel, the February 2017 wave was the first wave of the panel so there was no sample erosion. Separate weights were computed for each cycle to adjust for demographic differences due to attrition. A comparison of the two AmeriSpeak survey demographics is included in the SM. The proportion of misreports did not differ significantly at the .05 level between the two samples. The November 2016 and February 2017 waves were combined for this analysis (N = 5,033).
The Use of Catalist for Vote Validation
Numerous cross-sectional and panel studies have validated the electoral participation of survey participants using third-party vendors (Ansolabehere and Hersh 2012; Berent, Krosnick, and Lupia 2011). For example, the 2016 ANES and 2016 CCES have provided voter validation from third party vendors (ANES 2017; Ansolabehere, Schaffner, and Luks 2017; Enamorado, Fifield, and Imai 2018; Enamorado and Imai 2018a). Catalist, our vendor, matches each survey participant’s name, address, and related demographic and geographical information with a file of voter records as well as other individual-level data Catalist possesses. 9 In this analysis, we match Catalist voting data with both the LSAL and the AmeriSpeak surveys to validate voter turnout and registration. Like Ansolabehere and Hersh (2012), our matching procedures included an iterative process between the project team and Catalist to ensure the most accurate match possible (see SM for more details). 10
The Magnitude of Misreporting
Our first objective is to examine the magnitude of misreporting in the LSAL and AmeriSpeak samples. We define a validated voter as an individual who reported that he or she voted in the 2016 election and for whom Catalist was able to find a public record verifying that vote. Overreporters consist of respondents who reported that they voted in 2016 but no public record was found by Catalist to support that claim. Individuals who reported that they did not vote in 2016, but Catalist found a public record that they cast a vote in the 2016 election were classified as underreporters. Respondents who report that they did not vote in 2016 and for whom there is no public record that they cast a vote are coded as validated nonvoters. 11
The Magnitude of Misreporting in the Longitudinal Study of American Life
We estimate the vote and nonvote proportions by combining the validated voters and the underreporters into a corrected vote estimate and by combining validated nonvoters and overreporters into a corrected nonvote estimate (see Table 1). Using these definitions, we were able to verify 66.8 percent of the young adults in the LSAL as voters, including the 1.3 percent of respondents who underreported, and 19.8 percent as nonvoters (see Table 1), including the 12 percent of participants who overreported. This compares to the 62.9 percent of individuals in this age range who voted according to the 2016 Current Population Study.
Validation and Misreporting, 2016.
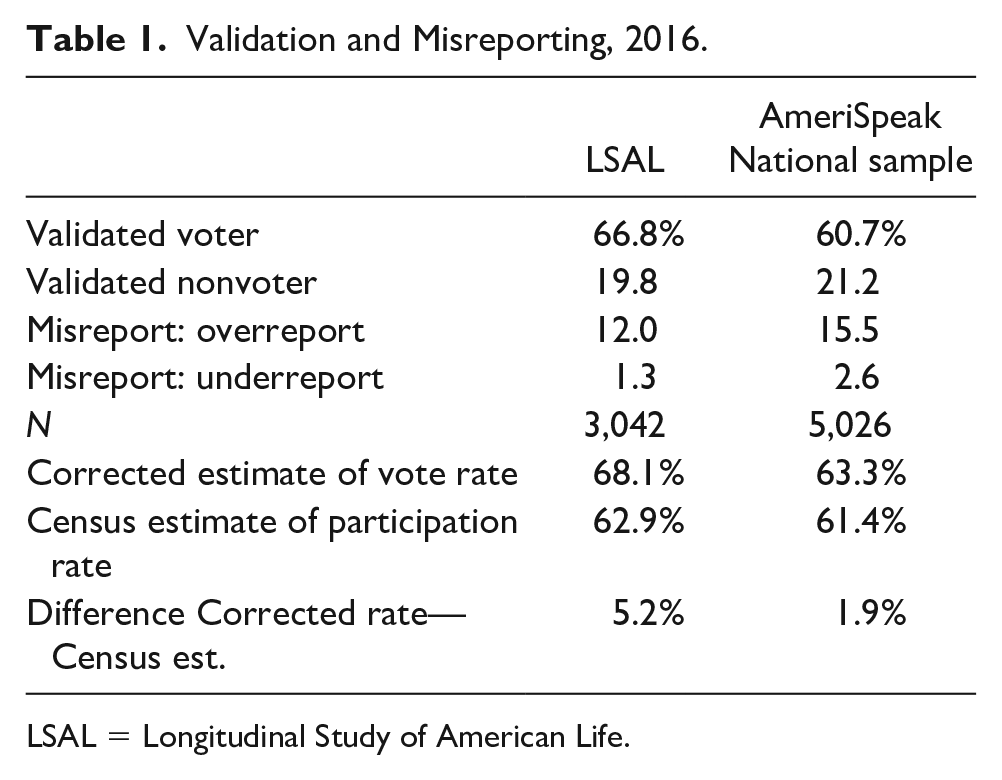
LSAL = Longitudinal Study of American Life.
Two possible reasons for these different participation rates are (1) the longitudinal nature of the LSAL excludes individuals not in the public school system as of 1987 (e.g., nonpublic school attendees and immigrants who obtained citizenship), and (2) a differential erosion rate in the LSAL over the last 30 years that favors respondents who are better educated and more likely to be politically engaged than individuals who dropped out of the study. The LSAL sample is weighted to minimize the effect of differential erosion.
Accuracy of Vote Reporting in Two Cross-Sectional Studies in 2016
In the combined data set from the cross-sectional national samples provided by AmeriSpeak, 60.7 percent of respondents were validated voters and 21.2 percent were validated nonvoters. An additional 15.5 percent of 2016 election respondents overreported and 2.6 percent underreported. The corrected estimate of voting in the 2016 presidential election was 63.3 percent. The Census estimate of the proportion of American citizens who voted was 61.4 percent. 12 The difference between our corrected vote estimate and the Census estimate is 1.9 percent (see Table 1). This is a significant improvement over the 18.1 percent error in the un-validated responses of respondents to the AmeriSpeak surveys.
Analysis of Respondent Misreporting of Vote Behaviors in a Longitudinal Study
Within any election year, it is useful to examine the magnitude of two kinds of respondent error—overreporting and underreporting. We join the literature that has focused on overreporting (Anderson, Silver, and Abramson 1988; Belli, Traugott, and Bechmann 2001) and are the first to use the insights from a thirty-year longitudinal study to improve our understanding of this overreporting.
Why do some participants overreport their voting behavior? Using the thirty-year longitudinal record of the LSAL, we examine five possible explanations: (1) respondents may be less likely to recall their voting behavior correctly as the length of time between election day and the date of the survey response increases, (2) overreporting appears to be associated with social expectations that good citizens ought to vote, (3) respondents who are experiencing significant life disruptions are less likely to recall their voting behavior accurately, (4) politics is a low salience subject for some respondents and respondents with a low level of interest in politics may be less likely to accurately recall their voting behavior, and (5) respondents with a strong sense of partisanship are more likely to recall their voting behavior correctly. We use the thirty-year longitudinal record of the LSAL to examine these hypotheses.
The second kind of misreporting is underreporting. Some respondents report that they did not vote when asked in a survey, but public voting records indicate that they cast a ballot in the election. Despite our relatively large sample sizes, we do not have an acceptable number of underreporters to conduct parallel analyses of underreporters.
Memory and Recall
The ability of survey participants to recall accurately past activity is a long-standing focus of research among social scientists (e.g., Niemi, Katz, and Newman 1980; Pearson, Ross, and Dawes 1992; Weir 1975). Voter validation studies seek to understand respondents’ ability or inability to remember whether they voted during a specific election (Abelson, Loftus, and Greenwald 1992; Belli et al. 1999; Belli, Traugott, and Bechmann 2001). Abelson, Loftus, and Greenwald (1992) found that two separate survey samples of the same population separated by five months produced significantly different misreport rates. Belli et al. (1999) and Belli, Traugott, and Bechmann (2001) claim that the accuracy of self-reported turnout rates starts to diminish within the first week after an election.
The LSAL begins its fieldwork within days after a presidential election, but data collection may extend over several months. Although the response rate of the LSAL is 70 percent, the period of data collection extends over a five-month period each year (see the SM). Using the date of the completion for online respondents and the date of receipt for mailed questionnaires, the number of days between the 2016 presidential election and the completion of the survey was computed and organized into an ordinal scale. The results provide no support for the length of recall hypothesis (see Table 2).
Vote Reporting and Misreporting, by Length of Time Since Election, 2016.
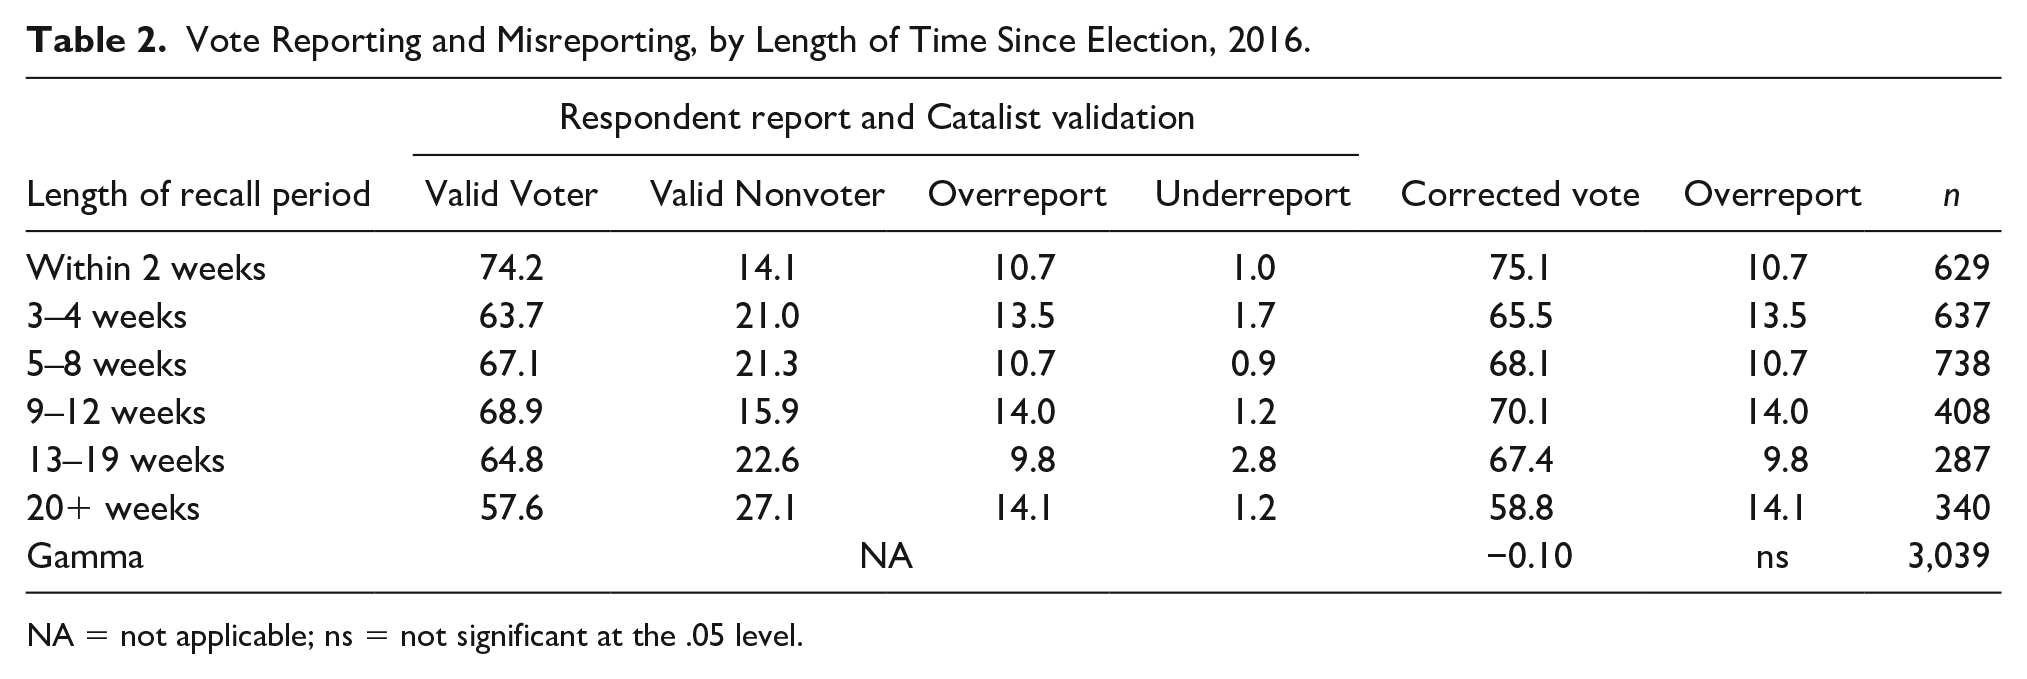
NA = not applicable; ns = not significant at the .05 level.
Education and Socialization
The preceding analyses suggest that a substantial portion of overreporting may be attributed to a desire to conform in a survey setting to a social expectation that good citizens should vote. The sources of this expectation are well documented in the literature (Abramson 1974, 1975; Dawson and Prewitt 1968; Easton and Dennis 1969; Greenstein 1965; Hess and Torney 1967; Hyman 1959; Jennings and Niemi 1974, 1981). Reflecting this body of work, we examine three indicators of early political socialization on voting and overreporting: (1) the level of parent education, (2) the level of parent political engagement, and (3) each student’s expected adult political activities at the end of high school.
In twentieth- and twenty-first-century America, education is the best indicator of social class. The level of parent education represents the nature of the home environment and the cognitive complexity of language used in the home, and is closely tied to the level of educational expectations held by the children in a family (Berger and Luckmann 1966; Hyman, Wright, and Reed 1975; Sternberg and Ben-Zeev 2001). One parent of each LSAL participant was surveyed each year during secondary school and provided a wide range of information about the home. For this analysis, we focus first on the level of parent education as reported by one or both parents. Consistent with the literature, the results indicate that the children of better-educated parents were somewhat more likely to vote in 2016, but parent education was not related to the likelihood of overreporting (see Table 3).
Vote Reporting and Misreporting, by Life Disruptions Parent Education, Parent Political Engagement, and Student Political Goals in Grade 12.
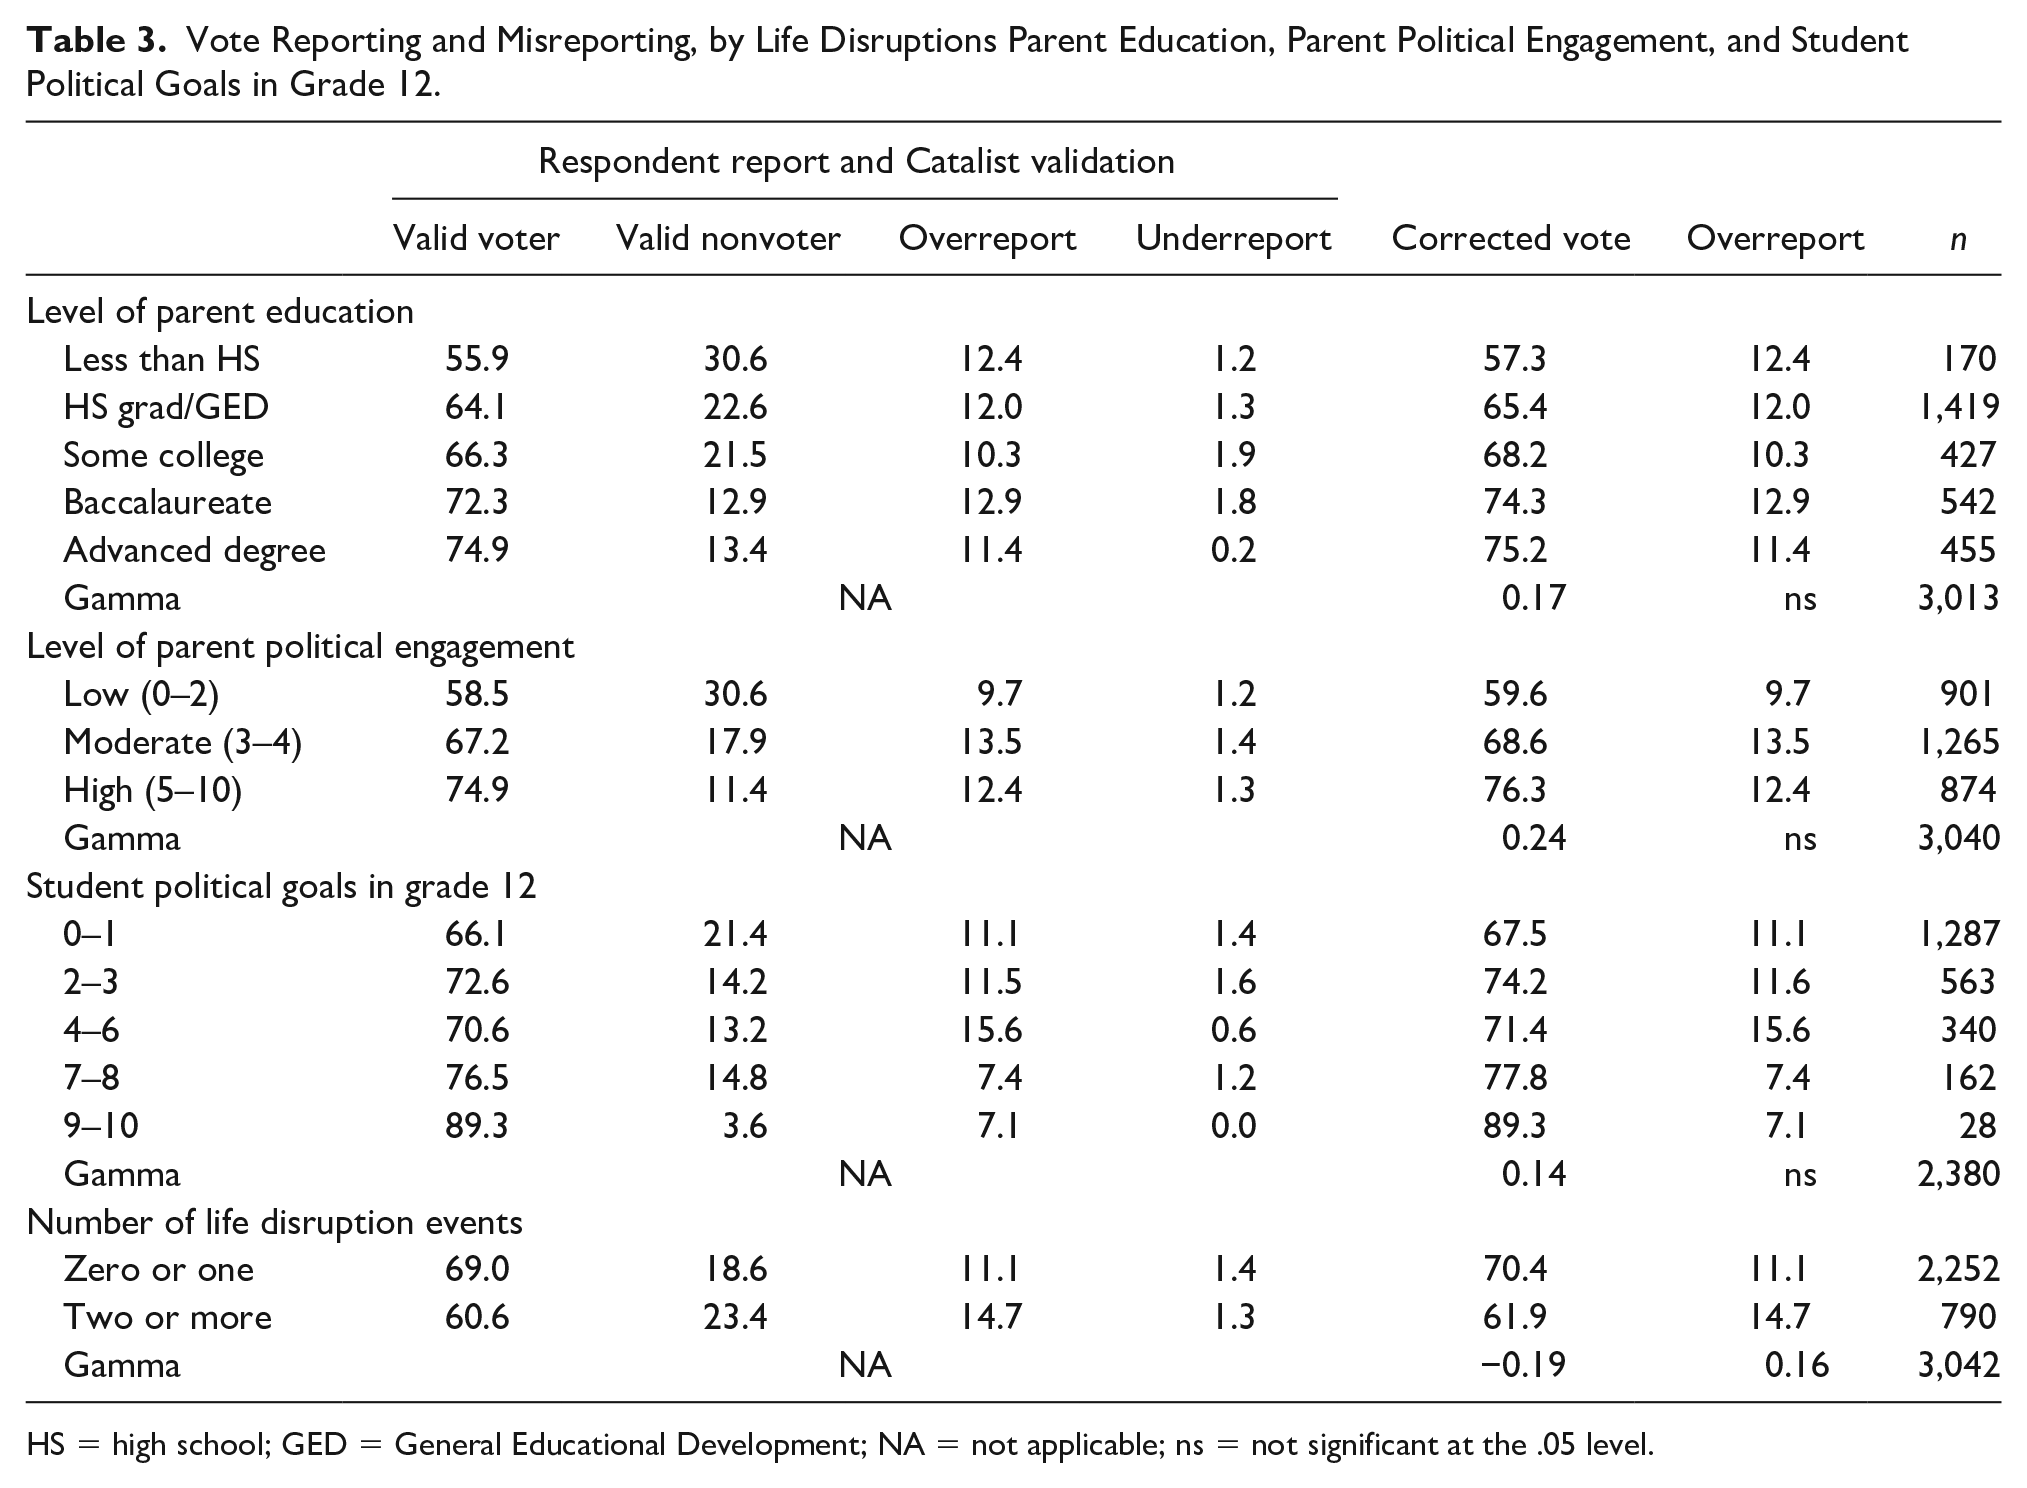
HS = high school; GED = General Educational Development; NA = not applicable; ns = not significant at the .05 level.
A second indicator of early socialization is the level of parent political engagement. Previous research has shown that parent political engagement serves as a role model for their children (Berger and Luckmann 1966; Dawson and Prewitt 1968; Easton and Dennis 1969; Greenstein 1965; Hess and Torney 1967; Hyman 1959; Jennings and Niemi 1974, 1981). An index of parent political engagement 13 was constructed from parent reports during the secondary school years. Children of parents with a high level of political engagement were significantly more likely to vote in 2016 than children raised in less politically active homes (gamma = 0.24). 14 The level of parent political engagement was unrelated to the likelihood of overreporting (see Table 3).
The short-term influence of parent political socialization can be estimated by looking at each high school student’s self-reported expected level of political engagement as an adult. 15 A confirmatory factor analysis (CFA) was used to identify items that loaded on a single dimension representing expected future political engagement and factor scores were used to construct a zero-to-ten index. LSAL young adults who scored higher on this index were significantly more likely to vote in 2016 than young adults with lower expectations of political involvement (gamma = 0.14), but the level of expected political engagement was not related to the likelihood of overreporting in 2016 (see Table 3).
Looking at these three sources of early influence of the formation of social expectations about participation and voting, we conclude that early parent and home political socialization has a measurable positive influence on the formation and acceptance of these expectations and that these early expectations have some influence on actual voting behaviors in mid-life.
Disruptive Life Events
We expect that major disruptive events in a person’s life may increase the personal cost of electoral participation, making it less likely that a person votes. Despite their intentions, some individuals who are disposed to vote find themselves unable to vote due to various demands of life. Such individuals are potentially more likely to overreport. To test this proposition, a simple scale was constructed to count the number of major disruptive events experienced by each LSAL respondent in the four years preceding the 2016 presidential election: (1) loss of job, (2) significant reduction of work hours or benefits, (3) loss or foreclosure of one’s home, (4) diagnosis of cancer or other major life-threating illness or disease, or (5) divorce or death of a spouse or partner. This list does not exhaust the full range of possible disruptive life experiences, but it represents the most frequently mentioned in the LSAL.
Some of these life disturbances are exacerbated by the electoral rules put in place by state and local officials. Besides the traditional tasks associated with moving, individuals may need to change their voter registration address. While some states offer automatic voting registration and other states allow individuals to register to vote the same day that they vote, implementation of these laws has been uneven across the states. The fragmented nature of the election process in the United States means that some individuals who move their place of residence face additional barriers to voting (e.g., Brady and McNulty 2011). Because of these extra costs, recent mobility is associated with lower turnout rates (Ansolabehere, Hersh, and Shepsle 2012; Hansen 2016; Hobbs 2019; Squire, Wolfinger, and Glass 1987). However, even if voters successfully navigate the election rules, they still must find time to vote in the election.
We examine the influence of these disruptive life events on voting and vote reporting, using an index counting the number of events. Preliminary analyses found that the experience of one disruptive life event was not a significant influence on voting or misreporting, but that the experience of two or more disruptive life events is related to both the likelihood of voting and the likelihood of misreporting (see Table 3). The 26 percent of the young adults in the LSAL who experienced two or more disruptive life events in the four years preceding the 2016 election were significantly less likely to have voted and significantly more likely to have overreported their voting activity.
Political Interest and Engagement
The postwar political science literature found that a significant proportion of American adults report a low level of interest in politics and public policy issues and even fewer engage in overt political activities (Berelson, Lazarsfeld, and McPhee 1954; Campbell et al. 1964). Although an individual’s level of political interest may be influenced by early socialization and contemporary factors, we expect that LSAL young adults who have a low level of interest in politics may be less likely to recall their voting behavior or to claim that they voted to conform to societal expectations for voting and participation.
To test this explanation, separate measures of political interest and political engagement were constructed, both of which are discussed in more detail in the SM. A seven-item index of political interest was constructed using seven items reflecting self-reported levels of interest and information consumption, but none of the items asked directly about voting. A CFA using LISREL found that the seven items loaded on a unidimensional scale of political interest. The factor loadings were used to construct a zero-to-ten scale that is used as a continuous variable. For presentation purposes, the zero-to-ten scale was converted into a five-level ordinal variable.
On this zero-to-ten index of political interest, 28 percent of LSAL participants scored three or lower (see Table 4). Twenty-four percent of LSAL young adults scored seven or higher on the index, reflecting a higher level of campaign and election interest. Nearly half of LSAL young adults scored four, five, or six. The level of political interest was strongly associated with voting in the election, but it was not related to the frequency of overreporting electoral participation (see Table 4). It appears that some respondents at all levels of political interest attempt to conform to societal expectations about voting by overreporting their own activity.
Vote Reporting and Misreporting, by Level of Political Interest and Engagement, 2016.
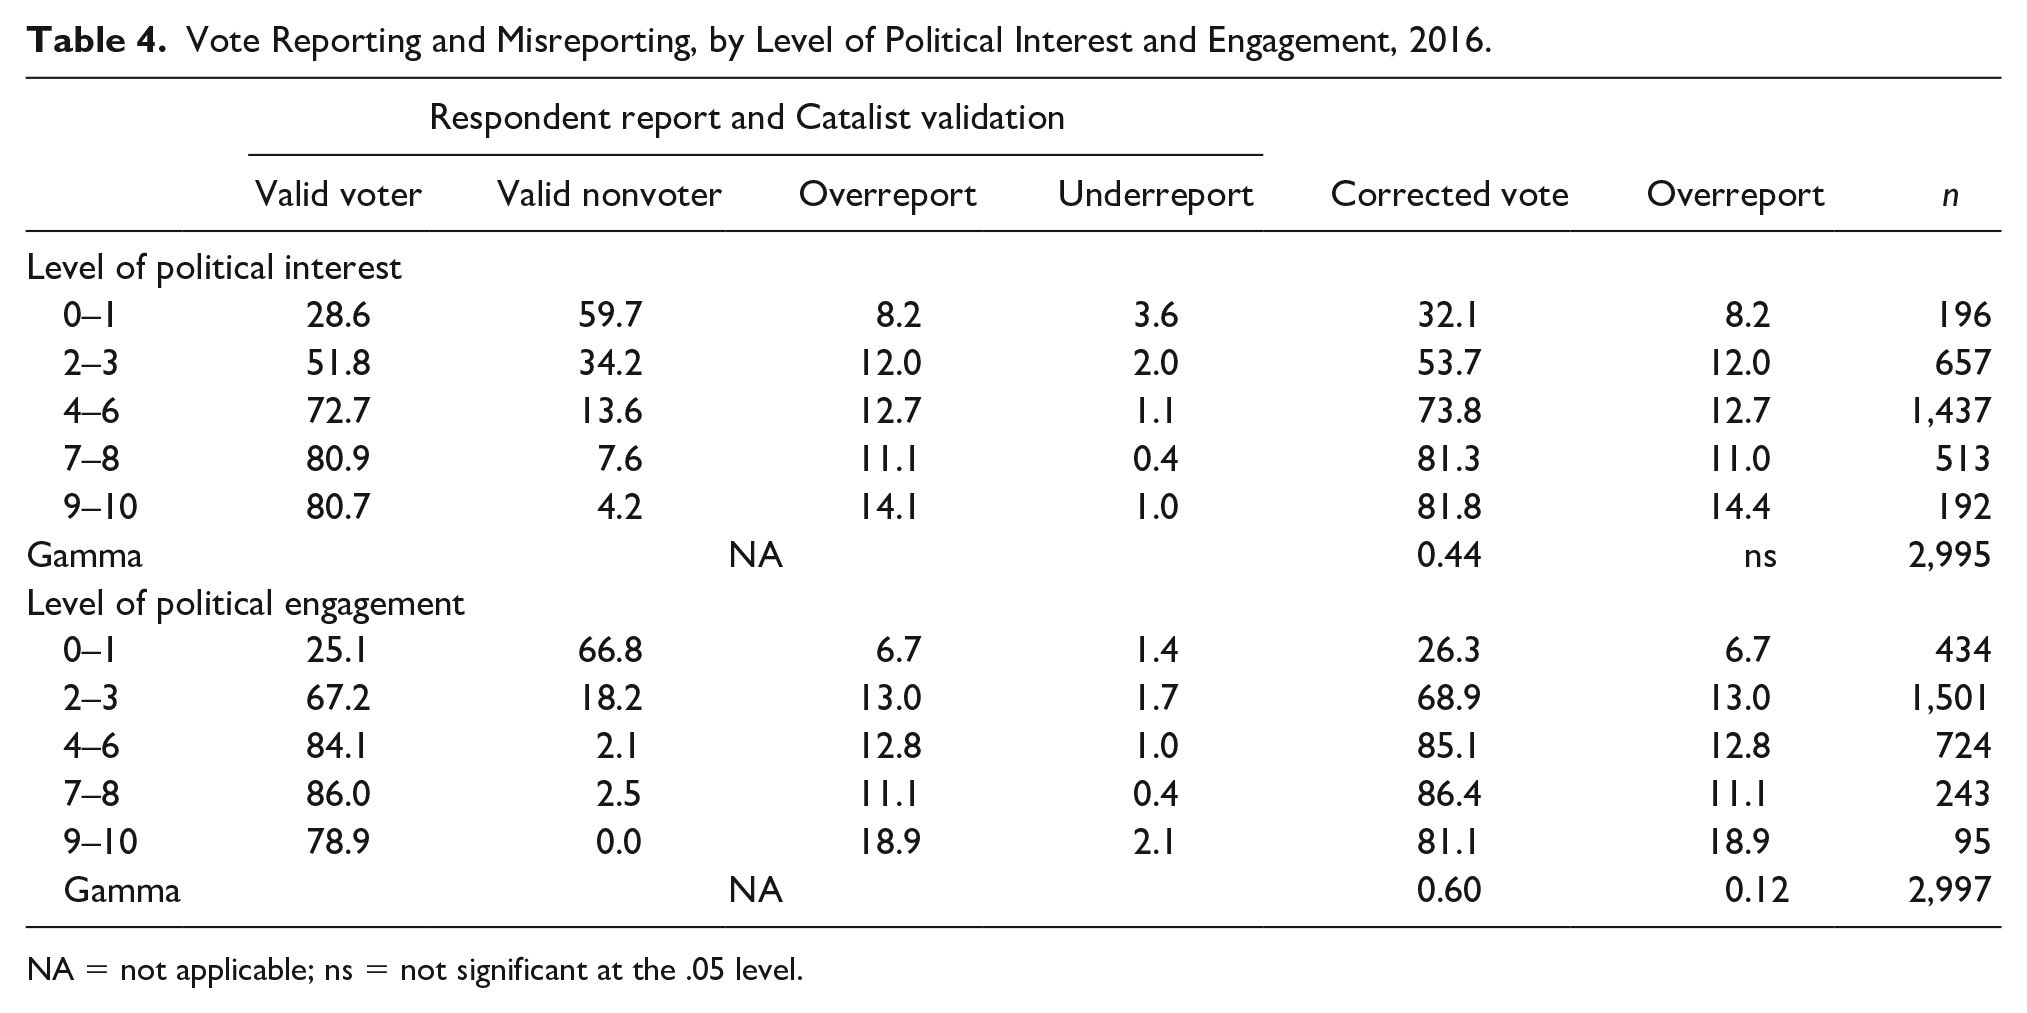
NA = not applicable; ns = not significant at the .05 level.
Reflecting the electoral research literature, we constructed a separate four-item measure of political engagement. The level of overt political engagement in the 2016 presidential election was lower than the level of interest in the campaign, but the two measures were strongly correlated. Unlike political interest, the level of political engagement was related to the likelihood of overreporting, with a gamma of 0.12.
Ideological Partisanship and Political Climate
One of the distinguishing characteristics of American politics in the last six decades has been the growth of ideological partisanship, where ideologues sort themselves into the appropriate party and members of a party may be more likely to describe themselves in ideological terms. In the early 1960s, Burns (1963) described the American political system as a four-party system, with Congressional Republicans and Democrats as conservative forces and Presidential Republicans and Democrats as more liberal. These four parties were more regional than ideological. There was an underlying tension over race that eventually produced a new two-party alignment of a strongly conservative Republican Party rooted in a combination of former white southern Democrats and religious and fiscal conservatives (Abramowitz 2010, 2018; Black and Black 2002; Woodward 2006). Facing the emergence of a strong conservative political movement, the other parts of the system coalesced into a center-left Democratic Party.
Over the ensuing decades, each of these two parties has become more ideologically consistent and rigid in their views (Abramowitz 2010, 2018). The public’s issue positions have polarized on several dimensions (Caughey, Dunham, and Warshaw 2018), although both long-standing and recent research shows that most Americans do not hold constrained issue positions (Achen and Bartels 2016; Converse 1964; Kinder and Kalmoe 2017). Outside of issue polarization, ideological labels also are an important part of a politically engaged person’s identity, especially when comparing in-groups and out-groups (Kinder and Kalmoe 2017; Mason 2018a). These group attachments are powerful motivators (Achen and Bartels 2016). Ideological, partisan, and other identities are becoming increasingly aligned, increasing in-group attachment, out-group hostility, and political engagement among the well-sorted (Mason 2018b).
It is reasonable to expect that strong partisans who describe themselves in ideological terms may be more likely to report voting even when they did not. 16 Using a seven-category characterization of ideological partisanship (see Figure S-1 in the SM), the highest rates of corrected voting are associated with the most conservative and the most liberal partisans, but the rate of overreporting does not follow the same pattern (see Table 5). In 2016, liberal Democrats were the least likely to misreport and moderate Democrats and moderate Republicans were the most likely to misreport.
Vote Reporting and Misreporting, by Level and Intensity of Ideological Partisanship, 2016.
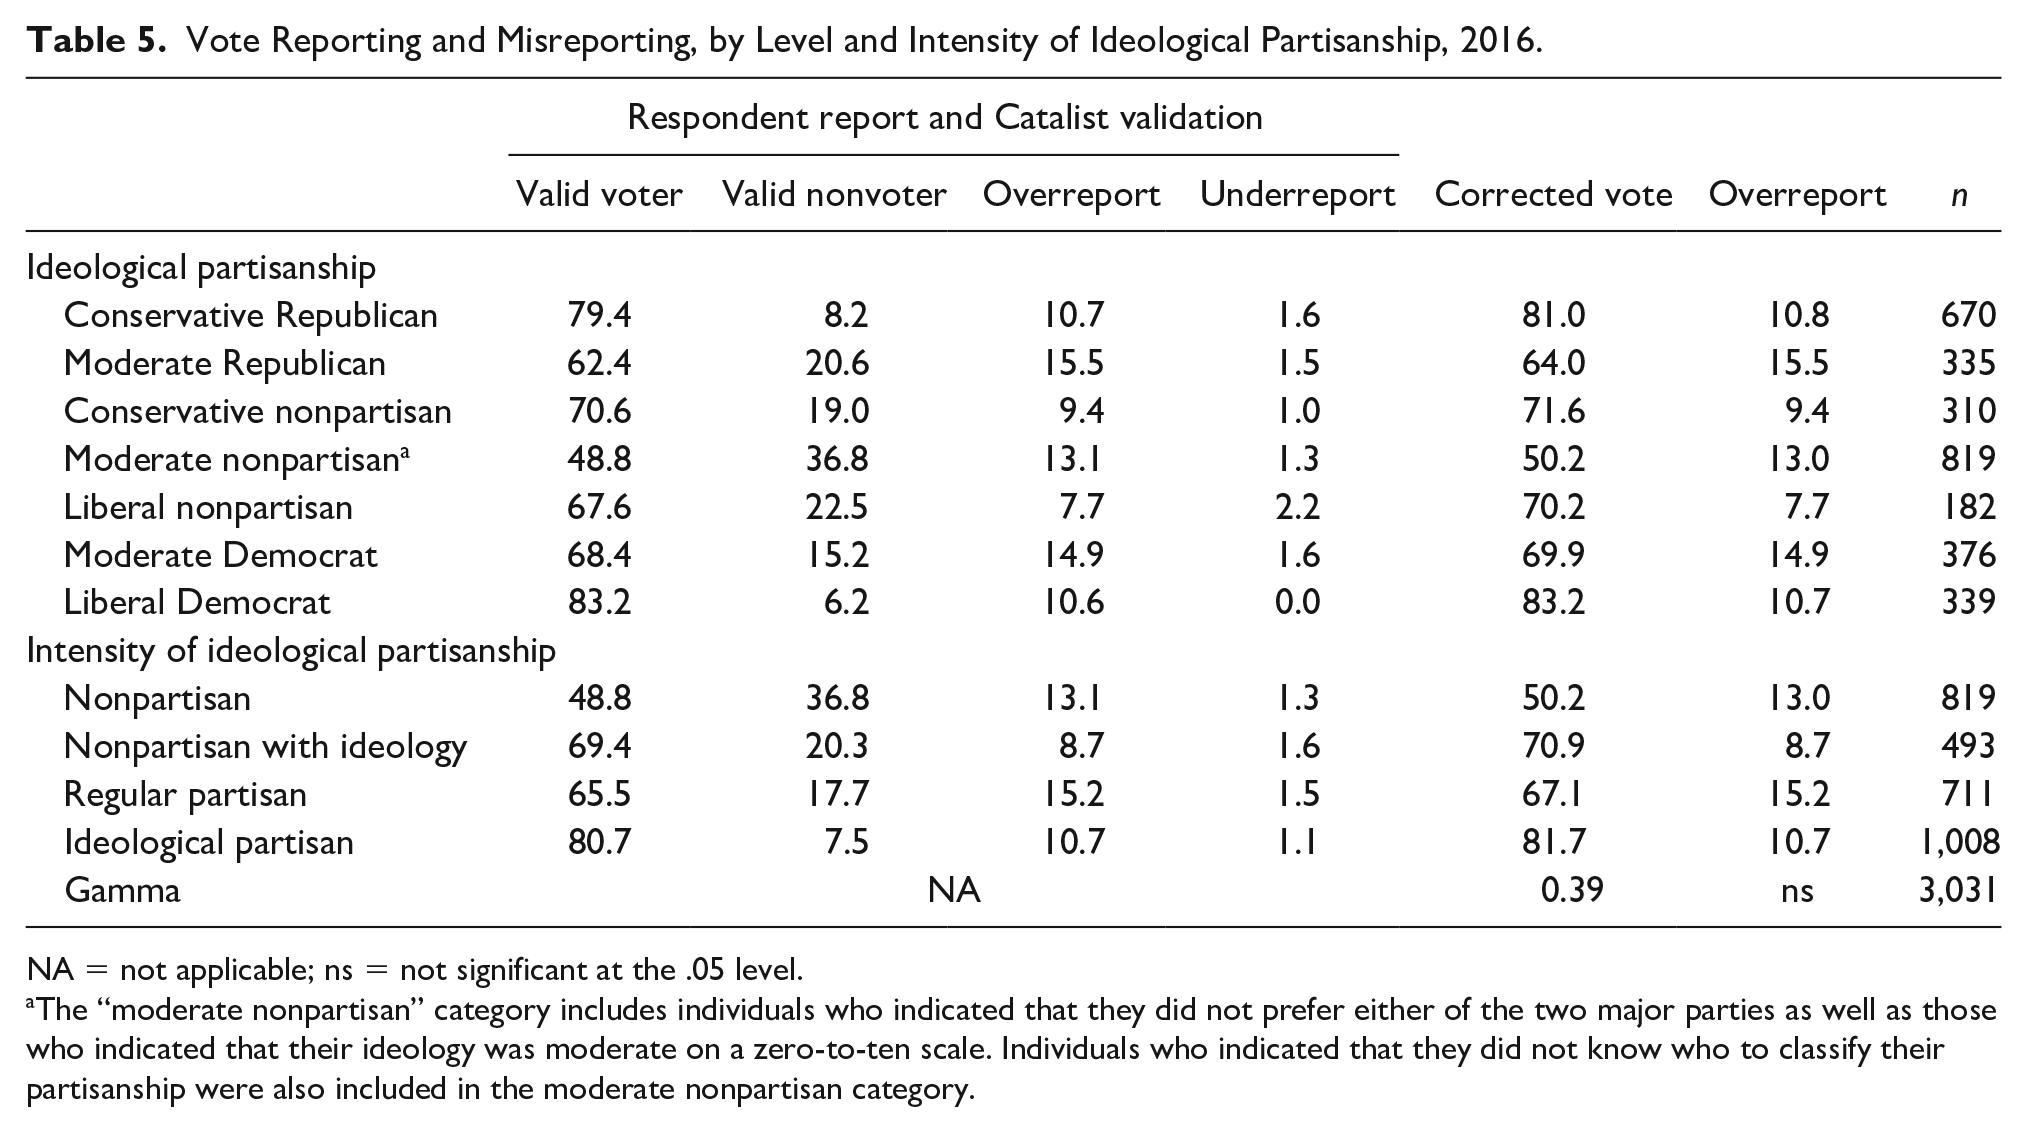
NA = not applicable; ns = not significant at the .05 level.
The “moderate nonpartisan” category includes individuals who indicated that they did not prefer either of the two major parties as well as those who indicated that their ideology was moderate on a zero-to-ten scale. Individuals who indicated that they did not know who to classify their partisanship were also included in the moderate nonpartisan category.
The relationship between ideological partisanship and voting suggests that we focus on the intensity of ideological partisanship. If we assume that liberal Democrats and conservative Republicans are the most intensively engaged citizens in electoral politics, we can scale the other kinds of ideological partisanship from a base of nonpartisanship to intensive ideological partisanship. For this purpose, we begin with a base of respondents who report that they have no partisanship and may dislike the idea of partisanship (Klar, Krupnikov, and Ryan 2018). At a second level, we place respondents who disavow major party identification, but express some level of liberalism or conservatism on political matters. Some of these individuals may identify with a third party—Greens, Libertarians, or similar smaller parties. At a third level, we place regular partisans—Democrats and Republicans—who report that they identify with a major party but who decline to characterize themselves as liberals or conservatives. Respondents who classify themselves as conservative Republicans or liberal Democrats are placed in the top category as ideological partisans.
Using this typology, the likelihood of overreporting was lower among individuals expressing an ideological orientation and higher among nonpartisans and regular partisans, while the corrected voting rate was highest among nonpartisans with ideology and ideological partisans (see Table 5). This pattern suggests that nonpartisans and regular partisans may be less motivated to make the effort to cast a vote, but are susceptible to the social expectation that they should have voted.
The influence of ideological partisanship may vary significantly within different political climates—red states, blue states, and battleground states. Given the incentive systems inherent in the Electoral College as well as some uncompetitive Congressional or state legislative races, a Democrat who lives in a deep red state or a Republican who lives in a deep blue state may have less incentive to make the effort to cast a ballot, although these individuals may continue to hold a preference for a specific presidential candidate. This same logic may hold for nonpartisans in a deep red or deep blue state who may see limited value to making the effort to vote when they are relatively certain how that state’s electoral votes will be cast, or who will be elected in a heavily Republican or Democratic state or district.
To test these propositions, we look at the relationship between ideological partisanship and actual and reported vote behaviors in red states, blue states, and battleground states (see Table S-5). 17 The same U-shaped relationship holds within each political ecosystem in regard to corrected vote estimate, but the pattern in regard to overreporting is less clear. The level of overreporting in 2016 was higher in red states and blue states and lower in battleground states. This result suggests that respondents are more likely to overreport when they live in a state dominated by one party and in which the final allocation of Electoral College votes is not in doubt. We think that the logic underlying this kind of overreporting is that respondents may have a strong preference for a candidate, but recognize that their actual vote will make no difference in the outcome.
In battleground states, Democrats were more likely to misreport than were Republicans in 2016 (see Table S-5). In these politically competitive states, 7.7 percent of Republicans and 12.7 percent of Democrats misreported, overwhelmingly in the direction of overreporting. We present a more comprehensive analysis of the factors that predict the outcome of the 2016 election in a separate report, but it is important to note this differential in overreporting in battleground states.
The preceding discussion focused on the impact of ideological partisanship, but it is instructive to look at misreporting by moderate nonpartisans. The literature often labels these voters as independents and has documented their low level of political interest and participation over the years. Our analysis of the actual and reported voting behaviors of LSAL young adults who classify themselves as nonpartisan and moderate in political ideology confirms earlier findings of low participation, but shows a substantial level of overreporting (see Table 5). In 2016, 11.8 percent of self-classified moderate independents overreported their voting behavior. This result is consistent with an interpretation that these mid-life adults have weak partisan motivations to cast a vote, but recognize the social expectation of voting as a part of good citizenship. They resolve this dilemma by overreporting their vote participation.
A Model of Misreporting in a Longitudinal Study
The preceding analyses examined several potential explanations of misreporting voting behavior by LSAL respondents—now in their mid-40s. It is important to examine factors that appear to be important in bivariate analyses in a multivariate context to understand the relative influence of each of these factors and the cumulative amount of covariance that is explained by these variables. For this purpose, we turn to a structural equation model (SEM), using LISREL.
Because of the thirty-year longitudinal record of the LSAL, an SEM is the best method of examining the structure and flow of influence over the last three decades of the lives of LSAL young adults. An SEM takes advantage of knowledge of the chronological and logical ordering of the variables in the analysis and the collection of these measures over a thirty-year period allows the placement of variables in a correct chronological or logical sequence. In an SEM, the flow of influence is from left to right (see Figure 1). The strength of an SEM is that proximate variables are examined in a longitudinal context and the influence of these variables is estimated holding constant prior exogenous and endogenous variables. In this model, the level of parent education and the participant’s gender are treated as exogenous variables and are placed on the left side of the model.

A model to predict overreporting among nonvoters, Longitudinal Study of American Life, 2016.
Throughout the last three decades, LSAL participants have reported their enrollment in educational programs and the degrees and certifications they have attained. The model includes a six-level categorical measure of educational attainment in 2016—slightly more than two decades after the end of high school.
Reflecting our examination of red states, blue states, and battleground states, the model includes a dichotomous indicator of whether each participant is a political minority (a Democrat living in a red state or a Republican living in a blue state). The model includes a zero-to-ten scale of political interest, a four-level measure of the intensity of ideological partisanship, and a zero-to-ten point scale of political engagement in 2016.
Finally, reflecting the most proximate sources of possible influence on overreporting, the model includes (1) a measure of the time between the election and the completion of the survey, and (2) an indicator of whether each LSAL participant had experienced two or more major life disruptions during the four years preceding the 2016 election.
These variables are used to predict the likelihood of overreporting by LSAL respondents. Following the procedures used in previous analyses of misreporting (Enamorado and Imai 2018b; Silver, Anderson, and Abramson 1986), the population is limited to respondents who did not vote in 2016. The small number of underreporters negates a parallel analysis of underreporting.
The results indicate that the variables included in this analysis account for 62 percent of the covariance in the model (see Figure 1). An analysis of the total effect of each predictor variable in the model indicates that early political socialization by parents and the adoption of political expectations by the student during the high school years produce a set of behavioral expectations that persist into mid-life. The total effect of parent education is 0.23 and the total effect of the level of parent political engagement during a student’s high school years is 0.33. The total effect of the level of expressed student political plans during adulthood was 0.07. These results suggest that parent education and role modeling are more important than the early adoption of socially desirable political goals.
The two strongest predictors of overreporting are (1) the level of political interest and (2) the level of political engagement in 2016. The total effect of the level of political interest is 0.45 and the total effect of the level of political engagement is 0.65 (see Figure 1). The total effect of the intensity of ideological partisanship is 0.24. This set of results suggest that individuals who overreport their vote in presidential elections have a high level of political interest and are often engaged in election-related activities, but failed to cast a vote in 2016. Because of their high level of political interest and engagement and their early socialization toward political participation, they feel a need to report in a survey that they did cast a vote. LSAL respondents who were a political minority in their state in 2016 were slightly more likely to overreport their voting behavior (see Figure 1).
Analysis of Vote Reporting in Two National Cross-Sectional Studies
Building on our analysis of our long-term longitudinal study, we now turn to a parallel analysis using our two national cross-sectional studies. The combined cross-sectional AmeriSpeak surveys indicate that 15.5 percent of adults overreported their presidential vote in 2016. Our analysis of the combined adult cross-sectional data set examines four possible explanations of overreporting: (1) respondents may be less likely to recall their voting behavior correctly as the length of time between elections day and the date of the survey increases, (2) respondents for whom politics is a low salience subject may be less likely to accurately recall their voting behavior, (3) respondents with a strong sense of partisanship are more likely to recall their voting behavior correctly, and (4) respondents with more formal education and more cognitive skills may be less likely to misreport their voting behaviors.
Memory and Recall
A good deal of the literature on vote misreporting assumes that some respondents may simply forget whether they voted in a specific election (Belli, Traugott, and Bechmann 2001). The combined AmeriSpeak surveys provide a further test of this hypothesis since half of the sample was surveyed in the two months immediately after the election and the other half was surveyed four to six months after the election. The combined data set includes a range of recall period from one week to six months. The results again provide no support for the memory and recall hypothesis, reinforcing the LSAL finding (see Table S-6).
Political Interest and Engagement
Using the same seven-item index of political interest used in our LSAL analysis (see SM), 55 percent of adults in the AmeriSpeak surveys reported a score of three or lower on this zero-to-ten scale (see Table 6). Fourteen percent of adults in the AmeriSpeak surveys scored seven or higher on the index.
Vote Reporting and Misreporting, by Level of Political Interest and Engagement, 2016.

NA = not applicable.
The level of political interest was associated with overreporting in the 2016 election (gamma = 0.17). Each respondent to the AmeriSpeak surveys was asked the same set of political engagement questions used in the LSAL analysis and the results indicate that American adults with higher levels of political engagement were more likely to overreport (gamma = 0.13).
Ideological Partisanship
Using the same seven-category characterization of ideological partisanship employed in our LSAL analysis, the AmeriSpeak results show that the highest rates of corrected voting are associated with the most conservative and the most liberal partisans, but the rate of overreporting does not follow the same pattern (see Table 7). In 2016, conservative Republicans were the least likely to overreport and moderate Republicans were the most likely to overreport.
Vote Reporting and Misreporting, by Level of Ideological Partisanship, 2016.
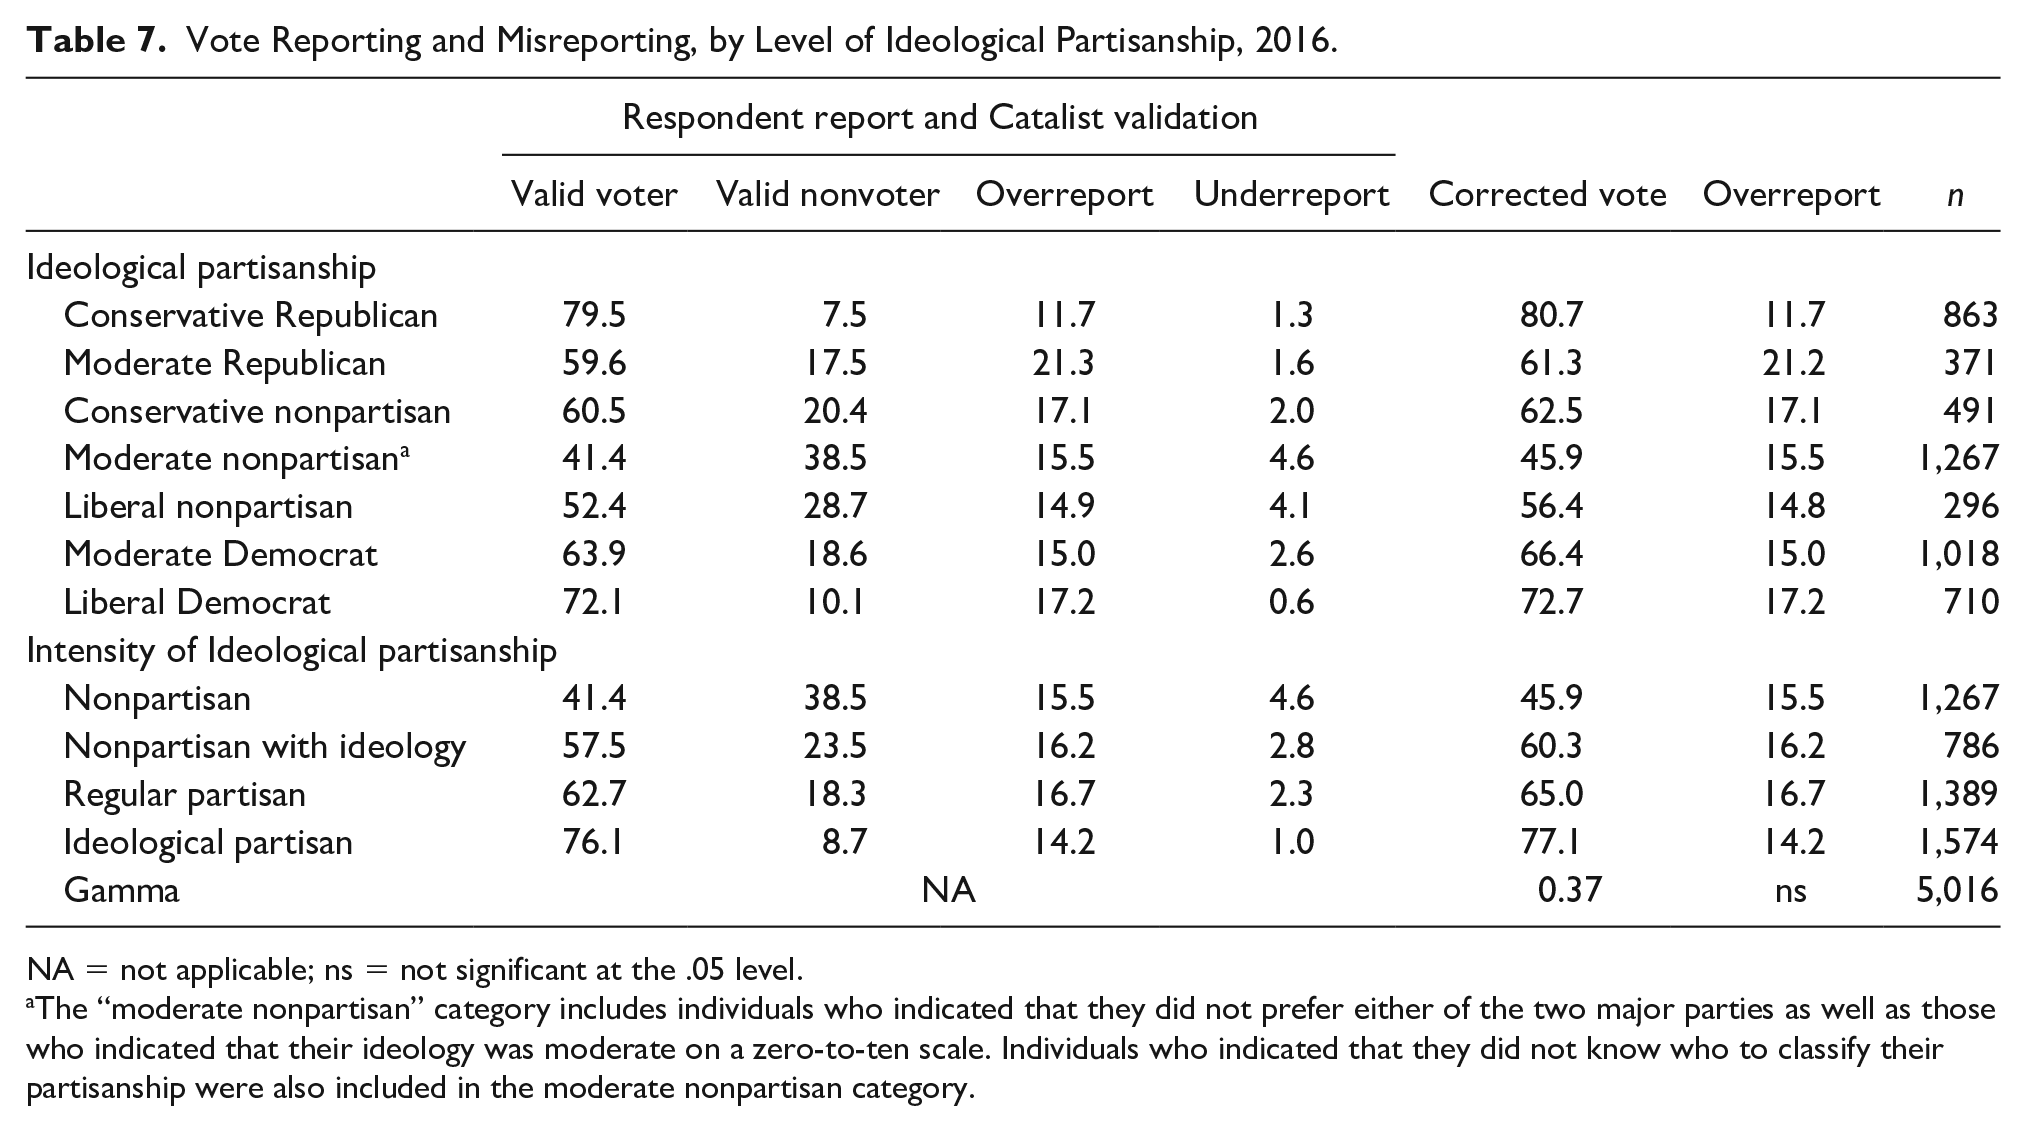
NA = not applicable; ns = not significant at the .05 level.
The “moderate nonpartisan” category includes individuals who indicated that they did not prefer either of the two major parties as well as those who indicated that their ideology was moderate on a zero-to-ten scale. Individuals who indicated that they did not know who to classify their partisanship were also included in the moderate nonpartisan category.
Following the logic used in our LSAL analysis, we fold the levels of ideological partisanship to create a measure of the intensity of ideological partisanship. The results indicate that the likelihood of overreporting did not differ significantly by the intensity of ideological partisanship (see Table 7). The relatively uniform pattern of overreporting across the levels of ideological intensity suggests that adults across the spectrum of ideological intensity are susceptible to a social expectation that they should have voted.
Each respondent lives within a state political ecosystem and the incentives for casting a vote may differ for citizens who live in a red state, a blue state, or a battleground state. Looking at the relationship between ideological partisanship and actual and reported vote behaviors in red states, blue states, and battleground states, the level of overreporting in 2016 was higher in red states than either blue states or battleground states (see Table S-7).
A Model of Overreporting in a National Cross-Sectional Study
The preceding analyses examined several potential explanations of overreporting of voting behavior by American adults in the AmeriSpeak surveys. Following the same analytic model used with the LSAL, we examine each of the factors discussed above using an SEM. Although the AmeriSpeak surveys are cross-sectional, an SEM takes advantage of our knowledge of the chronological and logical ordering of the variables in the analysis (see Figure 2). Unlike our longitudinal model in which age varied within a four-year window, the age of respondents in our cross-sectional samples ranges from 18 to 99.
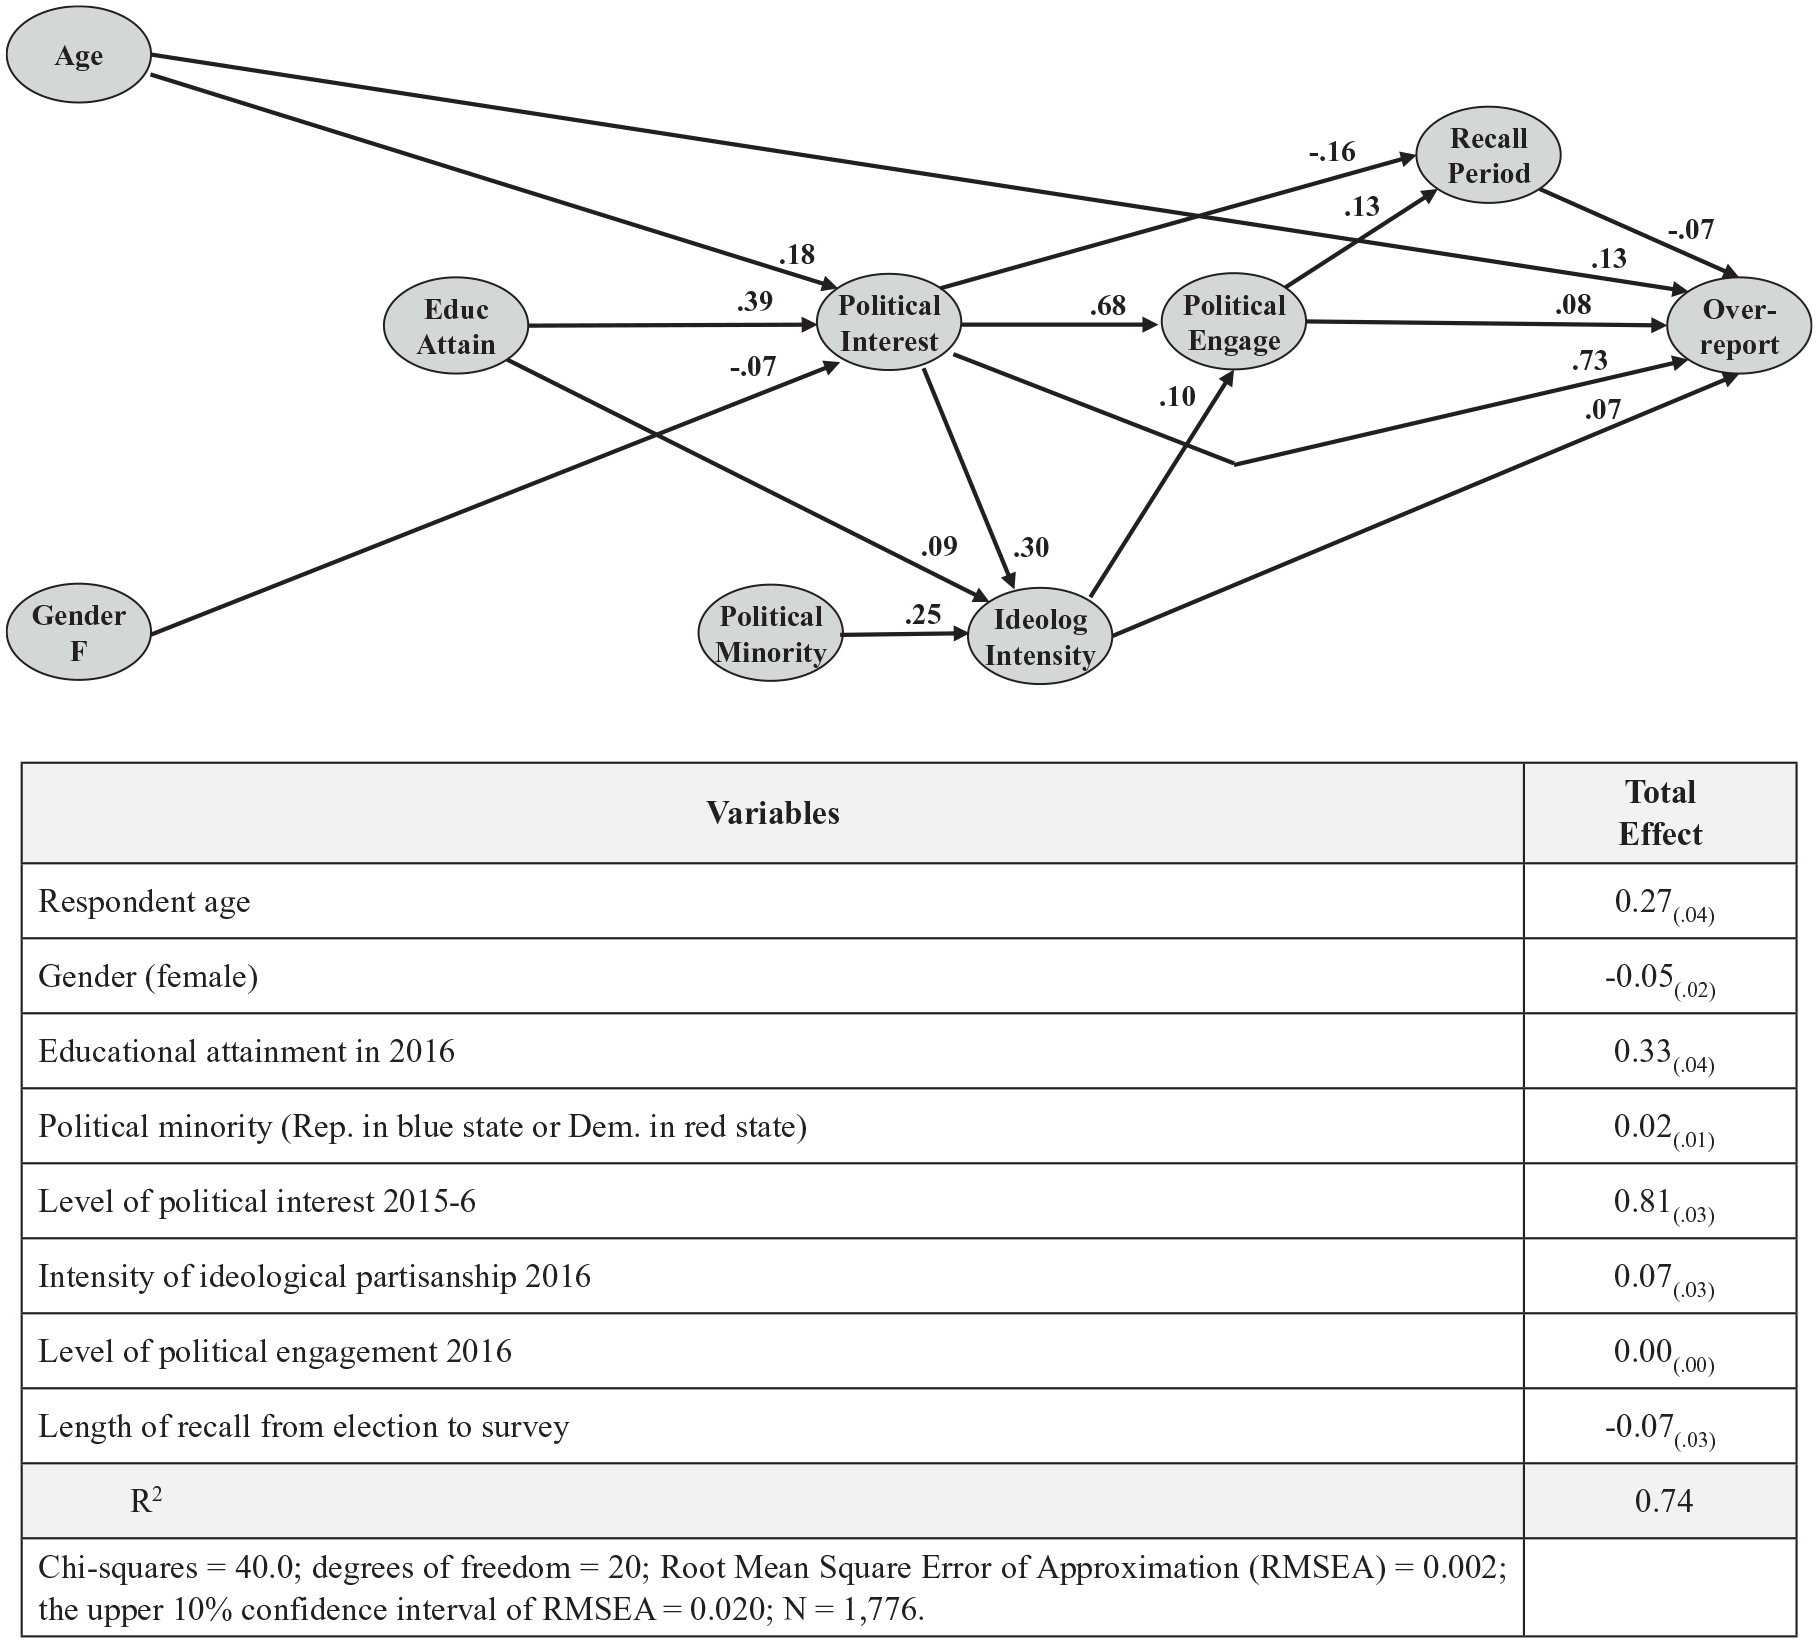
A model to predict overreporting among nonvoters, AmeriSpeak, 2016.
In this model, each respondent’s age and gender are treated as exogenous variables and are placed on the left side of the model. Age is grouped into a six-level categorical variable to minimize the impact of outliers. The model includes a six-level categorical measure of educational attainment in 2016. Reflecting our examination of political climate, the model includes a dichotomous indicator of whether each participant is a political minority in his or her state. Following the logic used in our LSAL analysis, this model includes a zero-to-ten scale of political interest, a four-level ordinal measure of the intensity of ideological partisanship, and a zero-to-ten scale of political engagement in 2016. Finally, reflecting the most proximate sources of possible influence on overreporting, the model includes a measure of the length of the period between the election and the completion of the survey. In contrast to our thirty-year longitudinal model, this cross-sectional model includes no measures of parental political socialization of respondents. 18
The results indicate that the best predictors of overreporting voting in 2016 were (1) a high level of interest in politics in 2016, (2) a higher level of educational attainment, and (3) age. The total effect of the level of political interest was 0.81 and the total effect of educational attainment was 0.33 (see Figure 2). This set of relationships suggest that some better-educated adults with a high level of interest in the 2016 presidential election did not vote, but felt that they should have voted in the election. When asked in a post-election survey about their 2016 voting behavior, these respondents claimed to have voted. Our earlier analysis of the impact of political socialization suggests that some of these adults may have adopted a social expectation that a good citizen ought to vote and are embarrassed to admit that they did not vote in 2016.
Older adults were significantly more likely to overreport voting than younger respondents (total effect = 0.27), holding constant other variables in the model (see Figure 2). This finding is consistent with the existing literature on age (Ansolabehere and Hersh 2012).
Second, respondent gender had a small negative influence on overreporting in both the longitudinal analysis (–0.04) and in the adult cross-sectional surveys (–0.05), indicating that men were slightly more likely to overreport than women, holding constant the other variables in the model (see Figures 1 and 2).
Third, political minority status was weakly related to overreporting in our earlier longitudinal analysis (0.08) and in the combined cross-sectional sample (0.02). Despite a growing level of scholarly attention to the political cultures of red states and blue states, this result provides no support for an impact of being a political minority in a state on overreporting.
Finally, the level of political interest was a significant predictor of overreporting in both the longitudinal and cross-sectional models, but the level of political engagement provided differential predictive power in only the longitudinal study (see Figures 1 and 2). An examination of the bivariate relationships between interest and engagement and overreporting in the longitudinal sample indicates that interest and overreporting was not related (at the 0.05 level) in the longitudinal sample, but engagement was significantly related to overreporting in the longitudinal sample (gamma = 0.12). When the effects of prior variables are held constant in an SEM, the total effect of interest on the prediction of overreporting was 0.43 and the total effect of political engagement on overreporting was 0.59 (see Table 4 and Figure 1). In contrast, the data from the AmeriSpeak cross-sectional samples found a positive bivariate relationship between political interest and overreporting (gamma = 0.17) and between political engagement and overreporting (gamma = 0.13). When prior variables are held constant in an SEM, the total effect of interest on overreporting was 0.81 and the total effect of engagement on overreporting was not significant at the .05 level (see Table 2 and Figure 2). These results suggest that the total effects of interest and engagement among the AmeriSpeak cross-sections were virtually identical, leaving no marginal influence from engagement beyond than shown by interest.
Discussion
Our first objective in this analysis is the measurement of the degree of misreporting of voting behavior in the 2016 presidential election comparing a thirty-year longitudinal study to a national cross-sectional survey. We found that 13 percent of participants in the thirty-year Longitudinal Study of American Life misreported their vote behavior, while 18 percent of respondents misreported their vote behavior in the 2016 presidential election in our cross-sectional samples. The AmeriSpeak overreport rate is similar to rates found in prior studies (Enamorado and Imai, 2018a). Surveys with this degree of error will be treated with skepticism by both the public and decision-makers.
Ansolabehere and Hersh (2012) called for renewed theory building regarding why respondents misreport, arguing that the scholarly community needs better explanations besides sociodemographic and political resources. The thirty-year record of the LSAL provides invaluable insights into the root of the problem. An SEM showed that parent education and parent political behaviors during an individual’s high school years produced a level of individual expectation about their future political behaviors as an adult. The role models provided by parents in their discussion of political matters and in their own political behaviors appear to foster a sense of a duty to vote that persists for several decades.
Although cross-sectional studies do not have the same wealth of information about early life exposures and expectations, our analysis of the AmeriSpeak cross-sectional data found similar patterns of overreporting by adults with higher levels of political interest and political engagement. Adults with a high level of interest in political events were more likely to be validated voters and overreporters. Both groups seem to accept the social expectation that good citizens should vote, but one group actually cast a vote and the other group did not vote but reported that they had voted.
An important observation in both analyses is the lack of a positive relationship between overreporting and recall period. Both surveys included data gathering months after the election. When looking at overreporting over this extended time period, there is no significant relationship between length of recall and overreporting in either the LSAL or the cross-sectional samples (see Table 2). These observations run counter to the expectations set in existing literature (Abelson, Loftus, and Greenwald 1992; Belli et al. 1999; Belli, Traugott, and Bechmann 2001).
Although the level of misreporting was lower in the three-decade longitudinal study, the levels of misreporting in both studies were inherently unacceptable for the conduct of meaningful social science analysis. Substantial corrections were made in both studies using supplemental voting data from Catalist. We concur with Ansolabehere and Hersh (2012) that all election studies should seek to validate respondent reports of voting, and we believe that this combination of longitudinal and cross-sectional data makes an even stronger argument for the routine validation of voting responses.
Supplemental Material
Online_Appendix_2 – Supplemental material for The Accuracy and Value of Voter Validation in National Surveys: Insights from Longitudinal and Cross-Sectional Studies
Supplemental material, Online_Appendix_2 for The Accuracy and Value of Voter Validation in National Surveys: Insights from Longitudinal and Cross-Sectional Studies by Jon D. Miller, Jason Kalmbach, Logan T. Woods and Claire Cepuran in Political Research Quarterly
Footnotes
Acknowledgements
Because of the length and complexity of our data sets, numerous individuals have provided useful advice, guidance, and assistance over a period of three decades. We can acknowledge our debt to only a limited number of individuals involved in more recent surveys, but we hope that the many others who have helped over the years will recognize our debt to them without explicit acknowledgment. For the data sets used in the analysis, we are grateful for the kind assistance of Mike Dennis and Stephanie Jwo (NORC/AmeriSpeak), Brad Lippmann (Catalist), and Wendy Mansfield and Poom Nukulkij (GfK Research). We are indebted to our Center for Political Studies colleagues who read early drafts of this article and offered invaluable advice—Mike Traugott, Vince Hutchings, Nick Valentino, and Ted Brader—and to the three anonymous reviewers from the Political Research Quarterly. We acknowledge the coding supervision work of Linda Kimmel and Evelyn Ventola (CPS). Finally, and not least, we are grateful for the 4,000+ LSAY/LSAL participants who have continued to share their life experiences over the last three decades and to the 5,000+ respondents who participated in the AmeriSpeak panel studies 2016 and 2017. Without willing respondents, there would be no survey research.
Declaration of Conflicting Interests
The author(s) declared no potential conflicts of interest with respect to the research, authorship, and/or publication of this article.
Funding
The author(s) disclosed receipt of the following financial support for the research, authorship, and/or publication of this article: Funding for the Longitudinal Study of American Youth (LSAY)/Longitudinal Study of American Life (LSAL) has been provided by the National Science Foundation (awards: MDR-8550085, REC96-27669, RED-9909569, REC-0337487, DUE-0525357, DUE-0712842, DUE-0856695, DRL-0917535, HRD-1348619) and the National Institute on Aging (award: 5R01AG049624-02). The 2016 and 2017 AmeriSpeak adult panel survey items were appended to a national survey funded by the National Aeronautics and Space Administration (cooperative agreement: NNX16AC66A) at no marginal cost to NASA as a part of a larger cooperative agreement.
Data Availability
All of the data used in this analysis are available through Harvard Dataverse at ![]() . The two larger data sets from which these variables were taken—the Longitudinal Study of American Life and the Integrated Science Attitude and Literacy Time Series—are both available through the Inter-university Consortium for Political and Social Research (ICPSR). The earlier years of the LSAL data set are currently available in the ICPSR and a completely updated version will be available in the summer of 2020. The full Integrated Science Attitude and Literacy data set is being processed by the ICPSR currently and should be available for users in the summer of 2020.
. The two larger data sets from which these variables were taken—the Longitudinal Study of American Life and the Integrated Science Attitude and Literacy Time Series—are both available through the Inter-university Consortium for Political and Social Research (ICPSR). The earlier years of the LSAL data set are currently available in the ICPSR and a completely updated version will be available in the summer of 2020. The full Integrated Science Attitude and Literacy data set is being processed by the ICPSR currently and should be available for users in the summer of 2020.
Notes
Supplemental Material
Supplemental and replication materials for this article are available with the manuscript on the Political Research Quarterly (PRQ) website.
References
Supplementary Material
Please find the following supplemental material available below.
For Open Access articles published under a Creative Commons License, all supplemental material carries the same license as the article it is associated with.
For non-Open Access articles published, all supplemental material carries a non-exclusive license, and permission requests for re-use of supplemental material or any part of supplemental material shall be sent directly to the copyright owner as specified in the copyright notice associated with the article.