
Abstract
This article examines the cyclical behavior of business (firm-financed) research-and-development (R&D) expenditure at the national level, using a panel of 64 countries spanning four decades. R&D is considerably more volatile than gross domestic product and tends to be procyclical. The author adopts the Hofstede framework to systematically investigate cross-national heterogeneity in comovement and volatility of R&D. Similar to prior studies, a higher R&D intensity (R&D expenditure/gross domestic product) is associated with countries that are more accepting of uncertainty, long-term oriented, and indulgent. Notably, R&D behaves less procyclically in countries that are more accepting of uncertainty, individualistic, long-term oriented, and indulgent, and it is less volatile in countries that are more masculine, individualistic, long-term oriented, and indulgent. That is, a culture with a higher propensity to invest in R&D tends to follow business cycles less closely (i.e., lower comovement) and have more persistent spending over time (i.e., lower volatility). Furthermore, higher comovement or volatility of R&D indeed harms national productivity and innovativeness. Therefore, this research broadens the understanding of the role national culture plays by demonstrating that (1) it considerably affects the cyclical behavior of R&D and (2) this cyclical behavior is another conduit through which culture influences economic performance.
Nations and private enterprises fund various research-and-development (R&D) activities. The role played by R&D in national prosperity cannot be overstated: effective management of R&D enables a nation to sustain economic growth and maintain a leadership position in the international community (Jain, Triandis, and Weick 2010). R&D is one of the most fundamental and strategic investment decisions made by top management because it drives profitability and competitiveness (Baker and Mueller 2002; Hartmann, Myers, and Rosenbloom 2006). Despite its strategic significance, R&D is often considered a discretionary budget to which managers make frequent (often myopic) changes according to executive cognitions and motivations and external conditions. R&D is vulnerable to cuts by managers burdened by pressure to achieve short-term earnings targets (Chakravarty and Grewal 2016). Firms’ R&D expenditures are also sensitive to general economic conditions and business cycles (Barlevy 2007).
This article examines the cyclical behavior of business (firm-financed) R&D expenditure. A central question is the cyclicality: Is R&D expenditure procyclical, acyclical, or countercyclical? In simple terms, a time-series is procyclical (countercyclical) if its cyclical fluctuations move in the same direction as (opposite direction to) those of the overall economy and acyclical if it is neither pro- nor countercyclical. Although some prior studies document rewards from countercyclical R&D during recessions (Steenkamp and Fang 2011), the reality appears to be the opposite for most companies. In response to financial distress and psychological anxiety, firms would emphasize cost reduction, limit new strategic initiatives, reduce risk taking, and behave conservatively (Chen and Miller 2007). Confronted by recessions, many executives swing into crisis mode, postponing new investments in R&D or cutting back on existing R&D activities (Gulati, Nohria, and Wohlgezogen 2010). Mounting empirical evidence in economics points to procyclical R&D expenditure (e.g., Barlevy 2007; Ouyang 2011; Rafferty 2003; Walde and Woitek 2004): business R&D expenditure tends to increase (decrease) as the economy expands (contracts).
Unfortunately, studies on the cyclical behavior of R&D are scant at the national level, and a small body of cross-national research has addressed predominantly a few developed countries (e.g., Walde and Woitek 2004). As such, extant empirical evidence is far from sufficient to enable researchers and practitioners to draw any meaningful international inferences outside a few advanced markets. I fill this gap by analyzing a large longitudinal data set of aggregate business R&D expenditure that comprises major economies worldwide. Thus, this article’s first contribution to the international marketing literature is to advance empirical generalizations on the cyclical behavior of R&D. More importantly, I systematically explore national differences: Why is R&D more or less procyclical or volatile in some countries than others? Certainly, firms in different markets are placed under diverse economic and institutional conditions. Long-term investments, such as R&D, are affected by the extent of the financial market’s development (e.g., availability of credit, liquid liability, stock market capitalization; Aghion et al. 2010). In contrast, upper echelons theory posits that managerial choices mirror executives’ cognitive base and values (Hambrick and Mason 1984). Decisions reflect executives’ selective filtering and interpretation of available stimuli through the idiosyncratic lens of their beliefs, assumptions, and preferences (Geletkanycz 1997). Because R&D outcomes are highly uncertain and payoffs are realized over a long time horizon, behavioral aspects become more salient and pronounced when managers make cyclical or temporal adjustments to their R&D spending. Although executives are unique individuals, they are socialized to the value orientations of their own cultural heritage. Thus, cyclical changes in R&D expenditures, when aggregated, should reflect their common cultural norms, attitudes, and values—the collective “mental programming.” That is, national culture must sway executives’ beliefs about what constitutes a legitimate and appropriate adjustment to their discretionary expenditures in response to economic fluctuations (Geletkanycz 1997; Lewellyn and Bao 2015). My second novel contribution to the literature is to theorize how national culture motivates firms in different countries to adjust their R&D expenditures differently over business cycles and to substantiate that this behavioral commonality manifests at the aggregate series: culture matters for the cyclical behavior of R&D. No prior studies have addressed this question.
This study is positioned uniquely in the cross-cultural and international marketing literature, as it moves beyond R&D intensity—R&D expenditure as a share of gross domestic product (GDP)—which has been the primary measure of interest. I appraise two novel measures of R&D’s cyclical behavior: comovement and cyclical volatility. Both academics and practitioners have long acknowledged this cyclical or time-varying aspect of firm R&D expense. R&D budgets are frequently adjusted and adapted by broad gauges (e.g., past sales) to fit within corporate financial boundaries and their interaction with the macroeconomic environment (Brockhoff and Pearson 1998; Hartmann, Myers, and Rosenbloom 2006). Research investigating the behavioral theory of the firm has shown that R&D intensity within the firm varies over time in response to performance feedback and situational factors (e.g., Chen and Miller 2007; Greve 2003; O’Brien and David 2014). However, this time-varying aspect of R&D expenditure has been largely ignored in the extant research on the relation between culture and national innovation. My novel finding is that these dynamics indeed impact national productivity and innovativeness. Thus, my third, and last, contribution is to establish the cyclical behavior of R&D as yet another mechanism for culture’s effect on economic performance.
To summarize, my contributions are threefold. First, while there is a large body of economic studies on the cyclicality of R&D, they are limited in geographic scope, and as a result, scholars and practitioners lack sufficient empirical evidence by which they comprehend idiosyncratic R&D responses to business cycles in diverse international marketplaces. I fill this gap by analyzing a large international panel and advancing much-needed empirical generalizations across the globe. Multinational corporations (MNCs) can also benefit from these empirical findings while establishing global benchmarks for competitive R&D presence and cyclical adjustments, as they strive to preserve parity with their competitors in diverse international marketplaces. I find that R&D expenditure tends to be procyclical but not highly elastic. Second, this study integrates the economics and cross-cultural approaches to systematically investigate cross-national heterogeneity in the cyclical behavior of R&D expenditure. Whereas economic studies stress financial and formal institutional variables to account for potential heterogeneity, cross-cultural and international marketing studies have long recognized and demonstrated the influence of national culture over innovation, though the latter have ignored the cyclical behavior of R&D. I theorize how national culture may influence managers in different markets in their adjustment of R&D expenditures over the business cycle, and I substantiate that culture indeed shapes the cyclical behavior of R&D. Third, unlike typical cross-cultural studies, this study explicitly accounts for the cyclical behavior of R&D and establishes that this cyclical behavior affects national productivity and innovativeness. Thus, cultural effects are more far-reaching than conventionally thought because culture influences economic performance on multiple routes.
The article proceeds as follows. I first propose three constructs that may mediate the effects of national culture on the cyclical behavior of R&D. Then, I theorize potential connections between national culture and the mediators to develop hypotheses on the directions of cultural effects. Next, I present the empirical methodology and describe my data. Country-level estimates of comovement are meta-analyzed to derive mean effects. Subsequently, I test the research hypotheses. Theoretical and managerial implications are discussed. Finally, I conclude the article with limitations and directions for future research.
Theoretical Framework
Cyclical Behavior of R&D Expenditure
R&D is a critical innovation input and a major source of economic growth. R&D expenditure reflects the intensity of investment in potentially useful innovation activities, but not the outcome (e.g., new scientific or technological knowledge) or commercial value of such activities. This study focuses on R&D expenditure, as entities can directly control their investment level. Economists have probed how R&D expenditures evolve in relation to business-cycle fluctuations. Following Deleersnyder et al. (2004), I examine two constructs for the cyclical behavior of R&D: comovement and cyclical volatility. Comovement is an empirical regularity; most sectors and indicators of the economy move up and down together in patterns (Christiano and Fitzgerald 1998; Stock and Watson 1999). I use GDP as a proxy for the national economy as a whole with the aim of investigating comovement between aggregate business R&D expenditure and GDP. 1 Fluctuations in aggregate output are at the core of the business cycle, so the cyclical component of GDP is a useful proxy for the overall business cycle (Stock and Watson 1999). Cyclical volatility, akin to volatility of returns in finance, captures the degree of variation of cyclical fluctuations around the trend.
A central question regarding comovement is whether R&D expenditure is procyclical or countercyclical. An economic time series is procyclical (countercyclical) if its cyclical components—deviations from the long-term trend—are positively (negatively) related to those of GDP. There are two fundamental economic arguments. The cash flow argument posits that the predominant source of firm R&D is internal funds—which tend to be procyclical—and thus cash-intensive investments such as R&D should be procyclical. In contrast, the opportunity cost argument hinges on intertemporal substitution between direct production activities and productivity-enhancing activities. Because the opportunity cost of production is lower (higher) during contractions (expansions) due to lower (higher) demand, firms will organize more (less) R&D at bad (good) times. Most single-country studies have shown that firm- or industry-level R&D is procyclical.
Whereas comovement captures cyclical fluctuations of one series relative to those of another, cyclical volatility addresses only the overall size of cyclical up- and downswings in the series at business-cycle frequencies, with no such reference. Roughly speaking, it quantifies the extent of instability in R&D expenditure over time around its own growth path: the higher it is, the more variable its cyclical components. It reflects univariate cyclical fluctuations and, as such, does not express the timing of their occurrence or how they are in sync with cyclical movements of other series. Thus, large cyclical swings may be either procyclical or countercyclical with respect to the overall economic activity (Deleersnyder et al. 2004). This renders the two constructs distinct and complementary. However, cyclical ups and downs of one series may occur in large measure due to business-cycle comovement (i.e., macroeconomic conditions are a major source of over-time variability), as in the case for procyclical R&D, evidenced by prior studies. If so, high (low) comovement can translate into high (low) cyclical volatility, though the opposite is not necessarily true (again if cyclical fluctuations of R&D do not coincide with those of GDP). Accordingly, a factor leading to high (low) comovement tends to engender high (low) cyclical volatility. To wit, an R&D investment that is more (less) sensitive to business cycles is likely to exhibit higher (lower) cyclical volatility or more (less) temporal variation.
In subsequent sections, I conceptualize three mediators that may influence these two R&D measures: (1) tolerance for temporal variability due to period-to-period changes in the R&D spending level, (2) susceptibility to pressures for short-term financial results, and (3) herd behavior. Next, based on theorizing for how national culture may relate to these mediators, I formulate hypotheses for cultural effects on comovement and cyclical volatility. Figure 1 depicts my theoretical framework.

Theoretical framework.
Tolerance for Temporal Variability
Fundamentally, managers have two options for the level of R&D resources. One is to preserve persistence in the R&D funding level, minimizing temporal variation and maximizing the stability of R&D activities; the other is to modify the R&D budget frequently, facilitating rapid adaptation to changing external threats and opportunities. Variability in the R&D funding level implies that the R&D organization must adapt constantly to new budgets. Such constant adaptation may work against R&D productivity because of an extended gestation period for new resources and staff added as well as an immediate interruption in the knowledge flow caused by spending cuts. This bears little resemblance to other marketing instruments, such as advertising and promotion, which can shrink and stretch without inflicting much interruption in organizational capabilities. In contrast, Pennetier, Girotra, and Mihm (2019) argue that because uncertainty is at the heart of firms’ innovative activities, the best response to the fast-changing technological environment may be quick reaction and adaptation (e.g., quick entries into new fields as they emerge), which in turn requires a more flexible R&D budget.
Although R&D managers must favor stability in R&D budgets, because alternating ups and downs in R&D resources ultimately disrupt the development and maintenance of key skill areas and core competencies (Brockhoff and Pearson 1998), their desires may not be fully reflected in the budgets due to the heavily top-down nature of R&D budgeting process. In addition, firms that face idiosyncratic financial constraints and cash reservoir may develop diverse aptitudes for R&D stability. Executive tolerance for spending variability in R&D makes it easier to justify immediate cuts during harsh economic times and quick rebounds during favorable times, leading to more cyclical and volatile R&D expenditures. However, a preference for persistent R&D funding, due to costly temporal adjustments, encourages managers to buffer the effects of economic conditions for as smooth an allocation as they can possibly secure, thus leading to less cyclical and volatile R&D trajectories.
Susceptibility to Short-Term Pressures
R&D expenditure makes an easy target for earnings management under pressure to meet the expectations of financial markets because, in many countries, R&D outlay is expensed immediately rather than capitalized over time (see, e.g., the U.S. generally accepted accounting principles). It should be noted that a firm’s R&D portfolio comprises heterogeneous projects differentiated by uncertainty, risk, and profit horizon. These include basic research, applied research, and development; radical versus incremental innovations; and projects that are longer versus shorter term. Firms may substitute among different kinds of R&D projects in response to internal and external pressures: funding may be cut or eliminated for projects with higher uncertainty and longer time-to-market results during recessions. One trend that has contributed to short-term-oriented R&D with nearer-term profit concerns is decentralization of R&D in large MNCs (Knott 2017). Knott (2017) argues that when business units control their own R&D budgets and are compensated for short-term results, they typically cut R&D to pursue investments with shorter-term payoff and lower risk. A similar claim can be made about the effect of the business cycle: the liquidity squeeze in a recession likely alters the composition of R&D, reducing the allocation to basic research (Brockhoff and Pearson 1998).
Moreover, when setting R&D budgets, many firms are relying on rules of thumb in which the firm’s historical R&D intensity is multiplied by the prior year’s revenues or projected revenues to derive the upcoming R&D budget. This approach treats R&D as a discretionary expense rather than an investment and lets R&D budgets be driven by, rather than drive, revenue and profit growth, which rest, to a large extent, on business cycles (Knott 2017). To the extent that managers consider R&D an expense item that can be cut or postponed to lift this period’s earnings, R&D is very likely to exhibit strong cyclical behavior (i.e., high comovement and cyclical volatility). Conversely, insofar as managers are less susceptible to short-term performance pressures and view R&D as a driver of long-term value creation, the R&D budget is unlikely to be driven by rules of thumb, motivation to follow industry benchmarks, or macroeconomic swings. As a result, R&D spending is expected to be smooth over time (i.e., low comovement and cyclical volatility).
Herd Behavior
In their study of national advertising, Deleersnyder et al. (2009) argue that advertising managers’ herd mentality mediates the effects of national culture on advertising’s cyclical sensitivity to business cycles. I extend their logic to explicate how herd behavior may affect the cyclical behavior of R&D expenditure. Herd behavior or herding revolves around social influence or pressure on individual judgments. It is defined as the alignment of thoughts or behaviors of individuals in a group without centralized coordination (Raafat, Chater, and Frith 2009). On the one hand, herding is an outcome of docility or receptivity to social norms. As a major basis of choice, people depend on others’ suggestions, recommendations, and information obtained through social channels; social norms and mutually shared expectations inform us about what action is normal, fair, and appropriate in a given social situation (Kameda and Hastie 2015). Conventional wisdom has it that firms decrease and increase spending during economic downturns and upturns, respectively. Strong conformity induces people to self-censor their actions so as not to stand out (or for fear of stating a contrarian opinion), such that managers will follow the majority view and tie their R&D expenditures closely to economic ups and downs. On the other hand, herding can also be rational or intelligent. Standing up to tell otherwise is risky given the possibility (however remote) that the others are right or that there must be a good reason why lots of people do or believe something (Kameda and Hastie 2015; Surowiecki 2005). Herding may well be a safer tool for risk-averse agents in approaching difficult and unfamiliar problems (Thaler and Sunstein 2008) or conducting costly information search (Deleersnyder et al. 2009).
Business cycles represent highly idiosyncratic, unpredictable, and complex situations, under which sticking with the crowd and “failing small” (i.e., procyclical strategy), rather than striving to innovate and run the risk of “failing big” (i.e., countercyclical strategy), makes both emotional and professional sense (Surowiecki 2005). Surowiecki (2005) argues that certain conditions could make this group process less defective or break a negative information cascade: namely, diversity (heterogeneity) of opinions and the existence of independent and overconfident decision makers. In societies that are loose, appreciate autonomy, and praise liberty to act on one’s own will, managers have weaker pressure or incentives to follow the crowd, and their R&D decisions tend to follow the business cycle less closely. In societies where rules and norms are tightly enforced and people are discouraged from contesting the general consensus, R&D decisions are liable to follow the business cycle more closely, exhibiting strong cyclical behavior. Societies vary in their aptitudes for bearing risk and uncertainty: risk aversion should lead to herding, thereby exhibiting strong cyclical behavior. Societies also differ by how they socialize people to boost their egos and promote assertive behavior: overconfident people are less likely to get stuck in a negative cascade and, under the right circumstances, can even break cascades (Surowiecki 2005). Then, overconfident agents are less sold on conventional wisdom of procyclical business cycle management.
Research Hypotheses
National culture can explicate differences among countries in R&D’s cyclical behavior, as it is a common frame of reference whereby members of a society view and respond to the external environment. Cultural norms and views press managers to align their individual-level assumptions and preferences with those of their native culture, and differing views and assumptions embedded in national culture are reflected in managerial actions (Geletkanycz 1997). I operationalize national culture using Hofstede’s dimensions (Hofstede, Hofstede, and Minkov 2010). Hofstede’s framework is particularly relevant to my purpose, because it conceptualizes culture as what shapes differences in the collective thinking of groups (Gupta, Pansari, and Kumar 2018). Geletkanycz (1997) holds that the framework describes value differences that are theoretically relevant to executives’ mindsets and reactions: its dimensions reflect enduring themes to executive leadership and strategic decision making and address assumptions and preferences pertinent to environmental adaptation. Similarly, Deleersnyder et al. (2009) argue that Hofstede’s dimensions constitute the fundamental value orientation that underlies differences in managerial practices, organizational patterns, and decision making and demonstrate relevance of some dimensions to advertising’s sensitivity to business cycles. Table 1 provides a brief review of select recent studies to point out unique research opportunities addressed by the current study. 2
Select Literature Review on Hofstede’s Dimensions and R&D.

a The Group of Seven (i.e., Canada, France, Germany, Italy, Japan, the United Kingdom, and the United States).
Notes: All studies use annual data. Level = the level of entity aggregation. NoC = the number of countries covered; NoF = the number of firms included; PD = power distance; UA = uncertainty avoidance; MA = masculinity; ID = individualism; LT = long-term orientation; IG = indulgence; + and – = significantly positive or negative relationship, respectively; 0 = not significant; N.A. = not applicable.
Power Distance
Power distance is the extent to which members of a society accept that power is distributed unequally (Hofstede, Hofstede, and Minkov 2010). In high-power-distance cultures, organizations centralize power in a few hands, there is considerable dependence of subordinates on superiors, and subordinates are unlikely to approach and contradict their bosses (Hofstede, Hofstede, and Minkov 2010). High power distance is associated with autocratic decision making, vertical communication, and tight top-down controls (Jones and Davis 2000; Shane 1993), so decisions are made with no or little consultation with subordinates. In low-power-distance societies, the superior–subordinate relationship is more participative and egalitarian such that bosses are more likely to delegate decision-making power (Bukowski and Rudnicki 2019). The stratification, stiff organizational structure and hierarchy, and centralized decision making in high-power-distance cultures hinder employee participation in R&D budgeting processes and minimize inputs from actual researchers at lower levels of the corporate hierarchy. Lower-ranking employees have fewer opportunities to voice their concerns; thus, an R&D budget process is subject to less internal negotiation and goes through fewer iterations in high-power-distance societies (Brockhoff and Pearson 1998). This tends to make it easier for executives to drive the logic of corporate financial boundaries for determining R&D budgets and to justify frequent adjustments, thereby raising executive tolerance for temporal variability in R&D spending.
In addition, high power distance promotes conformity rather than independence (Taras, Kirkman, and Steel 2010). Conformity prevails throughout a high-power-distance society because power distance is associated positively with cultural “tightness”—the degree to which values, norms, and behaviors are homogeneous within the population—which parallels conformity (Uz 2015). Hofstede, Hofstede, and Minkov (2010) argue that being a conformist means doing what is socially correct, accepted, and proper and following regulations closely rather than demanding the freedom to make one’s own decisions and the ability to do things one’s own way. The prevalence of conformity as a guiding principle renders managers in high-power-distance countries more susceptible to herd mentality. Thus, power distance will raise comovement and cyclical volatility.
Uncertainty Avoidance
Hofstede, Hofstede, and Minkov (2010) define uncertainty avoidance as the extent to which members of a culture feel threatened by ambiguous or unknown situations. Low-uncertainty-avoidance societies are more willing to enter into unknown ventures and more tolerant of different concepts and approaches (Geletkanycz 1997; Hofstede 2001). Economic swings, particularly recessions, heighten ambiguity and uncertainty of corporate actions. R&D investments are highly ambiguous and have uncertain payoffs, and are thus very risky in general (Lewellyn and Bao 2015). Business-cycle fluctuations make it much more difficult to forecast the outcome and payoffs of an R&D project, aggravating or amplifying an already high level of uncertainty and risk regarding R&D. A large body of literature shows the negative relationship between corporate risk taking and uncertainty avoidance (e.g., Li et al. 2013). Executives in low-uncertainty-avoidance cultures are motivated by “hope of success” as opposed to “fear of failure” (Hofstede 2001); they are less averse to novelty and more open to experimentation with new or untested initiatives (Hambrick and Brandon 1988). Conversely, executives in high-uncertainty-avoidance cultures may take a defensive stance; they are more prevention-focused and concerned with safety and security while striving to avoid bad outcomes (Gulati, Nohria, and Wohlgezogen 2010). Then, herding could be a “better safe than sorry” tactic because managers can hardly be blamed if they act in the same way as others (Deleersnyder et al. 2009). Therefore, I hypothesize that uncertainty avoidance is positively related to comovement and cyclical volatility.
Masculinity–Femininity
Whereas feminine cultures are cooperation-oriented and stress modesty, tenderness, and concern with the quality of life, masculine cultures are performance-oriented and emphasize assertiveness, competitiveness, achievement, and material success (Hofstede, Hofstede, and Minkov 2010). I contend that masculinity tends to temper herd behavior. First, masculine societies favor individual and independent decision making. This leads to a weaker drive for herding than in feminine societies, where consensus decisions are sought after more. Second, masculine cultures are ego-oriented and socialize young people to boost their egos (Hofstede, Hofstede, and Minkov 2010). There is empirical evidence that people overrate their own competencies in highly masculine societies (Lasch 1991; Organisation for Economic Co-operation and Development [OECD] 1995). Chatterjee and Hambrick (2011) argue that managers take, or refrain from taking, actions partly based on their confidence in themselves. This (over)confidence causes managers to engage in more risk taking than is objectively sensible (e.g., Malmendier and Tate 2015; Simon and Houghton 2003). Overconfidence is most pronounced in innovation policies, because innovation decisions tend to be so complex and idiosyncratic that managers cannot just rely on facts and figures; managers’ risk attitudes heavily affect corporate R&D (Zavertiaeva, Lopez-Iturriaga, and Kuminova 2018). Confidence may color a management interpretation of the riskiness of the current situation and convince managers that their personal talents, along with their organizational capabilities, can affect whether their risky initiatives will come to fruition (Chatterjee and Hambrick 2011; Sitkin and Weingart 1995). Such managers are inclined to defy conventional wisdom due to a sense of exceptionalism and superiority. Indeed, Surowiecki (2005) suggests that the presence of independent and overconfident decision makers helps break information cascades. Consequently, masculinity will reduce comovement and cyclical volatility.
Individualism–Collectivism
Collectivism pertains to societies in which people are integrated into strong, cohesive in-groups, whereas individualism pertains to societies in which the ties between individuals are loose (Hofstede, Hofstede, and Minkov 2010). Individualism promotes innovation by emphasizing individual achievements, independence, nonconformity, freedom to make decisions, and self-actualization (Bukowski and Rudnicki 2019). In contrast, characteristics of collectivism, such as limited personal autonomy for decision making and individual aspirations and initiatives subordinate to the group, may be detrimental to innovation (Jones and Davis 2000). Collectivistic cultures stress conformity and discourage unilateral actions that may disrupt consensus and established ways (Hofstede 2001). Conversely, managers of individualistic cultures are less susceptible to group norms or consensus. This leads to the expectation that collectivistic cultures foster more herd behavior compared with their individualistic counterparts.
Individualism is oriented to growth and nurtures personal traits that accompany entrepreneurship, inventiveness, and innovativeness (Shane 1993). As individualistic managers place a higher value on individual accomplishments, they are eager to rely on their own judgments and assume more risk taking in the hope of earning a large strategic payoff (Kreiser et al. 2010). For these reasons, I postulate that individualism reduces comovement and cyclical volatility. One may argue that organizational performance is more strongly attributed to executive leadership in individualistic societies (Jackofsky and Slocum 1988). If so, managers may be wary of rather unconventional or drastic actions because their personal reputation and even job security is at stake. R&D projects typically span several years, however; a success or failure cannot be attributed immediately, unlike advertising and promotion decisions. Thus, dedicated managers can develop a vested interest in pushing ahead with their R&D projects.
Long-Term Orientation
Long-term-oriented societies cultivate virtues oriented toward future rewards, whereas short-term-oriented societies cultivate virtues related to the past and present (Hofstede, Hofstede, and Minkov 2010). The central values in long-termism, such as perseverance, hard work, and savings, tend to be more supportive of innovation (Jones and Davis 2000). It takes time for R&D efforts to bear fruit, and thus managers need to remain steadfast and patient. Because the benefits of R&D are distant and uncertain, long-term-oriented cultures are more intrinsically positive toward futuristic investments (Lewellyn and Bao 2015). Long-termism is characterized by tenacity in the pursuit of whatever goals one sets and sustained efforts toward slow results; corporations in long-term-oriented societies value investing in the future at the expense of immediate results, and managers are allowed time and resources to make their own contribution (Hofstede, Hofstede, and Minkov 2010). Short-term failures tend to be more readily tolerated, and concerns tend to be less about R&D leading to temporary performance shortfalls (Lewellyn and Bao 2015). Thus, managers are less inclined to let business-cycle fluctuations dictate their decisions on R&D; similarly, financial distress caused by unfavorable demand conditions may not discourage experimentation with R&D so much.
In short-term-oriented cultures, in contrast, managers are judged by control systems that focus on immediate results and the bottom line (Hofstede, Hofstede, and Minkov 2010). Under enormous pressure to achieve this month, quarter, or year’s results, organizations in short-term-oriented countries are prone to react to financial distress at bad economic times by emphasizing cost reductions, limiting new strategic initiatives, reducing risk taking, and behaving conservatively (Chen and Miller 2007). Thus, short-termism tolerates temporal variability in R&D and raises pressure for immediate financial results: it encourages managers to view R&D as a discretionary expense that can be cut and added quickly and easily in response to internal constraints and external market developments. Accordingly, long-term orientation is negatively related to comovement and cyclical volatility.
Indulgence–Restraint
Indulgent societies allow for relatively free gratification of basic and natural human desires related to enjoying life and having fun, whereas restraint societies curb such gratification and regulate it by strict social norms (Hofstede, Hofstede, and Minkov 2010). Bukowski and Rudnicki (2019) maintain that indulgence promotes emotional autonomy and stimulates a greater demand for design innovations. Choi (2020) argues that indulgence is a prerequisite for creativity, venturing, and risky investments. An extensive body of research has validated that R&D decisions are influenced by managers’ cognition and interpretation of their decision environments (e.g., Chen and Miller 2007; Lewellyn and Bao 2015; O’Brien and David 2014). People in more indulgent societies are more optimistic about the future in general (Pew Research Center 2007). Optimism may affect managers when they cope with high risk and uncertainty, which are inherent to R&D decisions. Optimistic managers see the bright side of an uncertain or unknown situation, withstand temporary setbacks, and remain confident and resolute in pursuit of a goal. Optimism may also shape perceptions of an economic change, the riskiness of the change, and the extent to which firms frame recessions as threats or opportunities (Latham and Braun 2011). Thus, indulgence alleviates susceptibility to pressure for short-term results. Moreover, indulgent societies are culturally loose: norms are expressed with a wide range of alternative channels, and deviant behaviors are easily tolerated (Hofstede, Hofstede, and Minkov 2010; Uz 2015). This cultural looseness reduces self-censorship (a practice to avoid violating social norms) and encourages experimentation with ideas antithetical to such norms and mutual expectations, thereby hampering herd behavior. Taken together, indulgent cultures tolerate R&D decisions that are less procyclical and less cyclically volatile.
Cyclical Behavior of R&D and Economic Performance
Finally, I ask whether the cyclical behavior of R&D is consequential—in other words, does comovement or cyclical volatility actually affect economic performance? If not, while the hypothesized cultural effects are theoretically intriguing in and of themselves, their real-world implications are quite limited. Unlike R&D intensity, there is a dearth of studies on the consequences of the cyclical behavior of R&D in the literature. High comovement or cyclical volatility tends to yield frequent, large fluctuations that are synchronized with the overall economy, and such fluctuations in R&D resources should disrupt the development and maintenance of key skill areas and core competencies and diminish the productivity of R&D spending (Brockhoff and Pearson 1998; Pennetier, Girotra, and Mihm 2019). Strong cyclical behavior of R&D may also signify that the firm rebalances the R&D portfolio by placing greater emphasis on immediate profits and short-term results; it appears that in response to economic hardship, many companies cut basic research or longer-term fundamental research with high risk, which aims at opening up new future opportunities and spurring long-term productivity and technological innovation. Therefore, comovement and cyclical volatility must be negatively associated with economic performance.
Methodology
My empirical methodology follows sequential steps. The first step is to extract the cyclical components of R&D expenditure and GDP by the Hodrick–Prescott (HP) high-pass filter (Hodrick and Prescott 1997). The HP filter can be cast explicitly as a linear state-space model, namely, the local linear trend model:


where t denotes year,
At the second step, I follow the economics literature to compute growth and volatility metrics (e.g., Aghion et al. 2010; Stock and Watson 1999). The mean growth and volatility are defined as
The third step is to estimate comovement between cyclical components. I run the following dynamic regression separately for each country (Deleersnyder et al. 2004):

where
The last step is to regress
Data
I use annual country-level data from Euromonitor Passport. The information on total national R&D expenditure is available from 1977 to 2017 (max T = 41 years). Passport also records business and government R&D funds as percentages of the total expenditure, from which I construct business and government R&D expenditures. I limit my analysis to 64 countries that have at least 17 years of observations on business R&D expenditure (total 1,685 observations). This cutoff for annual data has been used previously (e.g., Deleersnyder et al. 2004, 2009). The minimum, mean, and maximum lengths of the business R&D series are 17, 26, and 41, respectively. For total R&D, I retain 87 countries using the same cutoff value. The sample for business R&D is a proper subset of that for total R&D. Passport has GDP data available for the same period as the total R&D series. Both R&D and GDP series are denominated in local currency (constant 2017 price). According to Passport’s own regional classification, the sample includes 16 countries from Asia Pacific (including Australia and New Zealand), 14 from Eastern Europe, 8 from Latin America (including Mexico), 4 from the Middle East/Africa, 20 from Western Europe, and 2 from North America. It covers a large number of major developed and emerging economies and accounts for 99% of the world’s R&D spending and 91% of the world’s GDP in 2017 (using Passport figures and at the 2017 exchange rate).
Hofstede scores are compiled from Hofstede, Hofstede, and Minkov (2010). Several controls are included for the economic context. I include stock market capitalization (STOCKM) and the value of credit extended to the private sector by banks (CREDIT), both real and as a share of GDP (Aghion et al. 2010). The country’s wealth is proxied by real per capita income (INCOME) converted into U.S. dollars at the 2017 exchange rate. The salience or intensity of R&D in the economy is measured by the ratio of business R&D expenditure to GDP (INTENSITY). All controls are country-specific means over the sample period. Finally, I subtract total R&D expenditure from GDP at each country-year observation to mitigate “correlation by construction,” though the R&D shares tend to be small. Web Appendix A provides more details on data sources, measurement, and computational procedures.
Meta-Analysis of Comovement Elasticities
To save space, I place the country-level estimates and descriptive statistics in Web Appendix A and focus on the results for comovement elasticity. There is considerable cross-country heterogeneity in
Summary of Comovement Elasticities.

*p < .10.
**p < .05.
***p < .01.
a Indicates the number of
b Indicates the number of the countries whose respective coefficients are significantly different from zero (p < .05).
Notes: LB = 95% confidence interval lower bound; UB = 95% confidence interval upper bound. Cochran’s Q statistic tests the null of a common mean (effect size) across study units. I 2 = the proportion of total variance attributed to heterogeneity rather than chance.
Hypothesis Testing
Descriptive Statistics of Predictors
Table 3 presents basic statistics of the predictors used in regression. Most correlations among Hofstede’s values are insignificant or below .6, except one between power distance and individualism. INCOME correlates negatively with power distance and uncertainty avoidance, but positively with individualism, long-term orientation, STOCKM, INTENSITY, and CREDIT. STOCKM is related negatively to uncertainty avoidance but positively to CREDIT. INTENSITY correlates negatively with power distance but positively with individualism, long-term orientation, and CREDIT. CREDIT is associated negatively with power distance and uncertainty avoidance but positively with long-term orientation. Except INCOME, the control variables seem to correlate only weakly to moderately with Hofstede’s values. Most correlations are low to moderate, and only four pairs have correlations exceeding ±.60. Variance inflation factors are in an acceptable range (see Web Appendix A). Thus, collinearity does not pose a serious threat to regression. 3
Descriptive Statistics and Correlations of Predictors.

*p < .10.
**p < .05.
***p < .01.
Notes: Hofstede’s variables are divided by 100.
National Culture and R&D Intensity
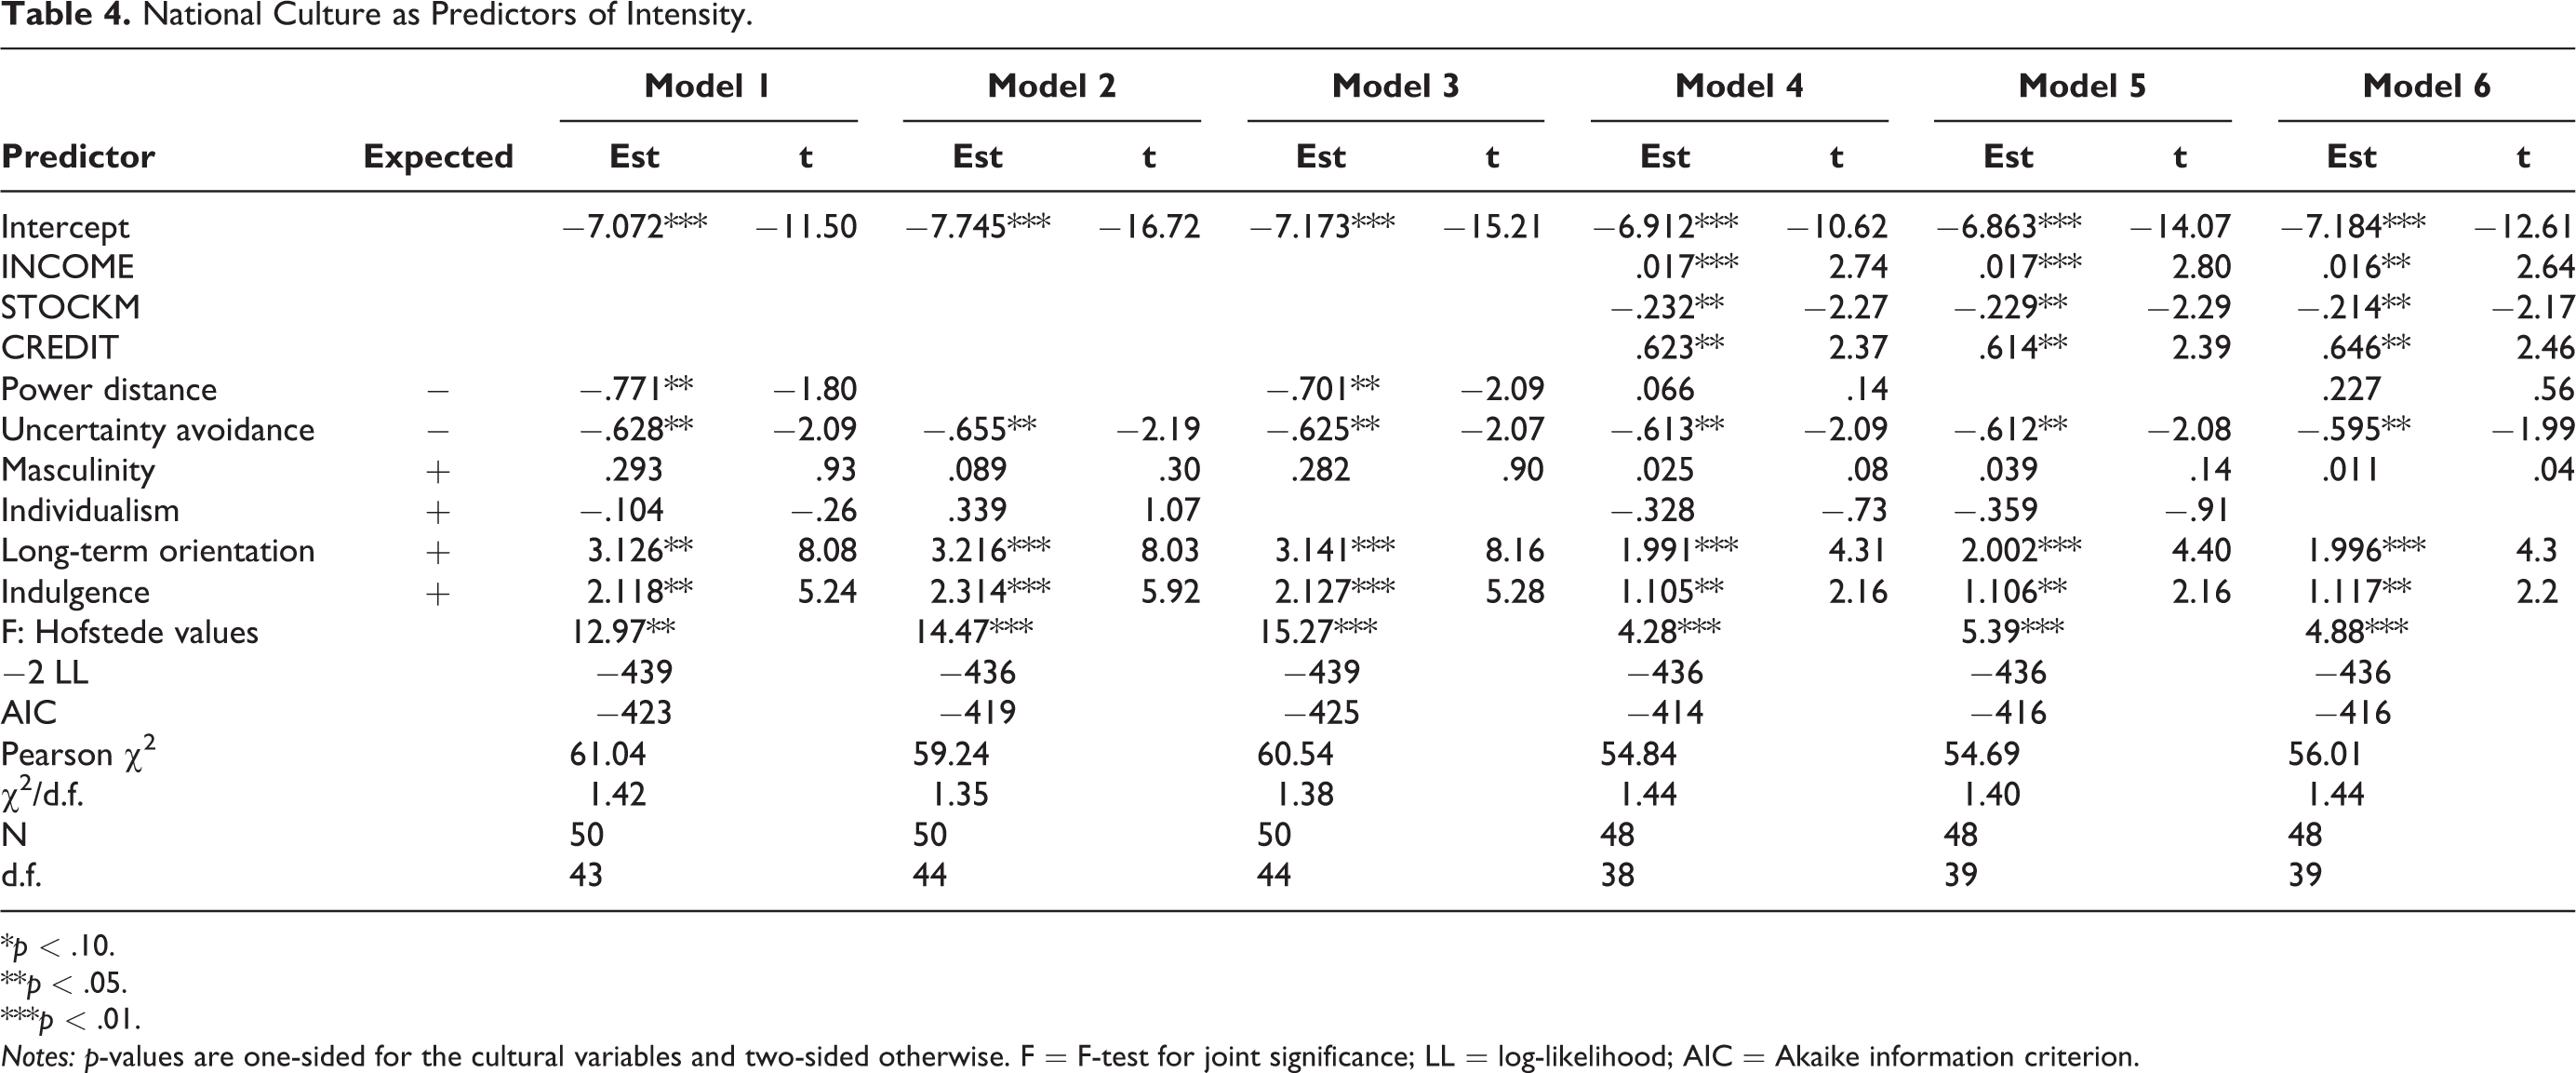
Before hypothesis testing, I examine the cultural effects on R&D intensity (INTENSITY), which averages out temporal or cyclical fluctuations in R&D expenditure. R&D intensity is expected to affect innovation outcomes and ultimately economic growth (e.g., Efrat 2014). As it represents one facet of R&D decision making (i.e., an average propensity to invest in R&D), R&D intensity can offer a context under which I interpret the cultural effects on the cyclical behavior of R&D investment. For instance, do longer-term-oriented cultures invest more in R&D on average, follow business cycles less closely, and adjust their R&D spending less variably over time? Table 4 shows a beta-logistic regression of R&D intensity. Models 1–3 do not incorporate any controls, whereas Models 4–6 do. Models 2 and 5 drop power distance, whereas Models 3 and 6 drop individualism. Between Models 1 and 4, the addition of three controls turns power distance insignificant, but other cultural values remain unaffected. The exclusion of power distance does not affect the significance of individualism, and vice versa, nor are other dimensions influenced. For a stronger test, I conclude, based on Model 4, that R&D intensity is higher in cultures that are more accepting of uncertainty, long-term oriented, and indulgent.
National Culture as Predictors of Intensity.
*p < .10.
**p < .05.
***p < .01.
Notes: p-values are one-sided for the cultural variables and two-sided otherwise. F = F-test for joint significance; LL = log-likelihood; AIC = Akaike information criterion.
Culture and Comovement of R&D: H1a–H6a
Table 5 reports meta-regression for comovement elasticity. As before for R&D intensity, I run the same six models but with INTENSITY added as an extra covariate. A comparison between Models 1 and 4 reveals that the significance of masculinity and individualism is sensitive to the inclusion of the controls; however, other cultural values remain intact regardless. Again, the removal of power distance does not influence the significance of individualism, and vice versa, nor are other dimensions affected (except masculinity in Model 6). Thus, it does not seem that the results are contaminated by the joint presence of power distance and individualism. I use Model 4 to test the six hypotheses. H1a, which posits a positive coefficient on power distance, is not supported: the estimate is positive but insignificant. H2a, proposing a positive coefficient on uncertainty avoidance, is supported: the higher the uncertainty avoidance, the more procyclical the R&D expenditure. I find no support for H3a on the effect of masculinity: although the estimate is negative, as hypothesized, it is insignificant. The coefficient on individualism is significantly negative, in support of H4a: the more individualistic the culture, the less procyclical the R&D expenditure. H5a on the effect of long-term orientation is supported: the more long-term oriented the country, the less procyclical the R&D expenditure. Finally, the estimate for indulgence is significantly negative, in support of H6a: the more indulgent the country, the less procyclical the R&D expenditure.
Meta-Regression of Comovement Elasticity.

*p < .10.
**p < .05.
***p < .01.
Notes: p-values are one-sided for the cultural variables and two-sided otherwise. F = F-test for joint significance; RMSE = root mean squared error.
Culture and Cyclical Volatility of R&D: H1b–H6b
The three volatility metrics are highly correlated with one another and tend to be smaller in wealthier countries (Table 3). Their sample values are well below 100% and right skewed, so I conduct a beta-logistic regression as a flexible way to handle the de facto proportion data (Table 6). I base my tests on the model with controls for a stronger test. Cyclical volatility is associated negatively with INTENSITY: the more research intensive the economy, the lower the cyclical volatility of R&D expenditure. H3b and H6b are supported: the more masculine or indulgent the country, the lower the cyclical volatility. No significant coefficient is obtained on any other dimension: H1b, H2b, H4b, and H5b are not supported. The beta-logistic regression is repeated for trend and growth volatility. No control has a significant effect on trend volatility. Individualism, long-term orientation, and indulgence have significantly negative coefficients. The signs of these effects are congruent with H4b, H5b, and H6b for cyclical volatility. Finally, growth volatility is negatively associated with INTENSITY. I find significant negative effects of masculinity, individualism, and indulgence. These significant effects agree with the directions of H3b, H4b, and H6b for cyclical volatility. When significant, a cultural effect is directionally identical across the three metrics. Pooling the results, I conclude that, except for power distance and uncertainty avoidance, Hofstede’s dimensions tend to reduce R&D volatility in one way or another. In this regard, H3b–H6b find some empirical support in a broader sense. In summary, three dimensions—individualism, long-term orientation, and indulgence—reduce both comovement and volatility, uncertainty avoidance only increases comovement, and masculinity only decreases volatility. I find no clear evidence that power distance is associated with intensity, comovement, or volatility of business R&D. 4
National Culture as Predictors of Volatility.

*p < .10.
**p < .05.
***p < .01.
Notes: p-values are one-sided for the cultural variables and two-sided otherwise. F = F-test for joint significance; LL = log-likelihood; AIC = Akaike information criterion.
Cyclical Behavior on Economic Performance: H7a and H7b
I analyze two criteria to test my conjecture that higher comovement or cyclical volatility damages the national economy. The first is total factor productivity (TFP) in the Penn World Table 9.1 (Feenstra, Inklaar, and Timmer 2015).
5
The second is Global Innovation Index Output Sub-Index (GII), which encompasses a broad range of non-R&D innovation outcomes.
6
Because R&D is a productivity-enhancing investment and a key innovation input, both criteria should be related negatively to comovement and volatility. I run a regression to test H7a–b (Table 7). Hofstede’s values are excluded because of resulting small degrees of freedom (about 20). Accordingly, this exercise examines only indirect effects of culture on productivity and innovation. Mean growth
The Effects of Cyclical Behavior of R&D.

*p < .10.
**p < .05.
***p < .01.
Notes: p-values are two-sided. t-values are computed using White’s heteroskedasticity-consistent standard errors. I eliminate observations deemed outliers or influential judged by Cook’s D and leverage (five to seven observations at most in each regression).
Discussion
Theoretical Implications
I show a strong association between national culture as a contextual variable and the cyclical behavior of aggregate business R&D expenditure. An extensive body of research has demonstrated that top executives should support investing in R&D and that national culture, as an informal institution, shapes executives’ cognitive styles and preferences, which in turn influence their interpretations of and responses to external environments (e.g., Engelen et al. 2014; Lewellyn and Bao 2015). Overall, my study fits squarely with this strand of research in that I showcase the moderating role of national culture in R&D decisions across the globe. This study’s unique contribution is to show that national culture affects not only (1) a propensity to invest in R&D (i.e., intensity averaged over time) but also (2) comovement with business cycles and (3) the extent of cyclical volatility.
Hofstede’s dimensions appear to exert rather clean and consistent influences over all three R&D measures. There is no clear case for power distance in any measure. I hypothesized a positive relationship of power distance with the cyclical behavior, assuming that stratification would make it easier for executives to justify frequent adjustments under changing economic conditions. However, the opposite could also be true: great reverence for, or a reluctance to challenge, authority would make it equally easy to cling to the current policy, however questionable it is. Masculinity is negatively associated with volatility (cyclical and growth). Uncertainty avoidance tends to decrease R&D intensity but increase comovement. Individualism is negatively associated with comovement and volatility (trend and growth). Long-term orientation and indulgence affect all three R&D measures. Moreover, these cultural effects are mutually reinforcing: if a cultural value operates in a way that increases (lessens) R&D intensity, it operates in a way that decreases (strengthens) comovement or volatility. Accordingly, what grows a propensity to invest in R&D discourages procyclical adjustment patterns and large temporal fluctuations in R&D expenditure. In this sense, national culture is theoretically far more salient than previously conceived because its moderation transcends the domain of static or time-invariant R&D intensity. Prior research on national culture and R&D has paid little attention to dynamic contexts such as business cycles and to how cultural values may interact with them to (re)orient strategic decisions on innovation activities. This research demonstrates the necessity of more explicit theorizing for the culture’s effect on cyclical and dynamic behaviors of R&D in international marketing research.
A principal approach in cross-cultural research on innovation has been to link a country’s inputs (e.g., R&D intensity) and outputs (e.g., patents, trademarks, scientific publications) averaged over time, abstracting patterns of temporal variation in resources. Such an approach mistakenly discards critical information on the dynamics of innovation activities. I demonstrate that R&D dynamics are crucial for explicating heterogeneous rates of national performance, as TFP and GII are affected by comovement and volatility as well as R&D intensity. This corroborates, and generalizes to a larger international context, the detrimental effects of temporal variability, unpredictable changes, and myopic management of R&D expenditure found in previous single-country firm-level studies (e.g., Chakravarty and Grewal 2016; Pennetier, Girotra, and Mihm 2019). Researchers should embrace the cyclical behavior of R&D as an essential constituent of such dynamism in R&D decisions. Notably, national culture shapes this dynamism so as to open multiple pathways to national productivity and innovativeness.
The cyclicality of R&D has been approached almost exclusively from an economics viewpoint. Economists have advanced theories for what makes R&D different from other ordinary investments and the determinants of R&D financing (for a comprehensive review of R&D financing, see Hall [2002]). It has been argued that R&D has relatively higher adjustment costs, which motivate firms to smooth R&D investment by adjusting other (physical) investments (Himmelberg and Petersen 1994). The current research explores the interface between economics and culture; cultural values also shape preference for smoother R&D expenditures (i.e., lower comovement and cyclical volatility). Whereas economists view R&D adjustment purely through the lens of supply and deployment of trained scientists and research capabilities, I contextualize the function of adjustment costs and demonstrate that such costs may be culture dependent. Specifically, values embedded in national culture could attenuate or amplify perceived costs of adjusting R&D function over time. Fundamentally, R&D decision making is not totally rational; if anything, the “rationality rests on cultural—that is, prerational—choices” (Hofstede, Hofstede, and Minkov 2010, p. 244).
My framework can also guide research on R&D decisions at the firm level. This study suggests that an executive cultural orientation can be a crucial determinant of the cyclical behavior of the firm’s R&D. Given that most firm-level studies have focused on R&D expenditure or intensity, my framework and empirical methodology can be readily applied to quantify the cyclical behavior of firm-level R&D spending and its long-term impacts on firm performance and value. Various theories, factors, and considerations have been posited to explicate firms’ R&D decisions (e.g., agency cost [Chakravarty and Grewal 2016], search behavior Greve 2003], chief executive officer characteristics [Baker and Mueller 2002]). These factors influence managerial perceptions and incentives. Because cultural values shape executives’ cognitive base, views, and preferences, it is not unreasonable that culture would underlie or interact with such factors. Therefore, one can broaden existing conceptual frameworks by controlling for the direct and indirect effects of an executive cultural background on the cyclical behavior of the firm’s R&D. Then, firm-level studies can directly address whether cultural values are mediated completely or partially and thus expand the knowledge frontier for R&D and its cyclical behavior. I conjecture that other effects will be attenuated once culture is controlled for.
Managerial Implications
R&D is supposed to be a long-term investment, such that it should be stable over time and insensitive to external economic stimuli and fluctuations in demand. The results indicate otherwise: firms around the world treat some portion of their R&D as discretionary and engage in period-to-period, spontaneous adjustments in relation to the general state of the economy. To rephrase, managers come under pressure or have incentives to adapt their R&D expenditures over time and over business-cycle phases for a variety of reasons. Such pressure is not terrible per se: it can prompt marketers to develop a sense of accountability and R&D productivity, streamline the current research portfolio, and draw attention to core competencies and business objectives. This research finds, however, that procyclical R&D adjustments generally lead to long-term loss in productivity and innovation. By comprehending the cyclical behavior of R&D in their national market or respective industry, firms can develop a spending benchmark, against which they can judge at least whether the proposed cut or boost looks reasonable relative to the anticipated aggregate cyclical reaction. Furthermore, managers should be alerted to the danger of increased volatility in R&D spending over time. Allowing for temporal flexibility is legitimate to rebalance a firm’s core competence and strategic focus under rapidly changing technological environments. I caution, however, that persistence pays off. Therefore, managers should aim to minimize large ups and downs in R&D spending, eschew unanticipated or unpredictable adjustments, and sustain continuity in R&D personnel and capabilities.
Numerous firms strive to change their organizational cultures, structures, communication channels, loci of decision making, and other components to encourage employee initiatives and innovation. Managing R&D personnel in particular also requires a methodical balance between soft and hard skills. Nonetheless, a top-down influence is profound and far-reaching because budgetary control ultimately sets the scope and intensity of R&D activities and the morale of frontline scientists, who discover, apply, and commercialize breakthroughs. Often, firms base their R&D budgets on the previous year’s budget, sales, and profits as well as expected costs (Brockhoff and Pearson 1998; Chen and Miller 2007; O’Brien and David 2014). Procyclical adjustment practices may fortify this type of reactive R&D budget. Agency theory argues that executives may be reluctant to make uncertain long-term investments that maximize firm value. Cyclically sensitive and volatile R&D spending add to this agency cost, which could adversely affect long-term firm performance and value. Thus, the board of directors or principals should keep a close eye on myopic R&D oscillation over time.
Confronted with diverse environments in foreign markets, MNCs need to develop specific local expertise to compete effectively in their respective national markets. National R&D expenditures, as shown here, point to considerable heterogeneity in intensity, comovement, and volatility across the world. My empirical findings can serve as a good starting point to erect global benchmarks for competitive R&D presence and cyclical adjustments, as firms often zero in on preserving parity with their competition. Utilizing and updating the findings in this article would constitute a building block of the global competitive intelligence for MNCs.
Senior managers of MNCs need to appreciate that their country managers and subsidiaries operate under varying levels of pressure and expectations regarding R&D spending along the business cycle. The capability to anticipate what will transpire in different markets would help firms trade off budget items and make an informed decision on the quantity of R&D. Specifically, because R&D comovement is higher in countries with higher uncertainty avoidance, large budget fluctuations closely aligned with business-cycle fluctuations can be justified or tolerated more easily in such countries. Conversely, comovement is lower in more individualistic, long-term-oriented, or indulgent countries; businesses in such environments should strive for resilient R&D spending because cyclical budgetary sensitivity is required to be much smaller (or even acyclical). Similarly, managers in more masculine, individualistic, long-term-oriented, or indulgent countries should endeavor to minimize temporal variation (volatility) in their R&D spending, because such cultures expect and prefer a smaller degree of cyclical, trend, or growth volatility.
Prior studies have iterated the importance of considering national culture in MNCs’ decision making (e.g., market entry) because certain cultural profiles may stifle or foster innovative activities and outcomes. In my context, such “innovation-friendly” cultures (Jones and Davis 2000) could be interpreted as those associated with high R&D intensity (i.e., a high propensity to invest in R&D). No doubt managers prefer or prioritize such markets, but my insight is that such markets also set the bar higher for cyclically less sensitive and temporally more persistent R&D expenditure. Un- or underprepared firms would lag behind competition rather quickly in such seemingly innocuous, attractive markets, to the extent that cyclical and volatile R&D reduces firms’ innovation capabilities over time.
Managers of multinational or global R&D can also utilize my research to manage their R&D network, which typically comprises geographically dispersed teams (Jha, Dhanaraj, and Krishnan 2018). Cultural settings of those foreign sites tend to be quite different not only from the home culture but also between themselves. In globalized R&D, cultural factors inevitably come into play; thus, for better collaboration, global project managers or chief technology officers should anticipate and manage reactions of their multicultural R&D staff to funding decisions, which are frequently centralized at the headquarters (Farrington 2020).
Limitations and Future Research
Corporate technology managers are concerned that budget crunches instigate a radical shift from long-term exploratory research toward more application and product development research aimed at delivering immediate payoffs (Rotman 1994). Future research could explore the effects of culture on the cyclical behavior of different R&D types. For example, is basic research less procyclical in more long-term-oriented cultures? Are the shares of R&D types relatively more stable in more long-term-oriented cultures? The maintained assumption of symmetric comovement and volatility may be restrictive. R&D might be lost more during contractions than gained during expansions: that is, upward and downward volatility might be quite different. Whereas R&D decreases elastically during contractions, it may not bounce back equally as elastically during expansions. An intriguing venue for extension is how culture affects these potential asymmetric responses. For example, does R&D expenditure in long-term-oriented societies rebound during booms proportionately more than it decreases during recessions? It would be useful to explore asymmetric R&D reactions over the business cycle in an international context, though it is challenging to construct a large panel of much longer time series.
Several critiques have emerged lately of conceptual, methodical, and measurement weaknesses and limitations of the Hofstede framework (e.g., McSweeney 2002). Although the adoption of other cultural frameworks necessitates distinct arguments for the workings of culture, they could deliver completely different insights into how culture influences rational decision making for R&D. I analyze the relation between culture and R&D at the national level. Effect sizes of Hofstede’s dimensions at more micro levels may be much smaller than those at the country level. My theoretical framework could be extended straightforwardly to firm-level data and measures of executive cultural orientation or organizational culture (Tian et al. 2018).
Although my results are useful to set national standards, interindustry heterogeneity would diminish the applicability of a country’ mean comovement or volatility to businesses operating in diverse sectors. Further granular analyses are required at the industry level to characterize the cyclical behavior of business R&D expenditures in an international context. It is desirable to concentrate on some high-tech industries that constitute the lion’s share of national R&D because a nation’s definition of R&D in financial accounting can be so broad as to mix everything from minor additions to groundbreaking innovations. A narrower scope than the national total would offer a more accurate account of how technology-intensive sectors adjust their R&D activities and expenditures over the business cycle. Finally, R&D is an innovation input, and a host of questions remains to be answered on the cyclical behavior of innovation outcomes, such as inventive activities, scientific/technical knowledge, commercial products, technological breakthroughs, and so on. Future research could examine the role played by national culture in a manner similar to this study.
Supplemental Material
Supplemental Material, sj-pdf-1-jig-10.1177_1069031X21994106 - National Culture and the Cyclical Behavior of Research-and-Development Expenditure
Supplemental Material, sj-pdf-1-jig-10.1177_1069031X21994106 for National Culture and the Cyclical Behavior of Research-and-Development Expenditure by Jung Seek Kim in Journal of International Marketing
Footnotes
Associate Editor
Michael Haenlein
Declaration of Conflicting Interests
The author(s) declared no potential conflicts of interest with respect to the research, authorship, and/or publication of this article.
Funding
The author(s) received no financial support for the research, authorship, and/or publication of this article.
Notes
References
Supplementary Material
Please find the following supplemental material available below.
For Open Access articles published under a Creative Commons License, all supplemental material carries the same license as the article it is associated with.
For non-Open Access articles published, all supplemental material carries a non-exclusive license, and permission requests for re-use of supplemental material or any part of supplemental material shall be sent directly to the copyright owner as specified in the copyright notice associated with the article.