
Abstract
This study examines whether students perceive three different types of fit in an academic environment (i.e., interest–major [I–M] fit, demands–abilities [D–A] fit, and needs–supplies [N–S] fit) and whether these factors predict important academic and well-being criteria using a Chinese student sample. Results from confirmatory factor analyses support the assumption that students differentiate among the three fit perceptions. Incremental validity analysis and relative importance analysis reveal that the three types of fit each have a unique relationship with situational outcomes. Specifically, I–M fit predicts greater proportions of variance in major change intention; D–A fit predicts greater proportions of variance in academic performance; and N–S fit predicts greater proportions of variance in well-being (e.g., academic satisfaction and depression). Practical and theoretical implications of these results are discussed.
Introduction
Person–environment (P–E) fit theories are widely recognized psychological theories (Dawis, 1992). Based on interactional psychology and needs–press theories (Murray, 1981; Terborg, 1981), P–E fit underlines the interaction between individuals and social settings. In the case of educational settings, students have different preferences for teaching environments, and the congruence between the above two can bring about improved outcomes (Lengnick-Hall & Sanders, 1997). Recent studies put great emphasis on the interaction between students and their school environment (e.g., Westernman, Nowicki, & Plante, 2002; Westernman & Vanka, 2005) or majors (e.g., Tracey & Robbins, 2006; Wessel, Ryan, & Oswald, 2008). Results have shown that academic fit is correlated with academic satisfaction, academic performance, and major change intention (Schmitt, Oswald, Friede, Imus, & Merritt, 2008; Tracey & Robbins, 2006; Wessel et al., 2008).
However, current research has failed to distinguish between different fit perceptions in an academic environment. Under the guidance of Holland’s RIASEC vocational model, most studies only focus on interest–major (I–M) fit (Logue, Lounsbury, Gupta, & Leong, 2007; Tracey & Robbins, 2006; Wessel et al., 2008). Though Schmitt, Oswald, Friede, Imus, and Merritt (2008) paid some attention to different fit perceptions and successfully developed a 6-item perceived academic fit scale containing I–M fit, demands–abilities (D–A) fit, and needs–supplies (N–S) fit, the convergent and discriminant validity of these different academic fit perceptions have not been established. This is unfortunate because different types of P–E fit have previously been shown to have unique relationships with outcomes (Cable & DeRue, 2002; Kristof-Brown, Zimmerman, & Johnson, 2005). Thus, failure to consider different types of academic fit may underestimate the importance of P–E fit for predicting student outcomes. Moreover, prior studies have not examined relations of academic fit with student well-being. Understanding the factors that influence student well-being is important because social indicators alone cannot fully account for the quality of life (Diener & Suh, 1997), and most students around the world consider happiness and life satisfaction to be extremely important (Diener, Suh, Lucas, & Smith, 1999).
The present research redresses the abovementioned limitations currently present in academic fit literature. Our first objective was to confirm the validity of the three-factor academic fit model, including I–M fit (congruence between students’ interest and the characteristics of a major), D–A fit (congruence between students’ capabilities and the demands of schoolwork), and N–S fit (congruence between students’ needs and the rewards they receive in return for their study). As suggested by Kristof (1996), it is recommended practice to study the effects of multiple fit perceptions in a single model. The second objective was to examine the incremental validity and relative importance of different academic fit perceptions for predicting students’ academic activities. Doing so is important because it evaluates the importance of variables comprehensively (LeBreton, Hargis, Griepentrog, Oswald, & Ployhart, 2007), and tests unique relationships of different types of fit perceptions with their outcomes. The third objective of our study was to establish a correlation between academic fit and well-being. Since well-being plays a significant role in the lives of college students, this exploration is quite meaningful for the purposes of educational counseling.
The Model of Three-Factor Fit Perceptions
According to Cable and DeRue’s (2002) fit model, in industrial settings, person–organization fit (P–O fit; the compatibility between individuals and organizations, Kristof, 1996), D–A fit, and N–S fit are three different dimensions of P–E fit and have both convergent and discriminant effects on outcomes. The present research assumes that the same internal mechanisms that characterize such settings also exist in academic settings. In fact, there are compelling arguments regarding the overlap of traditional organizational environments and higher education settings (Christensen, Garvin, & Sweet, 1991). Faculty often act like managers in that “they rate performance effectiveness (grading), control work process (pedagogy), provide necessary inputs and resources to accomplish tasks, and decide on feedback and communication methods and timing” (Westernman & Vanka, 2005). Therefore, relevant theories in industrial and organizational psychology are applicable to academic environments.
Relationship Between I–M Fit and Outcomes
P–O fit can be assessed along various characteristics. In industrial settings, the focus of P–O fit in most cases is on values (Cable & DeRue, 2002). Therefore, in Cable and DeRue’s (2002) fit model, P–O fit is measured by value congruence. It has been demonstrated that P–O fit is the best indicator of organizational outcomes, namely, organizational identification, perceived organizational support, citizenship behavior, and turnover decision (Cable & DeRue, 2002). In colleges and universities, relative to the other types of P–O fit, I–M fit has received the majority of attention (Tracey & Robbins, 2006; Wessel et al., 2008). Therefore, this study treats I–M fit as our indicator for P–O fit.
Consistent with Cable and DeRue’s (2002) theory, this study expects I–M fit will also be the best predictor of organization-based (or in this case university-based) outcomes in campus, including major change intention. According to Holland (1976), people might change their vocational choices because of their changes of interest or success in finding a preference that represents a better fit. It means that people tend to satisfy their vocational interest through vocational preference. In educational settings, students with a high I–M fit find their coursework more interesting are constantly motivated to learn and enjoy the process of learning. In contrast, students whose I–M fit is low find it hard to devote themselves to schoolwork and are more likely to change their current major to seek for a better I–M fit. It has been shown that students whose academic interests are aligned with their major, which is captured by I–M fit, usually have higher effective commitment to their major (Wessel et al., 2008). Effective commitment, in turn, is a critical antecedent that makes turnover and withdrawal less likely. Therefore, I–M fit will be the most important predictor of students’ major change intention.
Hypothesis 1a: I–M fit will be negatively related to major change intention.
Hypothesis 1b: I–M fit will contribute more to the prediction of major change intention than D–A fit and N–S fit.
Relationship Between D–A Fit, N–S Fit, and Outcomes
Though in Holland’s theory, I–M fit is referred as one main kind of fit perceptions for college students, the concept of fit has transcended the topic of vocational interests (Muchinsky, 1999). The Theory of Work Adjustment provides an alternative angle that enriches the meaning of academic fit. Based on the assumption that correspondence exists between individual and environment (Dawis, Lofquist, & Weiss, 1968), D–A fit and N–S fit are critical complementary fit perceptions. On one hand, individuals’ skills enable them to respond to the requirement of the environment (Lofquist & Dawis, 1969), which leads to D–A fit. On the other hand, the rewards from the environment also respond to the needs and desires of individuals (Lofquist & Dawis, 1969), which is measured by N–A fit.
This study assumes that D–A fit and N–S fit may also be as important in academic environments as they are in organizational settings. In terms of D–A fit, demands include task requirements, role expectations, and institutional norms; whereas abilities include aptitudes, time, and energy one needs to meet these demands (Edwards, Caplan, & Harrison, 1998). In school environments, the role of a student is fundamentally that of a learner. If students’ knowledge, skills, abilities, time, and energy fit the requirements of their schoolwork, then they will typically attain high levels of performance.
Though previous studies have failed to consistently demonstrate a clear relationship between D–A fit and performance in work organizations (Cable & DeRue, 2002; Lauver & Kristof-Brown, 2001), D–A fit is assumed to be the best indicator of job performance (Cable & DeRue, 2002). When one’s abilities fall short of job demands, work processes tend to be less efficient, leading to poor performance. Similarly, when a person is overqualified, he or she may become complacent and uninterested, which also has adverse effects on performance (Cable & DeRue, 2002). Therefore, only when there is a good match between demands and abilities can the requirements of the work environment be well fulfilled, resulting in satisfaction and long tenure (Dawis et al., 1968).
In a college context, this study expects a similar pattern of effects regarding the fit of students’ abilities with the demands of their schoolwork. If students’ learning capacity meets the requirement of their schoolwork, they are likely to perform at a high level. Alternatively, if their abilities are either too high or too low compared to coursework demands, then performance will deteriorate. Therefore, D–A fit should be the best predictor of students’ academic performance.
Hypothesis 2a: D–A fit will be positively related to academic performance.
Hypothesis 2b: D–A fit will contribute more to the prediction of academic performance than I–M fit and N–S fit.
With respect to N–S fit, needs are characterized in general terms, including innate biological and psychological requirements, while supplies refer to extrinsic and intrinsic resources and rewards that fulfill such needs (Edwards et al., 1998). In academic environments, students have diverse needs that require fulfillment by the academic environment. As college life can influence an individual’s vocational selection and development in the future, one of the most important needs for students is the education they receive which should satisfy the demands of their vocational career.
There is an obvious link between N–S fit and personal satisfaction. According to the Theory of Work Adjustment, if the work environment fulfills the requirements of the individual, he is defined as a satisfied worker (Dawis et al., 1968). In other words, job satisfaction just represents one’s subjective evaluation of the degree to which the needs are fulfilled by the job (Dawis & Lofquist, 1984; Locke, 1976). Therefore, N–S fit should be the best predictor of job satisfaction (Cable & DeRue, 2002). The same reasoning goes for academic environments. As academic satisfaction represents a student’s subjective evaluation of whether his or her desires are met by schoolwork, high N–S fit would elicit higher academic satisfaction. Therefore, it is reasonable to consider N–S fit as the best predictor of academic satisfaction.
Hypothesis 3a: N–S fit will be positively related to academic satisfaction.
Hypothesis 3b: N–S fit will contribute more to the prediction of academic satisfaction than I–M fit and D–A fit.
In the educational settings, not only is it important to pay attention to students’ academic satisfaction but also to their general well-being. Subjective well-being is an approach to measure the quality of life, which is concerned with individuals’ subjective experience of their lives (Diener & Suh, 1997). As it captures experiences that are important to the individual, well-being is an important variable to measure students’ life quality in the campus.
This study uses general life satisfaction and depression as indicators of student well-being and assumes that N–S fit would be the best predictor of general life satisfaction and depression. Since students spend most of their time learning in the school, they tend to judge their life quality primarily on whether their schoolwork has enabled them to fulfill their needs. Therefore, when students’ academic needs are fulfilled, they will likely experience greater life satisfaction. On the contrary, it is believed that strain increases when there is misfit between needs and supplies (Edwards, 1996), which is a precursor to depression. As a result, higher N–S fit may also signify lower depression.
Hypothesis 4a: N–S fit will be positively related to general life satisfaction.
Hypothesis 4b: N–S fit will contribute more to the prediction of general life satisfaction than I–M fit and D–A fit.
Hypothesis 5a: N–S fit will be negatively related to depression.
Hypothesis 5b: N–S fit will contribute more to the prediction of depression than I–M fit and D–A fit.
Method
Sample
The original data collection plan was to have a sample size of around 300 freshmen (50 in each of 6 departments). These departments were selected from all of the departments of Peking University using a group sampling method, which balanced Arts and Science). The data were collected from freshmen because their judgment of academic fit would not be confounded by past achievements in college. Research assistants randomly selected students in each department and invited them to participate voluntarily. The first survey package with a self-addressed, postage-paid envelope was given to those who agreed to participate. Among 300 freshmen who were invited, 280 of them returned the complete first survey (Time 1) with the response rate of 93.3%. After 3 months, the second survey was mailed to these participants, again with a self-addressed, postage-paid envelope. Two hundred and forty-six students completed the second survey (Time 2) with the response rate of 82.0% (Department of Chinese Language and Literature [N = 39], School of Government [N = 44], School of Management [N = 45], School of Mathematical Sciences [N = 31], College of Engineering [N = 43], and Law School [N = 44]). Approximately half of the final sample was male (54.9%) and the mean age was 18.31 years (SD = 0.77).
Procedure
The surveys were distributed in two time waves. Time 1 data were collected 3 months into freshmen’s first semester. This time point was chosen because newcomers adjust rapidly to new environments with significant changes during the first 3 or 4 months after entry (Ashforth & Saks, 1996; Thomas & Anderson, 2002), which produces unstable fit perceptions during that initial period (Cooper-Thomas, Vianen, & Anderson, 2004). After that, their fit perceptions are relatively stable. Moreover, as students have already lived in the campus for 3 months, they are also likely to have sufficient exposure to the coursework in their major to adequately judge their level of fit. Each participant completed a questionnaire that included measures of demographic variables (age, gender, and family income), I–M fit, N–S fit, and D–A fit. Time 2 data were collected 3 months later (or 6 months into their first semester). The Time 2 survey assessed students’ academic satisfaction, general life satisfaction, depression, and major change intention. Students’ objective academic performance during the first semester was also collected through the Office of Educational Administration.
Measures
The translation process for all of the English scales strictly complied with the translation–back translation procedures recommended by Brislin (1993), which ensures that the scales retained their original meaning.
Fit
A 9-item Perceived Academic Fit Scale (shown in Table 1) was developed. Items for D–A fit and N–S fit were revised from the Perceived Fit Scale (PFS) by Cable & DeRue (2002). Specifically, the original D–A fit scale’s reliability was .89, items including “The match is very good between the demands of my job and my personal skills,” “My abilities and training are a good fit with the requirements of my job,” and “My personal abilities and education provide a good match with the demands that my job places on me.” The items were revised by replacing “job” with “schoolwork,” “skills” with “ability,” “personal abilities and education” with “learning ability and discipline backgrounds.” The reliability for academic version was .88. The original N–S fit scale’s reliability was .89, items including “There is a good fit between what my job offers me and what I am looking for in a job,” “The attributes that I look for in a job are fulfilled very well by my present job,” and “The job that I currently hold gives me just about everything that I want from a job.” The same revision of D–A fit was made, and the reliability for the new version was .72.
Perceived Academic Fit Scale.
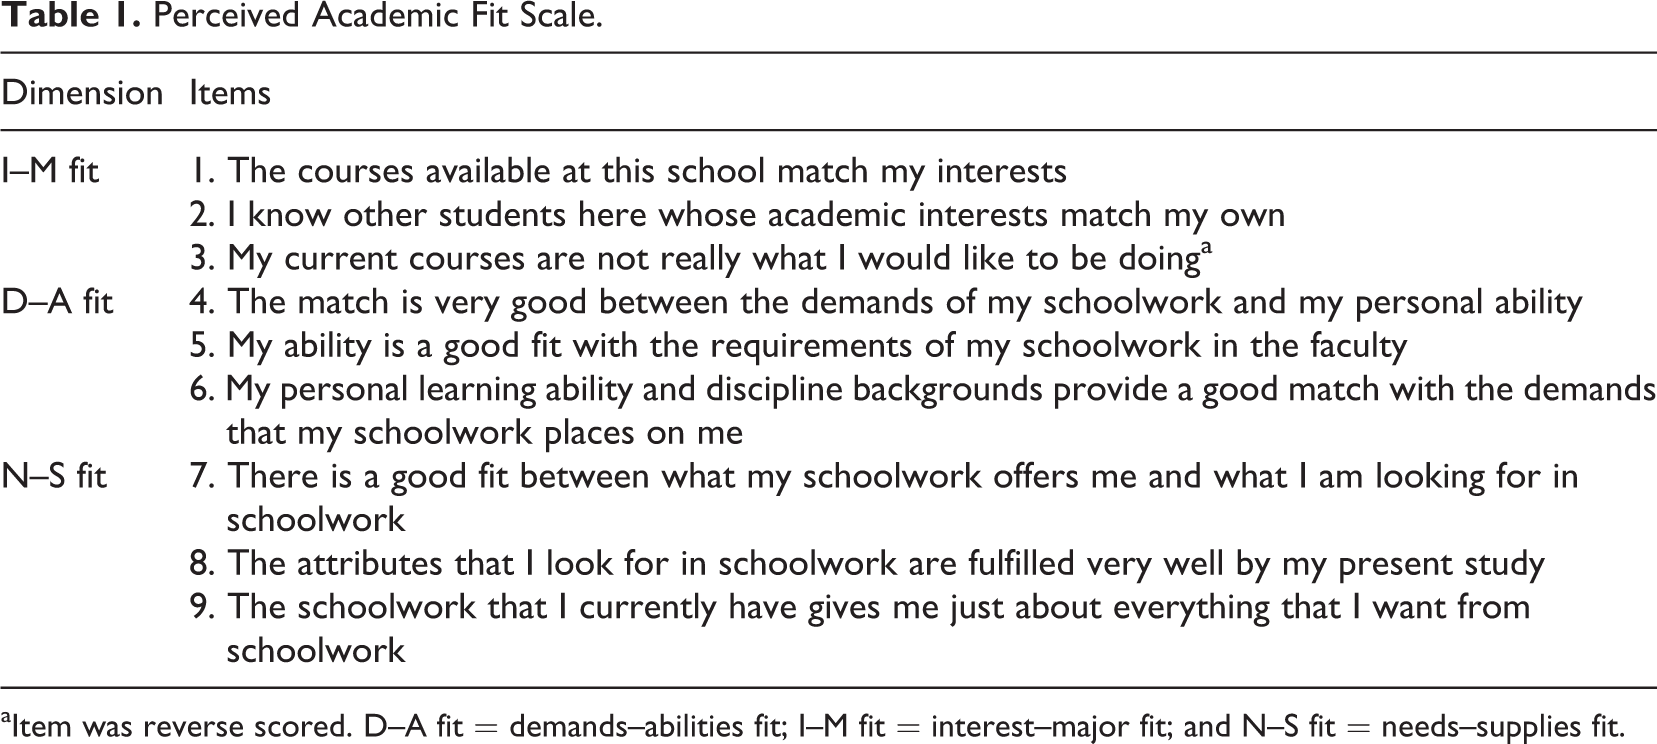
aItem was reverse scored. D–A fit = demands–abilities fit; I–M fit = interest–major fit; and N–S fit = needs–supplies fit.
In the case of I–M fit, 3 items originally developed by Schmitt et al. (2008) were used to assess general academic fit. Due to the low reliability of the I–M fit measure (α = .59), the item with poor psychometric qualities (“I know other students here whose academic interests match my own”) was removed, likely owing to the fact that it assesses fit with one’s peers rather than fit with one’s major. The Cronbach’s α was .73. Students responded to all items using a 7-point Likert-type scale (from 1 = Strongly Disagree to 7 = Strongly Agree).
Academic satisfaction
Academic satisfaction was measured with 5 items developed by Schmitt et al. (2008; α = .85; e.g., “All in all, I am satisfied with the education I can get in this school”). Students responded to these items using a 7-point Likert-type scale (from 1 = Strongly Disagree to 7 = Strongly Agree).
General life satisfaction
General life satisfaction was measured with the Satisfaction with Life Scale (SWLS) developed by Diener, Emmons, Larsen, and Griffin (1985; α = .77; e.g., “In most ways, my life is close to my ideal”). Students responded to these items using a 7-point Likert-type scale (from 1 = Strongly Disagree to 7 = Strongly Agree).
Depression
Depression was measured with the Center for Epidemiological Studies–Depression Scale (CES–D scale, short version) developed by Radloff (1977; α = .76; e.g., “I feel depressed”). This short version only has 8 items. Participants were asked to indicate how many times the listed symptoms happened in the past week using a 4-point scale (from 1 = Not present to 4 = Very Frequently).
Academic performance
Academic performance was measured by students’ final grade point averages (GPA) in the first semester. This information was acquired from the Office of Peking University Educational Administration, so it is an objective measure. The range of GPA is from 0.0 to 4.0.
Major change intention
Students’ intention to change major was measured by two items (α = .84). The first item (“I intend to transfer to a different major before the end of this academic year”) was developed by Schmitt et al. (2008), whereas the second item (“I have a clear plan and arrangement to transfer to another major”) was developed by this study. Students responded to these items using a 7-point Likert-type scale (from 1 = Strongly Disagree to 7 = Strongly Agree.
Control variables
In addition to the focal variables, family income was controlled because family income is related to life satisfaction (Edwards & Klemmack, 1973). Especially, because of the unbalanced economic development of different regions in China, students’ family income could be at great difference. Previous research has shown that Chinese students with less family income tend to have low well-being because they often confront with unique stressors and are unable to receive timely and necessary psychological support (Tong & Song, 2004). Gender was also controlled because gender is related to depression across cultures (Culbertson, 1997; Nolen-Hoeksema, 1994), independent of school-related fit.
Results
Confirmatory Factor Analysis
A confirmatory factor analysis was conducted to test the three-factor model of academic fit. Through maximum likelihood estimation, the three-factor model had good fit: χ2(17, N = 246) = 24.10; χ2/df ratio = 1.42; Goodness of Fit = .98, Normed Fit Index = .97, Comparative Congruence Index = .99; and Root Mean Square Error of Approximation = .04.
Correlations
Means, standard deviations, and intercorrelations among the variables are presented in Table 2. I–M fit correlated positively with academic satisfaction (r = .32, ρ < .01), general life satisfaction (r = .29, ρ < .01), and academic performance (r = .14, ρ < .05) and correlated negatively with major change intention (r = −.30, ρ < .01) and depression (r = −.19, ρ < .01). D–A fit was positively correlated with academic satisfaction (r = .28, ρ < .01), general life satisfaction (r = .32, ρ < .01), and academic performance (r = .25, ρ < .01) and negatively related to major change intention (r = −.21, ρ < .01) and depression (r = −.20, ρ < .01). N–S fit correlated positively with academic satisfaction (r = .42, ρ < .01), general life satisfaction (r = .34, ρ < .01), and academic performance (r = .22, ρ < .01) and correlated negatively with major change intention (r = −.20, ρ < .01) and depression (r = −.27, ρ < .01). Hypotheses 1a, 2a, 3a, 4a, and 5a were fully supported.
Means, Standard Deviations, and Correlations of Studied Variables.

Note. Gender was dummy coded as male = 0 and female = 1; Income represents average family income. Cronbach’s αs are listed along the diagonal in brackets. D–A fit = demands–abilities fit; I–M fit = interest–major fit; and N–S fit = needs–supplies fit.
*ρ < .05. **ρ < .01.
Incremental Validity Analysis and Relative Importance Analysis
Incremental importance involves demonstrating that a specific type of academic fit accounts for variance in criteria above and beyond other two academic fits. This study did so by examining the ΔR2 when the focal academic fit was added to the regression model following the other types of fit. Because the control variables were unrelated to the criteria as a model, the results were reported without control variables.
As presented in the second column of Table 3, when major change intention was the criterion, I–M fit contributed a unique variance of .05, much larger than D–A fit and N–S fit. Similarly, with a ΔR2 of .02, D–A fit was the most important academic fit when academic performance was the criterion. Rounding errors considered, N–S fit had the largest incremental importance when academic satisfaction, general life satisfaction, and depression were the criteria.
Incremental Validity Analysis and Relative Importance Analysis of Academic Fit.
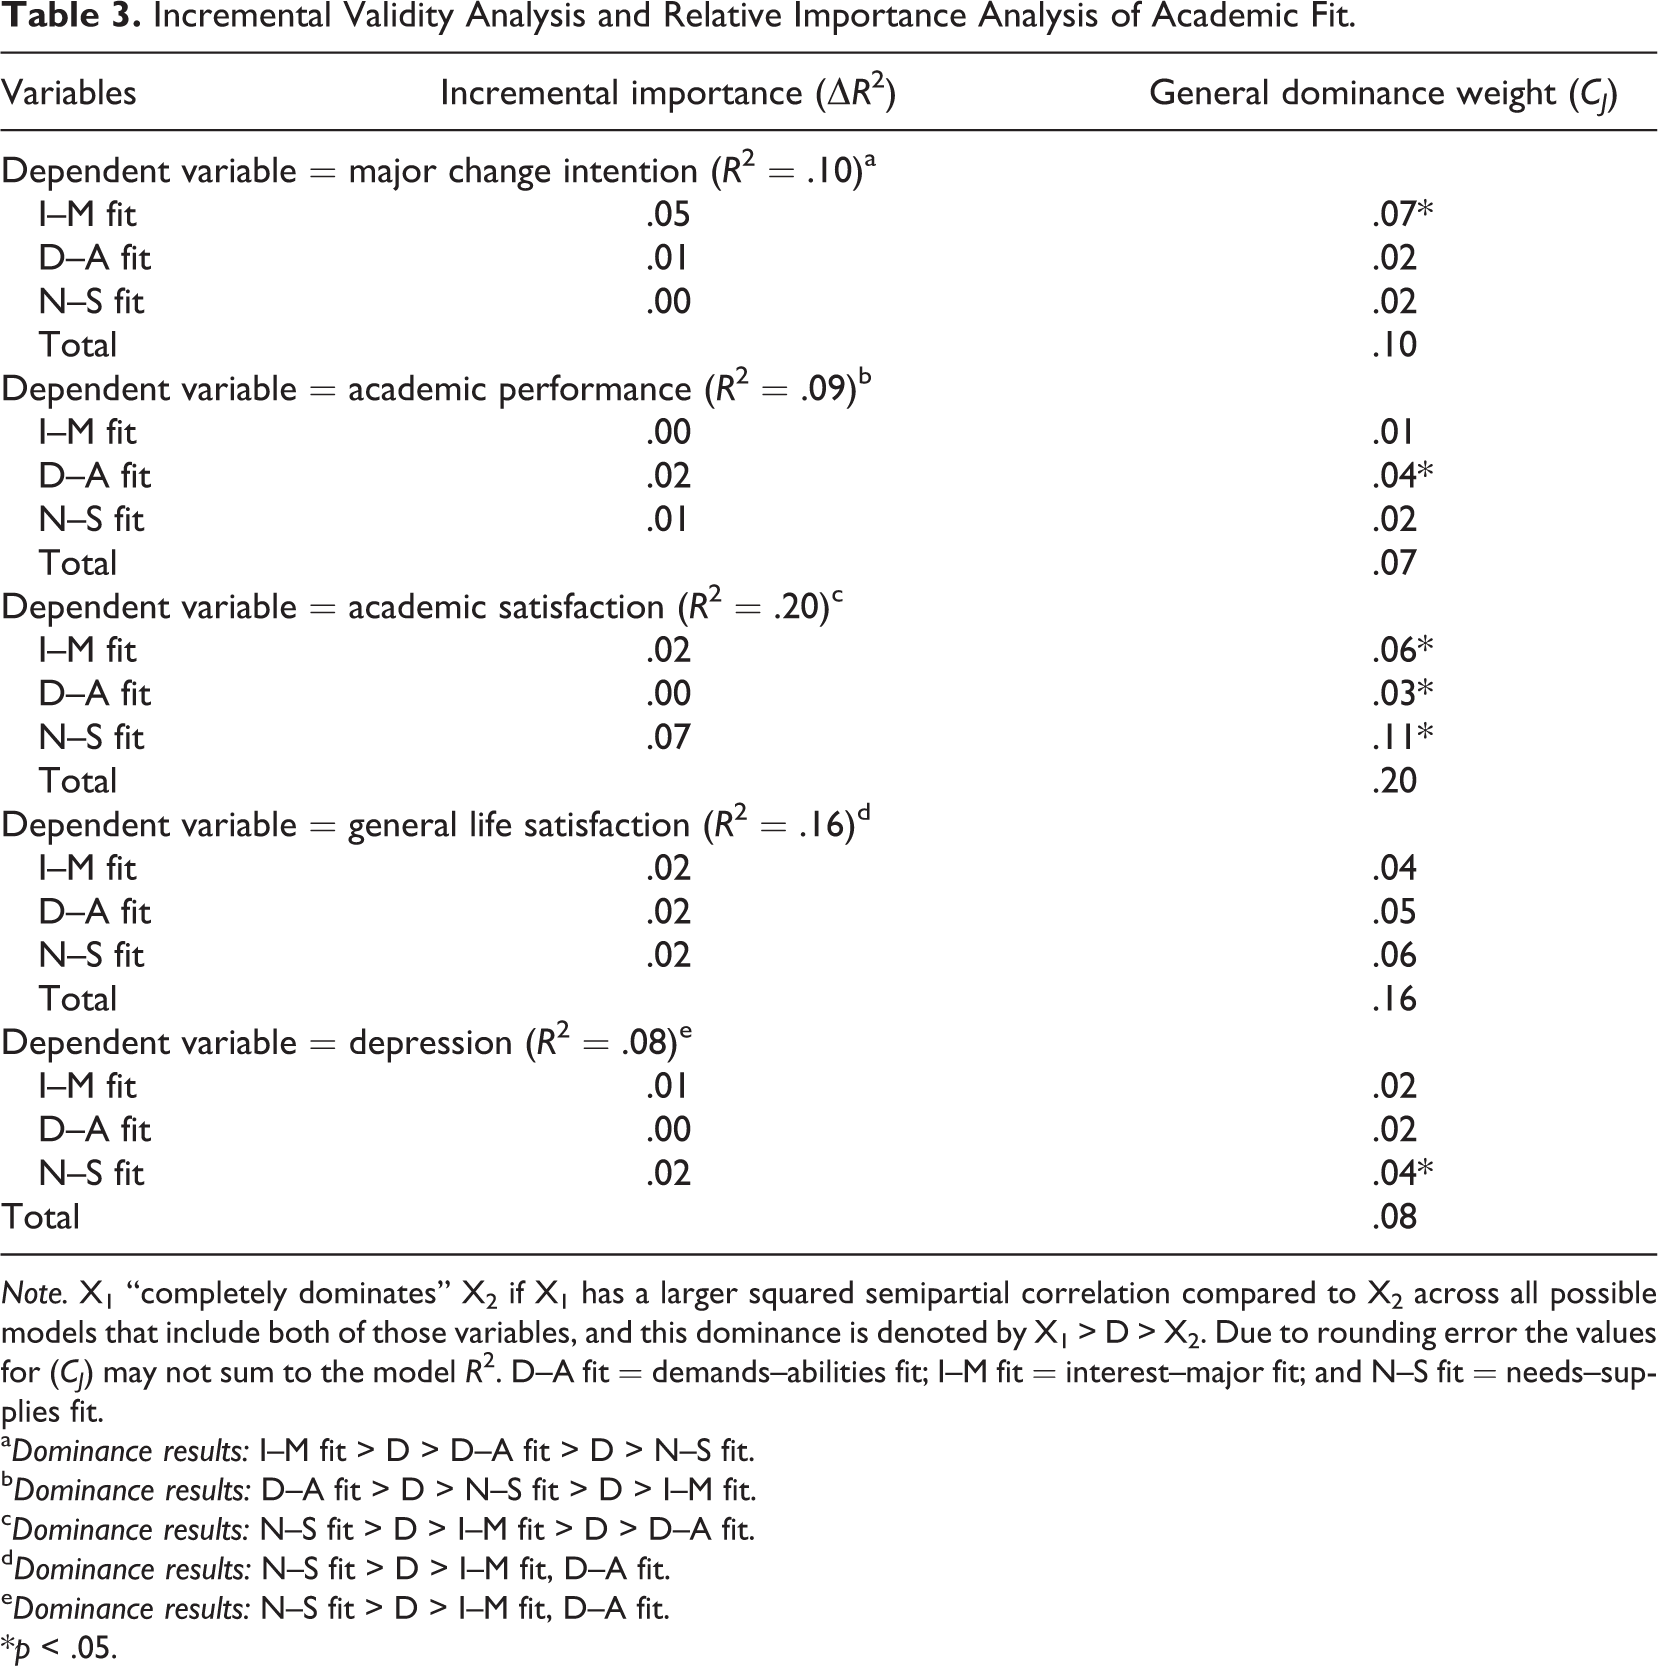
Note. X1 “completely dominates” X2 if X1 has a larger squared semipartial correlation compared to X2 across all possible models that include both of those variables, and this dominance is denoted by X1 > D > X2. Due to rounding error the values for (CJ) may not sum to the model R2. D–A fit = demands–abilities fit; I–M fit = interest–major fit; and N–S fit = needs–supplies fit.
aDominance results: I–M fit > D > D–A fit > D > N–S fit.
bDominance results: D–A fit > D > N–S fit > D > I–M fit.
cDominance results: N–S fit > D > I–M fit > D > D–A fit.
dDominance results: N–S fit > D > I–M fit, D–A fit.
eDominance results: N–S fit > D > I–M fit, D–A fit.
*p < .05.
In the incremental validity analysis, however, any criterion variance predicted by both the new variable and the existed set of variables is credited toward the latter. Thus, it might lead us to make incorrect decisions about the relative efficacy of the new variable (LeBreton et al., 2007). To address this problem, the new variable’s relative importance should be calculated. Relative importance involves determining the contributions that each predictor makes to the R2, considering both their unique contributions and their contributions when other predictors are considered (Johnson & LeBreton, 2004). General dominance weights and relative importance weights are two methods to calculate relative importance, which tend to yield identical estimates. In this case, the general dominance was calculated, which involves computing the mean of each predictor’s squared semi-partial correlation across all possible subset regression models. In addition, following Tonidandel and LeBreton’s (2009) suggestion, a bootstrap procedure was used to test the statistical significance by estimating the standard errors.
Results of the analysis were reported in the third column of Table 3. The results for the major change intention indicated that the I–M fit (CJ = .07) emerged as the only significant predictor, completely dominating D–A fit (CJ = .02) and N–S fit (CJ = .02). D–A fit (CJ = .04) was the only significant predictor of academic performance, completely dominating N–S fit (CJ = .02) and I–M fit (CJ = .01). N–S fit emerged as the only significant predictor of depression (CJ = .04), completely dominating D–A fit (CJ=.02) and I–M fit (CJ = .02). In predicting academic satisfaction, N–S fit (CJ = .11) completely dominated I–M fit (CJ = .06) and D–A fit (CJ = .03). All of them were significant predictors according to the bootstrap test. Though N–S fit (CJ = .06) completed dominated D–A fit (CJ = .05) and I–M fit (CJ = .04) in predicting general life satisfaction, none of them was significant in the bootstrap test. As a result, Hypotheses 1b, 2b, 3b, and 5b were fully supported, while Hypothesis 4b was partially supported.
Discussion
This study examined the effectiveness of a three-factor academic fit model in predicting student well-being, academic performance, and major change intention. Results indicated that the three-factor academic fit model achieved good construct validity and had unique relations with outcomes. Specifically, I–M fit predicted greater proportions of variance in major change intention and did so incrementally to the other types of fit; D–A fit predicted greater proportions of variance in academic performance and did so incrementally to the other types of fit; and N–S fit predicted greater proportions of variance in well-being (e.g., academic satisfaction and depression) and did so incrementally to the other types of fit. Our findings expand the application scope of Cable and DeRue’s (2002) fit model and successfully confirmed that students can differentiate between I–M fit, D–A fit, and N–S fit, which all have convergent and discriminant validity for predicting major change intention, academic performance, and well-being.
I–M fit would appear to be the strongest predictor of students’ major change intention, which indicates that students pay more attention to their personal interests rather than competency or developmental needs when making decisions to change their major. This is consistent with previous findings that perceived fit with major showed strong positive correlations with affective major commitment (Wessel et al., 2008). Moreover, I–M fit was unrelated to predict academic satisfaction and academic performance, presumably because mere subjective interest is not enough to meet one’s needs in the future and bring about better performance, which is also consistent with the study of Wessel, Ryan, and Oswald (2008).
D–A fit was found to be the best indicator to predict academic performance. Previous studies failed to demonstrate a consistent relationship of D–A fit with performance in organizational contexts (Cable & DeRue, 2002; Lauver & Kristof-Brown, 2001). In our study, however, the relationship between D–A fit and academic performance was verified. It indicated that students are able to provide largely accurate reports of their ability levels (Atwater, Ostroff, Yammarino, & Fleenor, 1998), and academic performance is mainly a manifestation of one’s D–A fit. Moreover, paralleling expectations, D–A fit was not uniquely and significantly related to students’ major change intention. Students often care more about their individual interest rather than their competence when making major change decision.
Our study also showed that N–S fit is the best indicator of students’ well-being. This conclusion is consistent with research on fit within work contexts (Cable & DeRue, 2002). Compared with other types of fit, the relationship between N–S fit and academic satisfaction is much more direct, as satisfaction represents one’s evaluation of the degree to which one’s requirements are met. Furthermore, since academic activity is an indispensable part of life for students, their attitude toward their schoolwork exerts a large influence on their depression. Better fulfillment of individual needs means lower depression. The results enlighten us to improve schools’ abilities to serve students and satisfying their academic desires for the sake of the students’ well-being.
These findings have important practical implications. For one thing, since there is a clear relationship between I–M fit and major change intention, universities and colleges should guide students in choosing majors that meet their personal interests and should make policies of changing majors more flexible. In China, especially, students may be misled to choose majors in which they have little interest due to the policy of choosing majors before enrollment. The result is that many students want to switch majors after entering school. However, the requirement of transferring to a different department is usually strict, making it difficult to do so. Therefore, it is advisable for universities to make relevant policy more accommodating. For example, universities could provide students with more opportunities in choosing a second major. On another note, as N–S fit is the best predictor of well-being, universities and school administrators could devote more time and energy in improving their service to students by understanding what their desires are and about what they really care. Studies have shown that well-being translates into greater health and lower suicide rates (Mourn, 1996; O’Leary, 1990). In particular, students’ general well-being is a significant protective factor for attempting suicide (Borowsky, Ireland, & Resnick, 2001). Because our study was conducted in China, the suicide rate among university students is a salient concern. Accordingly, N–S fit is worth even more consideration.
Finally, the present study has some limitations. First, except for GPA, the outcomes were all self-reports. There is also a time lag between data collections, but the common method variance cannot be fully avoided. Another limitation is that this study only examined students’ fit perceptions at one time point; however, academic fit is not a static process but a process that unfolds over time (Schmitt et al., 2008). Therefore, future research should use longitudinal data to improve the understanding of academic fit as a dynamic process. In addition, this study only examined perceived fit, regardless of actual fit. As is suggested by Cable & DeRue (2002), it would be useful to further examine the linkages between actual fit, perceived fit, and outcomes.
Overall, this study sought to examine the incremental validity and relative importance of different academic fit perceptions in terms of attitudinal and behavioral outcomes, using a three-factor integrated model. Results supported our hypotheses and showed: I–M fit is the best indicator of major change intention; D–A fit is the best indicator of performance; and N–S fit is the best indicator of well-being. The significant findings of this study provide further insight into the differences between I–M fit, D–A fit, and N–S fit.
Footnotes
Declaration of Conflicting Interests
The authors declared no potential conflicts of interest with respect to the research, authorship, and/or publication of this article.
Funding
The authors disclosed receipt of the following financial support for the research, authorship and/or publication of this article: This article was funded by The National Natural Science Foundation of China (No: 31200792, J1103602) and The National Social Science Foundation of China (No: 09 & ZD 072).