
Abstract
More than 20 years after Edgar H. Schein introduced career anchor theory (1977), Daniel Feldman and Mark Bolino critiqued both the theory and the methods Schein used to describe career anchors. They propose that understanding the underlying factor structure of the Career Orientations Inventory (COI) will give insight into the relationships between multiple career anchors. These relationships describe which career anchors are complementary (i.e., having congruous characteristics) or mutually inconsistent (i.e., having oppositional characteristics) and enable a study of the degree to which those relationships have an impact upon career outcomes. This study examined how well each of the four models of career anchor relationships, found in the career anchor literature, describe mutually inconsistent relationships found within data from seven empirical career anchor studies. The mutually inconsistent career anchor pairs suggested by Feldman and Bolino were not found to have stronger negative correlations with one another than those proposed by the other three models. Also, the mutually inconsistent pairs proposed by Feldman and Bolino were not found to have on the whole a better fit from confirmatory factor analysis than those proposed by the other three models. Instead, Schein’s proposed model of mutual inconsistency was the best fit, albeit, a weak fit. Weaknesses were also found in the two-dimensional octagonal models proposed by Feldman and Bolino, by Chapman, and by Bristow. The data do not support a two-dimensional model. An additional finding was that the relationship between the anchors actually fits an orthogonal model better than either the complementary or mutually inconsistent representations proposed by each of the four models. Continued research opportunities are available for those interested in studying career anchor theory.
Keywords
Introduction
An examination of career anchor theory requires a brief look at the broader concept of career theory. Career theory includes two focuses, the external and internal career orientation. The external orientation looks at careers objectively (Bailyn, 1989). From this point of view, careers are studied as a work history or opportunities and constraints given by a specific profession and organization (Tan & Quek, 2001). The employee’s social interaction with others and the organization are the focus of this line of research. Some research topics associated with the external career are career stages, career paths, and the nature of various occupations in society (Derr & Laurent, 1989).
The other point of view, the internal approach to careers, examines how people perceive their work or how they create meaning from interactions with others and their organizations. Here the focus is on the subjective psychological nature of careers and how individuals perceive their careers. Research topics associated with the internal career include career satisfaction, career motivation, and career orientations (Derr & Laurent, 1989). Career anchor theory is one research topic found within the study of the internal careers and is a measure of career orientation.
A career includes both needs of the organization and the needs of the employee. Although the needs of the organization are fairly consistent, each employee has a particular orientation toward work and approaches his or her work with a certain set of priorities and values. These orientations are known as career anchors. A career anchor is a combination of perceived areas of competence, motives, and values relating to professional work choices. Career anchors are the employees’ self-concepts that include talents, motives, values, and attitudes which give stability and direction to a person’s career—a career anchor is the “motivator” or “driver” of that person (DeLong, 1982; Schein, 1975, 1977).
The concept of career anchors evolved from a longitudinal study by Schein (1977) of 44 male Massachusetts Institute of Technology (MIT) Sloan School alumni interviewed for a period of 10–12 years after their graduation. These interviews focused on job history and the reasons participants gave for changes in their careers. While evaluating participant responses, Schein (1978) notes patterns “of self-perceived talent, motives, and values—which serve to guide, constrain, stabilize, and integrate the person’s career” (p. 127). In a series of additional studies during the 1970s and 1980s, Schein (1975, 1977, 1978, 1987) identifies these patterns as “career anchors”. He proposes that career anchors are “that one element in our self-concept that we will not give up, even if forced to make a difficult choice” in our careers (Schein, 1987). The career anchor functions as a framework through which individuals can examine their work experience and determine what kinds of work they want to perform and where they will make their greatest contribution. In this way, they can work toward maximum fulfillment. Schein proposes that development of a career anchor requires time and reflection. During the first few years of work experience, an individual begins to develop a more stable career self-concept, gradually developing his or her career anchor (Schein, 1980). As part of his career anchor theory, Schein identifies eight career anchors: technical/functional competence, general managerial competence, autonomy/independence, security/stability, entrepreneurial/creativity, service/dedication to a cause, pure challenge, and lifestyle (Schein, 1990b; see Table 1 for descriptions).
Profiles for Schein’s Eight Career Anchors.
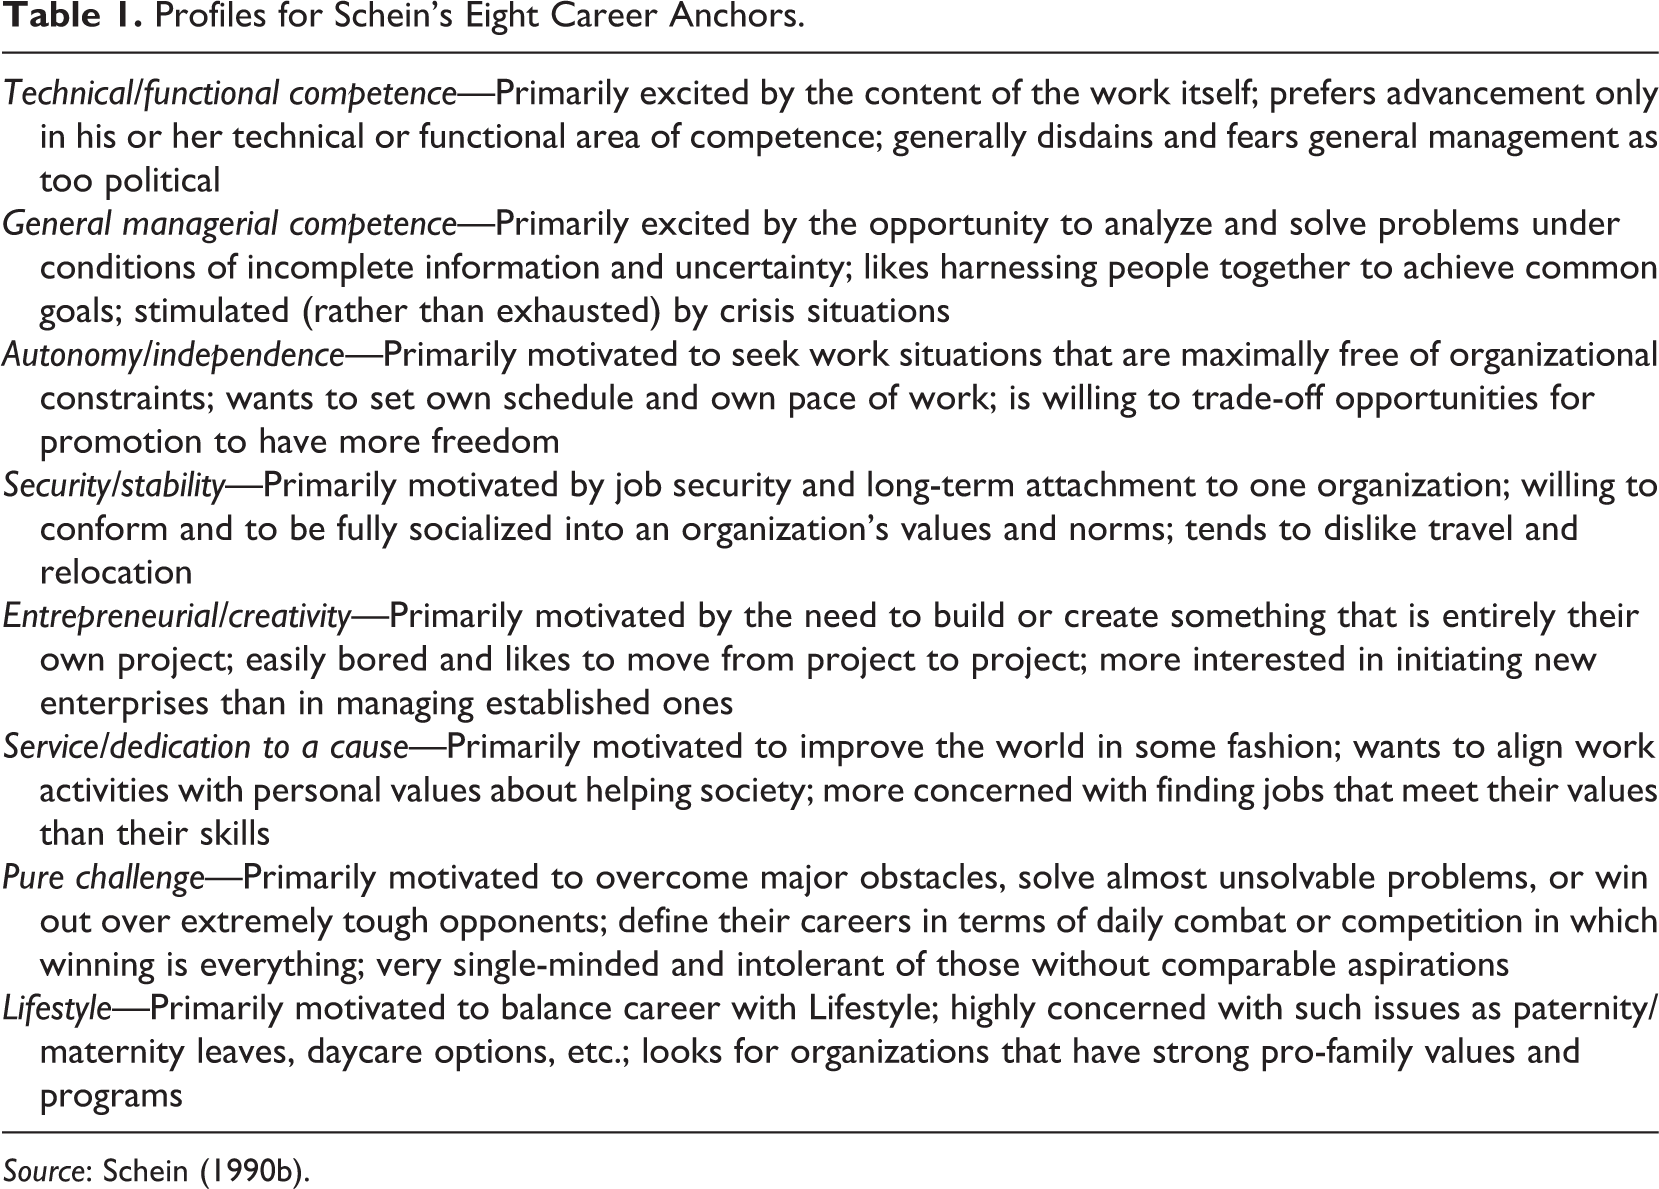
Source: Schein (1990b).
Original Correlation Matrices Taken From Each of the Seven Studies.

Schein’s work made a significant contribution to the way career scholars conceptualize the development of a stable career identity while helping individuals and organizations alike to understand the value of “fit” in career success. According to Feldman and Bolino (1996), Schein’s career anchor model provides four salient points about the formation of a stable career identity. First, career identity is created through concrete experiences in a real work environment. Second, people choose career paths or tracks within an occupation. Thus, a person going into business could take a technical track in business analysis, a managerial track as a general manager, an autonomy track as a business consultant, and so on. Third, the difference between career tracks within a vocation can be as great as the difference between career tracks across industries. For example, the experiences of a business consultant may be very different from the experiences of a general business manager. And fourth, career anchors constrain career choices in predictable ways.
Career anchor theory also provides valuable insight into employee motivation (Barth, 1993) and career development (Evans, 1996). As an employee engages in a career that is consistently aligned with his or her career anchor, work outcomes such as organizational commitment, job satisfaction, retention, and career resilience are enhanced (Coetzee, Schreuder, & Tladinyane, 2007; Ellison & Schreuder, 2000; Hsu, Jiang, Klein, & Tang, 2003; Van Vuuren & Fourie, 2000). For over 35 years, career researchers, corporations, career placement centers, and individuals have used career anchor models to increase employee and organizational success.
The Problem
More than 20 years after Schein’s original introduction of career anchor theory, Daniel Feldman and Mark Bolino (1996), from the University of South Carolina, wrote a critical review of Schein’s career anchor theory, taking aim at both the theoretical and the methodological approaches used by Schein. They propose that Schein’s model is “underspecified theoretically and empirical tests have been far from conclusive” (Feldman & Bolino, 1996). In their critique, they reconceptualize the nature of career anchors by proposing theoretical revisions and alternative methods for measuring and analyzing career anchor data.
Although Feldman and Bolino (1996) propose a number of theoretical and empirical revisions to the career anchor theory, they provide little empirical support for their claims. During the 16 years since Feldman and Bolino’s article was published, many researchers have focused on determining the validity of their claims (Chapman, 2009; Danziger, Rachman-Moore, & Valency, 2008; Danziger & Valency, 2006; Ituma, 2006; Ituma & Simpson, 2007; Quesenberry & Trauth, 2007; Ramakrishna & Potosky, 2003; Suutari & Taka, 2004; Van Dam, 2004). This study continues this line of research by focusing on “the factor structure underlying the career anchor typology,” one of the research approaches recommended by Feldman and Bolino (1996).
Underlying Factor Structure of Schein’s Career Orientation Inventory (COI)
Feldman and Bolino (1996) propose that factor analyses of Schein’s COI are needed to help determine the independence and underlying factor structure of the eight career anchor types. They propose that understanding the relationships between career anchors would lead to a greater knowledge about their meaning for individuals. Specifically, it would clarify which career anchors are complementary (i.e., having congruous characteristics) or mutually inconsistent (i.e., having oppositional characteristics). For example, they propose that technical/functional competence could be complementary with security/stability since both anchors are characterized by the absence of a desire for change in the kind of work performed, company they work for, and location of their employment. Conversely, entrepreneurial/creativity could be mutually inconsistent with security/stability because entrepreneurial/creativity is characterized by change and security/stability by lack of change.
Although many researchers have used factor analyses to explore data collected from the COI, none have assessed the factors for mutual inconsistency or complementary relationships. Instead, they have focused on assessing the internal consistency of various versions of the COI. For example, Nordvik (1996) found a four-factor solution. However, his analysis was based on ipsative data making it difficult to compare his results with other studies. Igbaria, Greenhaus, and Parasuraman (1991) revealed an 11-anchor model in which three of Schein’s anchors (security, technical, and challenge) were each split into two factors. Petroni (2000) factored a condensed version of the COI containing 25 of the original 40 COI indicators and found a nine-anchor solution in which security was split into two factors: job and geographical security. Sumner, Yage, and Franke (2005) found similar results to Petroni; however, their study was conducted with a sample size of 66, too small for adequate analysis according to Danziger et al. (2008). Marshall and Bonner (2003) found a nine-factor solution that divided entrepreneurial creativity into two separate factors. Finally, Danziger et al. (2008) performed CFA and found the same nine-factor result as Marshall and Bonner (2003). While each of these studies gives insight into the nature of career anchors, they all focus on assessing the internal consistency of the COI while making no effort to assess the eight anchors for mutual inconsistency or complementary relationships. This study investigates mutually inconsistent relationships by evaluating the ability of four models proposed in the literature to describe mutually inconsistent career anchor relationships. Data for this study are taken from empirical observations from seven published career anchor studies.
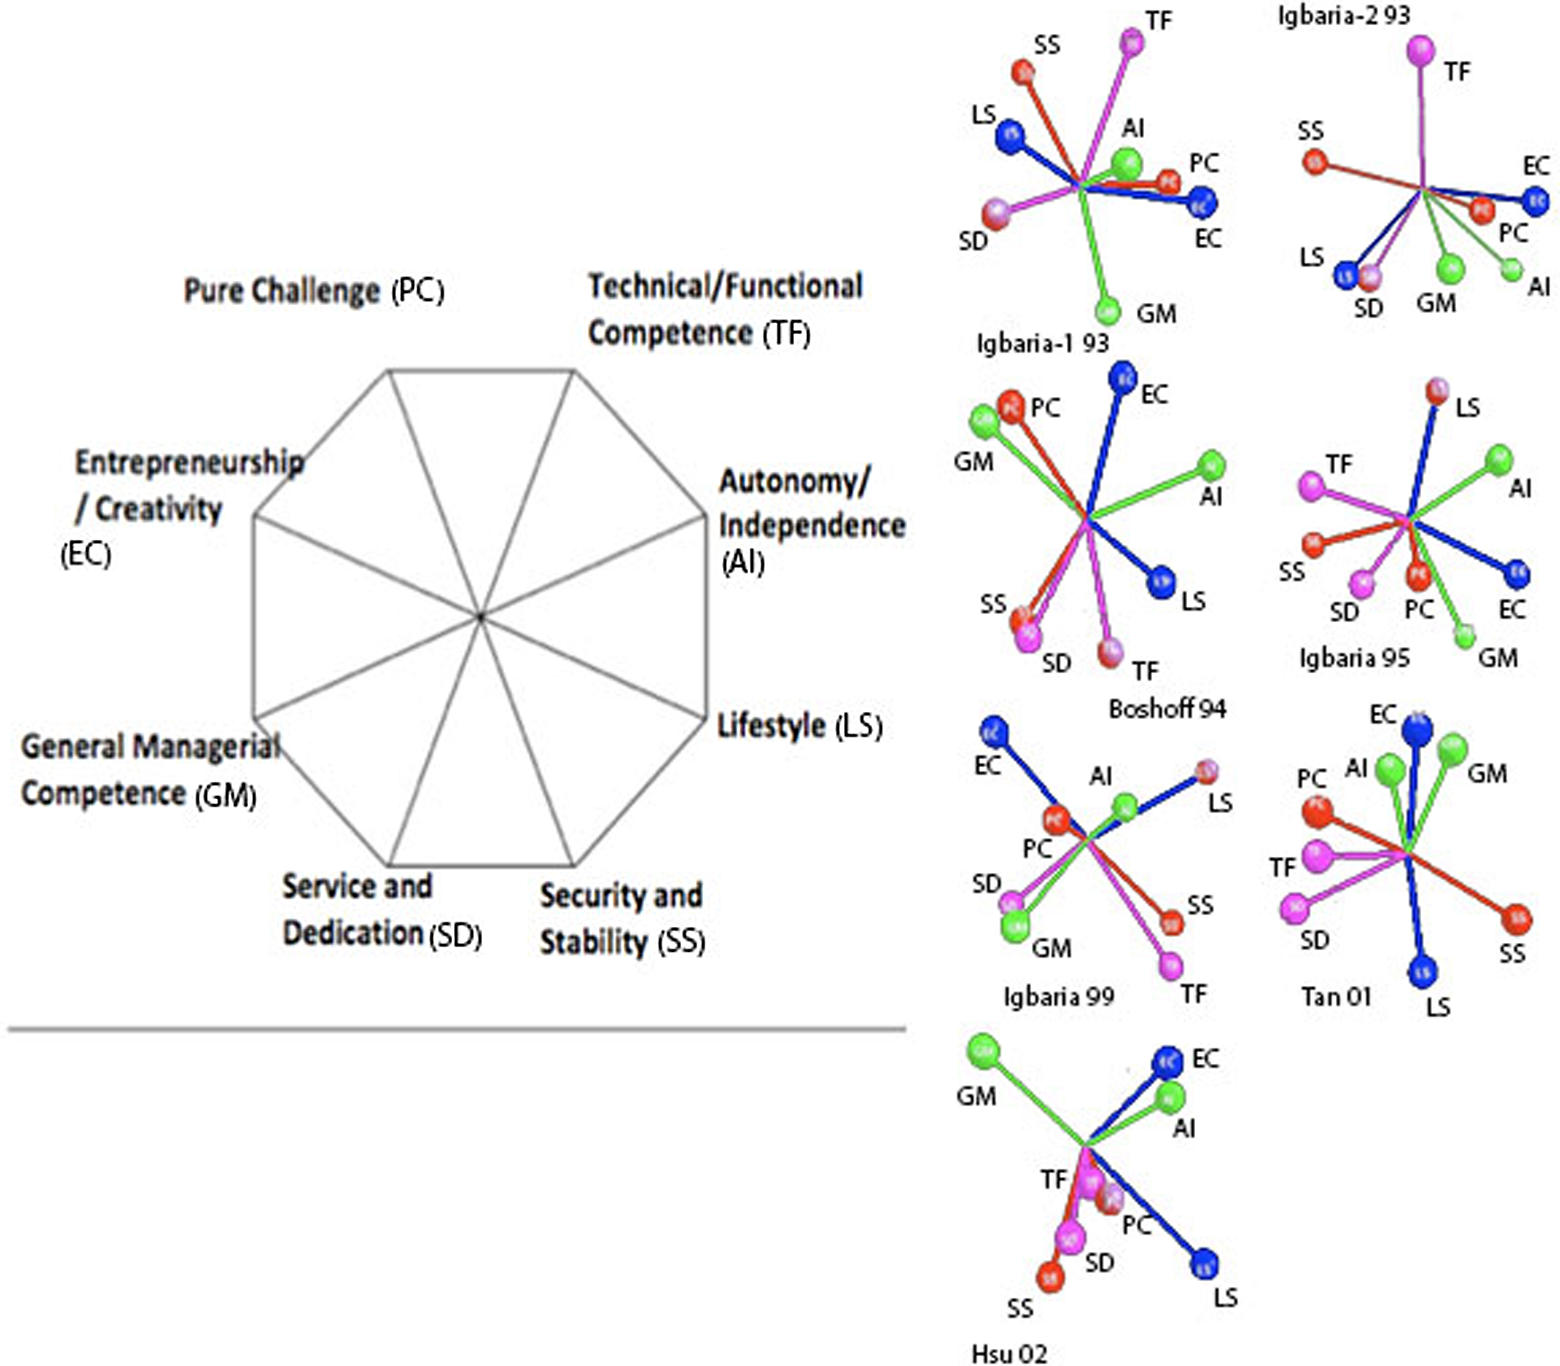
Four models of career anchor relationships are evaluated in this study. First, Feldman and Bolino propose an octagonal model indicating career anchors they believe to be complementary (e.g., entrepreneurial/creativity and autonomy) and mutually inconsistent (e.g., challenge and lifestyle) see Figure 1. They base the relationships in their model on Schein’s descriptions of career anchors and findings from the 1991 Norvik study. Specifically, Feldman and Bolino (1996) expect “security, service, and lifestyle would cluster together,” suggesting complementary career anchors, while entrepreneurial creativity would be mutually inconsistent with security. Although Feldman and Bolino offer this representation as a possible model that defines career–anchor relationships, they provide no empirical support for it.
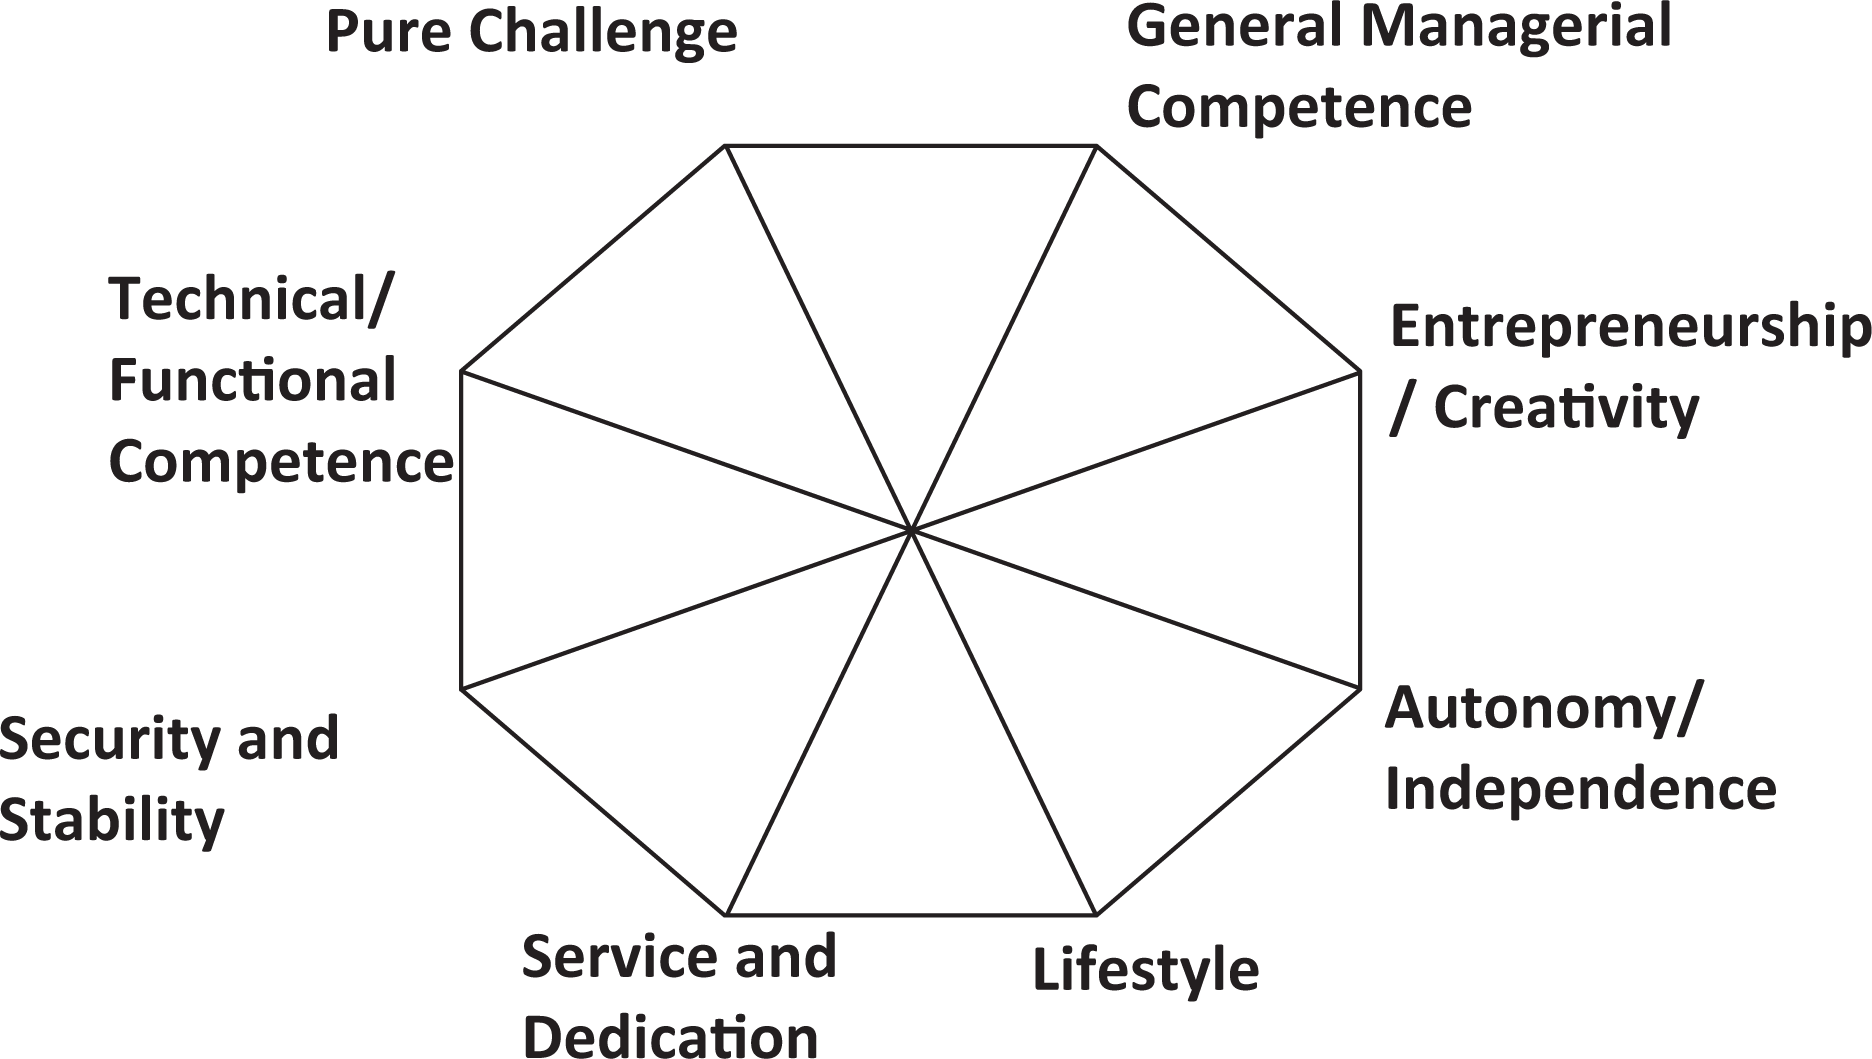
Feldman and Bolino’s proposed octagonal factor structure of career anchors. Source: Feldman and Bolino (1996, p. 106).
Second, Bristow (2004) proposes a career–anchor relationships model based on more than 24 years of experience and research in career anchors. Bristow changes the terminology used for the career anchors to improve clarity for those not familiar with the career anchor model. However, for consistency, Schein’s naming convention will be used for discussion in this study. The changes were as follows: technical/functional became “becoming the expert,” general managerial competence became “leading others,” autonomy/independence became “gaining autonomy,” security/stability became “ensuring security,” entrepreneurial creativity became “fostering innovation,” service/dedication to a cause became “serving others,” pure challenge became “achieving stretch,” and finally, lifestyle became “maintaining balance.” Bristow proposes that pure challenge, entrepreneurial/creativity and autonomy/independence have a complementary relationship, while entrepreneurial/creativity to technical/functional as well as autonomy/independence to security/stability are mutually inconsistent (see Figure 2).

Bristow’s proposed octagonal factor structure of career anchors. Source: Bristow (2004).
Third, Chapman (2009) proposes a career–anchor relationships model developed from data with 1,361 participants of a career development workshop. These data were derived from a version of the COI created by Bristow (2004) that used 28 paired statements to evaluate career anchor preference and resulted in ipsative data. Chapman’s model uses the same career anchor nomenclature as that proposed by Bristow above; however, for clarity, Schein’s naming convention will be used in discussion. In Chapman’s model, entrepreneurial/creativity, pure challenge, and technical/functional group together, suggesting a complementary relationship, while the relationship of security/stability to pure challenge is seen as mutually inconsistent. The relationships proposed in this model are depicted in Figure 3.

Chapman’s proposed octagonal factor structure of career anchors. Source: Chapman (2009).
Finally, Chapman (2009) proposes that a model of mutually inconsistent career–anchor relationships can be derived from Schein’s writings. While Schein believes that individuals have only one career anchor, he proposes that six of his eight career anchors can be seen as dichotomies: technical/functional versus general managerial, security/stability versus autonomy/independence, and entrepreneurial/creativity versus service/dedication to a cause (Schein, 1990a). Chapman (2009) proposes that these three pairs, along with a fourth pair created from the remaining two career anchors, form a model of career anchor exclusivity that reflects Schein’s understanding of how career anchors relate to each other. The relationships proposed in this model are depicted in Figure 4.

Schein’s proposed structure of mutually inconsistent pairs, based on his suggestion of dichotomous relationships.
In order to compare all four models, this study will test the following two hypotheses.
Hypothesis 1: The mutually inconsistent career anchor pairs proposed by Feldman and Bolino will have stronger negative correlations with one another than pairs proposed by the other three models.
Hypothesis 2: The mutually inconsistent career anchor pairs proposed by Feldman and Bolino will have on the whole a better fit from CFA than those proposed by the other three models.
Method
Data Sources
A search in the literature for all articles pertaining to Schein’s career anchor model was conducted using both EBSCO and Psych info databases. Terms used to search these databases were career anchors, Edgar Schein, Career Orientations Inventory, career anchor studies, and career orientation. A review of references in each paper was also done to determine additional studies that met the study inclusion criteria. Approximately 90 articles/books were gathered from these searches. A review of these articles and books provided the necessary information to complete a thorough literature review of the topic of career anchors since Schein’s initial MIT study began in 1961 (Schein, 1971).
For inclusion in this analysis, studies were required to meet the following criteria: First, each study needed to have used a form of Schein’s COI (Igbaria & Baroudi, 1993; Schein, 1985, 1990b). Although there are additional inventories in the field (DeLong, 1982a; Derr, 1980), the focus of this study was specifically emphasizing Schein’s version. Second, the study needed to provide a correlation matrix to allow for the completion of a factor analysis of the eight career anchors.
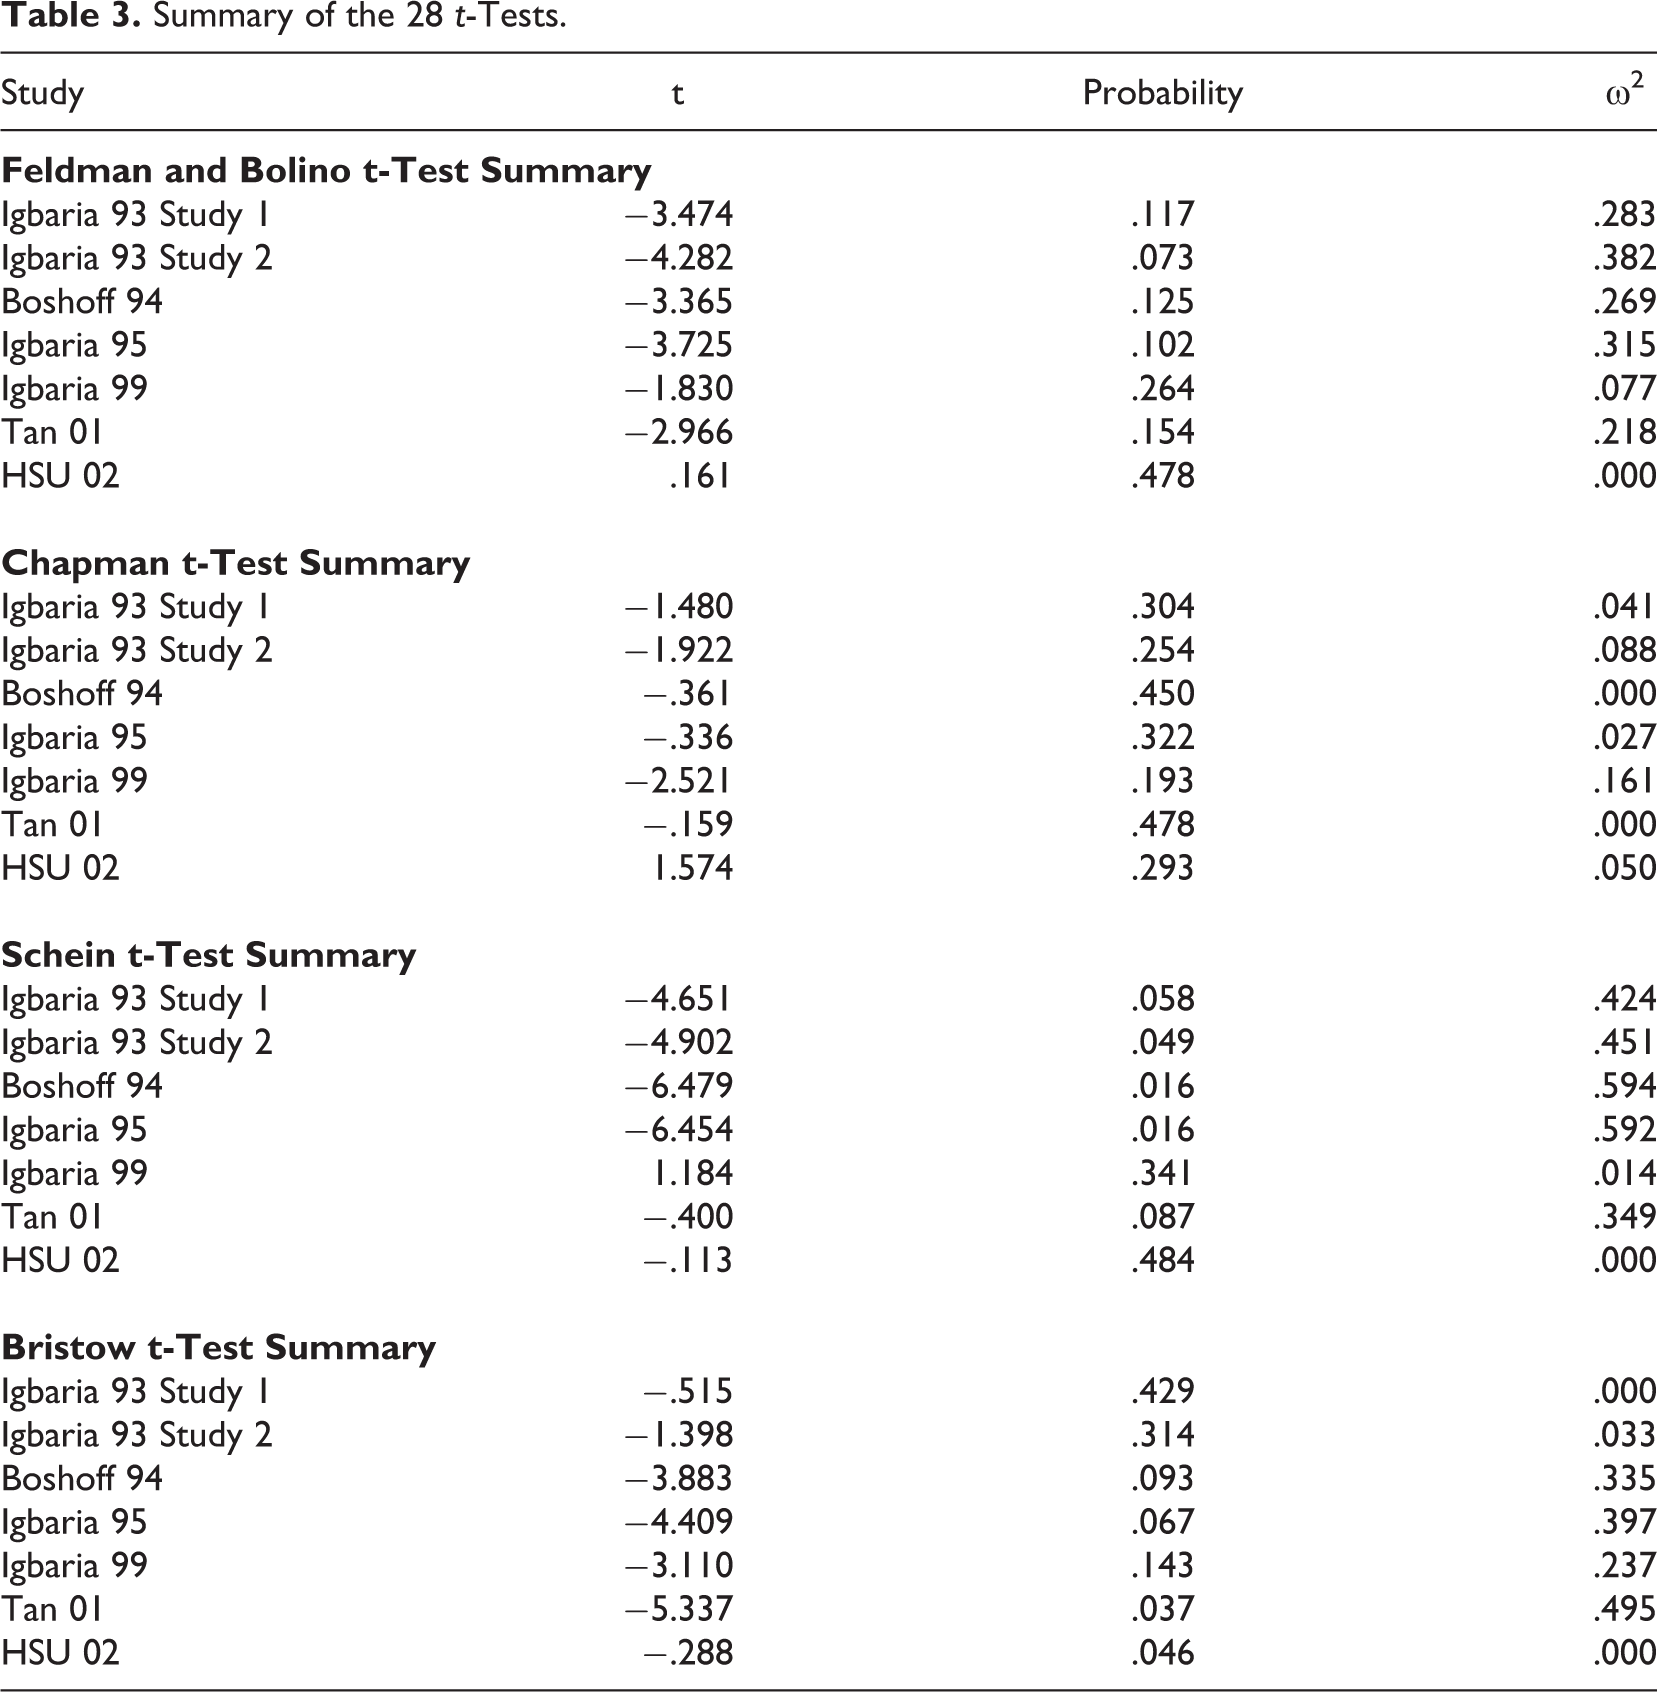
Approximately half of the articles were theoretical in nature and did not include quantifiable data. Based on the above criteria, secondary data containing information about career anchor relationships (correlation matrices) were obtained from seven past studies (Table 3). These data were used to test the four models of mutually inconsistent career anchors described above. The studies included four by Igbaria et al. (Igbaria & Baroudi, 1993; Igbaria, Kassicieh, & Silver, 1999; Igbaria, Meredith, & Smith, 1995), one by Boshoff, Bennett, and Keelerman (1994), one by Tan and Quek (2001), and one by Hsu et al (2003).
Summary of the 28 t-Tests.
The findings of several additional studies appeared to be relevant; however, they were not included in this study because they did not meet the requirement of providing a correlation matrix (Coetzee et al., 2007; Danziger et al., 2008; Danziger & Valency, 2006; Igbaria et al., 1991; Van Vuuren & Fourie, 2000). These papers focused on topics unrelated to the relationships between career anchors including the factor structure of the COI, the relationships between career anchors and other constructs such as organizational commitment, and the distribution of career anchors among specific populations. Effort was made to contact these researchers to access their data; however, only two responded and neither were able to provide correlation matrices from their studies. It is unclear what impact the data from these studies would have had upon the findings of this study.
Approximately 2,700 total individuals participated in the seven included studies. Countries represented by these studies include the United States, South Africa, Israel, and Singapore. Multiple professions were represented including: education, information systems, research and development, accounting, medicine, dentistry, law, psychology, and so forth. Of the total participants, 62% were male and 38% were female. The largest study was done by Boshoff et. al (1994) with 1791 employees and 15 professions participating. The smallest was Igbaria et. al (1999) with only 78 employees participating.
Explanation of the Career Orientations Measurements Used in These Studies
Several versions of the COI have been created since Schein began measuring career anchors. Three of the studies (e.g., Boshoff et al., 1994; Hsu et al., 2003; Igbaria & Baroudi, 1993) used a version the COI created by Schein in 1985. This version split security into job and geographic security (1985). Tan and Quek (2001) used a version that Schein created in 1990 that maintains the original eight career anchors without a distinction between job and geographic security. Igbaria et al. (1993) created a short version the COI from Schein’s 1985 version that only uses 25 of Schein’s 40 items to determine the employee’s career orientation. Three of the studies used this version of the COI (Igbaria & Baroudi, 1993; Igbaria et al., 1995; Igbaria et al., 1999).
Data Analysis
It should be mentioned that the factor analysis applied in this study differs somewhat from the way Nordvik (1996), Igbaria et al. (1991), Petroni (2000), Sumner et al. (2005), and Danziger et al. (2008) used it to establish the internal validity of the questionnaire. Whereas they factor all COI items to identify a factor structure corresponding to the anchors, in this approach we created a factor structure from the correlations among the eight career anchors to test holistic fit of the various models (Feldman and Bolino, Chapman, Schein, and Bristow) with regard to the factor structure. The method to be used here is the principle component method of factor analysis, which is simpler than the common factor model and makes fewer assumptions and demands of the data. In fact, this method can be thought of a just a particular linear combination of variables to a least squares criterion (as is principal component analysis), but on standardized data rather than unstandardized data (as is usual with principal component analysis).
Career anchor relationships were determined using the correlation matrices provided in each of the seven source studies. Each original matrix that used the nine-factor model was transformed to fit the eight-factor model that was tested. This was done by averaging the two correlations of the career anchors being combined (e.g., job security averaged with geographic security). Analyses using t-tests, CFA, and principal component plot from the principal component method of exploratory factor analysis (EFA) were used to test the ability of the four models described above to describe the mutually inconsistent relationships found in the data from seven studies. In addition, complementary relationships in those studies were evaluated using plots from the principal component method of EFA.
The t-tests of Seven Correlation Matrices
Using Fisher’s r to z transformation (Silver & Dunlap, 1987), each 8 × 8 correlation matrix (i.e., from all seven studies) was transformed into a z-score matrix in preparation for calculating t-tests. Next, for each model, t-tests were run on the resulting z-score matrix comparing the proposed mutually inconsistent anchor pairs against all other pairs. Finally, p values and percent of variance accounted for (strength of effects, ω2) for Feldman and Bolino’s proposed mutually inconsistent pairs were compared with those of the other three models (Table 3).
Confirmatory Factor Analysis of Seven Correlation Matrices
Each of the four proposed models suggests polar opposite mutually inconsistent factors. Specifically, Feldman and Bolino suggest mutually inconsistent relationships between general managerial and service/dedication, between security/stability and entrepreneurial/creativity, between technical/functional and autonomy/independence, and between pure challenge and lifestyle (see Figure 1). Bristow’s model suggests mutually inconsistent relationships between general managerial and service/dedication, between pure challenge and lifestyle, between technical/functional and entrepreneurial/creativity, and between autonomy/independence and security/stability (see Figure 2). Chapman’s empirical model suggests mutually inconsistent relationships between security/stability and pure challenge, between technical/functional and service/dedication, between general managerial and autonomy/independence, and between lifestyle and entrepreneurial/creativity (see Figure 3). Conversely, the proposed Schein model suggests mutually inconsistent relationships between technical/functional and general managerial, between autonomy/independence and security/stability, between service/dedication and entrepreneurial/creativity, and between pure challenge and lifestyle (see Figure 4). These four models were each tested against the seven empirical data sets using CFA.
Using GEFA, a generalized factor analysis model and software (Blahus, 2001), allows the matrix of uniquenesses (residual covariance matrix not explained by the prescribed structural factor model) to not be necessarily diagonal, and, unlike the classical model, to have prespecified nonzero off-diagonal elements. This slight mathematical generalization enables one to prescribe a series of different specific models as its special cases.
With the proposed factor models, four idealized factor loadings for each career anchor model were created. The relationship between two anchors in each loading was defined by placing the number one by mutually inconsistent anchors and zeros by the remaining anchors in each of the four idealized factor loadings. If the proposed models were correct, the data would show a negative correlation between each of the four-paired factors.
The first step in testing each of the proposed models against each of the data sets was to examine the residual correlations unexplained by the proposed model. The standard used to determine fit was that all unexplained residual correlation should be smaller than .10 in absolute value. The second step was to look at the uniqueness in the diagonal of the residual correlation, specifically making sure that the diagonal is positive, even zero diagonal values are not acceptable since they suggest an improper solution. Third, the intercorrelations of the hypothesized correlated factors where checked to make sure that they did not exceed 1.00 absolute value. And finally, the final estimation of loadings was evaluated to determine if a negative relationship was present. For example, a score of 1 and −1 would suggest a perfect negative relationship or a strong measure of mutual inconsistency. The results were used to test Hypothesis 2 that the Feldman and Bolino career anchor model will have a better fit to the data than the other three models.
Exploratory Principal Component Plots
The final analysis was completed using the principal components method of EFA to create principal component plots. These plots give holistic visual information about the complementarities and the mutually inconsistent pairs found to be best fitting from the tests of Hypothesis 2.
Results
It is interesting to note that very few correlations were actually negative. In fact, of the 196 correlations calculated from the seven matrices, only 36 correlations coefficients were negative.
The t-tests of seven correlation matrices
A t-test was completed for each of the seven data matrices, comparing the average r to z of the correlations of the four mutually inconsistent pairs with the average r to z for correlation of the remaining pairs. A total of 28 t-tests were performed comparing each of the seven matrices to each of the four models. Only 4 of the 28 t-tests were found to be significant at a probability score of less than .05. Three of the four t-tests with significant results (p value less than .05) were found when evaluating Schein’s mutually inconstant pairs in the context of Igbaria (1993, study 2), Boshoff (1994), and Igbaria (1995). Their probability values were .049, .016, and .016, respectively. The fourth significant result came from comparing the Tan 2001 data set with Bristow’s proposed mutually inconsistent pairs producing a probability value of .037. This t-test approach indicated which studies are able to significantly demonstrate the correlative relationship.
The effect size calculations on all 28 t-scores were calculated using the ω2 calculation. Of the three statistically significant t-tests from Schein’s mutually inconsistent pairs discussed above, Igbaria 1993 study 2 had an ω2 of .451, Boshoff 1994 had an ω2 of .594, and Igbaria 1995 had an ω2 of .592. The one data set compared to Bristow’s mutually inconsistent pairs that was found significant had an effect size of .495. The importance of including an effect size calculation has been clearly identified by Wilkinson and the 1999 Task Force on Statistical Inference (Wilkinson & Inference, 1999) and others (Brown & Hedges, 2009).
CFA of seven correlation matrices
Using the proposed models, idealized factor loadings for each model were created for each of the four pairs. The proposed idealized factor loadings structure for each of the four conceptual models was created by placing each mutually inconsistent pair (proposed by the model) within a single latent variable (factor). A strong test of mutual inconsistency would require that one of the two would load positively and one negatively upon that latent variable. A CFA of the eight career anchors was completed using both the method of least squares and the method of maximum likelihood on all 28 possible combinations of study matrices and the four proposed models of mutually inconsistent pairs, producing 56 CFA results.
None of the 56 CFAs produced interpretable results. Of the 56 CFAs, 55 had correlations among the factors (latent variables) greater than one, an unrealistic result. The CFA of the HSU 2002 matrix with Chapman’s proposed model, using the method of maximum likelihood, was the only analysis that had intercorrelations that did not exceed 1.00 in absolute value, suggesting that the CFA produced nearly interpretable results. Yet, an evaluation of the uniqueness in the diagonal of the residual correlations for this analysis shows zeros and negative numbers suggesting improper solutions. These artificial or nonsensical results indicate that the proposed models of mutually inconsistent pairs do a very poor job of fitting with the data. In an effort to optimize the solution, GEFA offered unrealistic numerical values for the correlations and diagonal of the residual correlations.
Exploratory principal component plots
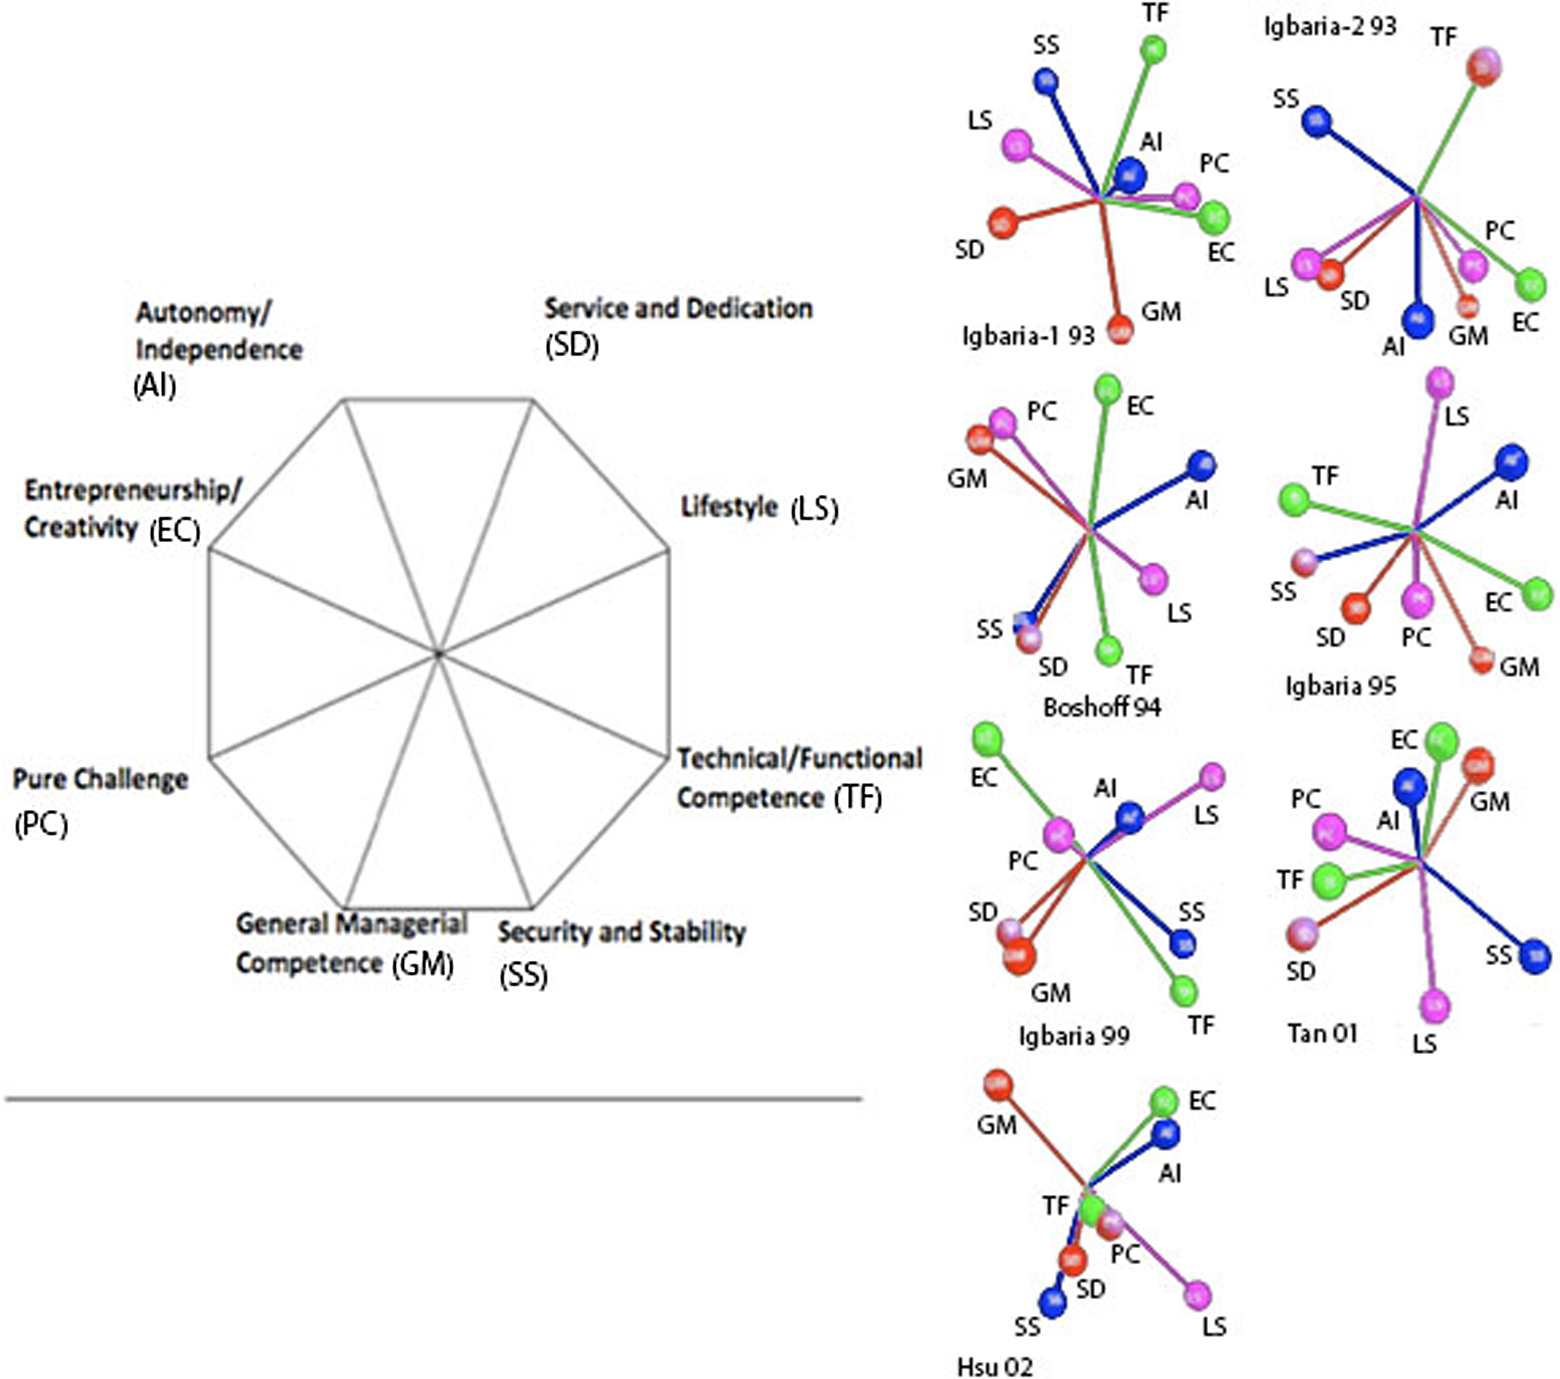
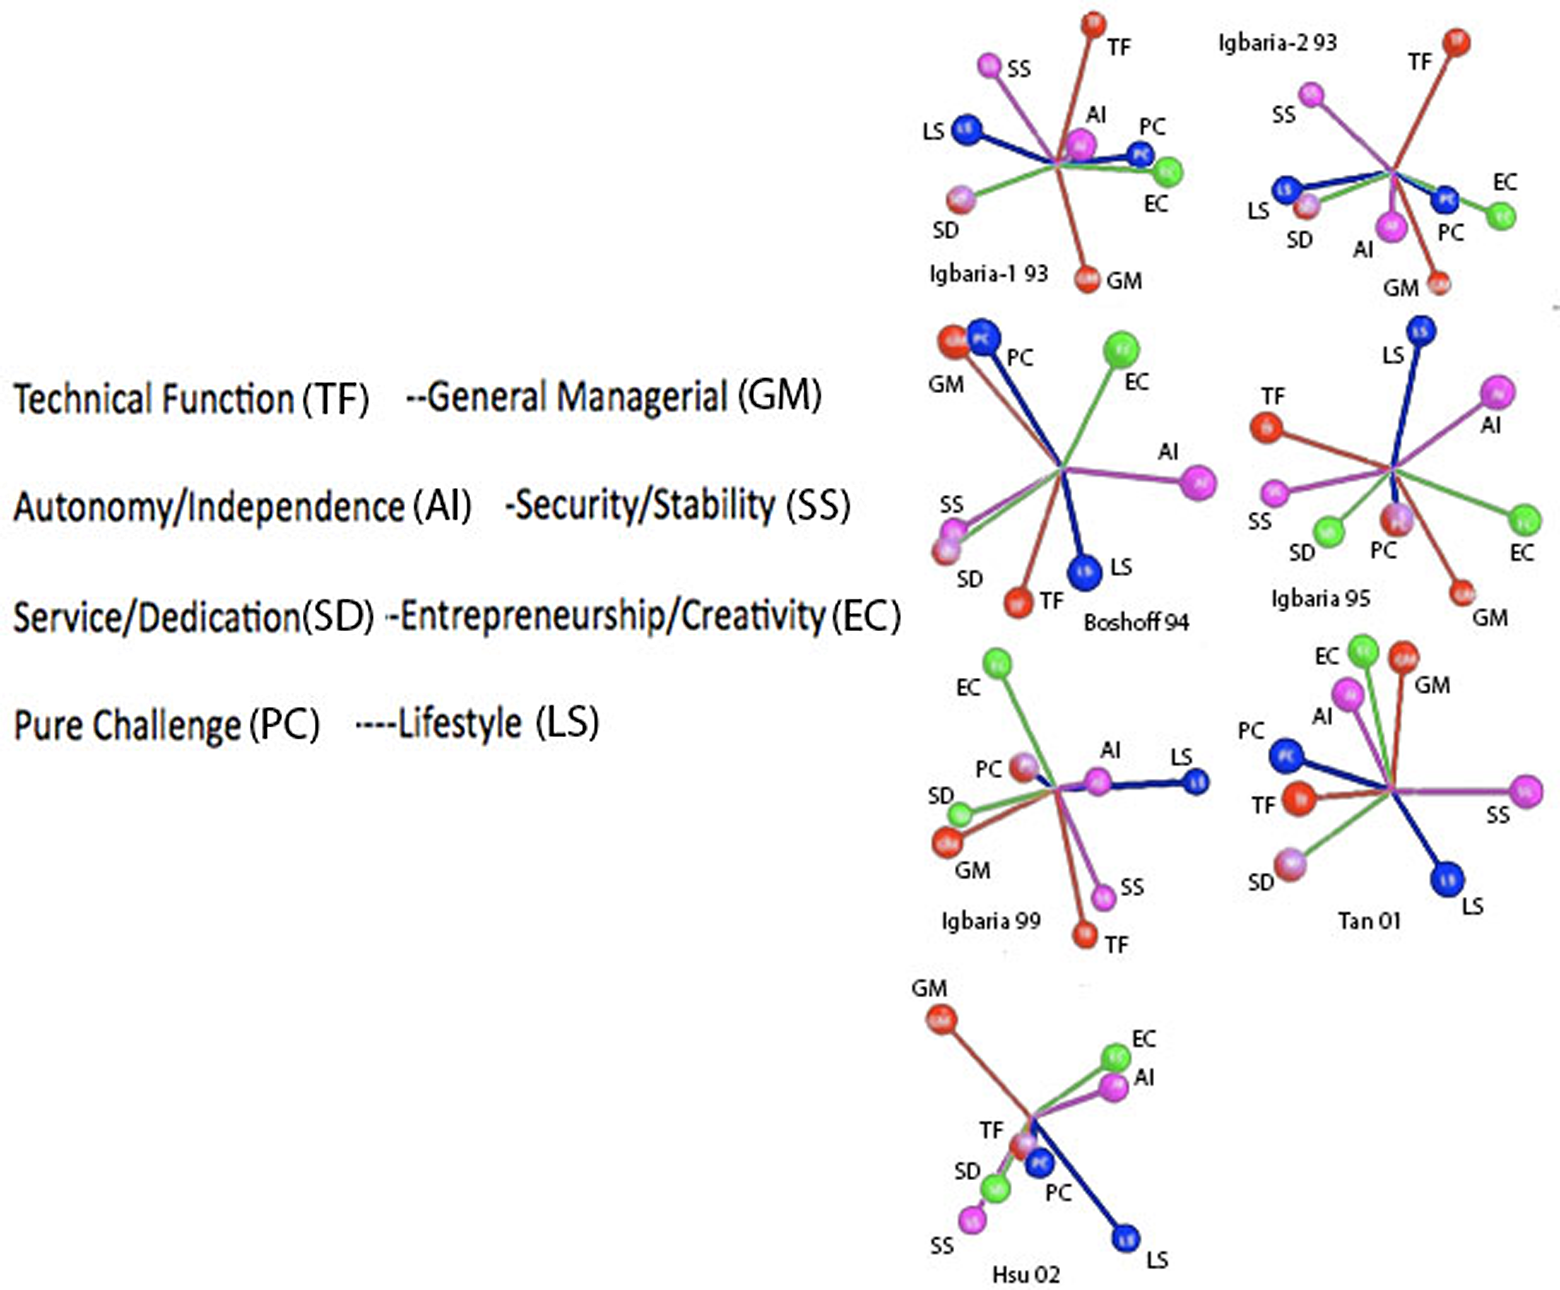
Using the principal components method of EFA, each of the seven correlation matrices was used to determine factor loadings for each of the eight anchors. These factor loadings are used to generate three-dimensional visual representations of the data. Using a color-coding system for each of the four models, 28 different graphical representations of the proposed mutually inconsistent pairs are generated from the data. Figures 5 –8 show all 28 visual depictions with seven datasets for each of the four proposed models. The relationship is shown graphically in a three-dimensional space. On average, these principal component plots account for about 60–65% of the variance in the eight anchor vectors within a three-dimensional space. These three-dimensional images suggest a more orthogonal or independent relationship between the anchors than what is proposed to be negatively correlated, that is, mutually inconsistent. These images also illustrate a great deal of dissimilarity between data sets; in other words, the career anchor relationships are quite different from one data set to another.

Three-dimensional displays of the eight career anchor vectors from principal components analysis of the seven correlation matrices, color coded according to Feldman and Bolino’s mutually inconsistent pairs. Source: (Feldman & Bolino, 1996,P. 106).
Three-dimensional displays of the eight career anchor vectors from principal components analysis of the seven correlation matrices, color coded according to Bristow’s mutually inconsistent pairs. Source: (Bristow, 2004).
Three-dimensional displays of the eight career anchor vectors from principal components analysis of the seven correlation matrices, color coded according to Chapman’s mutually inconsistent pairs. Source: (Chapman, 2009).
Three-dimensional displays of the eight career anchor vectors from principal components analysis of the seven correlation matrices, color coded according to Schein’s mutually inconsistent pairs.
While the principal component plots provide some insight into career anchor relationships it is difficult to make any claims about the data by just “eyeballing” them. To quantify the relationships between the anchors, each correlation matrix was used to calculate the angles of each pair by taking the arccosine of the correlations. Table 4 shows the results of these calculations. A 90° angle between the origin and two data points indicates the relationship between two career anchors is orthogonal or independent. Angles less than 90 degrees were considered to have a weak to strong complementary relationship the closer the angle was to zero. For example, an angle of 5° would suggest a strong complementary relationship while an angle of 80° would suggest a weak complementary relationship. On the other hand, those angles greater than 90°were considered to have a weak to strong mutually inconsistent relationship the closer the score was to 180°. So an angle of 175° would suggest a strong mutually inconsistent relationship while an angle of 100°would be considered a weak mutually inconsistent relationship. Of the 196 possible angles, 160 were less than 90° with the average angle of 75.1°. Thirty-six angles were equal to or greater than 90°. The average angle of this group was 97.3°. The largest angle was 111.7° and the smallest angle was 49.5°. It is interesting to note that all angles fell within a 62.2° range of each other.
Matrices of Angles Between Vector Pairs.

Of the 28 possible matches, Schein’s proposed mutually inconsistent pairs were higher than 90° nine times, Feldman and Bolino’s as well as Bristow’s paring angles were higher eight times, and Chapman’s were higher six times. Feldman and Bolino’s mutually inconsistent pairing of stability/security with entrepreneurship/creativity had an angle over 90° most often, with five of the seven matrices showing an angle greater than 90°. Feldman and Bolino also had the lowest scoring pair with technical/functional compared to autonomy not having one matrix showing an angle greater than 90° for any of the studies.
In exploring the relationships between factors, it was found that five of the seven matrices suggest a somewhat mutually inconsistent relationship between general managerial—lifestyle and entrepreneurial/creativity—security/stability. In four of the seven studies, general managerial was somewhat mutually inconsistent with technical/functional. Three studies found the following three combinations somewhat mutually inconsistent; general managerial with security/stability, pure challenge with security/stability, and entrepreneurial/creativity with technical/functional.
Also worthy of note was that Tan 2001 did not have 1 of the 28 possible combinations with a calculated angle that was greater than 90°. HSU 2002 was not much better, with only one. Although general managerial paired with lifestyle and also security/stability gave fairly good evidence for being mutually inconsistent, none of the four proposed models included them as a pairing. Also, three of the four models had pure challenge and lifestyle as mutually inconsistent; yet, only two studies had it as empirically somewhat mutually inconsistent.
Discussion
Hypothesis 1 suggested that the mutually inconsistent career anchor pairs proposed by Feldman and Bolino would have stronger negative correlations with one another than those proposed by the other three models. In order to test this hypothesis, t-tests, probability values, and ω2 statistics (effect size) were calculated on each of the 28 different combinations of the seven matrices with the four proposed models. A review of the data shows that none of the seven t-tests for Feldman and Bolino’s or Chapman’s model reach a statistically significant p value of less than .05, suggesting that for each correlation matrix, the correlation between proposed mutually inconsistent pairs are not significantly different from the other pairs. The t-tests calculated using Bristow’s model provide only one statistically significant probability score. The comparison of Tan 2001 with Bristow’s model produce a probability score of .037 and an ω2 of .495, suggesting that Bristow’s proposed mutually inconsistent pairs were significantly different from the other pairs in the Tan 01 data set. Schein’s model performed the best in the t-test analysis with three of the seven data sets generating a p value less than .05. Overall, Schein’s model outperformed all models on the measure of statically significant differences in correlations.
As was discussed earlier, only 36 of the 196 correlated pairs had a negative relationship. Since the majority of the correlations were positive, it was difficult to show a “stronger negative correlation” between the models as stated in Hypothesis 1. Instead, the evaluation used was the size of the correlations. The smaller the averaged correlations, the better the model was at determining mutual inconsistency.
Feldman and Bolino’s proposed mutually inconsistent pair correlations were not statistically significant nor were they significantly smaller than those proposed by the other models. In fact, both Schein and Bristow’s models performed better on these measures. Feldman and Bolino did outperform Chapman with smaller correlations. Based on both the t-test and the size of correlations, Hypothesis 1 was not supported.
It is important to remember that the criterion for suggesting Feldman and Bolino’s model as the strongest model was the fact it had been included in a peer-reviewed journal while each of the other three models were not. Although a peer-reviewed, published model seemed to be the logical choice in comparison to the other three unpublished models, this criterion was not supported by the data.
One of the most interesting findings is that Schein’s proposed mutually inconsistent pairs did so well. While Schein (1990a) believes that individuals have only one career anchor, he suggests that six of his eight career anchors can be seen as dichotomies: technical/functional versus general managerial, security/stability versus autonomy/independence, and entrepreneurial/creativity versus service/dedication to a cause. Chapman (2009) took these three pairs, along with a fourth pair created from the remaining two career anchors and formed a model of career anchor mutual inconsistency that reflects Schein’s understanding of how career anchors relate to one another. In essence, this model was developed ad hoc rather than purposefully proposed. Although Schein may never have intended to describe mutually inconsistent pairs, he seems to have had a superior understanding of how the anchors related, perhaps because of his qualitative approach in originating this work.
Hypothesis 2 asserts that the mutually inconsistent career anchor pairs proposed by Feldman and Bolino would have, on the whole, a better fit from CFA than those proposed by the other three models. A cursory review of the CFA results suggests that Schein’s also emerges as the better-fit model considered as a holistic pattern. The fit function values, a summary statistic for the goodness of fit provided by GEFA, all suggest that Schein’s model does the best job of fitting the data sets, followed by Feldman and Bolino, then Bristow, and finally Chapman. Based on this analysis, Hypothesis 2 should be rejected. Yet, a more thorough review of the results suggests the need for additional inquiry. As explained above, GEFA allows the researcher to force the fit of the matrices. If the matrices do not fit, suggesting an unrealistic hypothesis, GEFA will produce nonsensical results by trying to fit the proposed model in a way that optimizes the solution, that is, minimizes the fit function, by offering unrealistic numeric values (Blahus, 2001). For all of the 56 CFAs, GEFA optimized the solution by minimizing the fit function models and the data with unrealistic values. Based on these results, none of the hypothesized models were a good fit with the data from the seven matrices. The strong mutually inconsistent octagonal models proposed by Feldman and Bolino and later by Chapman and Bristow were not supported by the data. This finding was consistent with Chapman’s (2009) assertion that “the relationships between career anchors are complex and not easily represented in two dimensions as Feldman and Bolino suggested with their octagon diagram”. Although surprising, the conclusion from these 56 CFAs was that none of the proposed models provides a strong fit for mutual inconsistency between the career anchors. Thus, there is a significant disconnect between the proposed models and the data sets. Although none of them are a good fit, Schein’s model is the best of the four models in regard to fit. This finding is also exhibited in the analyses of the angles representing the relationship between career anchors. In the final analysis, of the four poorly performing models, Schein’s seemed to be the least poor, thus also failing to support Hypothesis 2.
Both principal component plots and the analysis of angles yield significant insight into the mutually inconsistent and complementary relationships of career anchors. While CFAs indicated that all four models are a poor fit for the data gathered from empirical studies, it does little to illuminate why. However, three-dimensional representations of each matrix help clarify. First, each proposed model suggests a two-dimensional relationship between the career anchor pairs, configured in the shape of an octagon. Each anchor has a mutually inconsistent anchor at the opposite end of the octagonal model and two complementary anchors evenly represented on each side of each anchor. For example, in the Feldman and Bolino model, pure challenge’s mutually inconsistent anchor is lifestyle, and technical and managerial competence represents its complementary anchors. Yet, the principal component plots show a more orthogonal (i.e., unrelated, rather than opposite) relationship between career anchors. In fact, the visual depictions of the data seem to suggest a more orthogonal and possibly slightly complementary rather than a mutually inconsistent relationship is more pervasive among career anchors. This finding is consistent with the findings found by examining the angles.
Key conclusions from these findings include the following. First, relationships between career anchors tend to be more orthogonal and slightly complementary rather than mutually inconsistent. Even the career–anchor pairs with angles consistently over 90°, suggesting a mutually inconsistent relationship, have only a weak mutually inconsistent relationship at best. For example, five of the seven studies show a weak mutually inconsistent relationship between general managerial and lifestyle, as well as security/stability and entrepreneurial/creativity based on the metric of an angle greater than 90°. Yet, the average angle is 93.2° and 93.5°, respectively, clearly a weak mutually inconsistent relationship. In fact, the largest angle found is 111.7°, only 21° away from orthogonal. The overall average angle is 79.2° once again suggesting an orthogonal to slightly weak complementary relationship between the anchors.
One reason for this finding may be the nature of Schein’s COI. First, the method of measurement used in each of Schein’s COI surveys is a Likert-type scale. Each anchor has a series of up to five questions, which is used to determine the participant’s score on each of the eight anchors. Each of these inventories was evaluated for internal consistency (Danziger et al., 2008; Danziger & Valency, 2006; Igbaria & Baroudi, 1993) and the results suggest an independence between factors. The questions used are specifically written to produce independent relationships. Thus, it would make sense that the relationships between factors (anchors) would be independent or orthogonal.
Second, of the possible 28 pairings, only 6 pairings have more than three angles greater than 90° supporting a somewhat weak mutually inconsistent relationship between those least related pairs of anchors as a whole. The pairings are as follows. Five of the studies found general managerial and lifestyle as well as entrepreneurial/creativity to have a weak mutually inconsistent relationship. Four studies found general managerial somewhat mutually inconsistent with technical/functional. Three of the studies found general managerial and security/stability, pure challenge and security/stability, and entrepreneurial/creativity and technical/functional somewhat mutually inconsistent. It is interesting to note that general managerial appears to be most inconsistent with other anchors. No real significant patterns were found in regard to complementary relationships.
In general, the relationships found in each study are somewhat different from one another. This suggests that variations in the studies account for career anchor relationships more than inherent characteristics of the anchors themselves. Possible study specific factors that could affect the observed relationships between career anchors could include demographics, such as industry surveyed, gender, or cultural background.
Future Research
Based on this study, it appears that the proposed models do not stand up to empirical data testing. It should be a consideration for future research to determine if the way the data are gathered impacts the study. For instance, the Likert-type scale may impact the relationships. It could be that participants do not tend to differentiate when using a Likert-type scale. Instead, respondents may be indicating that all anchors represent them, thus creating low correlations. This acquiescence bias may frustrate Schein’s contention that individuals are required in difficult career decisions to sacrifice some values for others, using their true career anchor as a guide. Future research in this area should determine whether it is possible to find a scaling model that could allow the models to fit the data.
Conclusion
This study attempted to evaluate the underlying factor structure of career anchors as called for by Feldman and Bolino in 1996. Specifically, they proposed that understanding the underlying factor structure of the COI would give insight into the relationships between multiple career anchors. These relationships describe which career anchors are complementary (i.e., having congruous characteristics) or mutually inconsistent (i.e., having oppositional characteristics) and enable a study of the degree to which those relationships affect career outcomes. This study examined how well each of the four models of career anchor relationships, found in the career anchor literature, described mutually inconsistent relationships within data from seven empirical career anchor studies. The mutually inconsistent career anchor pairs suggested by Feldman and Bolino are not found to have smaller and/or more negative correlations with one another than those proposed by the other three models. Feldman and Bolino’s mutually inconsistent pairs are also not found to have, on the whole, a better fit than those proposed by the other three models based on CFA. Instead, a mutual inconsistency model based on Schein’s writings is the best, albeit, a weak fit, to the empirical data from the seven studies. Weaknesses are also found in the two-dimensional octagonal model proposed by Feldman and Bolino, Chapman, and Bristow. In fact, the data suggest that, consistent with Chapman’s proposal, a two-dimensional model is incapable of representing career–anchor relationships well. The relationship between the anchors actually fits an orthogonal model better than either the complementary or mutually inconsistent representations proposed by each of the four models investigated in this study.
Footnotes
Declaration of Conflicting Interests
The author(s) declared no potential conflicts of interest with respect to the research, authorship, and/or publication of this article.
Funding
The author(s) received no financial support for the research, authorship, and/or publication of this article.