
Abstract
This study explored the measurement equivalence of a recently developed multiscale measure of career indecision (Career Indecision Profile-65; CIP-65). Previous research had supported a four-factor structure of the CIP-65 in U.S. college students with factors appearing to measure (a) neuroticism/negative affectivity, (b) choice/commitment anxiety, (c) lack of readiness, and (d) interpersonal conflicts. The current study employed multiple groups confirmatory factor analyses to test whether the four CIP-65 factors are measured equivalently in the United States and Iceland. Results revealed that the four-factor structure fit both U.S. and Icelandic samples, but that two of the factors (choice/commitment anxiety and Interpersonal Conflicts might hold different psychological meanings in the two countries (i.e., factor loadings were not invariant). Some explanations for the lack of invariance in factor loadings are offered along with suggestions for future research and implications for practice.
Making career decisions is a ubiquitous fact of life for most individuals around the world. Whether such decisions are freely made or severely constricted, the fact remains that most people engage in work during their lives, and a large body of research has emerged over the last half-century exploring factors that might interfere with (or facilitate) individuals’ abilities to make satisfying career choices. Brown and Rector (2008) in a review of research on correlates of career indecision identified over 50 variables that had been found to relate to difficulties in career decision making. These included internal traits (e.g., trait anxiety, self-esteem, psychological hardiness, decision-making styles) and states (e.g., choice and social anxiety, lack of motivation, and work role salience) as well as such contextual factors as external barriers (e.g., discrimination, lack of resources) and interpersonal conflicts with significant others. This research has certainly advanced our understanding of the myriad of personal and contextual factors that might relate to choice-making difficulties. However, it has been suggested (Brown & Rector, 2008) that a more parsimonious and clinically useful conception of sources of career decision difficulties might be obtained by studying how the myriad of measured variables covary together to suggest a smaller set of latent sources of difficulty.
Brown and Rector (2008) took this approach by conducting exploratory factor analyses of 26 published correlation matrices that collectively included measures of all variables that had been found to relate to career indecision in past research. After an iterative process of identifying common factors across matrices and meta-analytically combining factor loadings, Brown and Rector found that four major interpretable factors accounted for substantial covariation among 37 measured variables.
In a subsequent study, Brown et al. (2012) created a 167-item inventory that included 4–6 items representing each of the 37 measured variables that loaded saliently on the factors from the Brown and Rector (2008) meta-analysis. A factor analysis of the inter-item correlation matrix, in a sample of U.S. college students, yielded four factors that replicated and extended the Brown and Rector solution.
The first factor covered four of the six facets of trait neuroticism, including trait anxiety and worry (e.g., a focus on what might go wrong with a decision), self-consciousness, and vulnerability and dependency. It also was marked by several affectively laden items primarily having to do with depressive affect. Given these patterns of loadings, Brown et al. (2012) labeled this a neuroticism/negative affectivity (NNA) factor and suggested that it represents a dispositional source of indecision marked by feelings of vulnerability and dispositional tendencies to (a) focus on what will go wrong with decisions, (b) rely heavily on others when making a decision, and (c) prematurely foreclose on decisional options as an avoidance coping strategy.
The second factor contained a combination of items reflecting a need for self-information and occupational information, approach-approach conflicts, and an inability to commit to, and anxiety about, making a career decision. Thus, high scorers on this factor seem to experience a good deal of anxiety in the decision-making process and express difficulties in committing to a choice because of a large number of interests or a fear that they (or their circumstances) might change or that they may give up on an option that they might regret later. High scorers also express needs for additional self-information and occupational information. Although this factor seemed to be conceptually complex, Brown et al. (2012) suggested that feelings of choice and commitment anxiety may be the latent variable that accounts for the covariation among such seeming disparate items and, therefore, labeled this a choice/commitment anxiety (CCA) factor. The salient loadings of need for information items on this factor may reflect that persons experiencing anxiety in the choice-making process could feel that additional information might allow them to solve their decisional dilemmas and may also represent a tendency to search for the perfect rather than a good enough option (e.g., Schwartz et al., 2002).
The third factor seemed to measure a lack of preparedness to make a decision with saliently loading items reflecting low levels of career decision-making self-efficacy beliefs, goal-directedness, and conscientiousness. High scorers on this factor seemed also to use a less than rational style for making decisions. Brown et al. (2012) suggested that the items making up this factor seemed to represent a developmental lack of readiness (LR) to make a career decision (e.g., Sampson, Reardon, Peterson, & Lenz, 2004) which may not become problematic until a need to make a decision becomes imminent, but may represent important targets career development interventions in adolescence. They, therefore, labeled this factor as an LR factor.
The fourth factor clearly represented a conflict with important others latent dimension with saliently loading items reflecting discouragement from, or disagreements with, others about career plans, and perceptions that others provide unreliable or inaccurate information. It was labeled an interpersonal conflicts (IC) factor.
Hacker, Carr, Abrams, and Brown (2013) then developed a shorter 65-item version of the Career Indecision Profile (CIP-65) for future research and counseling uses. The CIP-65 was developed by selecting items from the CIP-167 that showed high loadings on their respective factors and minimal cross loadings. Items were also chosen so that all major facets of each factor were covered with multiple items. Results of a confirmatory factor analysis (CFA) with an independent sample of 488 undergraduate college students supported the four-factor structure used to develop the CIP-65, with all items showing salient and statistically significant loadings on their assigned factors. Hacker et al. also found that scores on three of the four factors (with the exception of the IC scale) significantly discriminated between undergraduate students enrolled in a career development course from the remainder of the sample. Finally, scores on all the four scales correlated negatively and significantly with self-reported levels of career decidedness, with correlations ranging from −.24 (NNA) to −.71 (CCA).
Collectively, these results suggest that the CIP-65 might be a useful measure of career indecision of U.S. college students, and four factors might provide a parsimonious account of major sources of indecision experienced by U.S. college students. Although much work still needs to be done to establish the robustness and generalizability of these results in the United States, the current study sought to examine the measurement equivalence of the CIP-65 internationally. Specifically, the primary purpose of this study is to explore the degree to which items on the CIP-65 have the same meaning and measure the same constructs in the United States and Iceland (i.e., to explore the measurement invariance of the CIP-65 in the United States and Iceland).
Iceland was chosen for this study for two primary reasons. First, career guidance research and practice in Iceland has been heavily influenced by American vocational psychology. Major vocational psychology theories, particularly those from the individual differences tradition (e.g., Dawis & Lofquist, 1984; Holland, 1997) and more recently social cognitive career theory (e.g., Lent, Brown, & Hackett, 1994) and the cognitive information processing approach (e.g., Sampson et al., 2004), have been adopted to direct career counseling practices in Iceland. Equally important, the use of assessment instruments is an integral part of guidance practices and Icelandic scholars have had a tradition of importing major assessment tools developed in the United States and testing their validity for use in Iceland (e.g., Björnsdóttir, Kárdal, & Einarsdóttir, 2010; Einarsdóttir, Rounds, & Su, 2010). Thus, this study represents another step in the ongoing collaboration among U.S. and Icelandic scholars studying the cross-cultural applicability of U.S. developed measurement tools.
Second, although the United States and Iceland share some cultural characteristics (e.g., individualism, self-reliance, and tolerance for meritocracy; Ægisdóttir & Einarsdóttir, 2009), there are several cultural differences that might suggest that a model and measure of career indecision developed in the United States may not accurately capture the decision-making difficulties experienced by Icelandic youth and young adults. One important contextual difference is that in Nordic social democratic welfare states such as Iceland, equality and the equal distribution of resources are emphasized. As a result, young men and women in Iceland experience fewer social and economic barriers to education and occupations than do young people in many other societies. For example, upper secondary education in Iceland is open to all citizens and is largely free to most people, with 80–90% of young adults enrolled after finishing compulsory education. The public universities do not charge tuition, and students (mostly in the 20–30 age range) support themselves during their studies through work or through low-interest government student loans.
It is also possible that there may be differences in planning attitudes that have evolved from ancient Norse traditions of mystical and fatalistic beliefs and fortune telling (Ægisdóttir & Einarsdóttir, 2009) expressed in a common saying—petta reddast (It will work out somehow). The precarious ecological and social conditions in Iceland (e.g., rapidly changing weather, natural disasters, and rapid social changes of the past few decades) may additionally undermine the installation of long-term planning attitudes and behavior. Thus, being highly planful may not be seen as particularly relevant to many young adults in Iceland. They may also experience less anxiety in the career decision-making process than young adults growing up in the United States due to their more fatalistic beliefs in the future.
In this study, we will first test whether the four-factor model of career indecision as measured by the CIP-65 is replicable in Iceland. Then, we will engage in sequentially more stringent tests of measurement equivalence to ascertain whether items are interpreted similarly or differently by U.S. and Icelandic young adults. In spite of important cultural and contextual differences, decision making shares many commonalities especially in those two individualistic Western cultures. Therefore, we expect that the four-factor structure of the CIP-65 will fit reasonably well in Iceland. However, we do not expect all items to show the strictest levels of measurement equivalence due to the described cultural and contextual differences between the two countries.
Method
Participants and Procedures
Data for this study were collected from two samples: (a) undergraduate college students at two Midwestern universities located in the United States and (b) students from the largest university in Iceland and two upper secondary schools. Upper secondary schools in Iceland enroll students between the ages of 16 and 20 after they complete compulsory education at 16 years of age. Students in their final 2 years of upper secondary education were sampled in order to obtain a sample within the same age range as the U.S. sample (i.e., to ensure that 18- and 19-year-olds were included in the Iceland sample).
U.S. Sample
The U.S. sample was the sample employed by Hacker et al. (2013) in their CFAs of the CIP-65. A detailed description of this sample, therefore, can be found in Hacker et al. In summary, students in this sample (n = 488) came from two Midwestern universities (one urban and one suburban), were enrolled in a variety of undergraduate courses (psychology, research methods, statistics, education, and career development), and completed the CIP-65 during class at the beginning of the academic term. They ranged in age from 18 to 58 (M = 21.83, SD = 6.02). Women and Caucasians comprised 76.6% and 68.4% of the sample, respectively. Other racial/ethnic groups in the sample were African American (7.8%), Latino/Latina (9.3%), Asian American (7.2%), and Multiracial (5.1%). Six participants indicated their race/ethnicity to be “other,” while another six participants did not respond to the race/ethnicity item on a demographic questionnaire that all participants completed along with the CIP-65. Participants also rated their current level of career decidedness on the demographic questionnaire, using a 6-point (1 = very undecided, 6 = very decided) scale (M = 4.61, SD = 1.38, range = 1–6).
Iceland Sample
The Icelandic participants for this study were recruited from two upper secondary schools (n = 157) and from the largest university in Iceland (n = 238). All data collection took place during class hours and participants recruited from the Iceland university were enrolled in education, engineering and science, sociology, and politics courses. In addition to the CIP-65, the Icelandic participants completed a demographic survey that included the same questions asked of the U.S. sample (i.e., sex, age, year in school, level of decidedness), with one exception; the race and ethnicity question was changed. Participants were presented with questions asking whether they were born and raised in Iceland, born and raised in another country, or they could also give an “other” response.
Data were initially collected from 395 students. However, as in the U.S. sample, inventories with 5% (k = 4) or more missing items were removed from the study. Twenty-four inventories were removed from subsequent analyses. Nearly 78% (n = 303) of the remaining inventories had no missing data. Forty-eight (12.2%) had 1 item missing, 17 (4.3%) had 2 missing items, and 3 (0.8%) had 3 missing items. Values for missing items were imputed via a mean substitution procedure using the means obtained on each factor to impute missing values.
The final sample consisted of 371 participants with 40.4% (n = 150) comprised of secondary school students and 59.6% (n = 221) comprised of university students. They ranged in age from 18 to 55 with a mean age of 24.15 (SD = 7.45). Women comprised 73.6% (n = 273) and men comprised 26.4% (n = 98) of the total sample. Three-hundred and thirty-six of the participants indicated being born and raised in Iceland, 13 indicated being born and raised in another country, and 22 participants provided an “other” response to the question. The “other” responses included descriptions of being born in another country but raised in Iceland or being raised in two or more countries. The participants’ mean level of decidedness was 3.87 (SD = 1.59; range = 1–6).
The U.S. and Icelandic samples were comparable in terms of gender composition, χ2(1) = 1.17, p = .279. However, the Icelandic sample was somewhat older on average, M = 24.15 and 21.83 in Icelandic and U.S. samples, respectively; t(847) = 5.06, p < .001, d = .35, and less career decided, M = 3.87 for Iceland and 4.61 for United States; t(856) = 7.16, p < .001, d = .49.
Instrument
The CIP-65 (Hacker et al., 2013) consists of 65-items measuring four facets of career decision-making difficulties. Responses are given on a 6-point scale (1 = strongly disagree to 6 = strongly agree) with higher scores reflecting greater career indecision. Scores on all four scales have yielded high Cronbach’s α estimates ranging from .88 for ICs to .96 for CCA (Hacker et al., 2013).
The NNA scale contains 21 items assessing career decision-making difficulties due to excessive worry, depressive affect, self-consciousness, and a dependency on others to make a decision. Sample items include I think I take failures and setbacks harder than a lot of people I know and I really have a hard time making decisions without help. The CCA scale contains 24-items assessing career decision-making difficulties due to choice anxiety, a need for occupational and self-information, approach–approach conflict, and an inability to commit to a choice. Sample items include I need to learn more about what I want from a career, I often feel nervous when thinking about having to pick a career, and I am uncomfortable committing to a career choice now. The LR scale contains 15 items assessing career decision-making difficulties due to low decision-making self-efficacy beliefs, a lack of goal-directedness and conscientiousness, and minimal use of a rational decision-making process. Sample items on this scale include I always think carefully about decisions I have to make, I strive hard to achieve my goals, and I am confident that I will achieve my career goals. Responses to all 15 items are reverse scored. The IC scale contains 5 items assessing career decision-making difficulties due to interpersonal conflicts, and includes such items as Important people in my life have discouraged me from pursing the career I want and I’d be going against the wishes of someone important to me if I follow the career path that most interests me.
Translation Procedure
Several steps were taken in order to create an Icelandic version of the CIP. First, the original English version of the CIP was translated to Icelandic and then back translated to English by the bilingual Icelandic authors of this article. Second, the back-translated version of the CIP was returned to the authors from the United States for comment. Third, the research team in Iceland made minor wording adjustments on the basis of comments from the U.S. team and created a final Icelandic version of the CIP.
Data Analyses
Single-group CFA using LISREL 8.80 (Jöreskog & Sörbom, 2006) was conducted on each sample independently to assess model fit. Given acceptable fit, multigroup CFA using LISREL 8.80 was conducted to compare the factor structure of the CIP across U.S. (n = 488) and Iceland (n = 371) samples. All CFA models were analyzed via maximum likelihood estimation using the covariance matrix. An assessment of the skewness and kurtosis of item responses indicated that responses to all items on the CIP in the U.S. sample were sufficiently univariate normal (see Hacker et al., 2013). An assessment of the item responses on the CIP in the Iceland sample revealed that the responses to 1 item (Important people in my life do not support my career plans) showed a high level of skewness (γ = 2.44). This item was, however, retained so that all subsequent measurement equivalence analyses were conducted with identical items across samples.
Analytic Strategy
As an initial step, we compared the fit of the four-factor model to an alternative three-factor model in Iceland. The rationale for comparing these two models was based on exploratory factor analytic results (Björnsdóttir, Ómarsdóttir, & Einarsdóttir, 2011) derived from our original Iceland data set which contained a larger pool of items. The results of these analyses largely replicated the first three factors found in the United States, but failed to identify an IC factor. Thus, we tested whether a three-factor model that excluded the IC factor might be more culturally appropriate in Iceland.
Assessing Model Fit
The goodness of fit for our hypothesized measurement models was evaluated through four separate measures of fit. The root mean square error of approximation (RMSEA) and the standardized root mean square residual (SRMSR) were used to assess model absolute fit, while the non-normed fit index (NNFI) and the comparative fit index (CFI) were used to assess model relative or incremental fit. For both the RMSEA and SRMSR, smaller values indicate better model fit, with values of .08 or less suggesting adequate model fit (Hu & Bentler, 1998). For both the NNFI and CFI, larger values indicate better model fit with a value of 1.00 representing a perfectly fitting model. According to Bentler and Bonnet (1980) models with NNFI and CFI values above .95 represent good fit, while those above .90 have adequate fit.
Assessing Measurement Invariance
Several types of measurement invariance are relevant when assessing whether or not an instrument provides the same meaning and measures the same constructs in the same way among members of different groups. Vandenberg and Lance (2000) recommended and outlined a series of more progressively stringent tests to establish measurement invariance. The establishment of measurement invariance is a requirement for valid comparisons of group means. More specifically, in order to compare mean differences on an instrument between groups one must first establish the existence of configural, metric, and scalar invariance between the groups.
Configural invariance is the first step in assessing measurement invariance; it is concerned with assessing whether the same factors and patterns of zero and nonzero loadings are appropriate for both groups (Vandenberg & Lance, 2000). This initial test of measurement invariance is particularly important because a lack of configural invariance suggests that the data will not support more restrictive models (Bollen, 1989). Configural invariance is assessed through single-group CFAs where each group is separately evaluated for goodness of fit. These results are then combined and used as a baseline model for which all subsequent models in the invariance hierarchy are compared.
Once configural invariance is established, more rigorous tests are conducted to assess for metric invariance (i.e., whether or not there are equal factor loadings across the groups). The establishment of metric invariance is necessary to make meaningful comparisons of scores across groups as it assesses the extent to which test items are being interpreted in the same way across groups (Byrne, Shavelson, & Muthen, 1989). Byrne, Shavelson, and Muthen (1989) suggested that full metric invariance is often too difficult to establish and recommended continuing with further tests of invariance when a small portion of the items show a lack of metric invariance.
Finding support for metric invariance leads to tests of scalar invariance. Scalar invariance assesses whether or not the item intercepts are equal across the groups. The item intercept values correspond to the value of an observed item when the latent factor mean is 0. Support for scalar invariance suggests that persons from different groups with the same mean score on the latent variable (i.e., factor) respond similarly to items making up the factor (Vandenberg & Lance, 2000). The finding of configural, metric, and scalar invariance across groups is known as strong factorial invariance (Meredith, 1993).
Measurement invariance was assessed through two different criteria. First, we used the chi-square difference test to examine changes in chi-square values within nested models. Second, because the chi-square statistic is sensitive to sample size and a large number of significance tests are conducted to assess for measurement equivalence, we also examined changes in the CFI between nested models. Following the recommendation of Meade, Johnson, and Brady (2008), we used a difference in CFI values of greater than .002 between models as evidence of a lack of measurement invariance. Thus, differences in CFI values of .002 or greater were used as evidence for practical differences to supplement tests of statistical significance obtained from the chi-square difference tests.
Results
The intercorrelations, means, standard deviations, ranges, skewness, kurtosis, and internal consistency estimates for the four factors for both the U.S. and Iceland samples are presented in Table 1. These descriptive data suggest that the two samples responded similarly to the CIP-65. There were, however, a few exceptions. First, scores on the NNA and CCA scales correlated higher in Iceland (r = .58) than in the United States (r = .45, z = 2.57, p = .01). There was also a higher correlation between the LR and IC scales in Iceland (.45) than in the United States (.25), z = 3.32, p = .001. Second, participants from Iceland had higher average scores on the LR factor (M = 36.18) than did the U.S. participants (M = 29.47; t(857) = 10.76, p = .001, d = .74), while Icelandic participants obtained lower NNA scores (63.14) than did U.S. participants (66.23; t(857) = 2.26, p = .02, d = .15). Finally, internal consistency estimates obtained on the IC scale scores were lower in Iceland (α = .78) than in the United States (α = .89).
Factor Intercorrelations, Means, Standard Deviations, Range, Skewness, Kurtosis, and Internal Consistency Estimates in the United States and Iceland Sample.
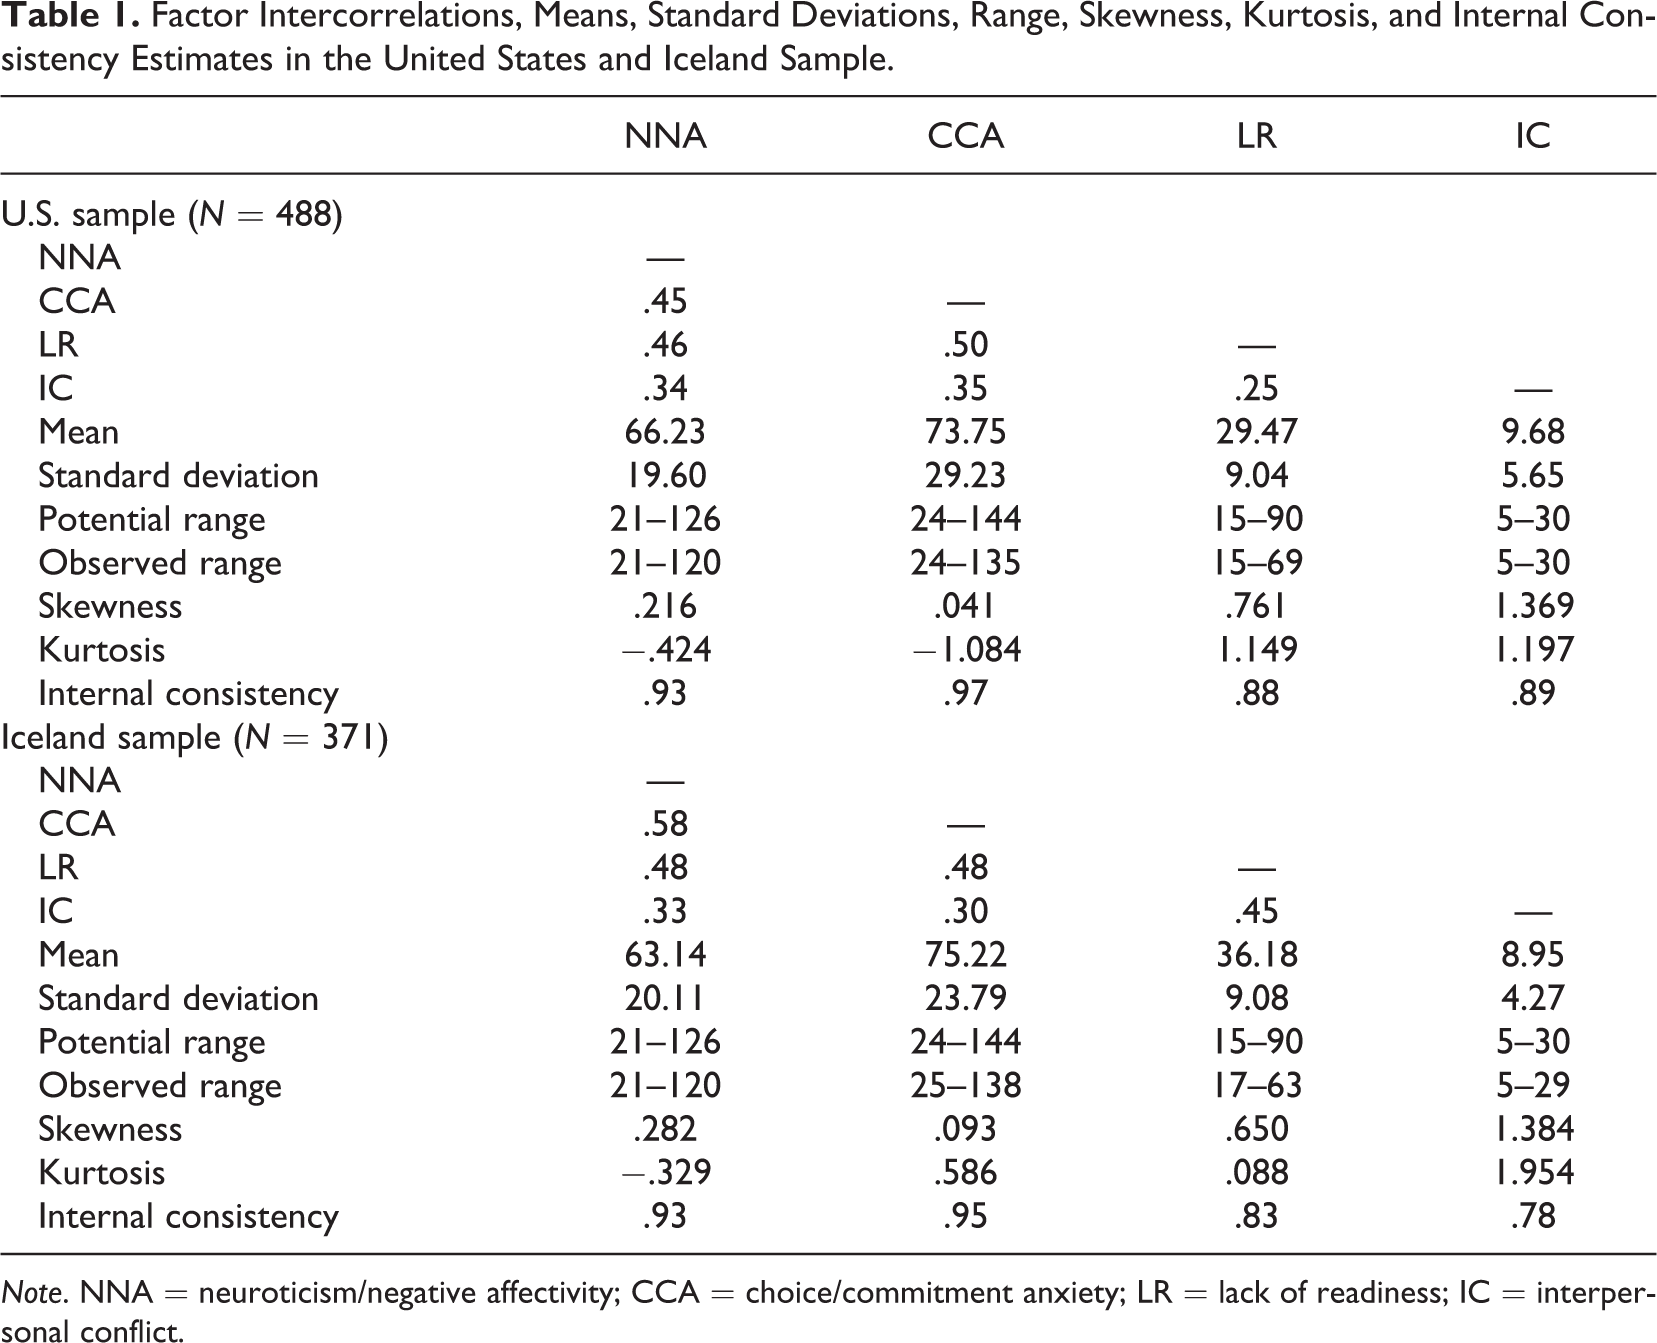
Note. NNA = neuroticism/negative affectivity; CCA = choice/commitment anxiety; LR = lack of readiness; IC = interpersonal conflict.
Single-Group CFA Modeling
Independent CFAs on each group revealed that the hypothesized four-factor model fit the data well for both the U.S. and Iceland samples (see Table 2). Thus, configural invariance was established for the four-factor model between the United States and Iceland samples. Table 3 presents the within-group completely standardized CFA solutions for the four-factor models for both the U.S. and Iceland samples. The proportions of variance explained in items by each factor were relatively large for both groups. For the U.S. sample, median R 2 values were .406, .536, .261, and .641 for NNA, CCA, LR, and IC, respectively. For the Iceland sample, these values were .403 (NNA), .486 (CCA), .238 (LR), and .377 (IC), providing further support for configural invariance.
Measures of Fit.
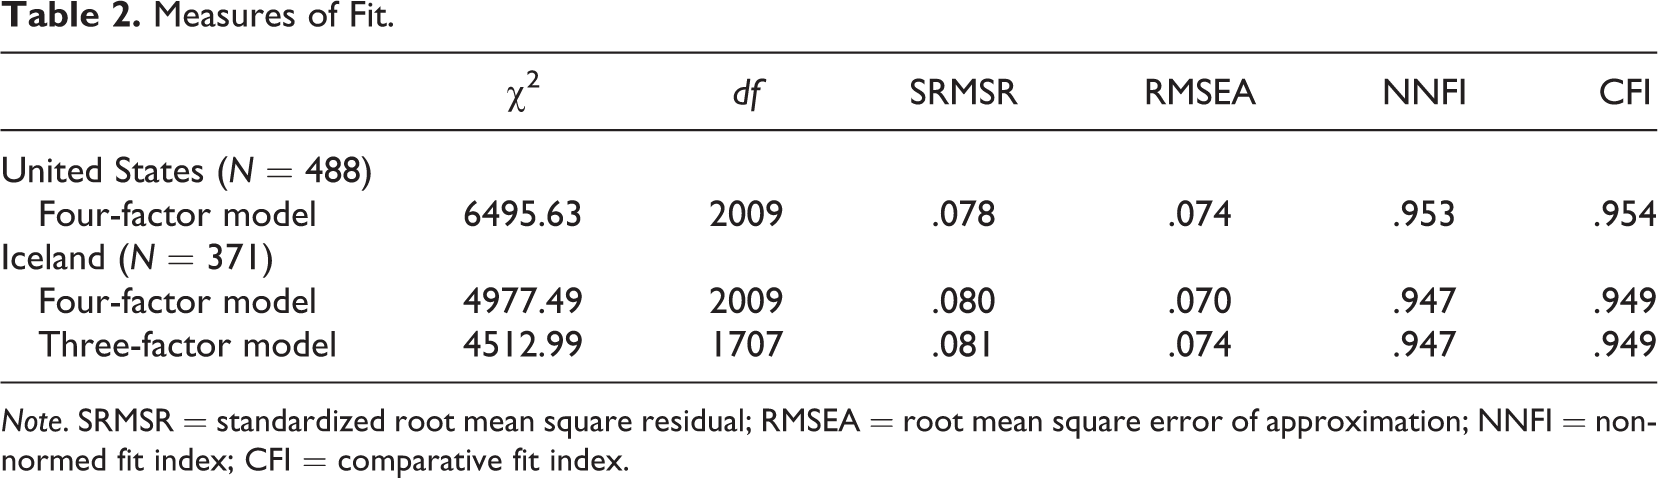
Note. SRMSR = standardized root mean square residual; RMSEA = root mean square error of approximation; NNFI = non-normed fit index; CFI = comparative fit index.
Within-Group Completely Standardized Factor Loadings for the Four-Factor Model of the CIP-65 Across United States and Iceland Samples.

Note. NNA = neuroticism/negative affectivity; CCA = choice/commitment anxiety; LR = lack of readiness; IC = interpersonal conflicts.
aIndicates item is not invariant across U.S. and Iceland samples.
Even though the four-factor model fit the data well in both groups, we also tested an alternative three-factor model with the Iceland data set. Since this alternative model was not nested within the four-factor model, we could not conduct a direct chi-square difference test. However, a comparison of the fit indices (see Table 2) revealed that the more parsimonious three-factor model that did not include an IC factor seemed to fit the data as well as the four-factor model. (This finding will be discussed more fully in the Discussion section of this article.)
Multigroup CFA Modeling
Having established configural invariance in our single-group CFA analyses (i.e., that the four-factor model showed reasonable fit in both samples), we next moved to multigroup CFA modeling for further tests of measurement invariance. The baseline model used in the subsequent analyses was the combined U.S. and Iceland samples established in the single-group CFA models with no cross-group equality constraints specified.
In our next test of measurement invariance, we examined the equivalence of factor loadings (i.e., metric invariance) across samples. In this multigroup CFA, we constrained all factor loadings to be equal across the groups and compared the fit of this model to the unconstrained baseline model. This provided an omnibus test of metric invariance. A chi-square difference test revealed that the unconstrained baseline model fit the data better than the fully constrained metric invariance model, suggesting that the factor loadings were not invariant across the groups (see Table 4). On the other hand, the change in CFI values (ΔCFI = .001) suggested invariant factor loadings or that the difference in factor loadings may not be sufficiently large to be practically significant.
Results of Tests of Invariance for United States (N = 488) and Iceland (N = 371) Samples.
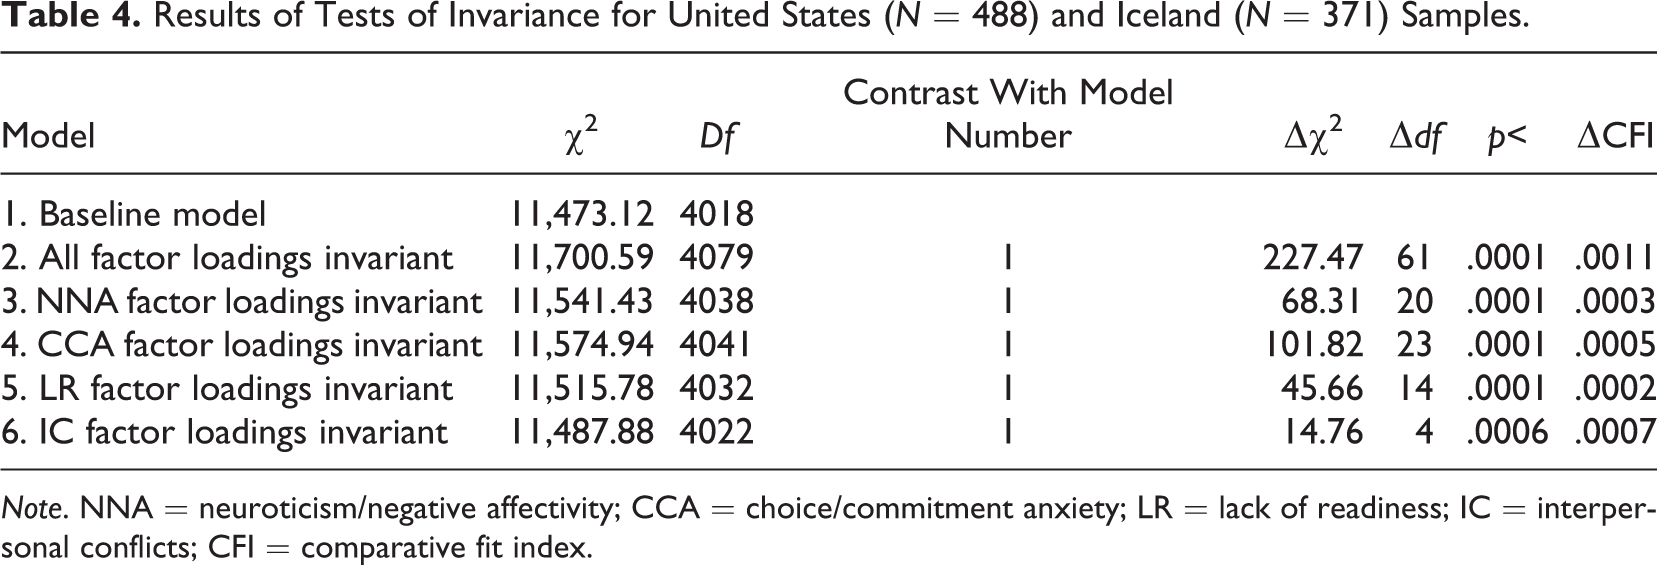
Note. NNA = neuroticism/negative affectivity; CCA = choice/commitment anxiety; LR = lack of readiness; IC = interpersonal conflicts; CFI = comparative fit index.
Nonetheless, we conducted further metric invariance tests by examining the equivalence of factor loadings across samples factor by factor. In these tests, the loadings on one factor were constrained to be identical across the groups, while the factor loadings were freely estimated on the remaining factors. Chi-square difference tests between each constrained model and the unconstrained baseline model were all significant, suggesting a lack of metric invariance for all four factors (see Table 4). However, once again the small changes in CFI (ΔCFI < .001 for all four factors) suggested invariant factor loadings.
Despite continued mixed evidence on metric invariance suggested by the chi-square difference test and the change in CFI, we explored item invariance more specifically by conducting another series of multigroup CFAs, placing equality constraints on 1 item at a time across the groups. We then compared each of these new models to the baseline model with no cross-group equality constraints specified. The results (see within group standardized factor loadings in Table 3) indicated a substantial lack of metric invariance for items on the CCA and IC factors. Only 8 of the 24 items on the CCA factor and none of the 5 items on the IC factor were invariant. On the other hand, substantially more items on the NNA and LR factors were invariant (17 of the 21 on NNA and 10 of the 15 on LR were invariant). Further, the noninvariant items on the NNA and LR factors displayed no clear and explainable patterns of differences. Icelandic participants obtained higher loadings than U.S. participants on two of the noninvariant NNA items, while U.S. participants had higher loadings on the other two noninvariant items. Similarly, on the LR factor the loadings of 3 items were higher in the U.S. sample, while the other 2 items had higher loadings in the Icelandic sample.
In contrast, the noninvariant items on the CCA and IC factors were consistent and explainable (at least on a post hoc basis). The noninvariant items on both factors demonstrated significantly higher factor loadings in the United States than in Iceland. In terms of item content, items reflecting a need for additional occupational information, choice anxiety, approach–approach conflict, and an inability to commit defined the CCA factor more in the United States than in Iceland. Nearly all items showing invariant loadings on this factor were items indicating a need for additional self-information. All five IC scale items showed higher loadings in the U.S. sample than in the Icelandic sample.
Given the large number of noninvariant items on two of the scales, we chose not to continue with an exploration of scalar invariance. We did, however, explore a partial metric invariance model by constraining all items on the NNA and LR factors to be invariant along with the items on the CCA factor that had shown invariance in the previous analysis. Previously noninvariant items on the CCA factor and all items on the IC factor were freely estimated. The chi-square difference tests suggested that this model fit the data significantly worse than the baseline model, Δχ2(42, N = 859) = 122.65, p < .0001, but the differences in CFI values (ΔCFI = .0005) suggested this difference to be practically not significant.
Discussion
The results of this study suggest that the CIP-65 has only partial measurement invariance across U.S. and Icelandic samples. Although the configural invariance of the CIP-65 factor structure was established, the loadings of many items on two of the four CIP-65 scales were not invariant. Further, a somewhat consistent and explainable pattern emerged among the noninvariant items on these two scales. First, 17 (71%) of the items on the CCA scale showed significantly higher loadings in the United States than in Iceland. These were all items written to assess the degree to which respondents expressed needs for occupational information, approach–approach conflicts, anxiety with decision making, and an inability to commit to a decision, with the commitment items specifically showing rather low loadings in the Iceland sample. Thus, CCA and its attendant needs for occupational information seem to define the second CIP-65 factor more in the United States than in Iceland. Items reflecting an inability to commit to a choice seemed to particularly define this factor less in Iceland than in the United States.
Second, none of the 5 items on the IC scale showed equivalent factor loadings and in all cases the loadings in the U.S. sample were significantly higher than those in the Icelandic sample. This finding was also consistent with our CFA test of the alternative three-factor model in the Iceland sample. This test showed that a three-factor model consisting only of NNA, CCA, and LR factors fit the data as well as our four-factor model. The internal consistency estimates obtained on this scale in the present study were lower in the Iceland (.78) than the U.S. sample (.89). This factor also accounted for substantially less variance in the items in Iceland (median R 2 = .377) than in the United States (median R 2 = .641). Taken together, all of this evidence might suggest that interpersonal conflicts may not represent a coherent latent source of indecision in Iceland.
The lack of invariance demonstrated on the CCA and IC scale may be explained by cultural differences between the United States and Iceland. As noted previously, differences in attitudes toward planning and in the higher education systems in the United States and Iceland represent important sources of cultural differences. Persons growing up in cultures where long range planning is reinforced as part of the shared cultural heritage (United States) may experience more anxiety in finding the “right” choice than persons growing up in cultures where planning is not as strongly culturally reinforced (Iceland). In fact, we found the commitment items difficult to translate. Specifically, the phrase “committing to a career” does not lend itself easily to a direct translation in Iceland—the Icelandic counterpart for commitment (skuldbinding) is not often used in relation to choosing an occupation.
Contextual differences in the higher education systems and public support for education available in the two countries might also explain, in part, the lack of invariance obtained on the IC scale. It might also provide a partial explanation for why a three-factor model fit as well in Iceland as the four-factor CIP model. Simply put, parents of students in Iceland may have significantly less financial investment in their children’s educational futures than parents of U.S. students and, as a result, may be less intrusive about their children’s educational and occupational lives. Thus, items asking about interpersonal conflicts over career and educational directions may not be seen as all that relevant to young adults in Iceland. All of these explanations, while reasonable, require attention in future research on the CIP-65 and other measures of career indecision in Iceland.
Loadings of items on the NNA and LR factors were largely invariant. These results suggest that the items on these factors are largely interpreted similarly by U.S. and Icelandic students and that the factors are likely measuring the same latent variables across cultures. The findings concerning configural and metric invariance of the NNA factor are not surprising, given consistent findings on the cross-cultural equivalence of the Big Five personality traits, including trait neuroticism (e.g., Paunonen, Jackson, Trzebinski, & Fosterling, 1992). The findings that the majority of the items showed invariant loadings on the LR factor suggest that a lack of goal-directedness and less than robust career decision-making beliefs may be a major source of indecision in U.S. and Icelandic cultures. Thus, the CIP-65 scales may measure these two factors equivalently in both cultures.
Limitations and Future Directions
This study has two important limitations. First, tests of metric invariance have a great potential for taking advantage of chance. For example, Schmitt, Golubovich, and Leong (2011) have noted that the process of testing for measurement equivalence is largely data-driven, is based on a large number of significance tests with attendant experiment-wide error problems, and can capitalize on chance characteristics of a specific data set (see also MacCallum, Roznowski, & Necowitz, 1992).
The problem associated with multiple significance tests is especially problematic when noninvariant items in metric invariance tests are not hypothesized a priori or easily explained on a post hoc basis. This problem is clearly evident in the inconsistent results we repeatedly obtained from the chi-square difference and change in CFI tests. In all cases, the chi-square difference tests suggested nonequivalence of factor loadings across samples, while the change in CFI values equally always suggested equivalence. Our interpretation of the results of these tests was that the items on the NNA and LR scales were largely invariant because the direction of the differences in factor loadings and the content of noninvariant items displayed no easily discernible and explainable patterns of differences. A large percentage of items on these scales were also found to be invariant. Thus, the apparently noninvariant items on these two scales could simply represent experiment-wide Type I errors.
However, on the other two scales (CCA and IC), a large percentage of items were found to be noninvariant, the loadings obtained on these items were always higher in the United States than in Iceland, and, most importantly, a clear and culturally explainable pattern of differences in the content of noninvariant items was evident (at least on a post hoc basis). Nonetheless, our results clearly require replication to further explore whether our interpretations generalize beyond the specific U.S. and Iceland samples that we employed in this study.
Second, this study took an etic rather than emic approach to the exploration of cultural similarities and differences in the measurement of career indecision. The main difference between etic and emic approaches is that the former involves the importation and adaptation of models and measures developed in one culture to another culture. On the other hand, the emic approach focuses on identifying indigenous constructs (Einarsdóttir et al., 2010). Our approach was to test the fit of a model and measure developed in the United States to another culture (in this case, Iceland). Although we found that the four-factor structure of career indecision developed in the United States could be replicated in Iceland and that at least two of the four factors are interpreted similarly by our U.S. and Icelandic participants, it does not follow that these four factors comprehensively represent primary sources of choice difficulty in Iceland. Rather, there may be some culturally specific sources of indecision in Iceland that our etic approach was unable to identify. Thus, future research on sources of career indecision needs to take a more emic approach by developing items for the CIP-65 (and other measures of career indecision) that may be unique to Iceland.
Nonetheless, the results of this study suggest that the CIP-65 can be used to assess sources of career indecision in Iceland and the United States (configural invariance was established) as long as within-country norms are employed to interpret scores. However, the clear lack of metric invariance on two of the four CIP-65 scales also suggests that the CIP-65 should not be used if one wants to conduct cross-cultural research on the differences in mean scores or relations to other constructs in Iceland and the United States. Finally, the results of our model comparison test suggest that a three-factor measure of career indecision (that excludes the IC scale) may be a more parsimonious measure to use in Iceland.
Footnotes
Acknowledgment
The authors thank Theresa Chan, Bryce Homyk, Anneliese Kranz, Meghan Roche, Meaghan Rowe-Johnson, Anne Siena, Jessica Stegmaier, James Wade, and Patricia Wisneski for reading and commenting on an earlier draft of this article.
Authors’ Note
The three-factor Icelandic version of the CIP-65 mentioned in this article is available from Sif Einarsdóttir at sif@hi.is.
Declaration of Conflicting Interests
The authors declared no potential conflicts of interest with respect to the research, authorship, and/or publication of this article.
Funding
The authors disclosed receipt of the following financial support for the research, authorship, and/or publication of this article: Matthew Abrams and Andrea Carr were supported by graduate assistantships from the School of Education, Loyola University Chicago.