
Abstract
The Occupational Engagement Scale–Student (OES-S)—a 9-item measure of occupational engagement in college students—was developed and initial validity evidence is presented. Using two samples of college students, exploratory and confirmatory factor analyses supported the measure’s unidimensionality. Criterion validity was supported via the OES-S predicting (a) vocational identity, (b) academic major satisfaction, (c) gains in personal development, (d) gains in vocational competence, and (e) gains in general education. Implications for practice, theory, and future research are discussed.
Keywords
Traditionally, vocational psychologists have emphasized rational and conscious decision making. However, researchers have found that the decision-making process is often not rational or conscious (Bargh & Chartrand, 1999). Further, vocational psychologists have often conceptualized career decision making as static—occurring at the beginning of one’s career—yet contemporary workers continuously make career decisions as changing jobs and occupations is the norm (Blustein, 2006; Hall & Marvis, 1996). In response to this evolving understanding of decision making and the contemporary world of work, several vocational theorists have posited models that expand on traditional approaches to career decision making and highlight nonconscious processes and dynamic careers (Gelatt, 1989; Krieshok, Black, & McKay, 2009; Krumboltz, 1998).
The trilateral model of adaptive career decision making integrates nonconscious decisional processes and dynamic careers via three components: (a) occupational engagement, (b) intuitive decision making, and (c) rational decision making (Krieshok et al., 2009). Occupational engagement—the foundational component of the model—consists of two subcomponents, exploration and enrichment. Exploration is gathering information to make a decision, and enrichment is taking part in activities that increase information about the self, the world, and the relation between the self and the world to make future decisions. The authors further noted that exploration is a state—it continues until a decision is made—while enrichment is a trait—the process is continuous and informs future and often unknown career-related choices.
By relying on knowledge about the self, the world, and the relation between the self and the world that results from occupational engagement, the decision maker utilizes the other two components of the trilateral model—intuition and reason—to make decisions (Krieshok et al., 2009). Intuition and reason complement one another during the decision-making process and facilitate better decision making than if either were used in isolation. While there is value in greater understanding of rational and intuitive decision-making processes, exploration and enrichment fund the decision maker’s knowledge about the self, the world, and the relation between the self and the world, thus our current focus on occupational engagement.
To date, the published work on occupational engagement has been theoretical—relying on inferences drawn from neuropsychology, vocational psychology, social psychology, and related disciplines. To advance our understanding of occupational engagement, a theoretically and empirically sound measure of the construct must be developed. Thus, the purpose of our research was to develop the Occupational Engagement Scale–Student (OES-S), a psychometrically sound measure of occupational engagement in college students. To achieve this aim, two studies were conducted. The goals of Study 1 included creating the OES-S and evaluating the measure's validity. The goal of Study 2 was to examine whether the OES-S’s factor structure—identified in Study 1—maintained in a second sample.
Study 1: OES-S Creation and Validity Evidence
The first purpose of Study 1 was to create a pool of OES-S items that represented behaviors college students engage in that help them gain knowledge about themselves, the world, and the relation between themselves and the world. These items were given to college students, and exploratory factor analysis (EFA) and other item reduction techniques were used to determine which items optimally represented occupational engagement.
As noted previously, knowledge resulting from occupational engagement yields increased understanding of the self, the world, and the relation between the self and the world (Krieshok et al., 2009); thus, the second purpose of Study 1 was to test whether the OES-S predicted several constructs that indicated self and world knowledge (i.e., criterion validity). The constructs evaluated included (a) vocational identity—a clear and stable understanding of one’s goals, interests, personality, and talents (Holland, Gottfredson, & Power, 1980); (b) academic major satisfaction; and gains in three areas since beginning college: (c) gains in personal development; (d) gains in vocational competence; and (e) gains in general education. While validity evidence is usually evaluated using the same data as are used for confirming a measure’s factor structure (e.g., Study 2 in the present article), it is evaluated in Study 1 because data for the first study were collected as part of the first author’s unpublished doctoral dissertation. It is worth noting that validity evidence being collected as part of Study 1 did not impact the interpretation of our findings.
Method
Scale Construction
The initial 57 OES-S items were generated by the second author (i.e., an expert in occupational engagement) and two of his then graduate students (i.e., the first and third authors). Notably, the research team consulted with a prior graduate student of the second author, whose unpublished dissertation was the first effort to measure occupational engagement in college students (Black, 2006). Consistent with the theory (Krieshok et al., 2009), items were written to assess behaviors (e.g., volunteering, visiting, attending) that are often available to college students and inform them about themselves, the world, and the relation between themselves and the world. Additionally, the literature (e.g., Kuh, Kinzie, Buckley, Bridges, & Hayek, 2007) and an expert in college-student engagement were consulted to further identify behaviors important for college student success. The initial 57 items reflected a breadth of behaviors, emphasizing the importance of students engaging in a variety of activities rather than limiting their involvement to a narrow set of interests. Items were then submitted to an independent judge with expertise in vocational decision making. Based on the judge’s feedback, several of the items were modified to be more explicit in the behaviors they queried. Fifteen of the items were reverse-scored to reduce the likelihood of response bias. Response options ranged from 1 (unlike me) to 5 (like me).
Participants
The sample consisted of 311 undergraduates from a large, Midwestern, public university. Participants were administered a research questionnaire packet that consisted of the informed consent, the 57-item OES-S, and the measures noted below. To recruit approximately the same number of students from each of the four college levels (i.e., freshman, sophomore, junior, and senior) and from diverse academic majors, students from the following five courses were invited to participate: (a) a college orientation course, (b) a career and life planning course, (c) a social psychology course, (d) a developmental psychology course for education students, and (e) a job search strategy course for liberal arts majors. Academically, 109 (35%) participants identified themselves as freshman, 59 (19%) as sophomores, 63 (20.3%) as juniors, and 80 (25.7%) as seniors. Regarding gender 184 (59.2%) were female and 127 (40.8%) were male. Students’ mean age was 20.15 (standard deviation [SD] = 1.89). Most, 270 (86.8%), identified themselves as Caucasian/White (non-Hispanic), 18 (5.8%) as African American/Black, 7 (2.3%) as Asian/Asian American/Pacific Islander, 10 (3.3%) as Latino/Latina, 3 (1.0%) as biracial/multiracial, 2 (.6%) as Native American, and 1 (.3%) as Other. The self-reported mean American College Testing (ACT) score was 23.84 (SD = 3.8). Majors were divided into four categories and 160 (51.4%) students identified themselves as social science majors, 36 (11.6%) as science majors, 30 (9.6%) as humanities majors, and 85 (27.3%) as undeclared.
Measures
Vocational Identity Scale
The Vocational Identity Scale measures the degree of a clear and stable understanding of one’s goals, interests, personality, and talents (Holland et al., 1980). The scale consists of 18 true–false items and internal consistency is reported as ranging from .86 to .89. The measure has been positively correlated with conscientiousness and negatively correlated with neuroticism, both of which are important to vocational decision making (Holland, 1997).
Academic Major Satisfaction Scale (AMSS)
The AMSS measures college students’ satisfaction with their academic majors (Nauta, 2007). This self-report questionnaire consists of 6 items to which participants indicate their level of agreement from 1 (strongly disagree) to 5 (strongly agree). The mean of the 6 items results in a total major satisfaction score. Reported internal consistency ranged from .90 to .94. AMSS total scores predicted remaining in the same major over a 2-year period (i.e., students with higher scores more likely remained in the major 1 and 2 years later). The measure was also positively correlated with career decision self-efficacy and negatively correlated with career choice anxiety and indecisiveness.
Estimate of Gains Scale
Part of the College Student Experience Questionnaire (CSEQ), Fourth Edition, the 25-item Estimate of Gains Scale assesses how much progress students believe they have made on 25 goals of higher education (Gonyea, Kish, Kuh, Muthiah, & Thomas, 2003). Three of the five subscales were included in the present study: (a) personal/social development, (b) vocational competence, and (c) general education. These scales were selected because they assess knowledge about the self and the world—knowledge that is hypothesized to increase via occupational engagement. Respondents indicate their degree of gains from 1 (very much) to 4 (very little). The fourth edition of the CSEQ has been given to over 100,000 students at more than 200 institutions. It has been found to be a psychometrically sound measure of student gains that has been positively correlated with a variety of college outcomes (Gonyea et al., 2003; Pike, 1999).
Data analysis
All data were entered into Statistical Package for the Social Sciences 21.0 for analysis. The OES-S items were entered from 0 to 4; thus, being completely unengaged would result in a score of 0.
OES-S creation
To determine which items to retain and the factor structure of the OES-S, the 57 items were assessed via EFA. We used Thompson’s (2004) five-step decision sequence as a guide for determining which items to retain.
Validity evidence
To assess whether the OES-S predicted students’ knowledge about the self, the world, and the relation between the self and the world above and beyond demographic covariates, multiple linear regression was used. The five criteria were (a) the Vocational Identity Scale, (b) the AMSS, (c) estimate of gains in personal/social development, (d) estimate of gains in vocational competence, and (e) estimate of gains in general education. Only covariates that predicted that criterion (p < .05) were included in the model. For each criterion, the predictive covariates were entered into the first block and the OES-S score into the second. To reduce the likelihood of a Type I error, a p value of < .01 for the OES-S predicting the criteria was used to indicate statistical significance.
Results
OES-S Creation
Using EFA, all 57 items were factor analyzed. The following data driven strategies were used to determine the number of factors to extract. First, evaluating how many factors had Eigenvalues greater than 1, 16 factors were identified. Next, evaluating the percentage of variance accounted for by each factor led to the conclusion that no more than four factors would be extracted. The percentage of total variance accounted for by each of the four factors was (a) 18.8%, (b) 6.42%, (c) 4.7%, and (d) 4.41%. This was consistent with the scree plot, which illustrated breaks after the first, second, and fourth factors. Next, the ratio of adjacent Eigenvalues was evaluated. We determined that the increase in the amount of variance accounted for by adding either a third or fourth factor would be trivial—Factor 1 contained 2.93 times the total variance accounted for by Factor 2, Factor 2 contained 1.37 times the total variance accounted for by Factor 3, and Factor 3 contained 1.07 times the total variance accounted for by Factor 4. From these data-driven strategies, we concluded that the OES-S would be a one- or two-factor measure.
Using principal components analysis (PCA), a two-factor extraction was conducted. PCA was used because of its reduced likelihood of extraction error (Brown, 2006). It is important to note that results would likely be the same across extraction methods in a sample of this size and the small number of factors (Thompson, 2004). Content analysis of the items, with a minimum loading on a factor of > ± .40, revealed a surprising result—the second factor consisted solely of items that were reverse scored (i.e., a higher score signifies less occupational engagement). Content analysis of these items did not indicate that they were measuring a different construct from the items in the first factor; thus, should not be extracted as a factor. The items that loaded on the first factor reflected exploration and enrichment. Exploration and enrichment items were concluded as being theoretically similar—both accurately representing occupational engagement—thus should be included within the same factor. Therefore, we concluded that the OES-S consisted of a single factor. The factor loadings of the remaining 14 items were then evaluated. Using a cut-off loading of .55 to indicate that an item is a good measure of the overall factor (Comrey & Lee, 1992; Tabachnick & Fidell, 2013), 9 items were retained. A final PCA, single factor extraction was conducted on the 9 items (see Table 1). An item analysis demonstrated a coefficient α of .80 and the scree plot indicated a single factor. The measure was also assessed for distribution normalcy—both skewness (−.15) and kurtosis (−.35) were within the acceptable range. The OES-S mean score was 22.59 with an SD of 6.21.
Occupational Engagement Scale–Student (OES-S) Factor Loadings.
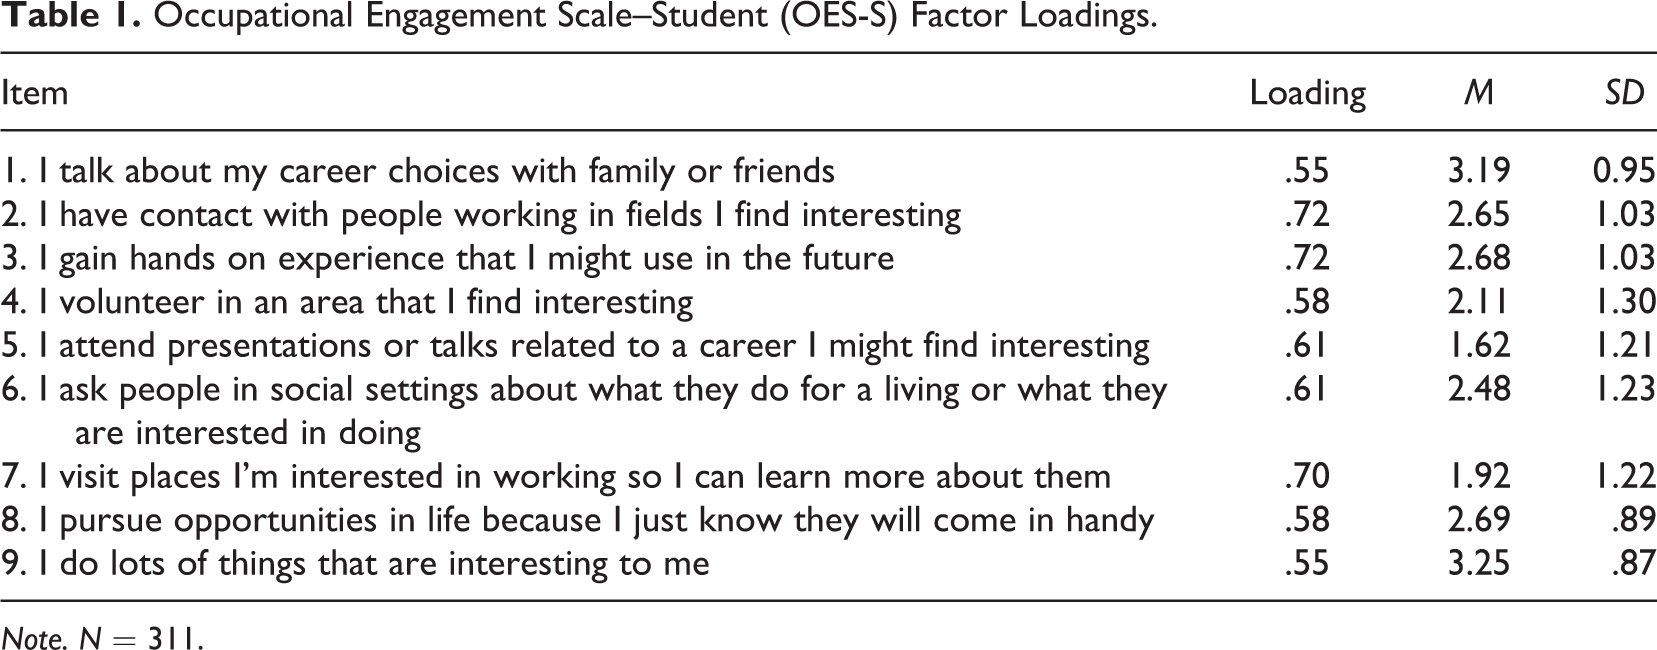
Note. N = 311.
Validity Evidence
Multiple regression was used to evaluate the relations between OES-S scores and several criteria (Table 2). Regression with covariates was used rather than bivariate correlations to reduce the Type I error rate. The covariates—gender, race/ethnicity, ACT score, age, and parents’ education level—were included in the model if they were significantly (p < .05) correlated with the criterion being predicted in that model.
Hierarchical Multiple Regression Analyses Predicting Criterion Validity Indices From Occupational Engagement.
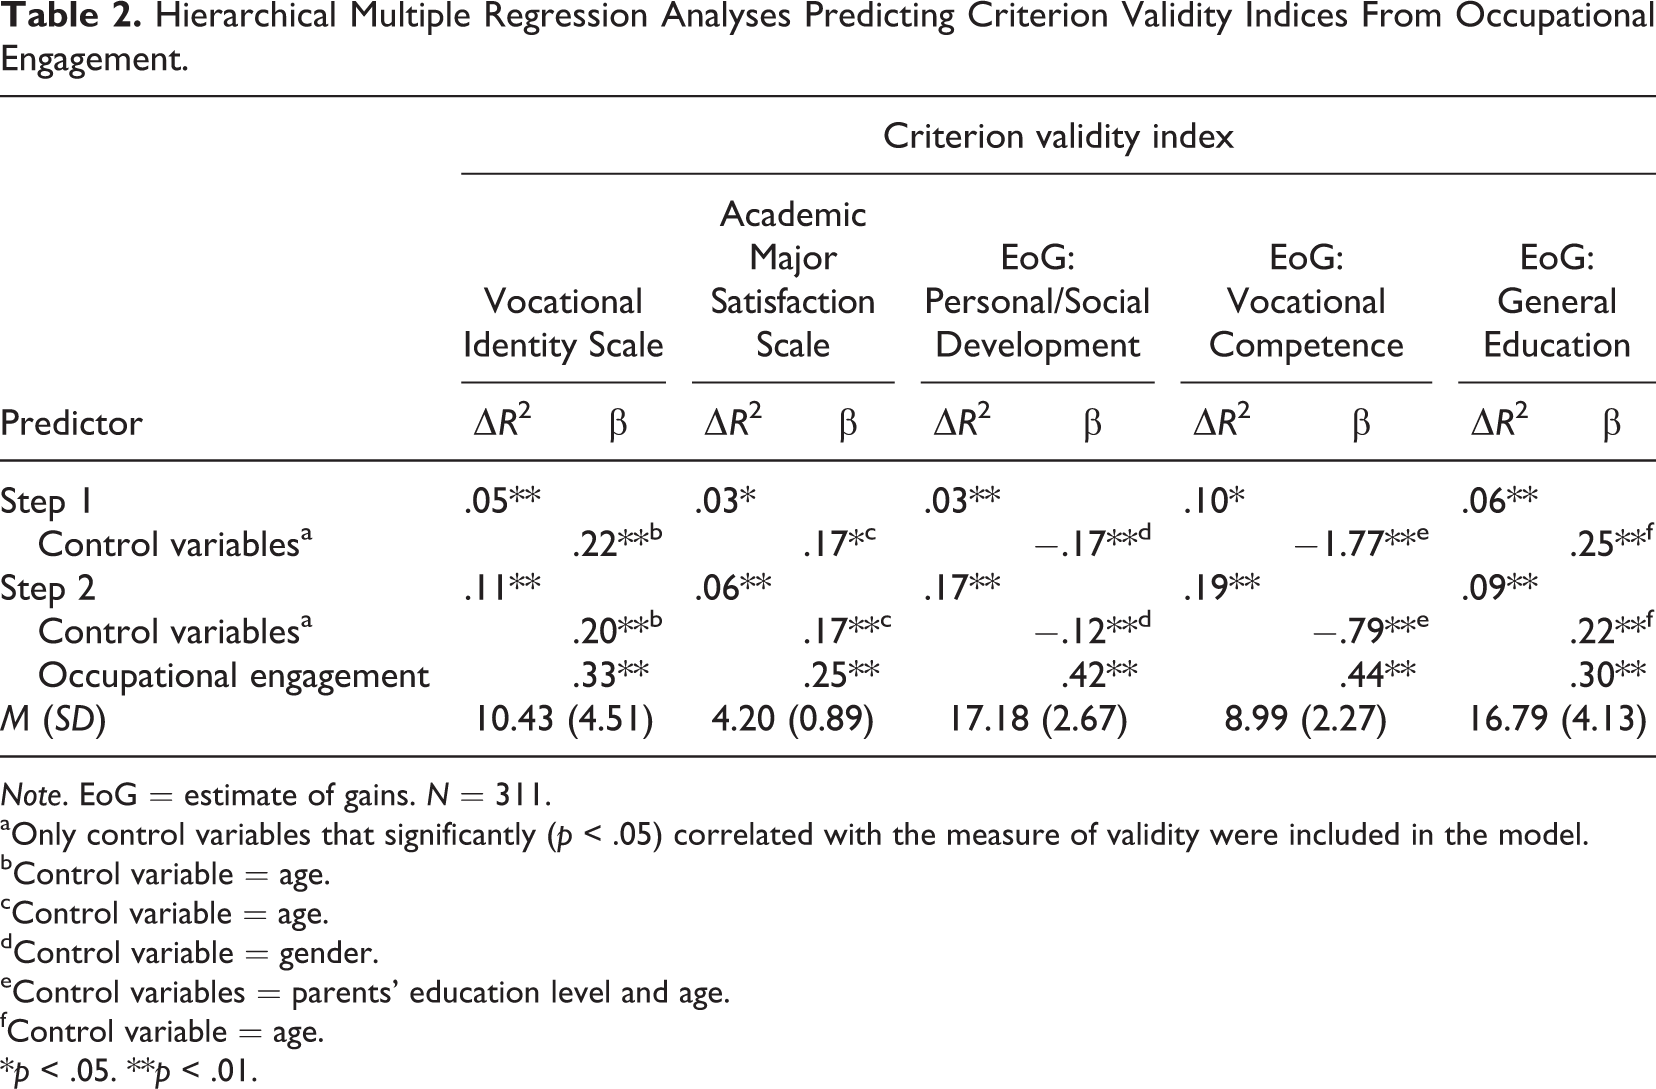
Note. EoG = estimate of gains. N = 311.
aOnly control variables that significantly (p < .05) correlated with the measure of validity were included in the model. bControl variable = age. cControl variable = age. dControl variable = gender. eControl variables = parents’ education level and age. fControl variable = age.
*p < .05. **p < .01.
Following are the results of the regression analyses. The OES-S accounted for a significant portion of the vocational identity variance after controlling for age, R2 change = .11, F(1, 308) = 38.20, p < .01. Cumulatively, age and occupational engagement accounted for 16% of the variance in vocational identity. The OES-S accounted for a significant portion of the major satisfaction variance after controlling for age, R2 change = .06, F(1, 222) = 15.15, p < .01. Cumulatively, age and occupational engagement accounted for 9% of the variance in major satisfaction. The OES-S accounted for a significant portion of the estimates of gains in personal/social development variance after controlling for gender, R2 change = .17, F(1, 308) = 65.78, p < .01. Cumulatively, gender and occupational engagement accounted for 19% of the variance in estimates of gains in personal development. The OES-S accounted for a significant portion of the estimates of gains in vocational competence variance after controlling for parents’ education level and age, R2 change = .19, F(1, 292) = 77.30, p < .01. Cumulatively, age, parents’ education level, and occupational engagement accounted for 29% of the variance in vocational competence. The OES-S accounted for a significant portion of the estimates of gains in general education variance after controlling for age, R2 change = .09, F(1, 308) = 31.96, p < .01. Cumulatively, age and occupational engagement accounted for 15% of the variance in estimates of gains in general education. Together, these findings support the criterion validity of the OES-S.
Study 2: Confirming the OES-S’s Factor Structure
The purpose of Study 2 was to evaluate whether the OES-S’s unidimensional factor structure would maintain in a second sample of college students. The measure’s factor structure was assessed via confirmatory factor analysis (CFA).
Method
Participants
The second sample consisted of 300 undergraduate college students from the same large, Midwestern, public university from which the Study 1 sample was drawn. Students were administered the research packet, consisting of the OES-S and a demographic questionnaire. The sample consisted of 179 (57.7%) women and 131 (42.3%) men; the mean age was 21.44 (SD = 2.47); and 255 (82.0%) identified themselves as Caucasian/White (non-Hispanic), 12 (3.9%) as African American/Black, 11 (3.5%) as Asian/Asian American/Pacific Islander, 10 (3.2%) as Latino/Latina, 7 (2.3%) as biracial/multiracial, 2 (.6%) as Native American, and 4 (1.3%) as Other.
Measures
The 9-item OES-S—which resulted from Study 1—and a demographic questionnaire were administered to all participants. To calculate a total score, the items were summed, resulting in a range of possible scores from 0 (least possible occupational engagement) to 36 (most possible occupational engagement).
Data Analysis
To evaluate the unidimensional nature of the OES-S, we conducted a CFA using a polychoric correlation and the robust weighted least squares means and variance adjusted estimator (i.e., WLSMV), which accounted for the ordinal categorical nature of the item response data (Muthén & Muthén, 2012). Then we evaluated the internal consistency using coefficient α and ordinal α. Ordinal α accounts for the ordinal nature of these types of data and may be a better index of internal consistency than coefficient α (Gadermann, Guhn, & Zumbo, 2012). All analyses were conducted in Mplus Version 6.11.
Results
First, a CFA was conducted and fit indices were evaluated. Fit indices evaluated were the root mean square error of approximation (RMSEA), the Tucker–Lewis Index (TLI), and the comparative fit index (CFI). Commonly used thresholds for the RMSEA are less than 0.05 indicates good fit, 0.08 to 0.10 indicates mediocre fit, and greater than 0.10 indicates poor fit (Browne & Cudeck, 1993). Further, TLI and CFI greater than .95 indicates good fit (Hu & Bentler, 1999). The fit for this model was good, χ2(27) = 79.105, p < .01, RMSEA = .08 (90% confidence interval of [.06, .10]), TLI = .94, CFI = .95. The TLI falling slightly below the suggested threshold was not surprising due to the impracticality of strictly unidimensional psychosocial measures (Slocum-Gori, Zumbo, Michalos, & Diener, 2009). Both evaluations of internal consistency resulted in strong α values, a coefficient α of .80 and an ordinal α of .84. Taken together, the findings of Study 2 support the unidimensionality of the OES-S.
Discussion
The purpose of this project was to develop and evaluate a measure of occupational engagement in college students. This resulted in the 9-item self-report OES-S, which was internally consistent and predicted five indices of criterion validity.
Occupational engagement is purported to fund the decision maker’s knowledge about the self, the world, and the relation between the self and the world (Krieshok et al., 2009). This hypothesis was supported in our study via the relation between occupational engagement and vocational identity, gains in personal/social development, gains in vocational competence, and gains in general education. Further, Krieshok and colleagues noted that increasing knowledge about the self, the world, and the relation between the self and the world allows the decision maker to reach satisfying decisions. This hypothesis was supported via the relation between occupational engagement and academic major satisfaction. This process of using experientially based self and world knowledge for decision making may be inconsistent with some common practices of applied vocational psychologists, who often use interest inventories and personality assessments to aid decision making (Krieshok, Motl, & Rutt, 2011). Within the trilateral model, the counselor aids the decision maker in becoming involved in a breadth of activities that fund the decision maker’s self and world knowledge, which results in well-informed decisions. Thus, the broad goal is to encourage occupational engagement, even beyond the narrower and intermittent goal of making a specific decision. From our perspective, students would be well served by schools making occupationally engaging activities part of their curriculum. These activities could include job shadows, volunteering, informational interviews, and internships.
In the context of career counseling, counselors can use the OES-S to identify clients’ previous occupationally engaging behaviors. From these experiences, counselors can help clients pinpoint what they learned about themselves, the world, and the relation between themselves and the world that they can use to assist them in making career-related decisions. This knowledge could include values, skills, interests, and other information. The OES-S can also be used by career counselors to determine which occupationally engaging behaviors clients are not engaged in. Then, counselors can collaborate with clients to implement experiential activities that increase their occupational engagement. Part of the practitioner’s role may be exploring with clients what has prevented them from being occupationally engaged. As career counselors, we (i.e., the first three authors) have encountered clients’ resistance from a variety of sources (e.g., lack of information about how to be occupationally engaged, anxiety), which we spend substantial time helping clients reduce. For example, the third author had a client who was reluctant to pursue volunteer opportunities in an area of interest due to her belief that she was unqualified. To build client confidence, the counselor and client explored the client’s skills (e.g., organization, communication, humor) and—although still anxious—the client applied for and received a volunteer position that ultimately resulted in an internship.
Limitations and Future Directions
This study has several limitations that call for future research. First, the samples were homogeneous regarding the racial/ethnic backgrounds of the students and the university from which students were sampled. Occupational engagement may manifest itself differently in different populations; while these 9 items (i.e., behaviors) covaried in this sample, other items may covary in other populations. Thus, evaluating the OES-S’s factor structure and validity in other U.S. and international populations would aid our understanding of the measure’s multicultural validity.
In the present studies, validity was evaluated cross-sectionally. Krieshok, Black, and McKay (2009) hypothesized that occupational engagement results in increased knowledge about the self, the world, and the relation between the self and the world, and that this knowledge is used to make well-informed career-related decisions. By using longitudinal studies, this causal hypothesis would be better tested. Also, analyses using structural equation or path modeling would improve our understanding of the trilateral model.
Further psychometric evaluation, such as evaluating the OES-S’s test–retest reliability and its discriminant validity would be valuable. In this study, we solely used self-report measures of validity. Triangulating indices based on self and other reporters would aid our confidence in the relation between occupational engagement and other constructs.
Finally, these studies did not evaluate the decision-making components of the trilateral model (i.e., combining intuitive and rational processes improves decisions; Krieshok et al., 2009). While some intuitive decision-making strategies have been suggested (e.g., mindfulness; Krieshok et al., 2011), research evaluating intuition-targeted career interventions is needed. It is possible that by being occupationally engaged, decision makers rely on an increased fund of self and world knowledge that improves only rational or only intuitive components of decision making. Future research is needed to better understand rational and intuitive aspects of career decision making.
Footnotes
Declaration of Conflicting Interests
The author(s) declared no potential conflicts of interest with respect to the research, authorship, and/or publication of this article.
Funding
The author(s) received no financial support for the research, authorship, and/or publication of this article.