
Abstract
Despite increasing evidence that negative stereotypes adversely affect the career development of women in science, technology, engineering, and mathematics, measuring their effects has been a challenge. This study focuses specifically on the sciences, since some, particularly physics, are notably imbalanced in terms of gender diversity. Our aim was to develop and begin to validate a measure of gender stereotypes in science, referred to as the Stereotype Threat in Science Scale-Gender (STSS-G). Participants consisted of 629 undergraduate women enrolled in biology, chemistry, and physics courses. Results of exploratory and factor mixture analyses yielded support for a 7-item scale consisting of two factors, social identity and identity threat, and five latent classes underlying a heterogeneous population. Results of structural equation modeling indicated that the two latent variables were significantly associated with scores on existing measures of science identity and stereotype threat. The construct, differential, and concurrent validity of the STSS-G are discussed.
Keywords
Although women have consistently outnumbered men in undergraduate education, the female share of bachelor’s degrees in science, technology, engineering, and mathematics (STEM) disciplines remains below parity according to the National Science Foundation (NSF, 2013). Moreover, a recent U.S. Census Bureau survey indicates that women makeup 53% of college graduates but only 41% of science and engineering graduates (Landivar, 2013). This underrepresentation is particularly striking in computer science, engineering, and physics. In 2010, women received only 18.2% bachelor’s degrees in computer science, 18.4% in engineering, and 20.3% in physics (NSF, 2013). It has therefore become vital to maximize the utilization of human resources and foster STEM involvement among those who have historically been underrepresented in this sector of the workforce. Paradoxically, while leaders in government, education, business, and industry recognize the need to grow the U.S. STEM workforce, members of underrepresented groups face obstacles that make their ability to enter and sustain careers in STEM more difficult. For women, one of these obstacles is sociocultural, namely, the stereotypical belief that women (a) cannot succeed in STEM because they do not have the requisite skills to do so and/or (b) should not pursue these careers because to do so would be a violation of traditional gender role norms.
The impact of gender stereotyping on career decision making has been a topic of scholarly inquiry among career development theorists and researchers since the proffering of Gottfredson’s (1981, 2002) seminal theory of circumscription and compromise (TCC). This theory proposes that individuals strive to find their place in the social order by developing their social identities through the occupations they choose. Three factors are taken into account in this decision-making process, namely, (a) the sex type of the career under consideration, (b) its prestige level, and (c) the type of work involved. These factors act to narrow the individual’s perceived range of viable options as careers are gradually ruled out of consideration if they are not consistent with one’s social identity (e.g., gender identity). Individuals are theorized to ultimately compromise their positions with respect to occupational choice by selecting careers that are viewed as being more realistic than ideal careers. However, a review of the literature revealed that much of the research in this area focuses on compromise (e.g., Blanchard & Lichtenberg, 2003; Junk & Armstrong, 2010; Leung & Plake, 1990; Tsaousides & Jome, 2008) rather than circumscription. Given that circumscription temporally precedes compromise in Gottfredson’s theory (Gati, 1993; Gottfredson, 1981), it is important to develop tools that may provide some indication of the number of occupations within a given zone of acceptable alternatives that an individual has to choose from.
The roles of occupational and gender stereotyping figure prominently in Gottfredson’s (1981, 2002) theory. However, while the TCC describes how negative stereotypes affect vocational identity development and career decision making across time, it does not explicitly explain the psychological mechanisms by which stereotypes affect people. Rather, the study of stereotyping has traditionally fallen under the purview of social psychologists. Consequently, few efforts have focused on developing instruments designed to measure how and to what extent stereotypes are implicated in career functioning. In this study, we draw upon both Gottfredson’s theory and stereotype threat (Steele, 1997; Steele & Aronson, 1995) theory, using an integrated framework to guide the development of a self-report measure aimed at tapping women’s perceptions of stereotyping in science. We examine these perceptions as they occur within biology, chemistry, and physics classrooms, given that these classes serve as gateways to not only scientific careers but engineering and technology careers as well.
Stereotype Threat
Stereotype threat refers to a state of discomfort that arises when one is at risk of confirming a negative stereotype about his or her ability to perform successfully in a given domain (Steele, 1997; Steele & Aronson, 1995). To be vulnerable to stereotype threat, one must be a member of a stigmatized group and identify with a task or domain of tasks about which a stereotype refers. Stereotype threat is thus theorized to exert negative effects on performance in situations in which a task is deemed to be personally important to the individual and implicates one’s social identity in the process. Considerable research has focused on women and the stereotypical belief that they are inferior to men in math and math-based disciplines such as engineering and physics. Results of several experimental studies have shown that women underperform on difficult math tests when informed that the tests produce gender differences, while their control counterparts performed as well as men when the tests were presented to be gender neutral (Keller, 2002; Quinn & Spencer, 2001; Spencer, Steele, & Quinn, 1999). Of course, gender stereotypes are not always explicitly detectable in actual academic achievement situations, but there is evidence to suggest that even subtle cues within the environment can cause concerns for women. Situational factors such as being outnumbered by men in a general academic area (Steele, James, & Barnett, 2002) and even in situations as specific as a classroom setting (Deemer, Thoman, Chase, & Smith, 2014) are associated with feelings of being negatively stereotyped. These findings reflect the notion that stereotype threat is more a function of the unique aspects of specific situations than maladaptive expectations that may reflect more stable, trait-like characteristics of the individual (Marx, Brown, & Steele, 1999).
Schmader, Johns, and Forbes (2008) have proposed a model which provides a convincing account of the process by which stereotype threat affects performance. Their model suggests that stereotype threat induces a cascade of negative cognitions that necessarily distract one’s attention from the task at hand and ultimately reduces working memory. This working memory hypothesis has been supported empirically (Schmader & Johns, 2003) and further substantiated through neurocognitive research indicating women who are exposed to stereotype threat experience heightened activity in regions of the brain that are implicated in executive functioning (Krendl, Richeson, Kelley, & Heatherton, 2008). A critical antecedent of cognitive load in this model is physiological arousal. Schmader et al. (2008) surmised that heightened arousal elicited by stereotype threat (Ben-Zeev, Fein, & Inzlicht, 2005; Murphy, Steele, & Gross, 2007; O’Brien & Crandall, 2003) may engender the aforementioned maladaptive cognitions as well as attempts to suppress them. This model is consistent with the view that women likely adopt avoidance goals in response to stereotype threat (Smith, 2004, 2006) considering that this motivational orientation is concerned with the demonstration of incompetence. Threatening stereotypes exert not only immediate effects on performance but also have the long-term effect of gradually eroding one’s identification with a domain (Woodcock, Hernandez, Estrada, & Schultz, 2012). This notion is consistent with the notion of circumscription advanced by Gottfredson (1981, 2002).
Stereotype Threat Measures
A number of scales have been developed for the purpose of measuring stereotype threat, but upon examining some of these scales, we discovered three important deficiencies. First, all of the scales were found to assess stigma consciousness, or the awareness that one is the target of a stereotype, but some do not measure respondents’ identification with a group or domain. For example, the 8-item Stereotype Vulnerability Scale (SVS; Spencer, 1993) broadly measures stigmatization (e.g., “because of your gender, some people believe you have less ability”), but it does not situate women’s perceptions of stigma in a particular context, such as math, science, or engineering, which are all domains that are gender stereotyped to varying extents. Similarly, the 56-item Academic Stereotype Threat Inventory (Pseekos, Dahlen, & Levy, 2008) measures stigma consciousness as well as the degree to which women endorse gender-math stereotypes, but it does not elicit women’s reflections on their gender identity. Self-esteem is thought to derive not only from personal successes, attitudes, values, and so on but also the awareness that we belong to social groups comprised of people with whom we share similar beliefs and characteristics (Turner, 1982). Individuals are not only vulnerable to decreased self-esteem should they not meet their own personal performance expectations, but their collective self-esteem may also suffer to the degree that they believe poor performance reflects negatively on the social group they represent (McCoy & Major, 2003). Thus, assessing the degree to which one identifies with his or her social group—whether it is gender, race, or any other social category—should be a requisite component of any stereotype threat measure.
Second, none of these scales measures the affective consequences of being exposed to threatening stereotypes. This is an important consideration because physiological arousal is believed to be one of the leading explanations for why individuals underperform in situations in which stereotypes are made relevant (Ben-Zeev et al., 2005; O’Brien & Crandall, 2003). Indeed, studies have shown that performance suffers as a function of arousal conditions as indicated by physiological responses such as increased skin conductance (Osborne, 2007) when stereotype threat has been manipulated in laboratory research. Physiological arousal is a critical antecedent of the types of outcomes that are relevant to women’s academic and STEM career development, including mathematics self-efficacy (Lent, Brown, Gover, & Nijjer, 1996) and performance (Ben-Zeev et al., 2005; O’Brien & Crandall, 2003), and sense of belonging (Murphy et al., 2007).
Finally, accurate measurement of threatening stereotypes needs to take into account the situational specificity with which they are activated. Steele (1997) noted that negative stereotypes represent a “threat in the air,” suggesting that their activation depends on situational cues that are present in the immediate environment. Cues that may determine the severity of threat or even whether threat is activated include information about gender composition in the environment, the gender role attitudes of those participating in and/or observing the task, the degree to which the task has been stereotyped, and the difficulty of the task itself (Nguyen & Ryan, 2008; O’Brien & Crandall, 2003). Unfortunately, existing scales measure only the global effects of stereotype threat. We address this measurement specificity issue in this research.
Current Study
Adequate self-report measures are critically needed in order to better understand how stereotype threat affects the career development of women in science. Current measures do not provide adequate coverage of the psychological dimensions of stereotype threat, they do not locate threatening stereotypes in the specific contexts in which they are likely to be activated, and perhaps most importantly, no instruments have been developed to date that directly refer to science as a stereotyped domain. The purpose of this study was to develop a scale which addresses these problems, hereafter referred to as the Stereotype Threat in Science Scale-Gender (STSS-G). Our aims were twofold. First, we wished to develop a measure which differs from existing measures in that it purports to tap both the affective and the social identity correlates of stereotype threat. Second, we wished to begin gathering evidence of the measure’s construct, differential, and concurrent validities.
An abundance of research exists on mathematics as a stereotyped domain (e.g., Fogliarti & Bussey, 2013; Good, Aronson, & Harder, 2008; Keller, 2002); however, there is a dearth of research on understanding whether women are vulnerable to the view that they cannot succeed in scientific careers. Physics is a candidate for stereotyping, given its math-intensive nature, and, indeed, some evidence indicates that women in physics are vulnerable to stereotype threat (Miyaki et al., 2010). In contrast, women outnumber men in biology and are equitably represented in chemistry (NSF, 2013), which raises the question of whether gender stereotypes exist for these fields. However, identifying women who are vulnerable to stereotype threat is likely more complicated than simply determining whether they are physics versus biology or chemistry majors. With respect to construct validity, it was hypothesized that the STSS-G would evidence a two-factor structure corresponding to the theorized affective and social identity elements of stereotype threat. Second, concurrent validity was expected to be demonstrated through positive relationships between these two factors and existing measures of science identity and stereotype threat.
Finally, STSS-G scores were expected to demonstrate differential validity through their ability to discriminate between latent groups who would be theoretically expected to be vulnerable to and affected by negative stereotypes and those that are not. No a priori hypotheses were formulated with respect to the heterogeneity of the population underlying the data as this aspect of the study was exploratory in nature. However, we did establish six latent classes as an upper bound for the analysis, given that participants represented roughly six clusters of academic majors—biology, chemistry, physics, mathematics, engineering, and all remaining non-STEM majors.
Method
Scale Development
An initial pool of 20 items was generated by the authors using a theoretical-rational approach aimed at accurately defining the target construct. These items were believed to reflect the three elements theorized to be preconditions for stereotype threat to be manifested, that is, (a) a triggering negative stereotype, (b) identification with the targeted domain, and (c) identification with the social group implicated by the stereotype. They were then submitted to two experts in the area of stereotype threat for review of item content and clarity. Nine items were removed due to lack of clarity or poor conceptual coverage of the construct, thus resulting in a pool of 11 items to be tested (see Table 1). Seven items tap the affective consequences of facing threatened social identities. We thus labeled this factor identity threat. We also developed 4 items that reflect the dynamic way in which multiple identities intersect and are integrated into the self (Roccas & Brewer, 2002). We wanted respondents to consider their conceptions of self as women in science, not from the perspective of their gender and science identities as being distinct and unrelated entities. For this reason, terms such as “women,” “gender,” and “science” are used in combination within these items. This factor is labeled social identity to broadly represent the interconnection between these identities.
Stereotype Threat in Science Scale-Gender Items.
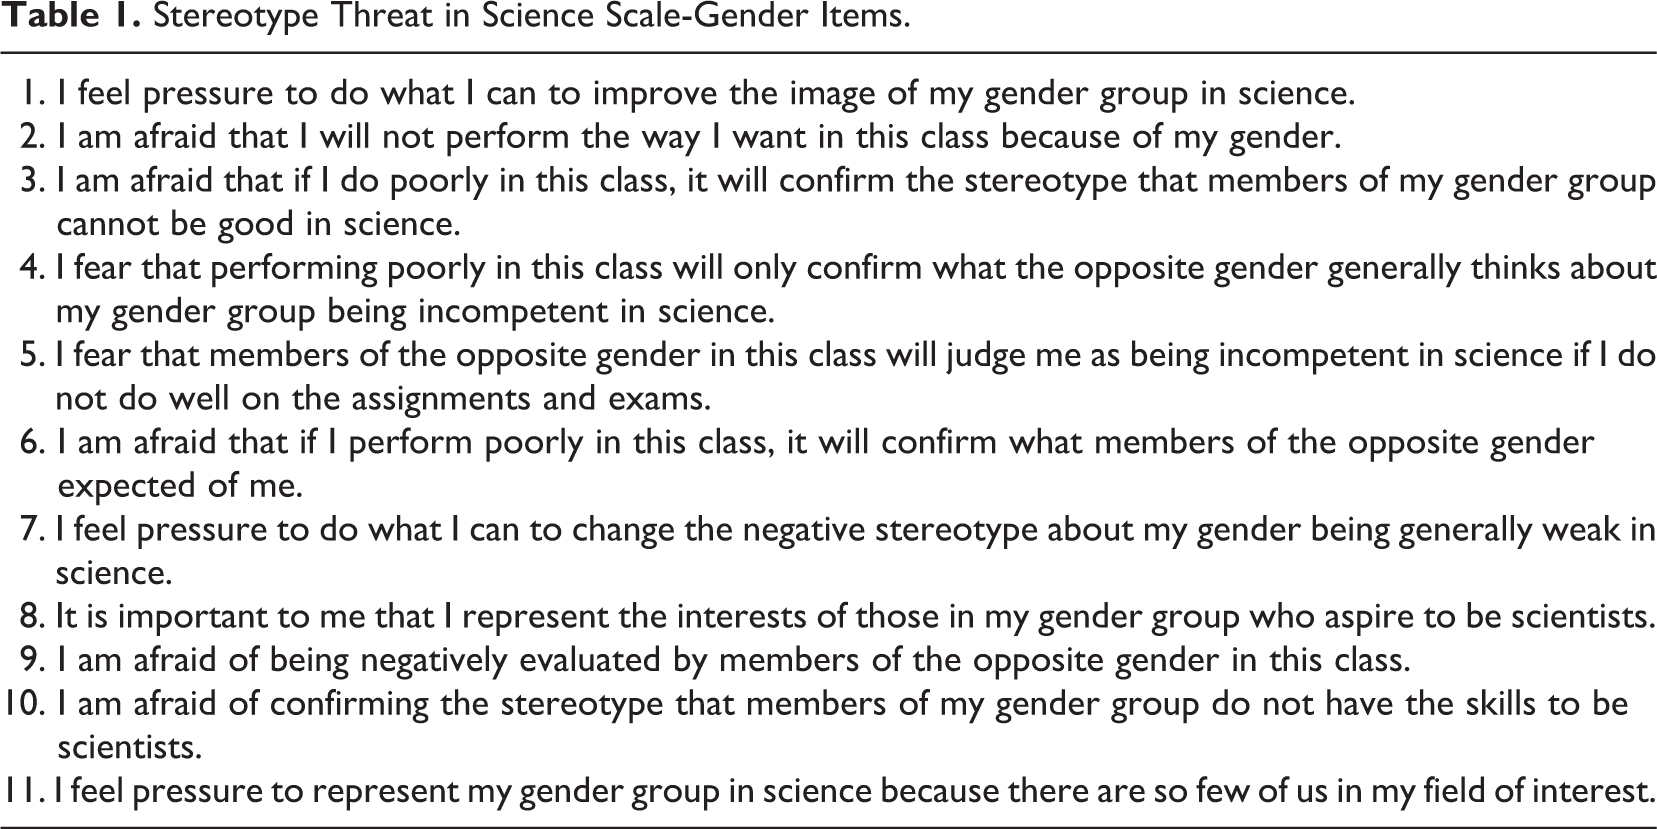
Self-report measures of stereotype threat are likely to be susceptible to floor effects for two reasons. First, respondents who do not identify with a targeted group or domain would not be expected to score high or even in the average range on these measures because they are not vulnerable to the stereotype. Second, some individuals might have concerns about appearing psychologically vulnerable by admitting to feeling threatened, leading possibly to socially desirable responding and positively skewed scores (Paulhus & Reid, 1991). The STSS-G was thus based on an ordinal scale with the expectation that, overall, most participants would endorse little to no stereotype threat and few would endorse the highest scoring category. There are four scoring categories associated with each item, that is, 0 (never), 1 (rarely), 2 (sometimes), and 3 (often).
Participants
The sample consisted of 664 female undergraduate students. Thirty-five cases with missing data were removed using listwise deletion, resulting in a final N of 629. Age ranged from 18 to 40 (M = 20.01, SD = 2.38). Reported academic majors were as follows: 19.7% biology, 16.9% engineering/engineering technology, 7.2% chemistry/biochemistry, 7.3% dietetics/food science, 5.5% animal science/preveterinary, 5.5% ecology/environmental science, 5.1% pharmacy, 4.1% elementary education, 1.5% undeclared, 1.3% science/math education, 1.0% physics, 0.8% nursing, 0.6% math, 0.2% computer science, and 22.7% represented all other majors. Most participants identified as White (78.6%), followed by 10.7% Asian American, 3.2% multiracial, 3.0% Latino, 2.4% African American, 0.8% Arab American, 0.6% identified as other, and 0.6% Native American. In terms of academic classification, 34.9% reported being sophomores, 31.2% were freshmen, 18.3% were juniors, and 15.6% were seniors.
Measures
Stereotype threat
The SVS (Spencer, 1993) was used as a concurrent measure of stereotype threat in this study. Items are based on the anchor statement “Because of your gender….”. Items are rated on a 5-point Likert-type scale ranging from 1 (strongly disagree) to 5 (strongly agree), with higher scores indicating greater endorsement of stereotype threat. An example item includes “Some people believe that you have less ability.” Previous research supports the measure’s construct validity as Steele, James, and Barnett (2002) showed that women in male-dominated academic majors scored significantly higher on the SVS than women in female-dominated majors. They also found that the SVS possesses acceptable internal consistency reliability (α = .84). SVS scores evidenced very good reliability in this study (α = .93).
Science self-efficacy
In order to measure participants’ science self-efficacy we utilized the 5-item Confidence in Learning Science (CLS) subscale of the 30-item Science Motivation Questionnaire (Glynn & Koballa, 2006). Participants are asked to respond to the root statement “When I am in a college science course … ” based on a Likert-type scale ranging from 1 (never) to 5 (always). An example of a specific response item is “I believe I can master the knowledge and skills in the science course.” CLS scores have evidenced good internal consistency in past research, as a Cronbach’s alpha coefficient of .89 has been reported in two separate studies (Deemer, Thoman, Chase, & Smith, 2014; Taasoobshirazi & Glynn, 2009). Cronbach’s alpha was .84 in this study.
Science identity
Science identity was measured using an adapted version of a group identification measure developed by Doosje, Ellemers, and Spears (1995). The original 4-item scale was developed with the intent of measuring academic identity. An example of an original item includes “I see myself as a psychology student.” The four adapted items used in this study were as follows: (a) “I see myself as a science student”; (b) “I am pleased to be a science student”; (c) “I feel strong ties with other science students”; and (d) “I identify with other science students.” A fifth item was added by Deemer and colleagues (Deemer, Smith, Thoman, & Chase, 2014), “I feel that being a science student is an important reflection of who I am,” in order to increase coverage of the construct. Deemer et al. showed that the 5-item measure has good internal consistency reliability (α = .85). Coefficient α in this study was .84.
Avoidance goals
The mastery avoidance (MAV) and performance avoidance (PAV) goal subscales of the Achievement Goal Questionnaire-Revised (Elliot & Murayama, 2008) were used to measure avoidance motivation. Both the MAV and the PAV scales consist of 3 items each, with the MAV scale measuring a desire to avoid demonstrating incompetence to self and the PAV scale tapping a desire to avoid demonstrating incompetence relative to others. Cronbach’s α coefficients were .77 and .84 for the MAV and PAV goals, respectively. Items are scored on a Likert-type scale ranging from 1 (strongly disagree) to 5 (strongly agree). The construct validity of both goal types has been supported through empirical linkages with fear of failure and need for achievement (Elliot & Murayama, 2008).
Procedure
All data were collected across three academic terms between Fall 2012 and Fall 2013 using an online survey. Students were recruited from biology, chemistry, and physics courses at three universities in the Southwestern, Northwestern, and Midwestern United States. Lists of randomly selected classes were generated and submitted to the registrar’s offices of each university, who then sent e-mail requests for participation to enrolled students. Most of the classes sampled were 100-level courses (31.8%), followed by 200-level courses (28.7%), 300-level courses (21.3%), and 400-level courses (18.2%). A total of 2,077 students were recruited from the Northwestern university, 1,320 from the southwestern university, and 988 from the Midwestern university (total N = 4,385), resulting in a response rate of 15.1%. Upon submitting their responses, participants were directed to a debriefing page which explained the purpose of the research. Participants received a US$10 electronic gift card for their involvement in the study.
Results
Exploratory Factor Analysis
All factor analysis and mixture modeling work was conducted using Mplus 7.11 (Muthén & Muthén, 1998–2013) statistical software. To evaluate the underlying structure of the STSS-G, an exploratory factor analysis (EFA) was first performed on the polychoric correlation matrix produced by the 11 items using a means- and variance-adjusted weighted least squares estimator (WLSMV) with geomin rotation. We considered the possibility that the STSS-G has a unidimensional structure; therefore, we compared a one-factor solution to the hypothesized two-factor solution. A number of items were identified as contributing to model misfit and were therefore removed from the analysis. The proportion of responses per category for item 8 deviated substantially from a rank-ordered pattern as more participants endorsed “sometimes” (32.4%) than both “never” (29.3%) and “rarely” (17.5%). This response pattern was deemed to be conceptually inconsistent with science identification, given that non-STEM majors presumably have little intention of becoming scientists themselves. For item 1, participants endorsed sometimes (27.4%) more frequently than rarely, but because its overall ordinal pattern remained largely intact, this item was retained. Preliminary analysis of the data also indicated that items 2 (λ = 1.04) and 6 (λ = 1.02) produced Heywood cases as their loading coefficients exceeded the bounds of 0 and 1. Finally, response patterns for items 3 and 4 were nearly identical, resulting in an excessively high interitem correlation (r = .986). Item 3 was retained because it was determined to be written somewhat more clearly and concisely than item 4.
The remaining 7 items were retained for the final scale. Factor loadings and response proportions are presented in Table 2. The number of extracted eigenvalues for the first two factors was 5.76 and .55. Although this might indicate support for a one-factor model by conventional standards (i.e., retaining factors with eigenvalues > 1), the fit of the one-factor model was not acceptable, χ2(14, N = 629) = 323.03, p = .000, comparative fit index (CFI) = .987, root mean square error of approximation (RMSEA) = .187 (90% confidence interval [CI]: .170, .205), Tucker–Lewis index (TLI) = .981, and standardized root mean square residual (SRMR) = .048. In contrast, the two-factor model was found to provide adequate fit to the data, χ2(8, N = 629) = 45.09, p = .000, CFI = .998, RMSEA = .086 (90% CI: .062, .111), TLI = .996, SRMR = .009, with items 1, 7, and 11 loading on social identity and items 3, 5, 9, and 10 loading on identity threat.
EFA Loadings and Category Endorsement Proportions for Ordinal STSS-G Items.
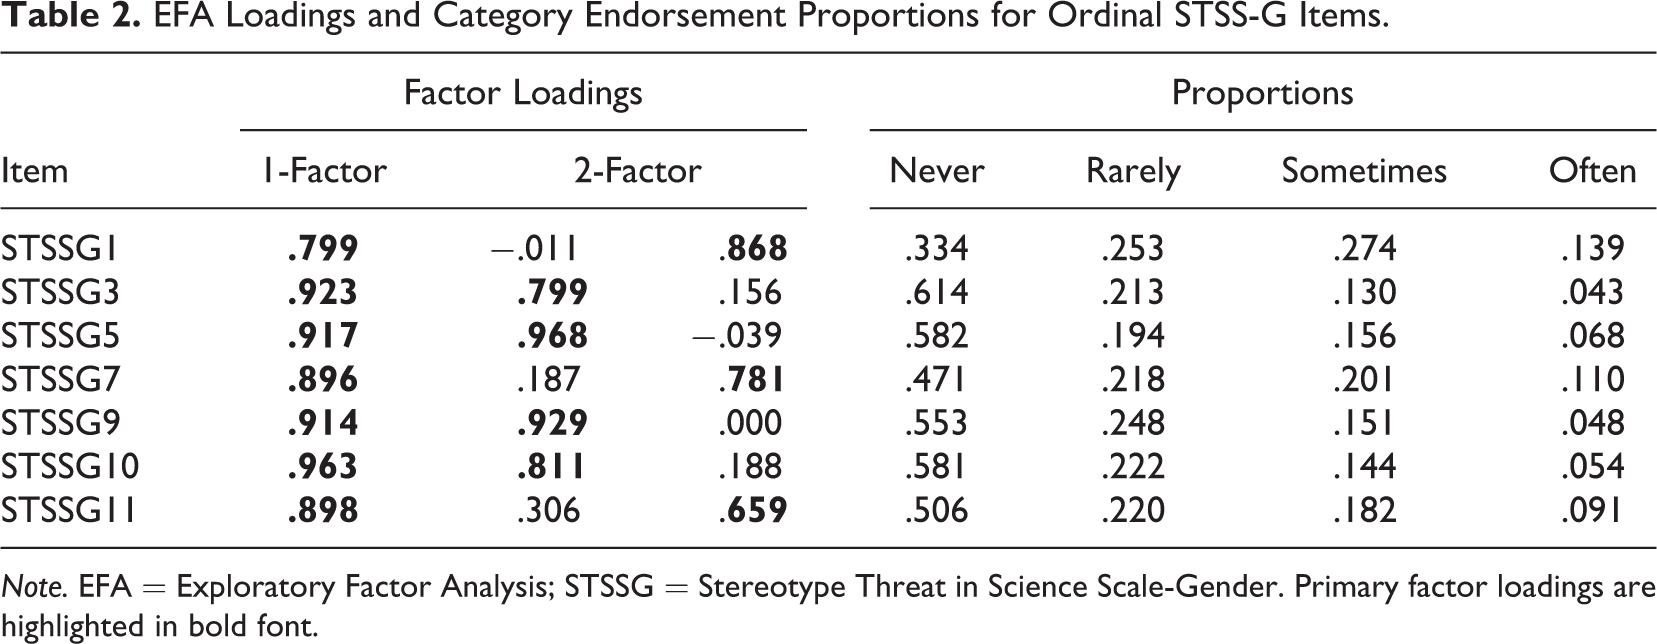
Note. EFA = Exploratory Factor Analysis; STSSG = Stereotype Threat in Science Scale-Gender. Primary factor loadings are highlighted in bold font.
Factor Mixture Analysis
Next, we performed a factor mixture analysis (FMA) using the 2-factor model identified in the EFA in order to assess the differential validity of STSG-G scores. Representing a combination of factor analysis and latent class analysis, factor mixture modeling is a flexible approach which allows the researcher to simultaneously model clustering around both variables and unobserved groups of individuals (Lubke & Muthén, 2005). We separately examined the fit of several models with each consisting of two latent factors and one to six latent classes. Six latent classes were believed to adequately capture the range of heterogeneity underlying the data considering the participants’ various academic classifications.
Measures used to evaluate model fit and determine the optimal number of classes included the (a) Akaike Information Criterion (Akaike, 1973), (b) Bayesian Information Criterion (Schwarz, 1978), (c) Vuong-Lo-Mendell-Rubin likelihood ratio (LMR LR) test (Lo, Mendell, & Rubin, 2001), (d) bootstrap likelihood ratio test (BLRT; McLachlan, 1987), and (e) entropy statistic. Lower values of the information criteria indicate better model fit, while the likelihood ratio (LR) tests involve sequentially comparing models with c classes to models with c – 1 classes. A nonsignificant LR test indicates that the model should be rejected in favor of the more parsimonious c – 1 class model. Entropy values range from 0 to 1, with a value 1 indicating perfect class membership. Clark (2010) has suggested that entropy values of .80 and higher indicate acceptable classification. Robust maximum likelihood estimation was employed using 500 initial stage random starts and 100 final stage optimizations. The BLRT was additionally conducted under the specification of 200 bootstrap draws.
As Table 3 indicates, the models improved in classification quality as classes were added, as evidenced by progressively smaller information criteria values and significant LR tests. However, the six-class model did not offer a significant improvement over the five-class model according to the LMR LR test (p = .30). We therefore retained the two-factor, five-class model. Categorical response proportions and class membership frequencies are reported in Table 4. Concentrations of scores on the social identity and identity threat items (i.e., high, low, and moderate), participants’ academic majors, and the courses in which STSS-G scores were reported were used as criteria for defining the latent groups. The top three majors represented in class 1 were biology (n = 18), non-STEM (n = 14), and engineering/engineering technology (n = 10). Most participants in this group reported their perceptions of stereotype threat in the context of biology and chemistry classes (n’s of 31 and 27, respectively), which are theoretically expected to be less stereotyped than physics. Results for this group also indicated moderate endorsement of social identity items but low endorsement of identity threat. Given the combination of moderate identification, low salience of stereotyping in biology and chemistry courses, and majority representation of biology majors, this group was labeled moderate vulnerability, low threat.
Summary of Fit Statistics for the 2-FACTOR Mixture Models.
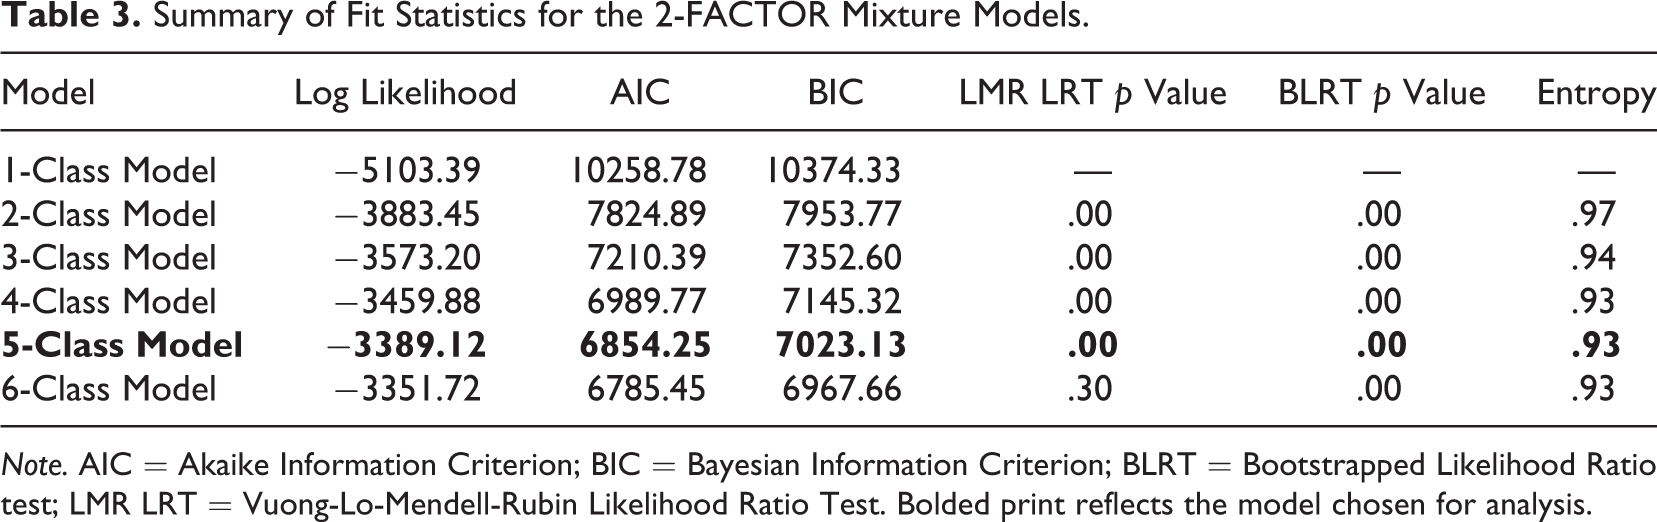
Note. AIC = Akaike Information Criterion; BIC = Bayesian Information Criterion; BLRT = Bootstrapped Likelihood Ratio test; LMR LRT = Vuong-Lo-Mendell-Rubin Likelihood Ratio Test. Bolded print reflects the model chosen for analysis.
Response Proportions for Five, 2-FACTOR Latent Class Models.
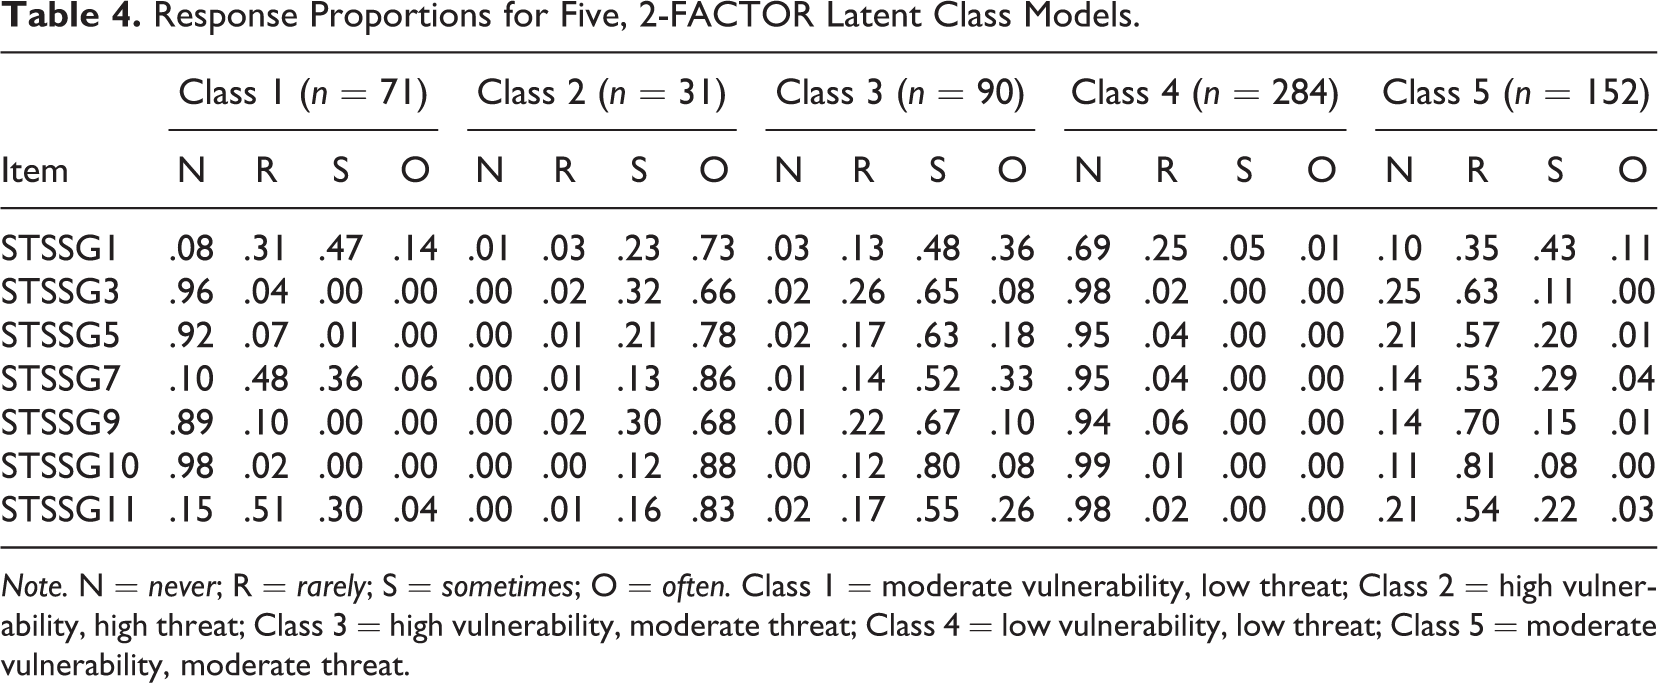
Note. N = never; R = rarely; S = sometimes; O = often. Class 1 = moderate vulnerability, low threat; Class 2 = high vulnerability, high threat; Class 3 = high vulnerability, moderate threat; Class 4 = low vulnerability, low threat; Class 5 = moderate vulnerability, moderate threat.
Participants in class 2 (n = 31) reported a high degree of both social identity and identity threat. Stereotype threat perceptions in this group were reported mainly in the context of physics classes (n = 19) and more than one half of the participants identified as engineering/engineering technology majors (n = 16). This group was thus defined as high vulnerability, high threat. Most of the participants in class 3 (n = 90) were also in physics courses (n = 39) compared to biology (n = 22) and chemistry (n = 29). Engineering/engineering technology was the most frequently reported major in this group (n = 21), followed by non-STEM (n = 18), biology (n = 14), and chemistry/biochemistry (n = 7). Between 81% and 85% of the participants endorsed sometimes or often for the social identity items while sometimes was the most frequently endorsed category for the identity threat items. This group was therefore labeled high vulnerability, moderate threat.
Representing the largest of the five groups, class 4 (n = 284) was labeled low vulnerability, low threat as almost every participant endorsed either never or rarely for every STSS-G item. The majority of participants in this group were non-STEM majors (n = 70) enrolled in biology courses (n = 132). Finally, class 5 was labeled moderate identity, moderate threat as most participants (76–89%) endorsed either rarely or sometimes for every STSS-G item. Most participants in this group identified as non-STEM (n = 32), biology (n = 28), and engineering/engineering technology (n = 24) majors, and being enrolled in biology and chemistry courses (n’s of 59 and 61, respectively). Probabilities for likely latent class membership are presented in Table 5.
Classification Probabilities for Likely Latent Class Membership.
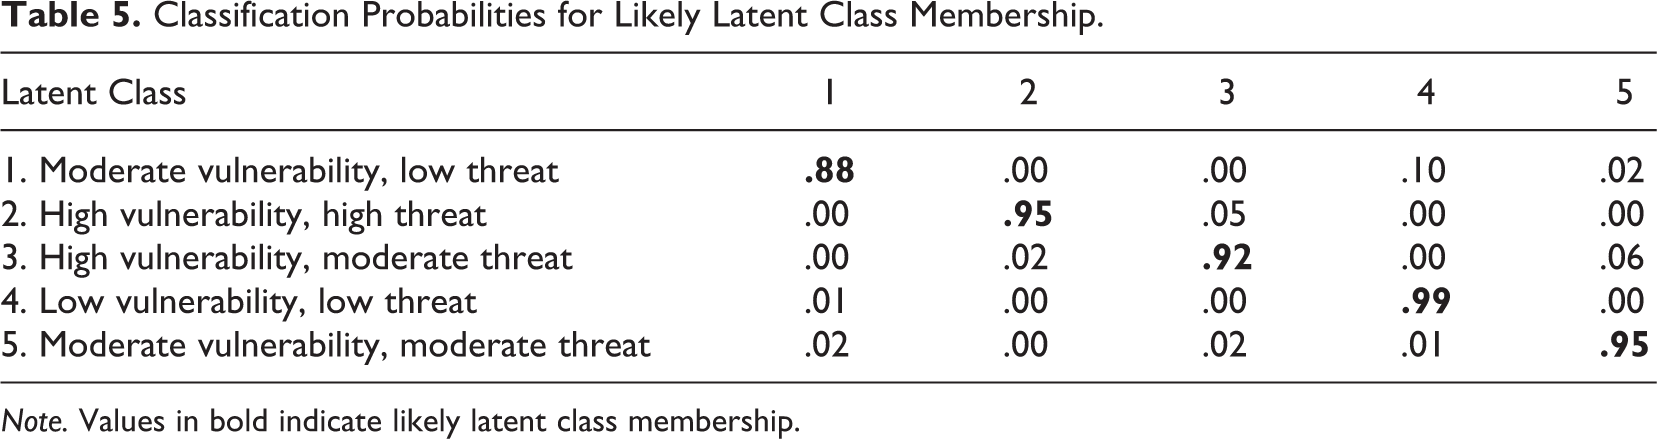
Note. Values in bold indicate likely latent class membership.
Means, SDs, and related inferential test statistics could not be computed for overall STSS-G scores, since they are measured on an ordinal scale. However, examination of the histograms for each latent class indicated that scores in classes 3 and 5 approximated normal distributions. Thus, for exploratory purposes, we treated scores in these classes as being normally distributed and conducted t-tests to examine potential class differences in the observed variables. Means and standard deviations are presented in Table 6. Results indicated significant between-class differences for identity threat, t(240) = 23.76, p < .001, science identity, t(234) = –2.30, p = .022, social identity, t(236) = 12.78, p < .001, and stereotype threat, t(237) = 6.04, p < .001.
Variable Means and Standard Deviations by Latent Class.

Note. Class 3 = high vulnerability, moderate threat; Class 5 = moderate vulnerability, moderate threat. MAV = mastery avoidance; PAV = performance avoidance.
Predicting Stereotype Threat and Science Identity
To evaluate the concurrent validity of STSS-G scores, a structural equation model was estimated on a subset (N = 315) of the original sample whereby latent variables representing existing measures of stereotype threat and science identity were regressed on the latent social identity and identity threat variables. Avoidance achievement goals and science self-efficacy were included as predictors in the model as well to control for at least two factors that may account for changes in stereotype threat and science identity. A WLSMV estimator was once again used along with the same fit indices that were used in the EFA, with the exception that a weighted root mean square residual (WRMR) was used rather than the SRMR because the SRMR cannot be used with categorical variables. WRMR values of 1.0 or less are considered acceptable, with lower values indicating better model fit (Yu, 2002). Results indicated that the model fit the data quite well, χ2(413, N = 315) = 715.32, p = .000, CFI = .967, RMSEA = .048 (90% CI: .042, .054), TLI = .963, WRMR = .941. Standardized factor loadings ranged from .81 to .95 for social identity, .93 to .98 for identity threat, .76 to .92 for science identity, .54 to .90 for MAV goals, .75 to .87 for PAV goals, .57 to .87 for science self-efficacy, and .72 to .89 for stereotype threat. A significant positive correlation was observed between the latent identity threat and the social identity variables (r = .68, p < .001). As Figure 1 indicates, both social identity (β = .65, p = .012) and identity threat (β = .65, p = .012) were significant positive predictors of science identity. Identity threat was found to be a significant positive predictor of stereotype threat (β = .75, p = .001), but the influence of social identity was not significant (β = –.07, p = .760).
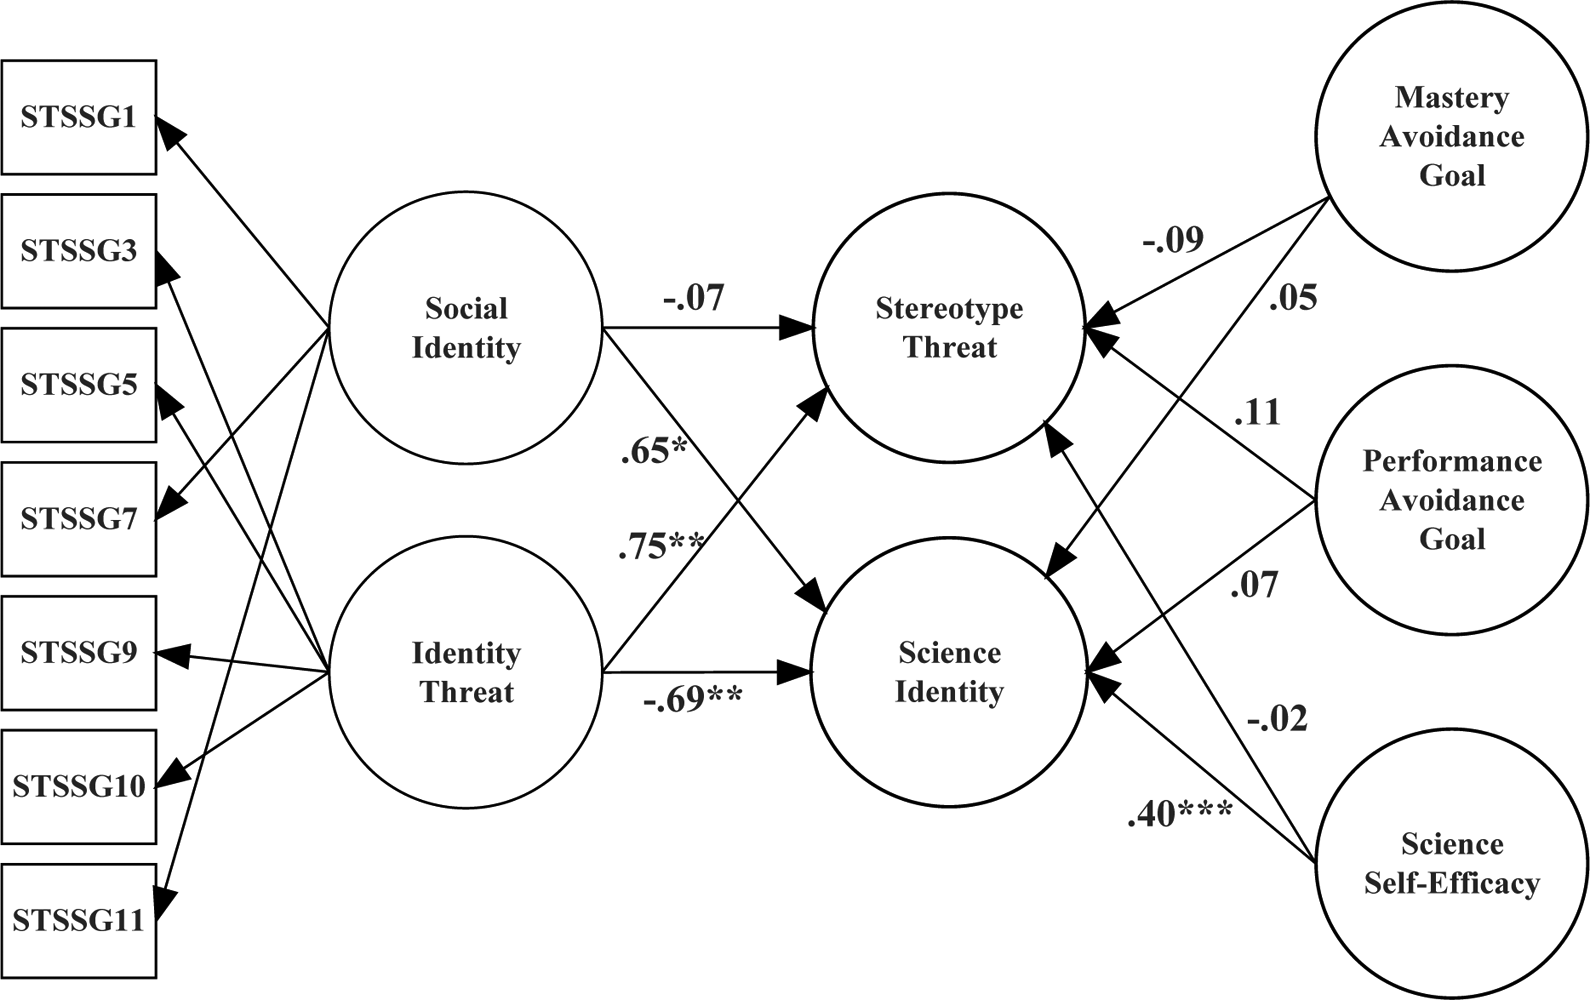
Structural equation model depicting the regression of stereotype threat and science identity on latent STSS-G and control variables. Path coefficients reflect standardized estimates. Item indicators for the control and outcome variables were removed for simplicity. *p < .05.**p < .01.***p < .001.
Discussion
Stereotype threat has been mainly measured by social psychologists in laboratory settings using experimental paradigms. However, emerging interest in stereotype threat among researchers of other disciplines (e.g., vocational psychology and industrial-organizational psychology) has led to an increased demand for self-report surveys that measure the construct in naturalistic settings. Some self-report surveys do exist but, from our perspective, none of them measure stereotype threat in a complete way. The purpose of this study was to address this shortfall of adequate measures by developing and validating a measure of stereotype threat for women in science. Overall, results provided strong support for the psychometric properties of the STSS-G.
We obtained support for the construct validity of the STSS-G as results of an EFA indicated support for the two hypothesized factors and showed that item scores are consistent with a rank-ordered pattern when tested on a homogeneous sample. Using an ordinal scale of measurement allowed us to avoid the potential problem of nonnormally distributed scores that can occur as a consequence of self-enhancement bias on interval-based scales that ask respondents to admit to some type of psychological vulnerability. Item scores followed a descending pattern of category endorsement, whereby the largest proportion of participants indicated they are not affected by stereotype threat and the smallest proportion indicating they often feel threatened by negative gender-science stereotypes.
The differential validity of the STSS-G was also supported, given that STSS-G was found to classify individuals into five latent subgroups that distinguished them in terms of their vulnerabilities and affective responses to threatening stereotypes. Most participants reported being unaffected by stereotype threat as the largest latent class (class 4) identified in the FMA primarily consisted of non-STEM majors reporting in the context of a biology course. The opposite pattern of scores emerged for class 2 as many of these participants reported being both highly identified with women in science and threatened by negative stereotypes. Most of these participants identified as engineering/engineering technology majors and reported their perceptions in the context of physics courses. Theoretical connections can be drawn to the present results as non-STEM majors in class 4 clearly value science more deeply than STEM majors, and the predominant contexts of biology classrooms do not necessarily lend themselves to threat activation, given that they are typically gender-balanced and often female-dominated.
Conversely, physics classrooms are typically male-dominated; therefore, the pressure for women to disconfirm any negative expectations their male counterparts may have of them and perform well academically is likely to provide the optimal conditions for stereotypes to exert deleterious effects. Indeed, much is likely to be at stake for these women because they are under the pressure of attending to the goals and aspirations that relate to their own personal identities while contending with the pressure of managing their social identities, that of being women in science. Taken together, these results are consistent with the theoretical expectations of stereotype threat insofar as threat is thought to be activated in situations in which stereotypic cues are prominent and among individuals for whom domain- and group-related identities intersect.
Participants’ scores covered the entire range of categories within class 5, and no definitive feature of the profile associated with this latent class was identified. Rather, women in this class comprised a varied mix of academic majors and classrooms represented were fairly equally split between biology and chemistry. The latent profile of participants in class 3 may be the most instructive of any of the classes in terms of understanding which factors may protect women in potentially threat-activating situations. Most of the women in this class reported being in physics class, and many of them also indicated that they majored in engineering, yet they reported only a moderate degree of threat. This finding highlights the importance of probing the heterogeneity of this particular population of women. Clearly, many women feel highly threatened by negative stereotypes while a smaller number of women do not, despite sharing similar academic environments and career goals. Further study of protective factors that make women more resistant to stereotypes would not only advance theory and research in this area, but could also lead to the development of interventions aimed at strengthening coping strategies and utilization of socially supportive resources.
The results of the latent regression analysis predicting science identity and stereotype threat supported the concurrent validity of the STSS-G. We argued that current stereotype threat scales fail to comprehensively measure the affective and social identity correlates of stereotypes. Identity threat was positively associated with stereotype threat and social identity was found to be a positive predictor of science identity. This pattern of results was observed after controlling for avoidance goals and science self-efficacy, which is important to note because an alternative argument could be made that threat perceptions can simply be attributed to low confidence and/or natural tendencies to avoid failure in achievement situations. Our findings therefore allow us to assert more conclusively that STSS-G scores reflect the likelihood that the academic climates that the current participants were situated in gave rise to the stereotypes they perceived.
Interestingly, identity threat was a negative predictor of science identity but social identity was unrelated to stereotype threat. We interpret these results as an illustration of the dual functions that identity appears to serve in regulating the effects of threatening stereotypes. On one hand, identifying highly with a domain renders individuals susceptible to stereotypes but, paradoxically, past research has also shown that possessing a strong identity confers considerable benefit by buffering individuals against stigma (Davis, Aronson, & Salinas, 2006; Gresky, Ten Eyck, Lord, & McIntyre, 2005).
The null relationship observed between social identity and stereotype threat is more difficult to interpret, but we believe that it accurately reflects the complex identity factor that we have conceptualized here. Not all identities are equal in strength or value to an individual; therefore, in a given situation, an identity may emerge as a buffer against threat, while weaker identities simultaneously expose vulnerabilities to one’s self-worth. They may partially or completely negate each other depending on the nature and magnitude of the stereotypic cues in the environment. In this study, it is possible that either the gender or the science identity component of social identity related positively to stereotype threat through a vulnerability mechanism, while its counterpart related negatively to this outcome through a buffering mechanism.
The present findings have important implications for career development research and practice. Regarding research implications, the finding that identity threat was a negative predictor of science identity is consistent with the TCC prediction that negative stereotypes should exert detrimental effects on vocational self-concept, ultimately restricting the types of careers that individuals choose. Career development researchers have tested variables that refer to particular aspects of Gottfredson’s TCC, such as career aspirations (Helweg, 2001) and parental level of education (Cochran, Wang, Stevenson, Johnson, & Crews, 2011), but there are few tools that can be used to measure the circumscription process as precipitated by occupational stereotypes. The current research addresses this measurement issue, at least with respect to circumscriptive career decision making in science. In terms of implications for career counseling practice, the STSS-G may prove to be useful in screening for susceptibility to stereotypes among women science majors or women considering a science major. Career counselors may examine scores to determine whether a client falls into one of the latent groups identified in the present research. Strategies for coping with stereotyping may be introduced by the counselor, particularly for women who fall into the high categories of vulnerability and threat. Developing social support systems by affiliating with other women in the classroom may be an effective approach to maintaining academic satisfaction in the face of stigma.
Some limitations of the present research should be noted. First, it is not possible to compute the type of descriptive statistics (e.g., mean and standard deviation) and other test statistics (e.g., analysis of variance) from overall STSS-G scores because they are based on an ordinal scale and therefore do not follow a normal distribution. However, STSS-G scores can be used to compute modes for descriptive purposes and construct categorical latent variables that permit calculation of the variances and covariances needed to employ other modeling techniques. Item scores may be treated as being normally distributed among certain latent groups, but only if heterogeneous groups are first identified using latent class analytic techniques. Otherwise, we recommend that researchers utilize ordinal STSS-G scores when conducting tests under the assumption of population homogeneity. Second, despite the fact that this study focused on gender stereotypes in science, only a fraction of women in the sample reported majoring in chemistry and physics. Biology and engineering majors were well represented but gender role attitudes are typically more egalitarian in biology than in other sciences (Sonnert & Holton, 1996), and engineering is not science per se insofar as engineers do not necessarily formulate and test a priori hypotheses, conduct experiments, and so forth. We would like to note, however, that the STSS-G may be easily adapted for measuring stereotypes in engineering classes, among members of other underrepresented groups (e.g., African Americans), and across sets of classes in order to measure stereotype threat at broader levels within a task domain. Research on the psychometric properties of the STSS-G on varying samples and across situations would shed additional light on the nature and scope of gender stereotypes.
The development of the STSS-G was undertaken because we viewed current self-report measures of stereotype threat as not providing thorough enough coverage of the construct. The first factor which emerged from our analysis, social identity, is believed to tap the complex intersectionality of gender and science identity in a way that other scales do not. Meanwhile, the second factor underlying STSS-G scores, identity threat, is unique in that it purports to measure the affective consequences of being exposed to negative stereotypes. Both factors related to relevant outcomes in theoretically expected ways while controlling for avoidance and self-efficacy factors that could potentially provide alternative explanations for why women are negatively affected by gender stereotypes. It is hoped that the current findings contribute to more precise measurement of gender stereotypes that in turn facilitate development and/or refinement of interventions and educational policies designed to mitigate their pernicious effects.
Footnotes
Authors’ Note
The data presented and views expressed in this article are solely the responsibility of the authors.
Acknowledgments
We extend our gratitude to Jessi Smith and Dustin Thoman for their assistance with this project.
Declaration of Conflicting Interests
The author(s) declared no potential conflicts of interest with respect to the research, authorship, and/or publication of this article.
Funding
The author(s) disclosed receipt of the following financial support for the research, authorship, and/or publication of this article: This research was supported by National Science Foundation grant HRD-1331962.