
Abstract
This study constructed a situation-based career interest assessment (SCIA) that is suitable for applying to junior high school students. The assessment framework is based on Holland’s theory of vocational interest. The subjects for the pilot study and the formal test were 1,072 junior high school students and 1,136 junior high school students, respectively. The results of reliability tests produced correlation coefficients between .77 and .95, exploratory factor analysis produced factor loadings between .32 and .92 for six factors, and confirmatory factor analysis produced relative fit indices of .95 across the comparative fit index and nonnormed fit index, indicating a satisfactory goodness of fit. Convergent and discriminant validity analyses indicated that the SCIA has acceptable construct validity. Multidimensional scaling analysis, internal correlation, and randomization test showed that the interest structure of adolescents and the relationship among interest types are only partially consistent with Holland’s theory.
Keywords
One of the most common difficulties experienced during adolescence is deciding on a future career path (Friedman, 1991; Taveira, Silva, Rodriguez, & Maia, 1998), with this decision often leading to anxiety and confusion. Adolescents encounter the largest number of difficulties during the initial stages of career decision making (Gati, Saka, & Krausz, 2001), particularly because educational streaming—an important education policy influencing teenagers in countries worldwide—forces them to make a career choice early in their lives.
Germany can be considered to be a representative example of early streaming. German students are streamed after completing elementary education, such that they go to one of three types of schools, each of which provides different curriculums and has different instructional objectives (Baumert, Cortina, & Leschinsky, 2003). In contrast, the United States can be considered an example of implementing streaming in later stages. Many students in the United States do not need to select a major or specialty in the first year of higher education. Instead, it is often not until the second or third year of university that students are compelled to decide upon a major. Taiwan is a representative example of implementing streaming in the intermediate stages of education (Sung, Tien, & Cheng, 2012). Students in Taiwan must complete 9 years of compulsory education, and they may apply to regular, comprehensive, or vocational high schools according to the results of their entrance examination. Students in countries that adopt streaming in the early or intermediate grades have to decide on which career they wish to pursue while they are still in their exploration stage (Super, Savickas, & Super, 1996). Such streaming forces children to prematurely decide on a career, which may cause uncertainty and anxiety. Designing career assessment tools to assist these teenagers in choosing a suitable career could help to reduce the stress imposed by such a choice and help to ensure students are prepared for future jobs that they will find interesting and rewarding.
The interests of an individual refer to the activities that the person likes or prefers and represent useful information when determining a suitable vocation (Brown, 2007). Educational institutions often apply various psychometric assessments in career guidance to assist students in recognizing their individual capabilities and interests, thereby providing some guidance toward their future educational and professional development. Interest assessment is valuable in helping individuals to identify their interests and enabling better career decisions. The career paths chosen by individuals are typically based on their interests (Osborn & Zunker, 2006). Many studies have indicated that a particular vocational interest is correlated with students’ academic performance, level of perseverance, job satisfaction, and career identity (Hirschi & Läge, 2007; Nye, Su, Rounds, & Drasgow, 2012; Spokane, 1985; Swanson & Hansen, 1986). A work environment that fits the personal interests of an individual is likely to maximize his or her personal and professional development (Holland, 1997). A reliable interest assessment is able to promote self-understanding, and the results of the assessment should help with the career planning process.
Characteristics of Existing Interest Assessments
Various methods of interest assessment are available, among which the most popular are the Campbell Interest and Skill Survey (CISS; Campbell, Hyne, & Nilsen, 1992), Strong Interest Inventory Assessment Tool (SII; Strong, 1935), Self-Directed Search (SDS; Holland, Powell, & Fritzsche, 1997), and the Jackson Vocational Interest Survey (Jackson, 1999). Most methods of assessment are based on Holland’s theory of vocational interest. However, some assessments are based on models that differ with the interest type. Most interest assessments are delivered via either paper and pencil or computer, with individual items generally being presented as text descriptions that accompanied Likert-type scales.
Interest assessment has been applied to numerous different areas, including management, career decision making, and academia. However, such assessments are subject to certain limitations. First, interest assessments are largely targeted toward either adults or students at senior high schools and universities (e.g., CISS, SDS, O*NET Work Importance Locator), while few have been designed for children and students at junior high schools (e.g., Wide Range Interest and Occupation Test, SDS Career Explorer). For students in countries that implement streaming at the early or intermediate stages, there is a shortage of suitable instruments for helping with the career decision-making process. Second, the content of existing assessments is mostly presented in text format and the amount of information provided has a narrow scope, with many assessment items simply listing the titles of a selection of jobs and courses. The CISS, for example, merely details “a stockbroker, advising clients on their investment,” while an item on the SDS appears as “to take a woodworking course.” Items described using only text are unlikely to provide students with a sufficient understanding of what the occupations or courses involve and therefore are unable to provide students with accurate information about their vocational or academic preference. For teenagers, especially those who are experiencing examination stress, the vocational world may be mysterious and they may hold various misconceptions about the content of those jobs. Tracey (2001) pointed out that younger students have fewer life experiences. Kuder (1977) indicated that individuals need career-planning guidance because they have misconceptions or a lack of knowledge and information about career paths. Simple definitions of job titles in items do not constitute adequate information for allowing test-takers to understand their areas of interest.
Situational tests provide the test-taker with a more authentic experience before making an answer and are not only used in cognitive abilities tests but also used in tests of personality tendencies (Whetzel, McDaniel, & Nguyen, 2008). Such tests emphasize portraying real-life situations through text, audiovisual descriptions, or even the use of three-dimensional simulations and videotapes. Many studies have indicated that situational tests have focused increasingly on personnel and career tests (Chan & Schmitt, 2002; Lievens & Coetsier, 2002; McDaniel, Morgeson, Finnegan, Campion, & Braverman, 2001). Similar to situational tests, career assessments should portray situations using images or photographs (e.g., providing details related to each job, such as the primary tasks and work environment) in order to assist students in establishing connections with real-life situations. This change would allow test-takers to better understand assessment items and to apply that information when they are evaluating their own personal interests, thereby improving the suitability of the assessment to teenager populations. In addition, situational career assessments that incorporate multimedia technology and construct items through the use of graphics and photographs can not only provide richer and more realistic information but also enhance student willingness to take the assessment in the first place.
Based on the aforementioned issues, the first objective of this study was to redress the lack of interest assessment tools for providing career guidance to junior high school students by developing a situation-based career interest assessment (SCIA) for these students and testing its reliability and validity.
Holland’s Vocational Interest Theory
Holland’s theory of interest types (Holland, 1973) has had a profound and widespread influence on the study of vocational interest (Campbell et al., 1992; Darcy & Tracey, 2007; Elosua, 2007; Holland et al., 1997). This study applied Holland’s theory to develop the SCIA. Holland’s theory postulated six types of interest, namely, realistic (R), investigative (I), artistic (A), social (S), enterprising (E), and conventional (C); these are all commonly used as a developmental framework for career interest assessments and as the foundation for evaluating an individual’s vocational interest or preferences.
The Structure of Holland’s Vocational Interest Theory
Rounds (1995) pointed out that the structure for Holland’s theory of vocational interest can be verified through the following three hypotheses: the simple circular hypothesis, the calculus hypothesis (also called the calculus assumption), and the hexagonal hypothesis. The simple circular hypothesis refers to R-I-A-S-E-C being arranged in succession to depict the circular relationship between the six interest types. The calculus assumption, in addition to using a circular order, also uses correlation coefficients to represent the congruence between different psychological traits, where a shorter distance between interest types indicates a stronger interrelationship. The hypothesis proposed by Holland’s theory requires that the correlation between adjacent interest types must be the strongest (i.e., R-I, I-A, A-S, S-E, E-C, and C-R), followed by the correlation between alternate interest types (i.e., R-A, R-E, I-S, I-C, A-E, and S-C), while the correlation between opposite interest types must be the weakest (i.e., R-S, I-E, and A-C; Holland, 1973, 1997). The hexagonal hypothesis, which states that each interest type can be placed at one of the six points equidistant around a hexagon, is not strongly supported by empirical data (Rounds, 1995).
Several previous studies have used the simple circular hypothesis and calculus assumption as indicators for verifying Holland’s theory. Many studies have used multidimensional scaling (MDS) to analyze positional relationships when determining whether the six interest types are consistent with the circular order structure. The results indicate that the circular order of the six interest types differs between different target populations and genders (Einarsdóttir, Rounds, & Su, 2010; Elosua, 2007; Jin, 1992; Tien, 1996). In addition, several studies have used randomization testing to explore the implications of Holland’s theory by deriving a correspondence index (CI; Elosua, 2007; Tracey, 1997; Tracey & Rounds, 1993). A correlation matrix of the test scores was used to determine the degree to which the findings are consistent with the hypothesis, followed by randomization tests conducted using a random relabeling procedure. These steps were undertaken to examine whether the data model aligned with the calculus assumption of the circular order.
Elosua (2007) found that the CI of Holland’s theory tends to be lower (between .42 and .46) for certain cultural groups (e.g., Spanish and African American), suggesting that the suitability of this theory for specific populations depends on each country’s culture. Tien (1996) found that the CIs for male and female Taiwanese senior high school students were .22 and .17, respectively. Although most previous studies support the construct of Holland’s theory, there are still debates about its applicability. Some scholars consider that the suitability of Holland’s theory is limited by different countries or cultures lending themselves to different interest types and constructs, based on research findings from Iceland, New Zealand, China, and Taiwan (Deng, Armstrong, & Rounds, 2007; Einarsdóttir et al., 2010; Tien, 1996). The suitability of Holland’s interest constructs therefore merits further attention.
Despite Tracey’s (2001) findings, the issue whether Holland’s interest structure is appropriate for junior high school or younger students is an issue worthy of being addressed for two reasons. Firstly, Darcy and Tracey (2007) found that Holland’s interest structure was stable when applied to 8th- to 12th-grade students, Tracey and Ward (1998) found that Holland’s interest structure fits fine with middle school students. That is, whether Holland’s theory might be applicable for early adolescents remained inconclusive. Secondly, as we mentioned in the previous section, the plain verbal format of item/stimuli presentation may have negative effects on young students’ responses because they may not understand the vocational titles and activities, and this may consequently affect the construct validity of Holland’s theory. Therefore, whether young students still show a poor fit with Holland’s model under a more understandable and accessible item/stimuli presentation format, such as the situational images of SCIA, needs to be investigated. Thus, the second objective of this study was to determine the suitability of Holland’s vocational-interest constructs for junior high school students in Taiwan by using the SCIA.
Method
Participants
In the pilot-test stage, the participants for this study included both eighth and ninth grader, between the age of 14 and 15, from public and private junior high schools throughout Taiwan. There was a total of 1,072 valid subjects, comprising 457 males (42.63%) and 615 females (57.37%). In the formal-test stage, 1,136 students were recruited, of which 589 were males (51.85%) and 547 were females (48.15%).
Development of the SCIA
Development of the SCIA involved three distinct phases: content analysis of existing interest assessments, assessment item design, and testlet construction.
Content Analysis of Existing Interest Assessments
This phase analyzed the existing interest assessment and relevant literature, examining aspects such as the theoretical foundation of vocational interest, the layout and content of items, response format, and scoring method. There were some similarities of existing interest assessments. Most of these assessments were based on Holland’s theory (i.e., SDS, SII), the test contents could be broadly divided as follows: activities (i.e., repairing a clock), courses (i.e., algebra), and occupations (i.e., bank teller), and each category had different numbers of items, and the response formats applied the Likert-type scale to measure the trait. In conclusion, the SCIA was constructed based on Holland’s theory and the content of the items focused on activities, courses, and occupations.
Assessment Item Design
This study invited 35 instructors from both regular and vocational high schools to participate in focus groups. The goal of the groups was to collect information related to various contents that were then used as a guideline for designing assessment items. The item descriptions were required to fit the definition of the interest type content. The test items were thoroughly examined and revised by vocational professionals and career counselors so as to prevent the inclusion of any content or descriptions that were unfamiliar, not easily understood, or otherwise ambiguous to junior high school students and were correspondent with the description of Holland’s six types.
Next, all SCIA items were modified to six interest types by adding images, photograph, or more detailed descriptions. The activities section incorporates professionally rendered images showing accurate and realistic depictions of the activities. Situational information is provided in the form of concise text descriptions and images of typical activities. In addition, the images feature both men and women in such a way that will avoid the perpetuation of gender-based stereotypes. The section for courses provides a clear and concise description of the course content in order to help the student determine his or her personal interests, rather than simply listing the course title. To clarify, instead of simply providing the title of a class, such as “The engine theory and practice course,” our item offered the brief description “Maintenance and repair of locomotive engine parts.”
The occupation section incorporates real-life photographs and job titles and includes short descriptions of work settings and relevant work duties. As an example, the enterprising (E) type detailed that a lawyer’s primary tasks are to provide legal advice and consultation, manage dispute cases, and provide litigation and defense services in court (see Figure 1). The first version of the assessment of the SCIA featured 48 activities, 54 courses, and 36 occupations, giving a total of 138 assessment items.

A snapshot of an SCIA item for occupations. A lawyer is taken as an example; the text was originally in Chinese and has been translated for this figure. Note. SCIA = situation-based career interest assessment.
Testlet Construction
Each testlet included six items, representing the R, I, A, S, E, and C types. The item for each interest type was randomly assigned a label of A, B, C, D, E, or F, as shown in Figure 2. The assessment included 23 testlets, of which 8 testlets were for activities, 9 were for courses, and 6 were for occupations. Of these three sections, the items pertaining to activities and occupations provide more extensive information; test-takers were therefore asked to click on and read each item to obtain more information (Figure 2). Figure 1 is an example of what an item looked like after a user clicked on it.
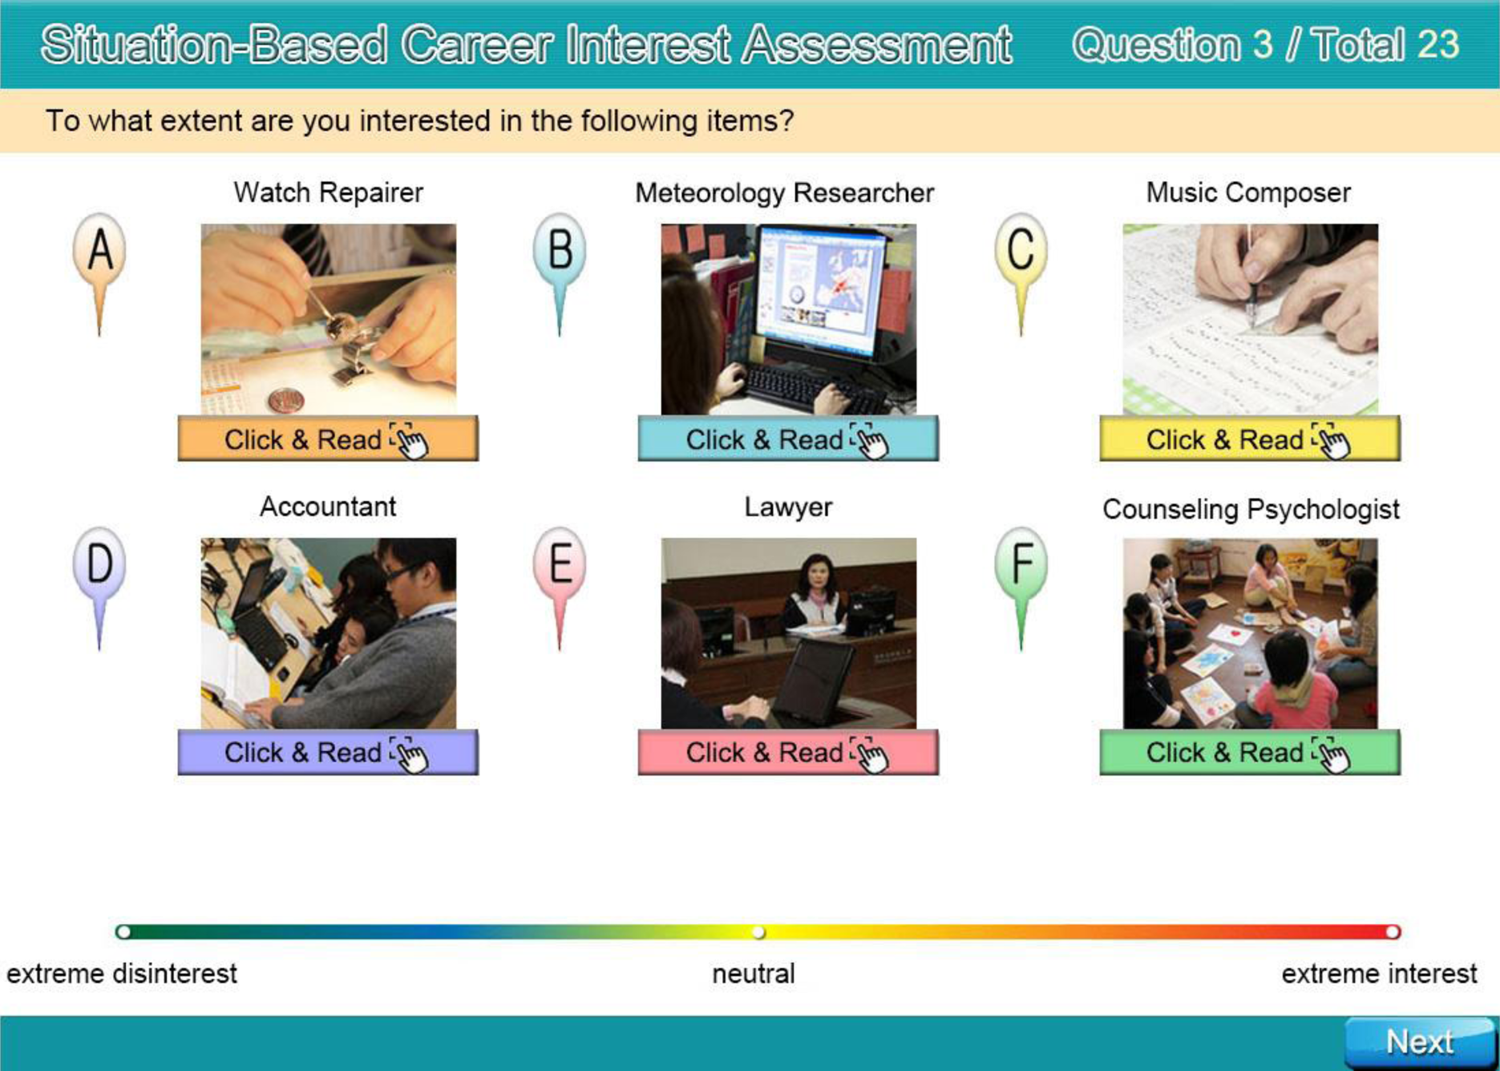
A snapshot on the SCIA testlet, where A, B, C, D, E, and F represent interest types R (realistic), I (investigative), A (artistic), C (conventional), E (enterprising), and S (social), respectively; the text was originally in Chinese and has been translated for this figure. Note. SCIA = situation-based career interest assessment.
Response Format
The implemented SCIA’s response format combines the characteristics of graphic rating scales and ranking scales (Aguinis, Pierce, & Culpepper, 2009; Cook, Heat, Thompson, & Thompson 2001; Greenleaf, 1992a, 1992b; Krieg, 1999; Paterson, 1922; Randall & Fernandes, 1991) in order to overcome the limitation of traditional Likert-type scale (Baron, 1996; Cornwell & Dunlap, 1994; Hicks, 1970), which we named it as the rating, ranking, and paired comparison type scale. Specifically, the response format applied a continuum line to measure the latent trait, and it also asked respondents to show the rank of item on the line simultaneously. The advantage of this scale is that continuous scale will possess a greater degree of sensitivity and reliability (Grant et al., 1999), and the ranking effect will reduce response bias (Baron, 1996; Cunningham, Cunningham, & Green, 1977; Maydeu-Olivares & Brown, 2010). In addition, the continuum line was marked from left to right with “extreme disinterest,” “neutral,” and “extreme interest” to make it easy for students to gauge their responses.
The participants need to position and rank the items in the same page by dragging the indicator of the item onto the scale, as illustrated in Figure 3. However, two items were not allowed to concurrently occupy the same position to achieve the ranking effect.
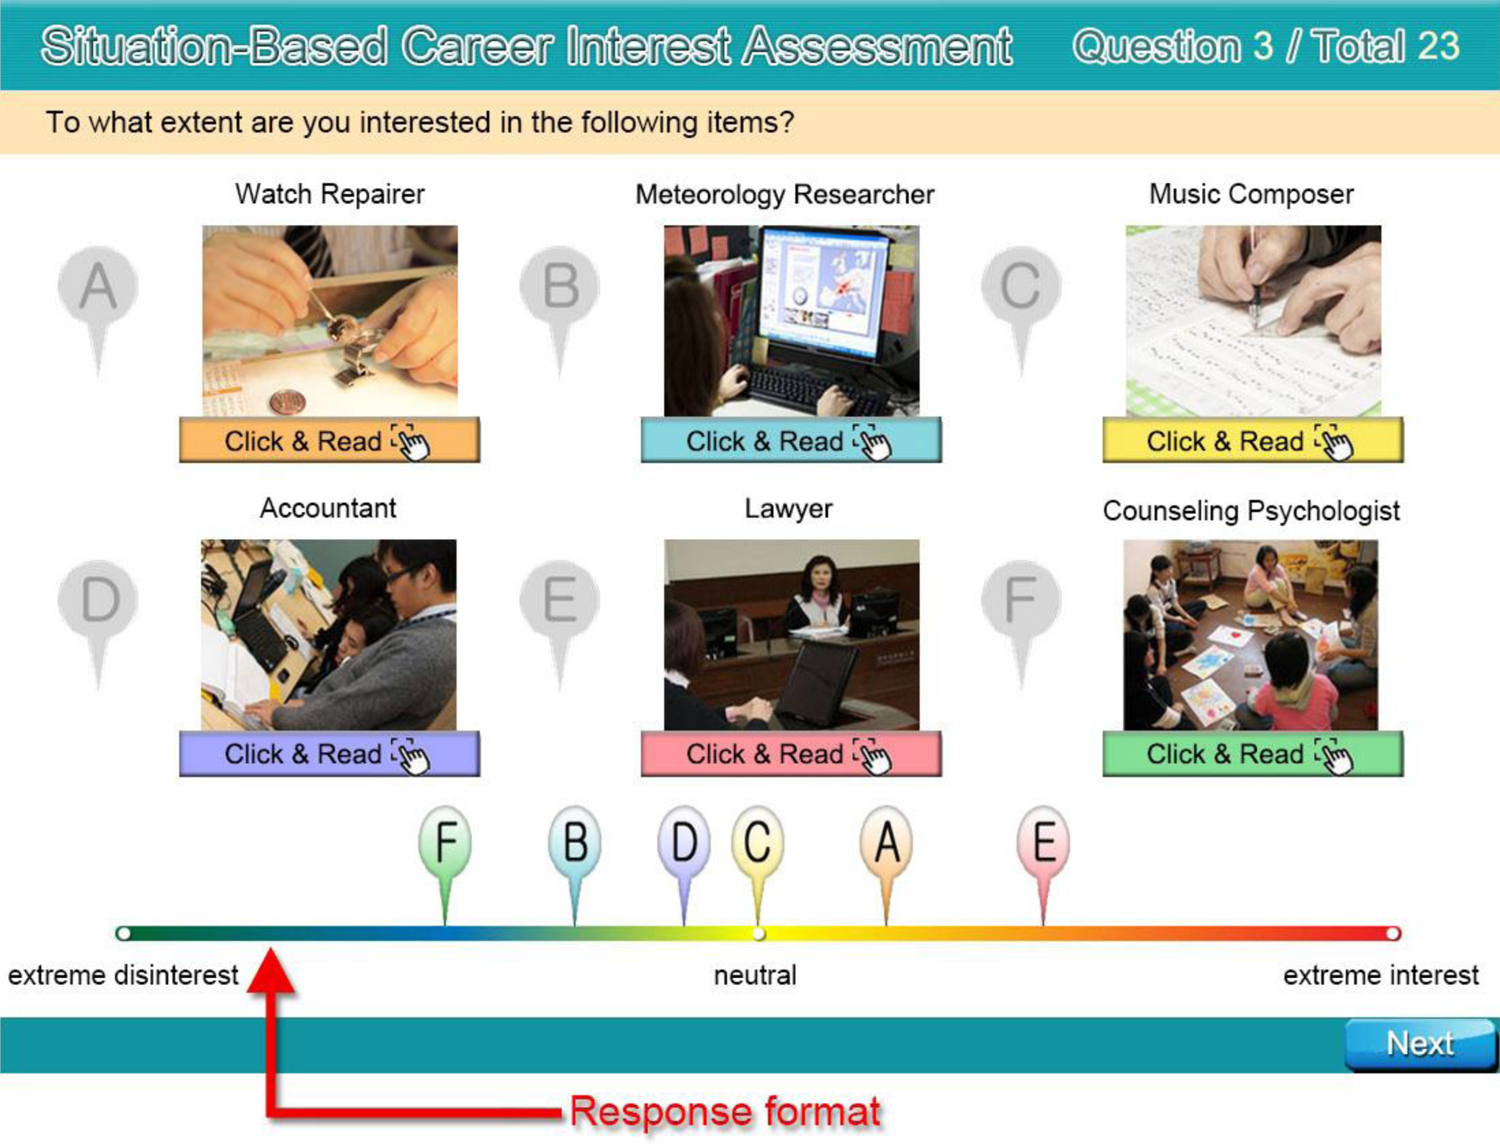
Indicating response format in the SCIA. Note. SCIA = situation-based career interest assessment.
Scoring Method
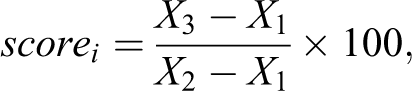
The webpage interface allowed test-takers to freely move and drag the coordinate position of each item along the scale axis. For example, the leftmost coordinate of the scale may be defined as X1, the rightmost coordinate may be defined X2, and the item coordinate that has been positioned by the test-taker may be defined as X3. Using coordinate positioning along this axis, the values of X1, X2, and X3 are inserted into the following formula:
Data Analysis
The reliability of the SCIA was evaluated by analyzing the split-half reliability, internal consistency reliability, and test–retest reliability. The validity was assessed through exploratory factor analysis (EFA), confirmatory factor analysis (CFA), and construct validity analysis. Finally, the hypothesis proposed by Holland’s theory was validated by using MDS, the correlation between interest types, and randomization testing.
Procedure
The pilot-test data were collected between April 2013 and June 2013, while the formal-test data were collected between March 2014 and April 2014. The assessment was fully computerized, requiring approximately 30 min to complete, and the entire process was conducted and monitored by professionally trained invigilators.
Results
Pilot-Test Data Analyses
Individual assessment items, as well as the associated reliability and validity, were evaluated on the basis of data collected from the pilot-test sample of 1,072 students (457 males and 615 females). The details of each analysis method are provided in the following sections.
Item Analysis
The mean and standard deviation (SD) values for the six interest types in this study are listed in Table 1. The mean scores for the interest types were between 43.78 and 55.86, with SD between 15.80 and 18.81. The discrimination index of each item was analyzed using the corrected item-total correlation, which indicates whether points obtained for a single item are correlated with the total score. The correlation coefficients for the items in the R, I, A, S, E, and C types were within the ranges .25–.73, .32–.76, .48–.72, .47–.70, .26–.73, and .41–.73, respectively. Items are generally considered to be of high quality if the correlation coefficient exceeds .40 (Ebel & Frisbie, 1991); this condition was generally fulfilled by the SCIA, since only 3 items did not achieve the required standard. In additional, if an item has a factor loading below .30 or has a cross-loading, it becomes a candidate for deletion (Hair, Black, Babin, & Anderson, 2010) .30 of 138 items had cross-loadings. After combining the results of item analyses and factor analyses, items with a discrimination index lower than .40, a factor loading lower than .30, or cross-loadings of item on factor were removed. Overall, 30 items were removed, leaving a total of 108 items in the SCIA. The final version of the assessment of the SCIA included 18 testlets, of which 7 testlets were for activities, 7 were for courses, and 4 were for occupations.
Descriptive Statistics and Reliability.
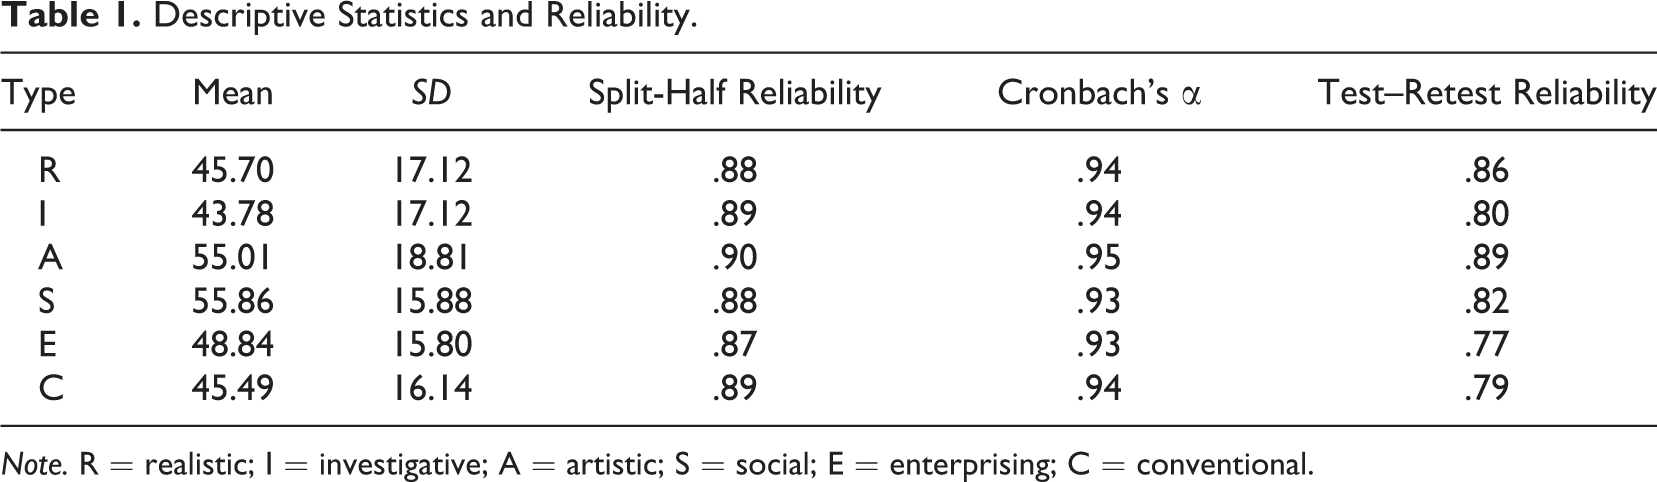
Note. R = realistic; I = investigative; A = artistic; S = social; E = enterprising; C = conventional.
Reliability Analyses
The overall assessment reliability was evaluated based on the split-half, internal consistency, and test–retest reliabilities, as indicated in Table 1. When the split-half reliability was applied as a measure of consistency, the correlation coefficients for the R, I, A, S, E, and C types were all found to exceed .87. Cronbach’s α values for all interest types were found to be greater than .93, demonstrating that all of the items possessed good internal consistency. The retest subjects comprised 181 students (60 males and 121 females) selected from the pilot-test sample. The retest was administered 4 months after the initial assessment, and revealed that the test–retest reliabilities for the R, I, A, S, E, and C types were .86, .80, .89, .82, .77, and .79, respectively. This verified that all of the interest types fulfilled the requirements for assessment quality established by Nunnally (1978).
Validity Analysis
EFA was subsequently conducted with the principal component factor and the oblique rotation method. The EFA results indicated that six factors could be extracted from this study with eigenvalues of 24.19, 10.84, 8.07, 3.65, 3.43, and 2.31. The remaining 108 items could explain 48.60% of the variance for factors in the six interest types. The factor loadings were .32–.92, .31–.81, .51–.85, .32–.72, .37–.68, and .36–.78 for the R, I, A, S, E, and C types, respectively. This verified that all of the interest types fulfilled the requirements for assessment quality established by Hair, Black, Babin, and Anderson (2010). Overall, the factor structure was consistent with Holland’s theory of vocational interest.
Formal-Test Data Analyses
According to pilot-test data analyses, the final version of the SCIA included 18 testlets. The data collected from the subsequent formal test involving a sample of 1,136 students (589 males and 547 females) were also examined through model-fit and validity analysis, the specific results of which are presented below.
The correlated trait–correlated uniqueness (CTCU) model
From the design of the SCIA’s testlet and response format, the interest-type scores are affected by latent traits, measurement errors, and the 6 items in the same testlet. In order to include all of these variables in our analysis, we applied a special CFA model, the CTCU model (Marsh, 1989), for our data analysis. The CTCU model is one of the general CFA models for analyzing multitrait–multimethod (MTMM) data. In the CTCU model, method effects are represented in error terms, the effect of each method by correlating the residual terms associated with each set of observed variables within a method. The advantages of applying the CTCU model to analyze MTMM data included that this model frequently resulted in proper solutions and it has very few convergence problems (Byrne, 2012; Marsh, 1989). We used the statistical software Lisrel 8.70 (Jöreskog & Sörbom, 2004) to evaluate the model fit and parameters estimation in the CTCU model.
Model fit
We used several fit indices to evaluate whether the empirical data were consistent with the theoretical model. Table 2 shows the following goodness-of-fit statistics: the absolute fit indices standardized root mean square residual, root mean square error of approximation, the relative fit indices comparative fit index, normed fit index, nonnormed fit index, and parsimonious fit index critical number. These indices demonstrated good assessment performance across the relative fit indices by Hu and Bentler (1999).
Results of the Confirmatory Factor Analysis—CTCU Model.
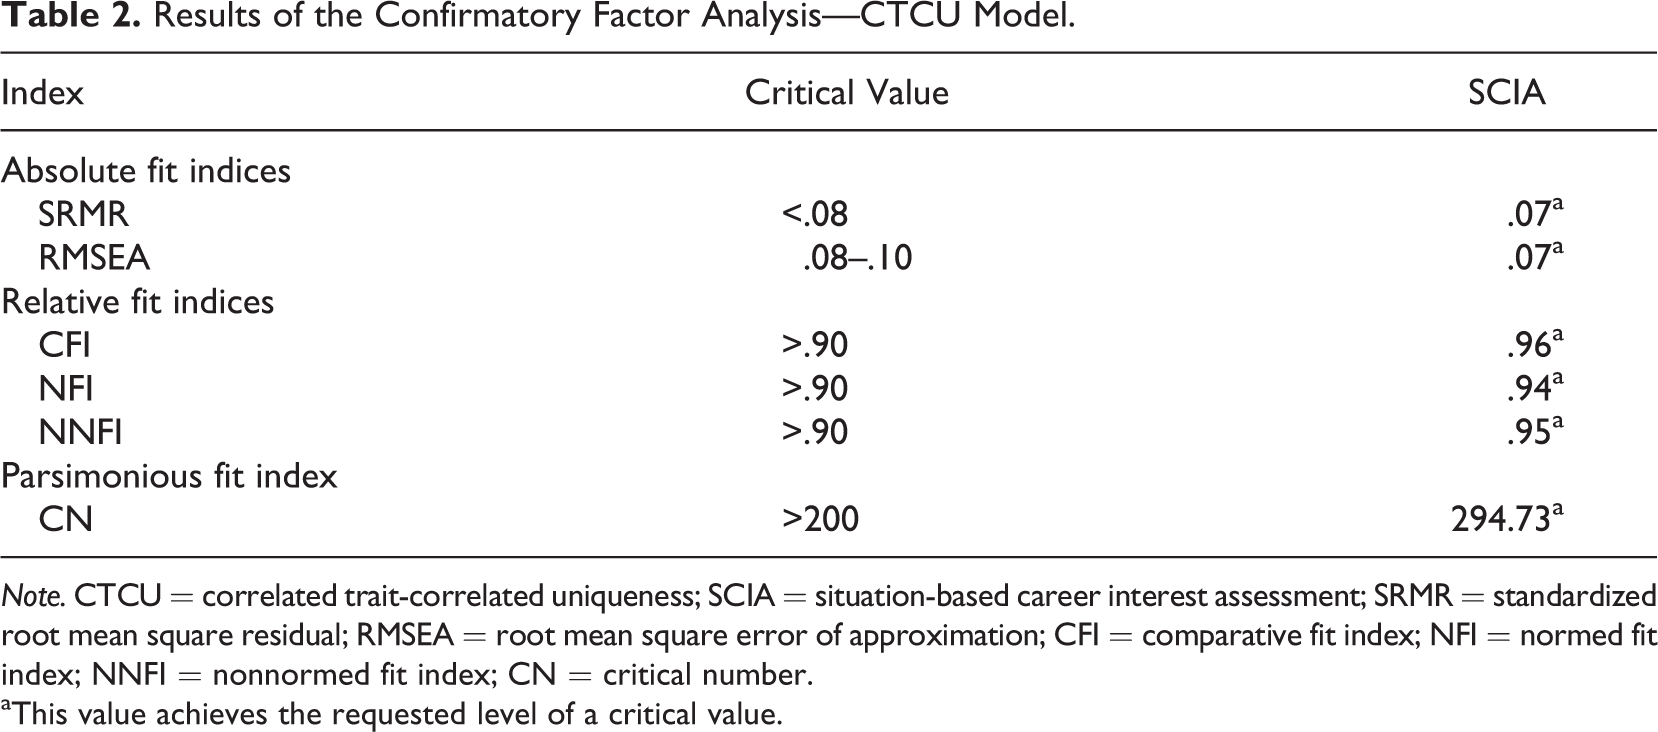
Note. CTCU = correlated trait-correlated uniqueness; SCIA = situation-based career interest assessment; SRMR = standardized root mean square residual; RMSEA = root mean square error of approximation; CFI = comparative fit index; NFI = normed fit index; NNFI = nonnormed fit index; CN = critical number.
aThis value achieves the requested level of a critical value.
Assessment of construct validity of the measurement model
Construct validity typically focuses on the extent to which data exhibit evidence of convergent validity, where different assessment methods are used to examine a single trait and discriminant validity, where the same method is used to examine different traits (Campbell & Fiske, 1959). The classical convergence and discriminant validity measures rely on the correlation of observed measures, however, they are not a good proxy for the correlation of the latent constructs as pointed by Bollen (1989). Thus, the CFA approach is proposed and suggested to verify the convergent and discriminant validity (Bollen, 1989; Byrne, 2012; Widaman, 1985). Following the Byrne (2012) procedure, we use factor-loading estimates, trait correlations, and residual correlations to assess the convergent and discriminant validity in the CTCU model.
Convergent validity
Since factor loading represents the association of observed variable and a particular trait factor, the larger factor loadings indicate the stronger evidence of convergent validity (Widaman, 1985). Table 3 shows the factor loading of the CTCU model resulted in the standardized estimates, we have .47–.83 for R type, .51–.78 for I type, .52–.79 for A type, .49–.66 for S type, .48–.75 for E type, and .53–.73 for C type. All factor-loading estimates were statistically significant, and all but four standardized loading estimates exceeded the value of .50 (Byrne, 2012; Hair et al., 2010).
Factor-Loading Estimates for the CTCU Model.a
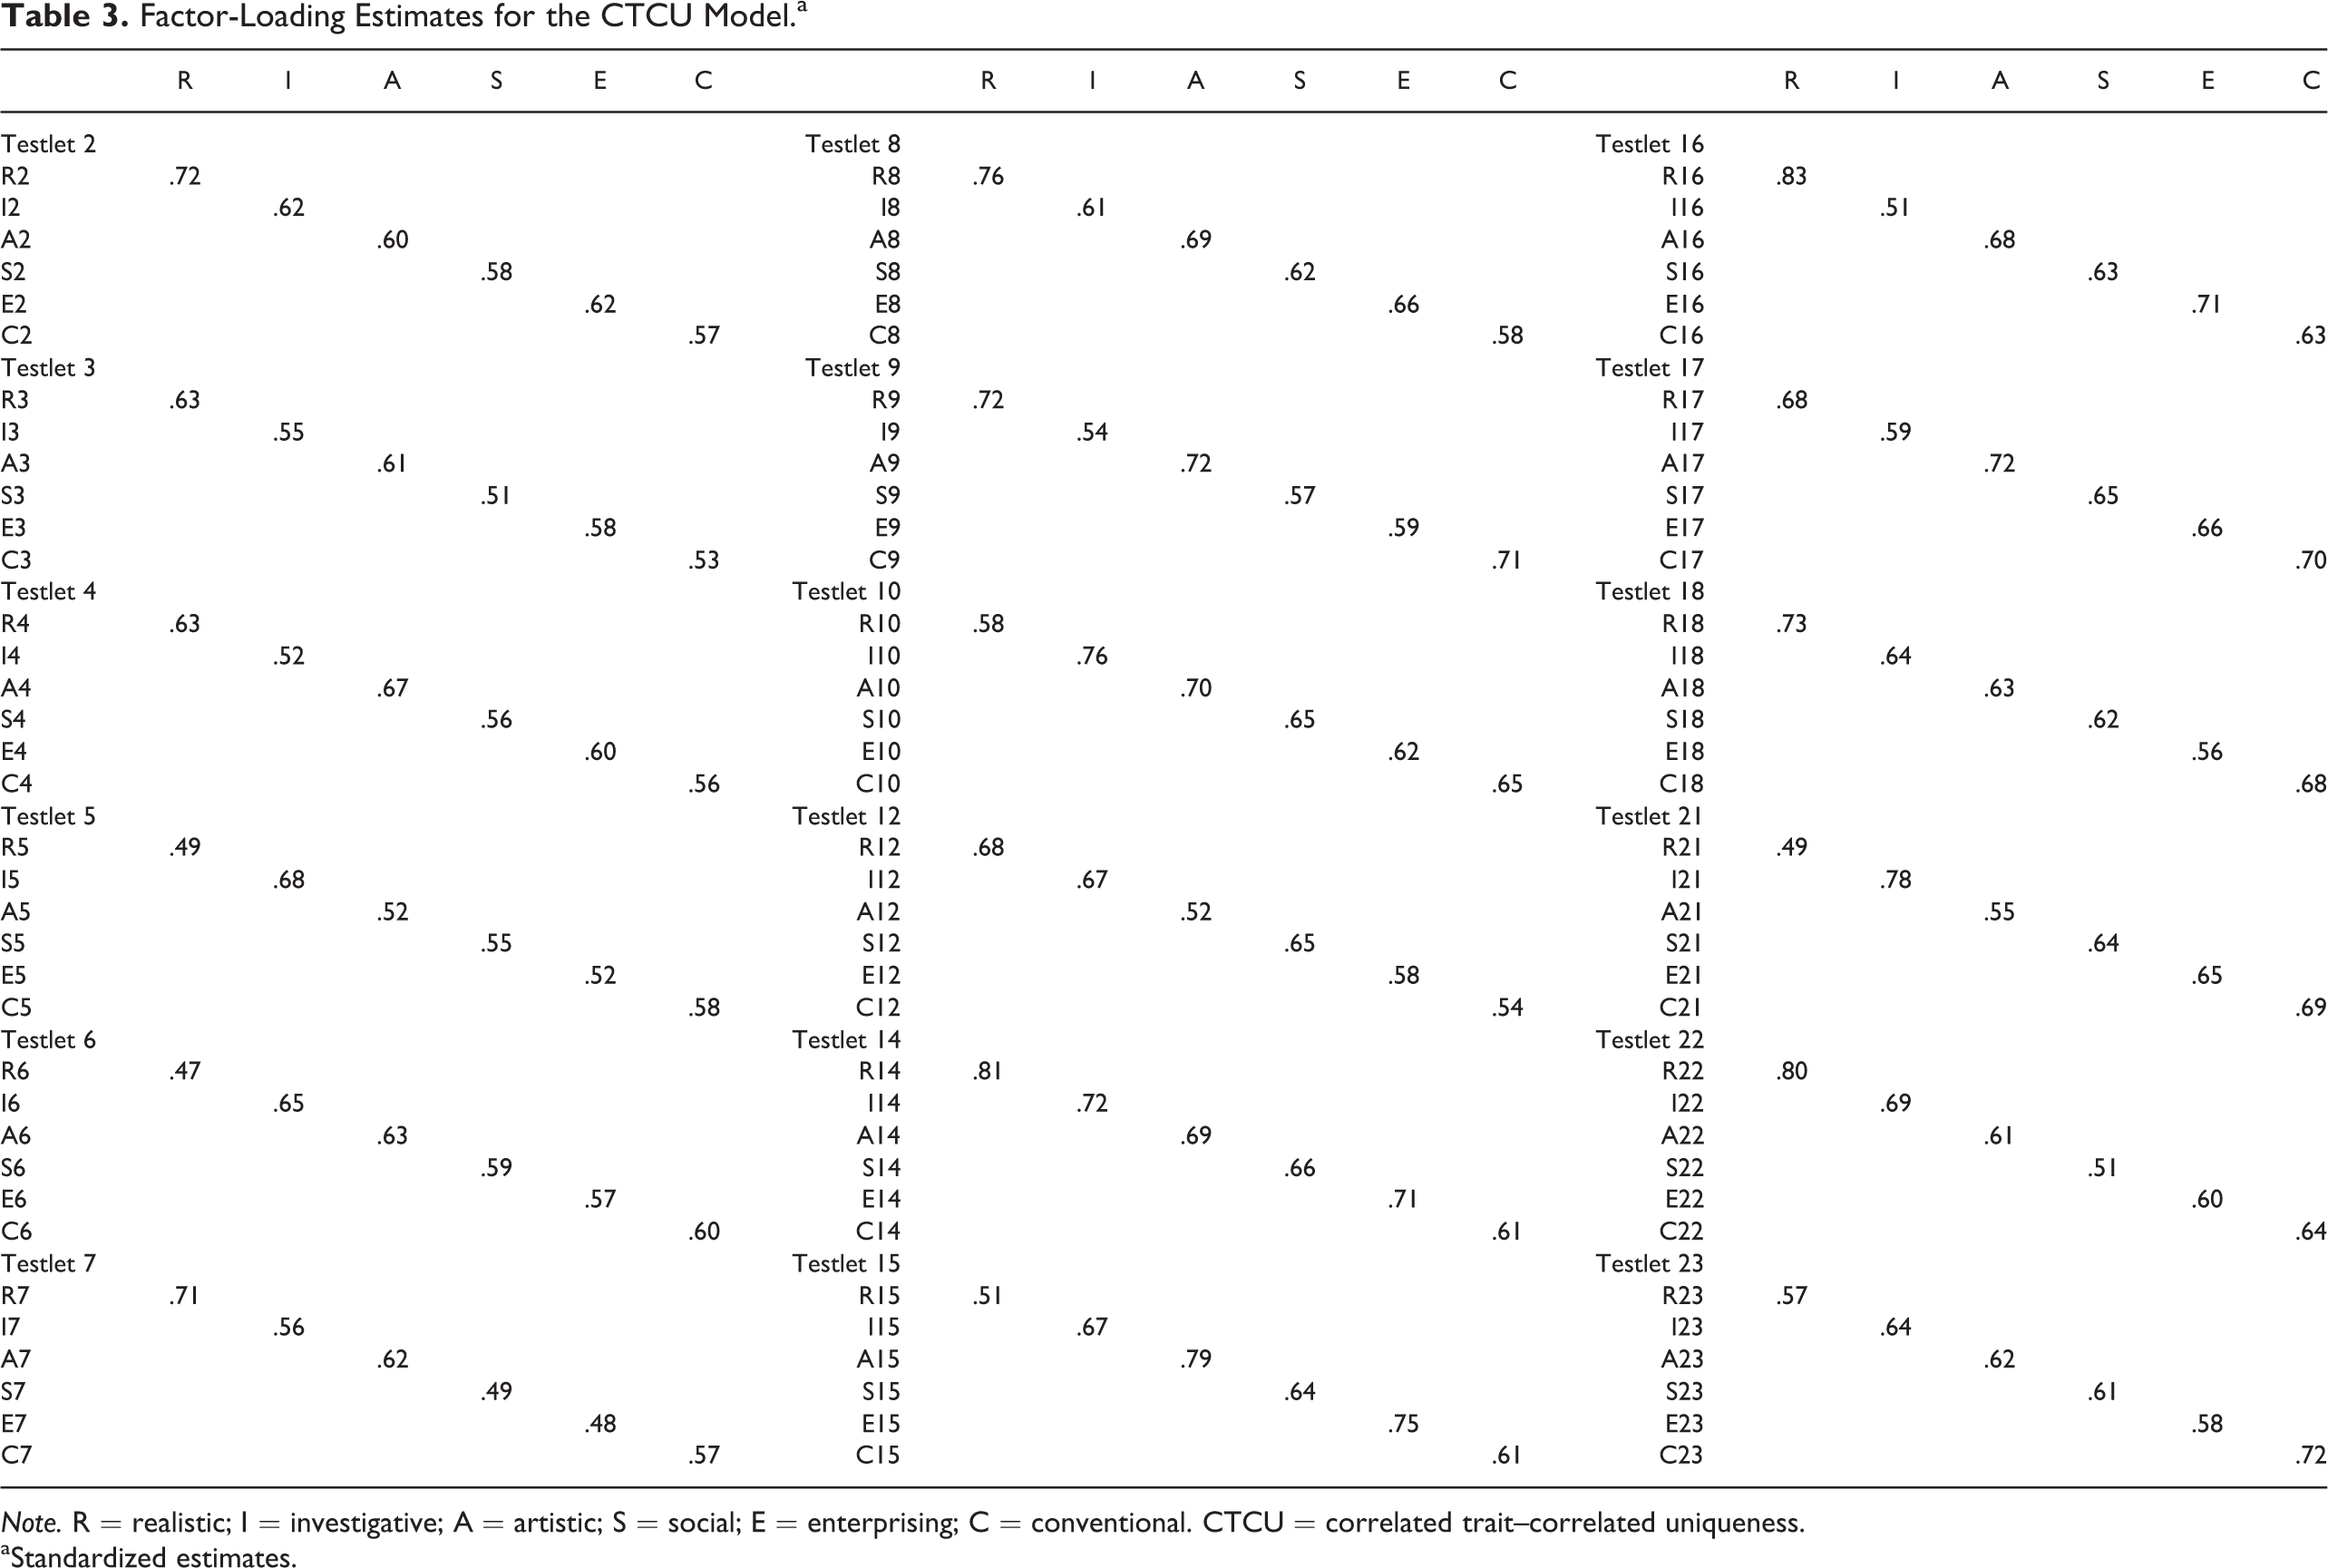
Note. R = realistic; I = investigative; A = artistic; S = social; E = enterprising; C = conventional. CTCU = correlated trait–correlated uniqueness.
aStandardized estimates.
Discriminant validity
In the CFA approach, the discriminant validity can be examined by trait correlations and residual correlations (Byrne, 2012; Widaman, 1985). Low correlations among traits show the evidence of discriminant validity (Byrne, 2012). As shown in Table 4, most of the estimated correlations are small, except for some of the correlation coefficients from the adjacent types, which should have higher correlation coefficients according to Holland’s (1973, 1997) claims. However, Holland’s simple circular hypothesis of the R-I-A-S-E-C interest structure was not fully supported by the sample of early adolescents in our study, which showed an I-R-A-S-E-C structure (please see next section for details). This circular pattern may explain the high correlations between the adjacent types in our study: I and R (r = .63), I and C (r = .54), A and S (r = .62), S and E (r = .63), and E and C (r = .82). Only two higher correlation coefficients were not produced by two adjacent types, I and E (r = .56), S and C (r = .46), which was not expected. Generally speaking, the low correlation coefficients among traits supported the discriminant validity of SCIA. The second indicator for the evidence of discriminant validity in the CTCU model is to check the residual correlations among the items within a method. Lower residual correlations between items within a method indicate high discriminant validity (Byrne, 2012). As shown in Table 5, all of these correlations are quite low for the SCIA. Both results demonstrate that SCIA has acceptable discriminant validity. The second indicator for the evidence of discriminant validity in the CTCU model is to check the residual correlations among the items within a method, lower residual correlations between items within a method indicate high discriminant validity (Byrne, 2012). As shown in Table 5, all of these correlations are quite low for the SCIA. Both results demonstrate that SCIA has acceptable discriminant validity.
Trait Correlation Estimates for the CTCU Model.a
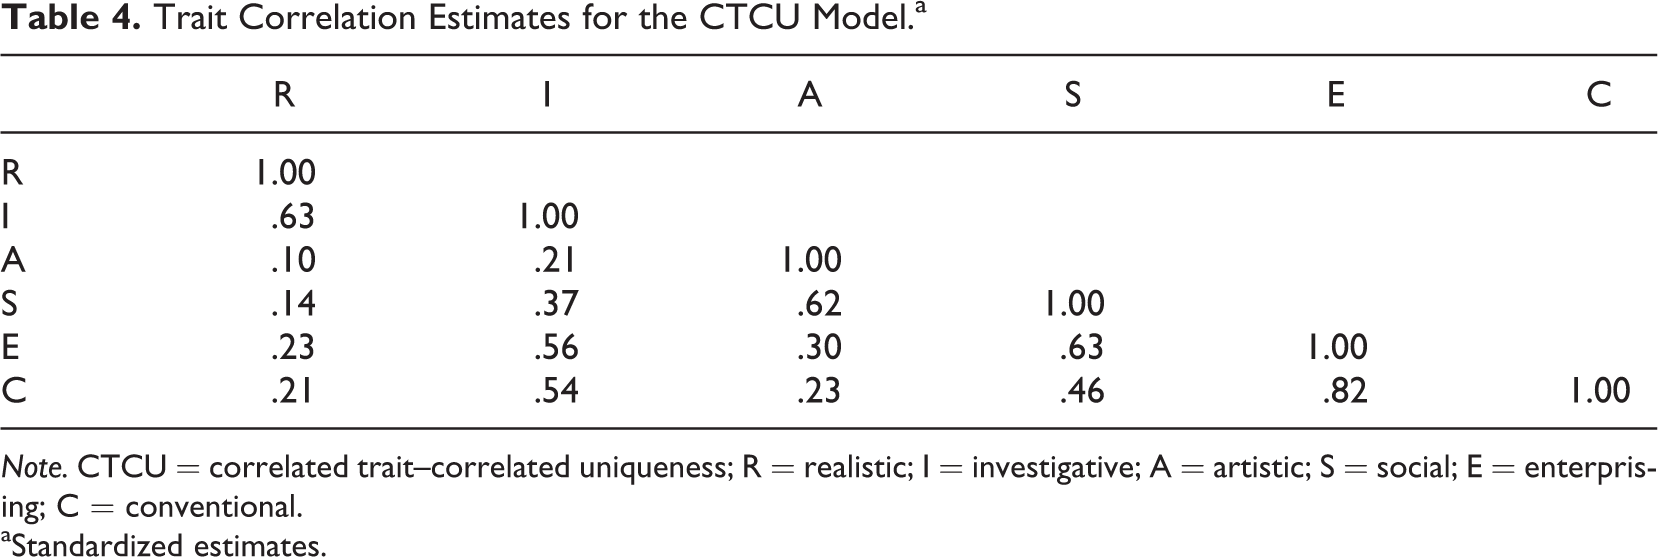
Note. CTCU = correlated trait–correlated uniqueness; R = realistic; I = investigative; A = artistic; S = social; E = enterprising; C = conventional.
aStandardized estimates.
Residual Correlation Estimates for the CTCU Model.a
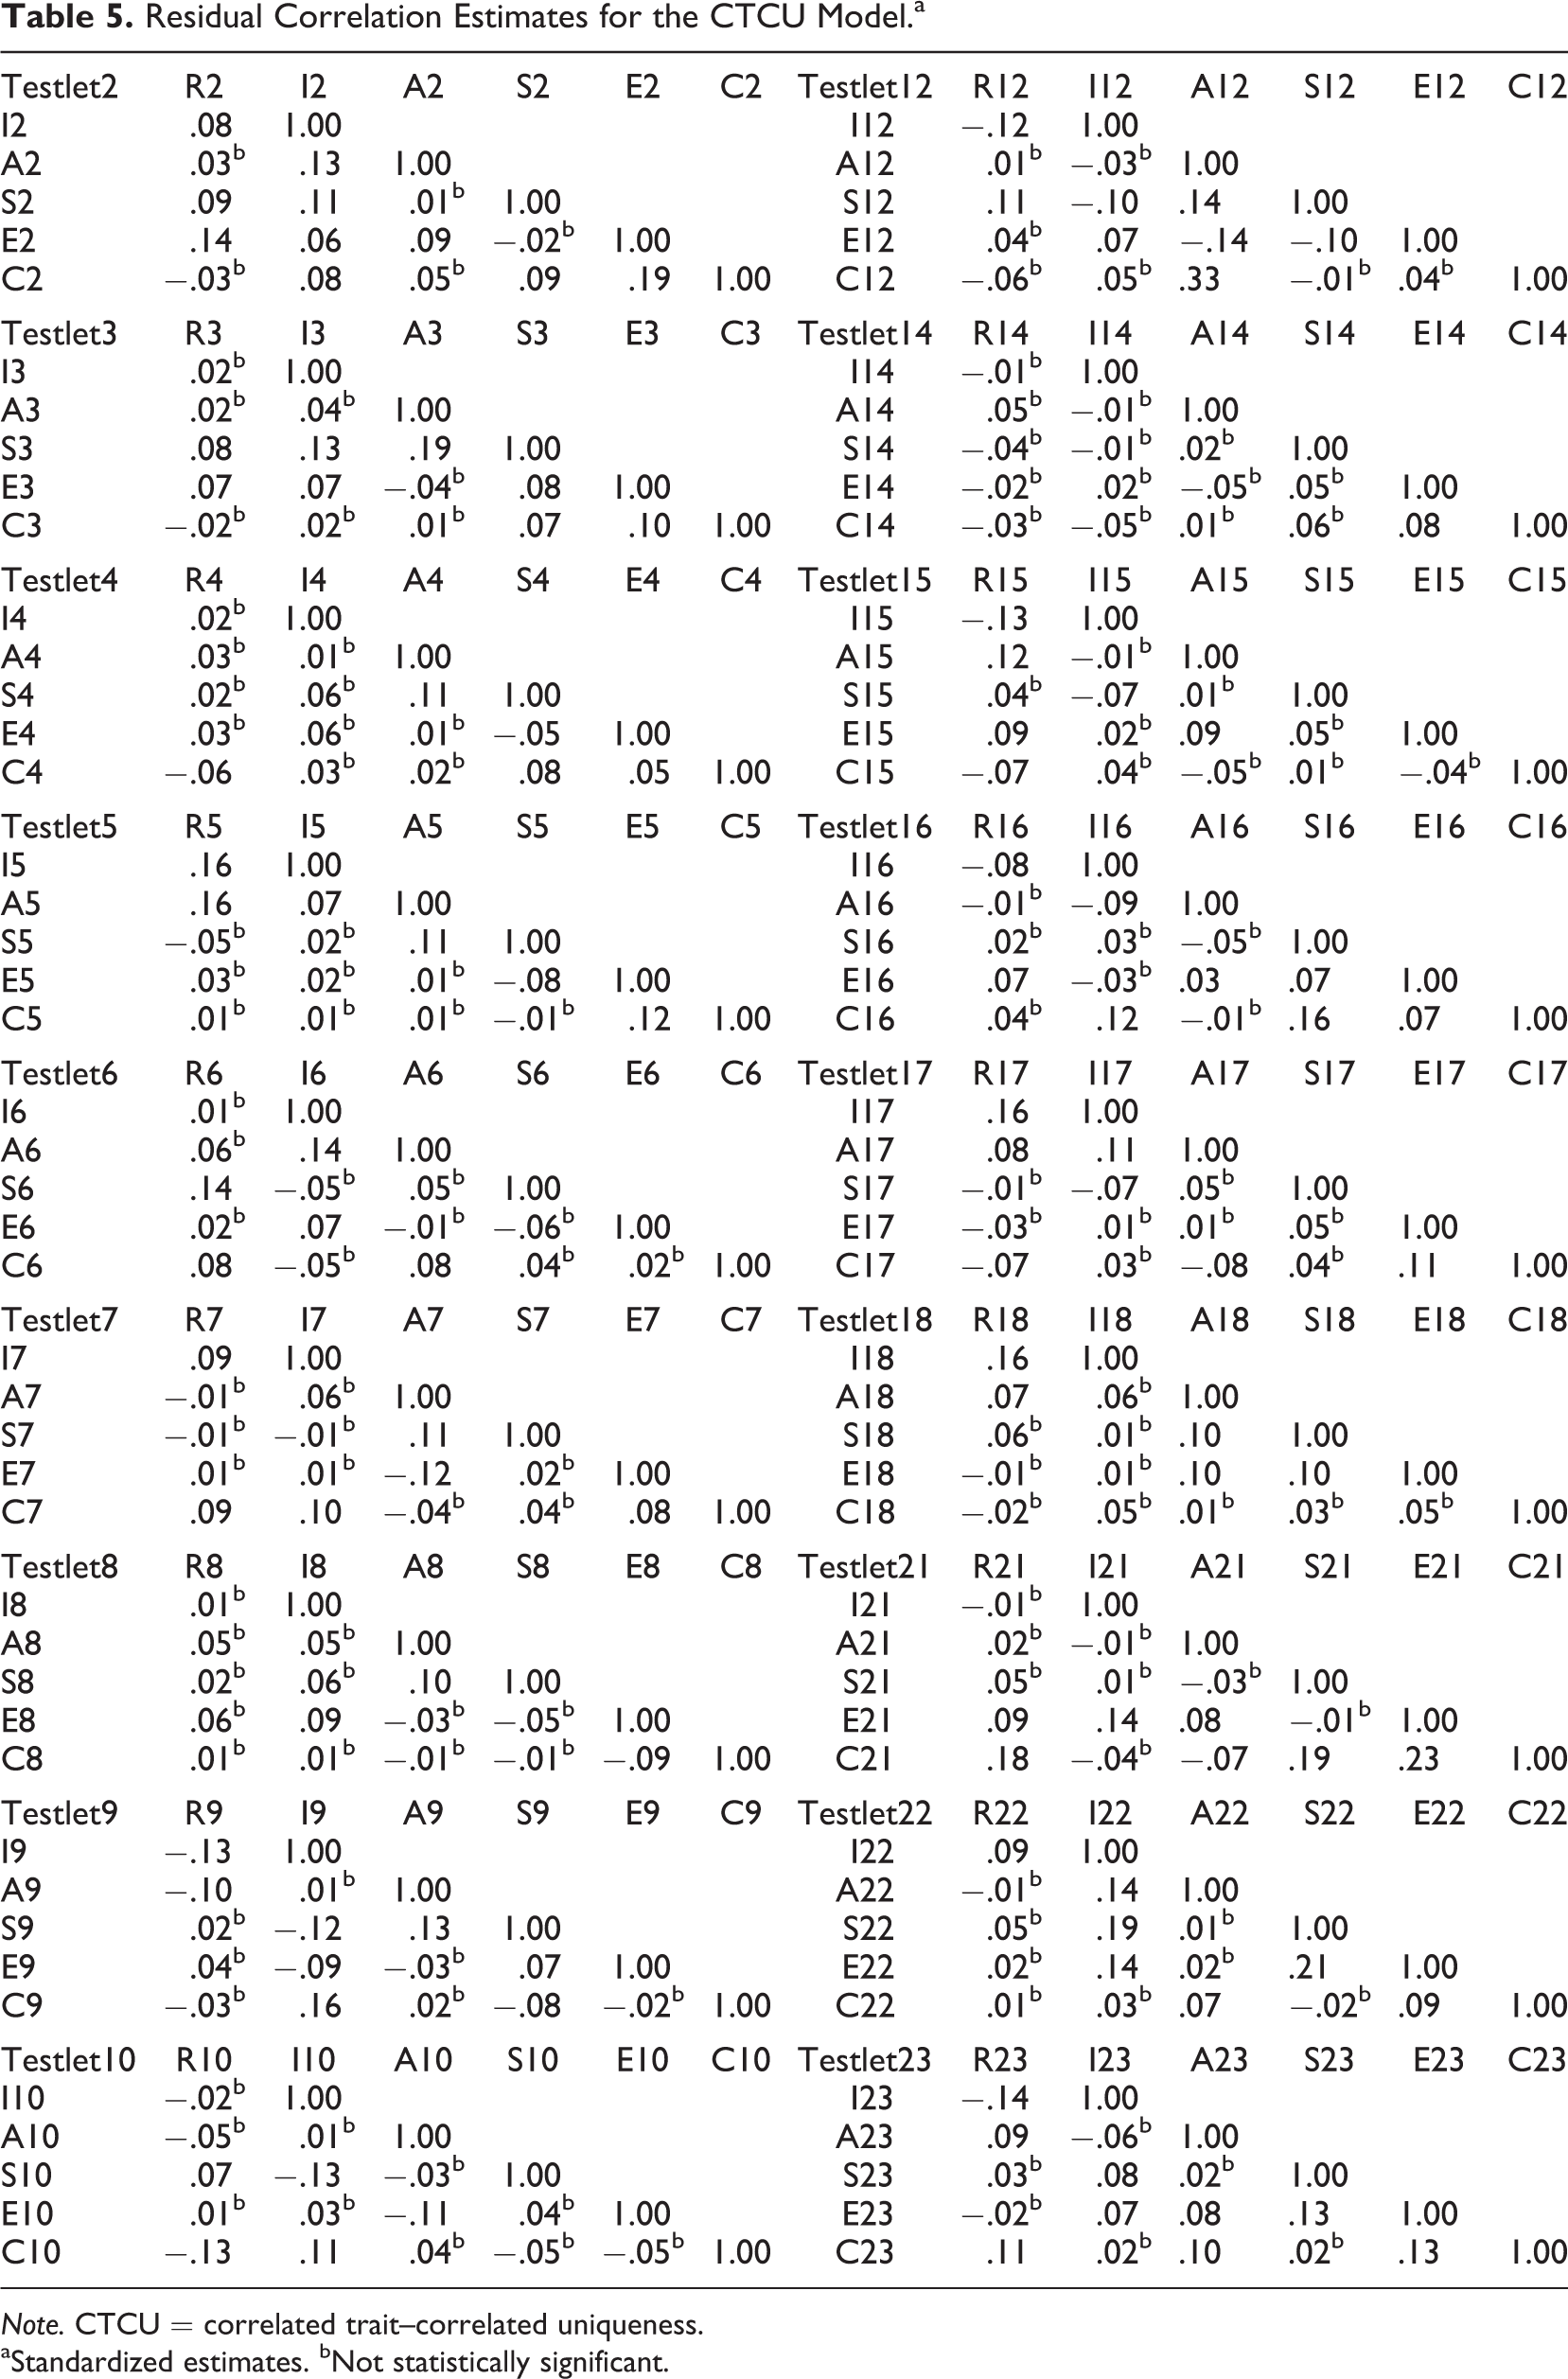
Note. CTCU = correlated trait–correlated uniqueness.
aStandardized estimates. bNot statistically significant.
Examining the Structure of Holland’s Vocational Interest Theory
Multidimensional scaling analysis
This study used MDS to test the simple circular hypothesis in Holland’s theoretical structure of vocational interest (Commandeur & Heiser, 1993). Ten thousand random starting values were specified for parameter estimation, and normalized raw stress served as the iteration criterion (Borg, Groenen, & Mair, 2013). The two-dimensional coordinates for the R, I, A, S, E, and C types were determined by limiting results to a biaxial plane and then converting them into a cylindrical coordinate system. In general, this rotation fixes the R and S interest types upon the two end points of the y-axis, while the remaining interest types are distributed in appropriate corresponding coordinates across the plane. Finally, formal-test data collected from the total, male, and female samples were analyzed individually using MDS, which revealed the normalized raw stress values for each sample to be .0011, .0037, and .0006, respectively, and that the Kruskal Stress-I values were .033, .061, and .023, respectively. The normalized raw stress is a difference function between the observed and estimated ranges, where a smaller value is more desirable since it indicates a better estimated goodness of fit. A stress value of .10 indicates a fair goodness of fit, while a value below .05 signifies a good fit (Kruskal, 1964). Based on these criteria, the data graphs for the total and female samples indicate a good fit, whereas that for the male sample indicates a fair goodness of fit.
The MDS results indicated that the six interest types are configured on a two-dimensional plane in a circular order of I-R-A-S-E-C, which differs slightly from the R-I-A-S-E-C order of Holland’s theory. The order of R and I was swapped across the data for all test subjects (i.e., both males and females), as shown in Figure 4.
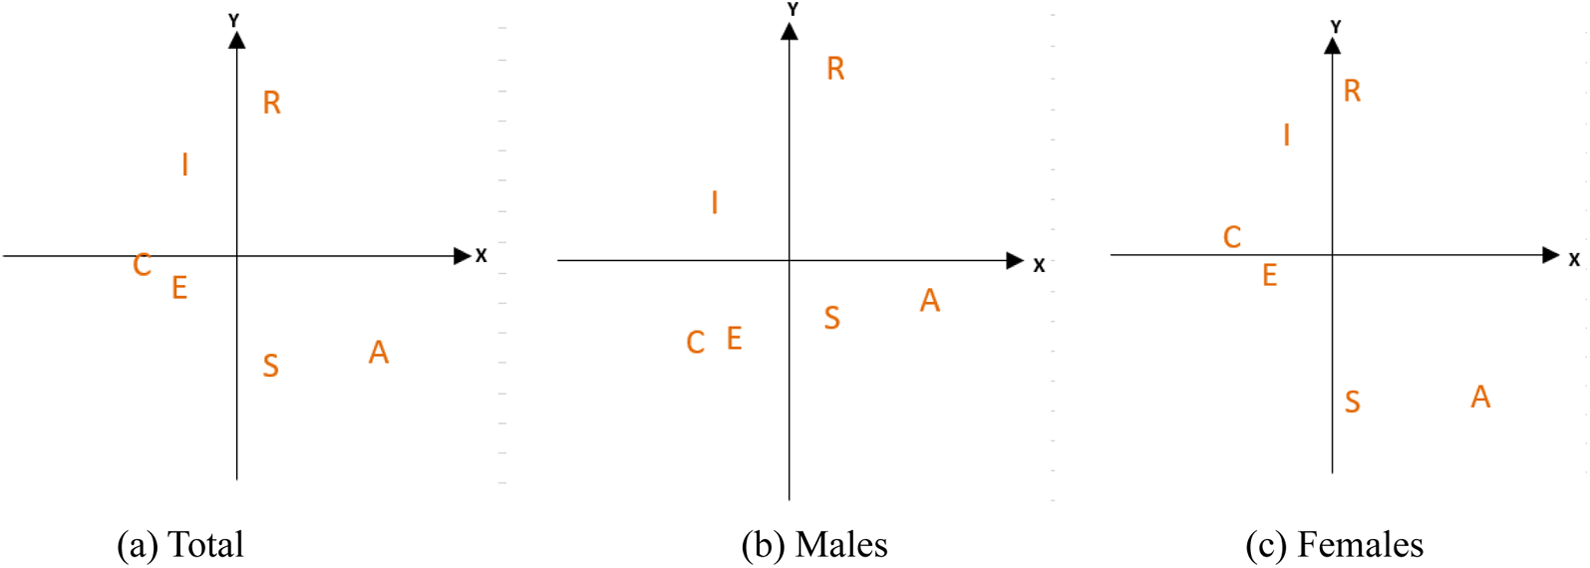
The multidimensional scaling coordinates of participants.
Internal correlation between interest types
Correlation analysis was used to verify the calculus assumption as proposed by Holland’s theoretical structure of vocational interest. Holland’s theory puts forth a number of hypotheses regarding the effect of relative positioning between interest types on the strength of the correlations. The theory stipulates that adjacent interest types (e.g., A-S) should have the strongest correlation, alternate types (e.g., A-E) should have a weaker correlation, and opposite types (e.g., A-C) should have the weakest correlation (Rounds, 1995). The correlations between interest types in the SCIA are listed in Table 6. Taking the S interest type of the total sample as an example, the correlation coefficients between adjacent, alternate, and opposite interest types were .58 (for S-E), .42 (for S-C), and .17 (for S-R), respectively. These data are consistent with the calculus assumption as proposed by Holland’s theory expect the I interest type. The I interest type is not consistent with Holland’s calculus assumption, since the correlation coefficients between adjacent, alternate, and opposite interest types were .22 (for I-A), .35 (for I-S), and .54 (for I-E), respectively. These results indicate that the SCIA is only partially consistent with Holland’s calculus assumption, as reflected in the final circular order determined using MDS.
Internal Correlation Matrix.
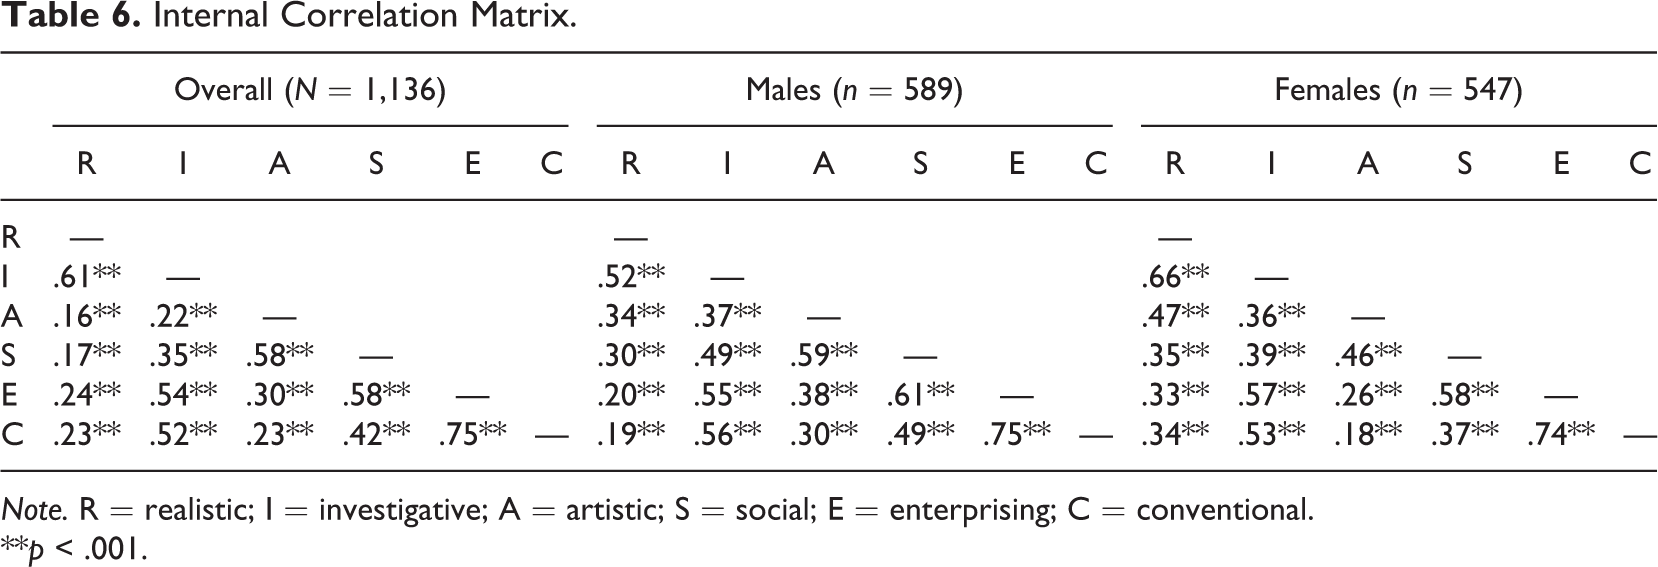
Note. R = realistic; I = investigative; A = artistic; S = social; E = enterprising; C = conventional.
**p < .001.
Randomization test
Holland’s theory postulates that there are 15 correlation coefficients between the scores for each of the six interest types. When the calculus assumption is fulfilled, the six correlation coefficients for adjacent interest types should be greater than the six for alternate types and the three for opposite types. This assessment involved 105 pairwise comparisons between the 15 correlation coefficients; excluding the 33 pairs of equivalent correlation coefficients, 72 pairs required examination, as outlined in Table 7.
Randomization Tests.
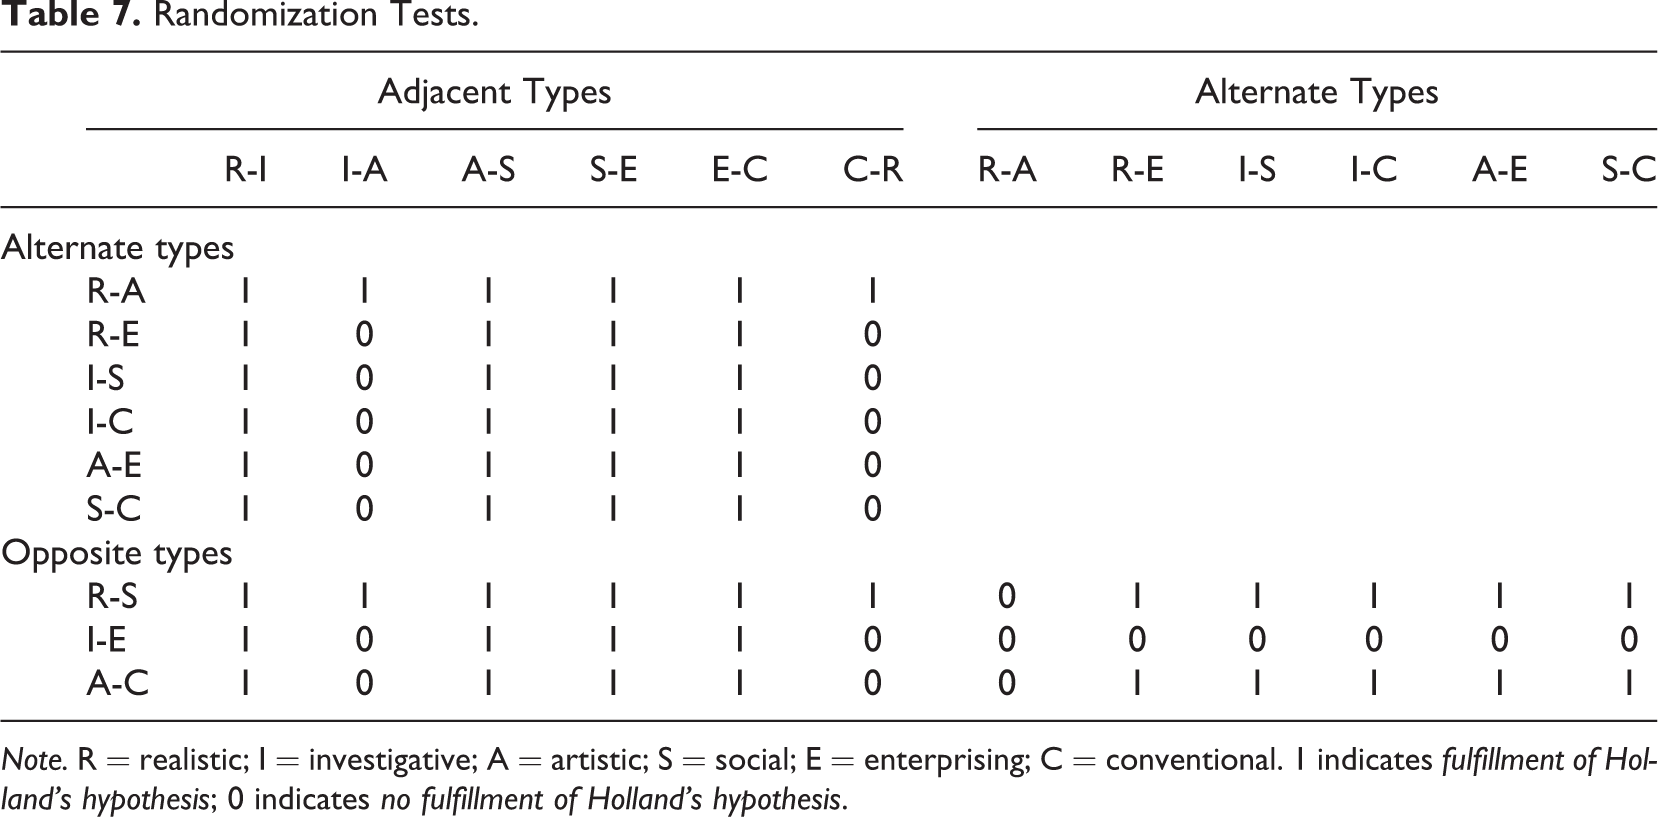
Note. R = realistic; I = investigative; A = artistic; S = social; E = enterprising; C = conventional. 1 indicates fulfillment of Holland’s hypothesis; 0 indicates no fulfillment of Holland’s hypothesis.
Randomization testing was used to analyze the final sample: 50 of the 72 pairs of correlations were consistent with the hypothesis proposed by Holland’s theory, while 22 were not. The CI was .389 [= (50–22)/72], and the p-value obtained through randomization testing was .017 (Hubert & Arabie, 1987). These data signify that the probability of these 50 pairs of correlation coefficients being consistent with the hypothesis as a result of random chance is extremely low, but also that the SCIA under study was only partially consistent with Holland’s calculus assumption. Looking at the data in terms of gender, the CI was .361 for male students and .389 for female students, suggesting that the female sample was more consistent with the circular order postulated by Holland’s theory.
Discussion
The use of existing interest assessments is limited by their suitability to only certain target populations. For students in countries that implement educational streaming during the early or intermediate stage of education, these instruments may not be able to provide adequate guidance during the process of career decision making. Furthermore, the current layout of most assessment items provide only limited content, and mean that students are expected to determine preferences based on inadequate information. The SCIA developed in this study incorporates photographs of real-world work settings; these situational images provide richer information for guiding test-takers in evaluating personal preferences. Item bias may occur when students encounter unfamiliar or entirely new information, leading to a decreased ability to accurately assess personal levels of interest. Asking adolescent students to rank levels of interest through situational content may help correct such bias, thereby also enhancing the validity of the SCIA for test-takers. The underlying logic is that rather than requiring students to base their answers on their own intuition or even guesswork, the provision of situational context will provide students with a better understanding of the work duties described—and even some primary operational procedures—before they are asked to make a choice. This method helps to prevent students becoming disrupted during the decision-making process, should they have limited exposure to life experiences, or have difficulty grasping content related to activities or occupations that may be overly abstract (Tracey, 2001). Therefore, the use of situational testing not only primarily tests the cognitive abilities or personality tendencies of test-takers (Aguinas, Henle, & Beaty, 2001; Lievens & Coetsier, 2002; Whetzel et al., 2008) but also can measure their career interests.
This study used various methods of analysis to examine Holland’s theory of vocational interest. EFA and CFA (CTCU model) confirmed the existence of six individual interest types. Overall, the SCIA demonstrates acceptable reliability and construct validity. Previous research has demonstrated the existence of Holland’s six interest types (Campbell et al., 1992; Gottfredson & Richards, 1999), but these constructs were only partly supported when they were analyzed through MDS and randomization tests. The study of Rounds (1995) involving the simple circular hypothesis and calculus assumption suggested that Holland’s theoretical structure was only partially fulfilled. For instance, the R-I-A-S-E-C order postulated by the simple circular hypothesis was instead found to be I-R-A-S-E-C in the present study. This further resulted in the collected data also not being completely consistent with the calculus assumption during randomization testing. Tracey (2001) stated that the goodness of fit between empirical data and Holland’s theory depends on the age of the subjects, with Holland’s theory exhibiting increasing stability for older subjects. This observation may explain why our data gathered from junior high school students (aged between 14 and 15 years) were not consistent with the circular order postulated by Holland’s theory. It is noted that several literature have similar findings, such as the I-R-A-S-E-C order determined by Tien (1996), the R-A-S-I-E-C order determined from the analysis of interest constructs for Spanish students by Elosua (2007), and the I-R-S-A-E-C order demonstrated by Icelandic students (Einarsdóttir et al., 2010). One reason may be caused by the culture-specific difference or the evolving interests of students.
An analysis of interest-type scores for samples collected from mainland China, Hong Kong, and Taiwan by Liu and Rounds (2003) indicated that there was a weaker correlation between the I-A and R-C interest-type pairs, which was not consistent with Holland’s calculus assumption. Therefore, many scholars have proposed different theories about the structure of interests, such as the hierarchical model (Gati, 1982, 1991) and the alternative three-class partition (Rounds & Tracey, 1996). Whether such diverse findings for Holland’s theoretical structure are due to cultural differences or the developmental changes that occur as an individual ages merits further research.
The findings of this study are only partially consistent with Holland’s theory of vocational interest; this could be due to culture-specific differences or the evolving interests of students during adolescence. This assessment could be used in future studies focused on various target populations as well as to explore—through appropriately designed longitudinal and cross-sectional studies—the suitability of applying Holland’s theory to students. A stringent process was used to develop the SCIA in the present study, and both its reliability and validity have been thoroughly verified. Finally, in terms of practical application, the assessment content and research findings of this study provide a direct and tangible contribution to the development of career guidance tools designed for adolescent students who face educational streaming when they are attending junior high schools.
Footnotes
Declaration of Conflicting Interests
The author(s) declared no potential conflicts of interest with respect to the research, authorship, and/or publication of this article.
Funding
The author(s) disclosed receipt of the following financial support for the research, authorship, and/or publication of this article: The author appreciate the funding supports from the Aim for the Top University Project of Ministry of Education, Taiwan, and Ministry of Science and Technology, Taiwan (104-2911-I-003-301;102-2911-I-003-301;102-2511-S-003-001-MY3; 101-2511-S-003-058-MY3; 101-2511-S-003-047-MY3; 99-2631-S-003-003).