
Abstract
This study examined negative stereotypes of science, technology, engineering, and mathematics (STEM) professionals as predictors of math/science interests and career goals in a sample of high school students. In a scale development study, results of an exploratory factor analysis (N = 341) indicated a single-factor structure best represented items for the Math and Science Stigma (MASS) Scale—a measure of negative stereotypes of STEM professionals. In a follow-up study, structural equation modeling was used to confirm the factor structure of the MASS. Further analyses showed that a model with STEM stereotypes depicted as a proximal contextual barrier to math/science career interests and goals fit the data well. STEM stereotypes were a significant predictor of math/science self-efficacy, math/science self-efficacy was a significant predictor of math/science interests, and interests predicted math/science career goals. The relationship between STEM stereotypes and math/science interests was explained by self-efficacy. Results are discussed in terms of decreasing negative stereotypes of STEM professionals and enhancing high school students’ interests in STEM careers.
Keywords
Although U.S. high school students’ performance in math and science has improved over the years, they continue to underperform compared to their international peers. For example, results of the most recent Program for International Student Assessment test showed that of 65 countries, U.S. 15-year-olds placed 35th in math and 27th in science (National Center for Educational Statistics [NCES], 2013). These performance deficits have also been shown to play out in science, technology, engineering, and mathematics (STEM) career development. In 2015, less than half (42%) of ACT-tested high school graduates met college readiness benchmarks for math while 38% met college readiness benchmarks for science. Furthermore, as of 2013, only 1 in 10 high school students expressed interest in an STEM career (ACT, 2013). These figures compliment data, suggesting that while U.S. students’ general academic motivation declines from childhood to adolescence, the steepest declines have been observed in math and science (Gottfried, Fleming, & Gottfried, 2001; Gottfried, Marcoulides, Gottfried, Oliver, & Guerin, 2007).
In contrast, younger students have fared better on international tests of math and science performance. Results of the Trends in International Mathematics and Science Study revealed that of 57 countries, U.S. fourth-grade students outperformed all, but seven in math and six in science. Similarly, of 56 countries, U.S. eighth-grade students outperformed all, but six in math and eight in science (NCES, 2012). Overall, these data suggest that while younger students in the United States outperform many of their international peers in math and science, high school students have not seen similar performance increases and remain less prepared in these subject areas. These statistics have led policy makers to express concern regarding U.S. high school students’ math/science career development, given the importance of their participation in the future STEM workforce (ACT, 2013).
Research into the origins of high school students’ interest and performance in math and science has identified individual (e.g., self-efficacy) and contextual (e.g., learning experiences, social supports) influences on students’ math/science career interests and goals (Garriott, Flores, & Martens, 2013; Garriott et al., 2014). An area that has received increasing attention, but has not been studied in high school students, is the influence of negative stereotypes of individuals in STEM fields. Specifically, negative stereotypes of individuals in STEM have been identified as potential factors in U.S. students’ lower motivation, interest, and performance in math and science (Anderegg, 2007). However, the majority of studies investigating negative STEM stereotypes have focused on college students (Cheryan, Plaut, Steele, & Davies, 2009; Cheryan & Plaut, 2010). Because high school is a critical period during which important decisions related to STEM career pursuit are made, more research is needed that examines the role of STEM stereotypes in high school students’ math/science career goals.
Negative STEM Stereotypes
Research suggests that individuals in STEM fields may be subjected to negative stereotypes, such as obsessiveness and social skills deficits (Cheryan, Siy, Vichayapai, Drury, & Kim, 2011). Additional research suggests that negative stereotypes of individuals in STEM may include a preference for social isolation, obsession with technology, poor hygiene, and a mundane lifestyle (Barbercheck, 2001; Nassar-McMillan, Wyer, Oliver-Hoyo, & Schneider, 2011). Studies have shown that perceived dissimilarity to individuals who embody these stereotypes predicts career interest and performance estimation in computer science (Cheryan et al., 2011).
A limitation of the current literature on STEM stereotypes and career interests is its confinement to college student samples. Indeed, decreases in students’ motivation and interest in STEM fields appear to manifest earlier in their educational development, leading some authors to speculate that negative stereotypes of individuals in STEM exert their influence long before college (Anderegg, 2007). Research also suggests that exposure to STEM career role models may be lacking for adolescents and that students may choose to forego STEM domains in high school (Aschbacher, Li, & Roth, 2010). These findings indicate that while assessing STEM stereotypes in college students is informative, their impact must also be captured earlier in the educational pipeline. Finally, research on negative STEM stereotypes has been largely limited to the domain of computer science.
Measurement of STEM stereotypes in college students has relied heavily on experimental manipulations (e.g., Cheryan et al., 2009). This methodology has shown to be useful in mimicking prototypical STEM environments and individuals but may be less practical in terms of implementation with high school students. Additional measures have been developed to assess STEM stereotypes from the framework of stereotype threat (e.g., Deemer, Lin, Graham, & Soto, 2016). These measures are useful for capturing gender-based stereotype threat within specific STEM fields (biology, chemistry, and physics) but are more focused on capturing anxiety related to confirming gender-based stereotypes (i.e., incompetence) than negative stereotypes of individuals in STEM. While instrumentation exists to measure stereotypes associated with scientists (Wyer, Schneider, Nassar-McMillan, & Oliver-Hoyo, 2010) in college students, there are currently no self-report measures to assess high school students’ perceptions of negative stereotypes associated with individuals in STEM fields. Measurement of stereotypes associated with STEM professionals more broadly is appropriate for high school students, as they may be considering a range of STEM areas at this stage of their career development (Mattern, Radunzel, & Westrick, 2015). Furthermore, high school students may have different levels of exposure to STEM professionals than their college peers, making direct comparisons of STEM-related stereotypes between high school and college students challenging. Therefore, the present study sought to make a novel contribution to the literature by developing a measure of negative STEM stereotypes specific to high school students.
STEM Stereotypes as a Proximal Contextual Barrier
The current literature on negative STEM stereotypes characterizes these stereotypes as a barrier to STEM-related interests and goal development (Cheryan & Plaut, 2010). Within social cognitive career theory (SCCT; Lent, Brown, & Hackett, 1994), proximal contextual barriers are defined as obstacles that individuals anticipate in their pursuit of domain-specific career goals (Lent & Brown, 2006). Proximal barriers may include both objective and perceived obstacles and are also posited to be informed by past personal barrier experiences as well as vicarious barrier information (Lent, Brown, & Hackett, 2000). Negative stereotypes of individuals in STEM fields may be informed by personal or vicarious experiences with STEM professionals. For example, stereotypes of those interested in or employed in STEM areas are prevalent in a number of media outlets (e.g., the socially inept computer scientist; Anderegg, 2007). Exposure to these stereotypes may inform how a student imagines the environment of an STEM profession or those who pursue STEM careers.
In the present study, STEM stereotypes are conceptualized as perceived aspects of the career environment that might serve as proximal contextual barriers to math/science career interests and goals. That is, endorsing strong negative stereotypes of individuals in STEM fields likely reflects one’s perceptions of who pursues these occupational areas and works in STEM jobs. This conceptualization is especially relevant in light of research that supports links between negative STEM stereotypes and lower confidence and interest in STEM fields (Cheryan et al., 2009, 2011).
Within SCCT, proximal barriers are hypothesized to predict goals as well as to relate indirectly to interests and goals through self-efficacy (Lent et al., 2000, 2003). Thus, in the present study, it was hypothesized that STEM stereotypes would relate directly and indirectly to math/science goals through math/science self-efficacy and that self-efficacy would also mediate the relationship between STEM stereotypes and interests.
The Present Study
Lack of adequate instrumentation is one barrier to proliferation of research on negative STEM stereotypes. While measures of general attitudes toward STEM educational areas have been developed, few options exist to assess stereotypes of individuals in STEM careers, particularly for high school students. Therefore, the present study (a) reports the development and validation of a scale to assess STEM stereotypes and (b) examines STEM stereotypes as a predictor of math/science self-efficacy, career interests, and goals in a sample of high school students.
Study 1
The purpose of Study 1 was to develop and provide initial validity evidence for the Math and Science Stigma (MASS) Scale—a measure of negative STEM stereotypes. Hypotheses for Study 1 were as follows:
Method
An initial item pool was developed based on relevant literature devoted to negative stereotypes of individuals in STEM (e.g., Anderegg, 2007; Cheryan et al., 2011). Stereotypes related to interpersonal skills (e.g., socially awkward, “have poor social skills”), appearance (e.g., poor hygiene, “are not attractive”), and behaviors (e.g., social isolation, “do not date”) were included. Because there is no existing theoretical conceptualization of separate factors related to STEM stereotypes, items were written to capture STEM stereotypes generally rather than according to a preestablished factor structure. Items were developed by the first author, a research team of 15 graduate students, and one faculty member with research expertise in STEM career development. Items were then rated by the first author, in terms of relevance to STEM stereotypes, on a scale ranging from 0 (not relevant or essential) to 3 (relevant and essential) to enhance content validity. Only items rated with 3 were included on the initial version of the scale. After excluding redundant and lower rated items, 40 items comprised the initial item pool.
Participants and Procedure
Procedures for data collection in Study 1 have been described in a previous report (Garriott et al., 2013). Following institutional review board (IRB) approval, a sample of 341 high school students completed a paper-and-pencil survey. Students were recruited from the federal outreach TRIO programs across the Midwestern United States, meaning all participants belonged to families whose annual income was 150% of the poverty line or below or were a prospective first-generation college student. This demographic was selected, as low-income and first-generation college students are underrepresented in the STEM pipeline (Chen & Soldner, 2013), and due to the desire to ensure the norming sample was diverse in terms of race, ethnicity, and socioeconomic status. Assent forms were distributed to participants during scheduled program activities, and implied consent was obtained from parents. Parents were instructed to contact the principle investigator and speak with their child if they did not wish for them to participate in the study. All instruments were counterbalanced to control for response effects. Participants were eligible to enter a raffle for one of the five US$25 gift cards as incentive for participation.
The sample included 219 (64.2%) females and 122 (35.8%) males. By race/ethnicity, the sample identified as White (37%), African American (20%), Mexican American (20%), Asian American (6%), Biracial/Multiracial (6%), and Native American (1%). In terms of class rank, 30% were freshmen, 28% were sophomores, 25% were juniors, and 15% were seniors. Average age was 15.91 years (SD = 1.20).
Instruments
STEM stereotypes
The initial item pool developed for the MASS was administered. The 40 items were rated on a Likert-type scale ranging from 1 (strongly disagree) to 5 (strongly agree). A prompt for scale items was developed and read, “when I think of people who work in science, technology, engineering, and math jobs, I think of people who …” Scale scores were summed and averaged with high scores indicative of endorsement of high negative stereotypes of STEM professionals.
Intrinsic math/science motivation
The Reasons for Learning Questionnaire (SRQ-L; Williams & Deci, 1996) was used to assess intrinsic academic motivation in math and science. The SRQ-L includes 12 items rated on a Likert-type scale ranging from 1 (not at all true) to 7 (very true). Scores are obtained by summing and averaging items. The SRQ-L may be used to assess autonomous (i.e., intrinsic) and controlled (i.e., extrinsic) regulation. For the purpose of the present study, only 5 items representing autonomous regulation on the SRQ-L were used. Item prompts ask participants to rate responses based on reasons for participating actively in classes, following instructors’ suggestions, and expanding knowledge in a particular academic domain. A sample item for the autonomous subscale is, “it’s interesting to learn about.” The SRQ-L was developed to be adapted for use in a variety of academic domains. Item responses were adapted to assess motivation in math and science classes for the present study.
Coefficient αs for scores on the autonomous regulation subscale of the SRQ-L have ranged from .75 to .80, and the subscale has been shown to correlate in expected directions with perceived locus of causality (r = .33) as well as perceived competence (r = .22; Williams & Deci, 1996). Coefficient α for scores on the autonomous regulation subscale in the present study was .79.
Results and Discussion
Preliminary Analyses
Data screening
Of the 369 surveys returned, 341 contained responses to both MASS items and the SRQ-L Scale. This sample size was deemed sufficient for primary analyses based on the literature, suggesting sample sizes of at least 300 are acceptable for factor analysis (Worthington & Whitaker, 2006). Missing data patterns were examined for the SRQ-L and MASS. Results of a missing values analysis conducted in SPSS 22.0 showed that there were 10 cases with a total of 16 (2.34%) missing values of 682 possible values in the data set. Percentage of missing data was 2.6% for the SRQ-L and 2.1% for the MASS. Results of Little’s missing completely at random (MCAR) test were not statistically significant, χ2 = .959, p = .619, indicating data were MCAR. Expectation maximization has been recommended for handling missing values in exploratory factor analysis (EFA; Schlomer, Bauman, & Card, 2010) and was used to account for missing values in primary analyses.
Primary Analyses
Factor analysis
Items for the MASS were subjected to principle axis factoring with oblique (i.e., oblimin) rotation as well as a parallel analysis to determine the number of factors to extract from items. Parallel analysis is a sample-based approach to factor analysis in which a number of correlation matrices are produced from randomly generated samples within a data set. Parallel analysis has been shown to result in more reliable estimations of the correct number of factors to extract from a set of items compared to other approaches (Hayton, Allen, & Scarpello, 2004). Within the EFA, oblimin rotation was selected, as it was anticipated any emergent subscales within the set of items would be correlated. Cattell’s scree plot test and factor loadings ≥ .40 were used to inform decisions regarding an initial factor solution in the EFA (Worthington & Whitaker, 2006). For the parallel analysis, actual and randomly generated eigenvalues were compared. Factors corresponding to eigenvalues produced from the actual data set that were greater than those produced by the parallel analysis were retained (Hayton et al., 2004).
Results of the factor and parallel analyses suggested a single factor accounting for 46.70% of the variance. The resulting factor included 8 items assessing stereotypes of individuals in STEM fields (see Table 1 for items, factor loadings, and item–total correlations). A coefficient α of .93 was obtained for MASS Scale scores. Evidence of construct validity was demonstrated through a statistically significant, moderate inverse correlation with intrinsic motivation in math and science (r = −.31, p < .001).
Factor Loadings, Communalities, Means, and Standard Deviations for Math and Science Stigma Items.

Note. h 2 = communality estimates.
These results supported hypotheses for Study 1. Specifically, a unidimensional factor structure emerged for MASS items and scores on the MASS were significantly and inversely correlated with intrinsic motivation in math and science. An additional sample was sought out to provide further validity evidence for the MASS and examine STEM stereotypes as predictors of math/science interests and career goals.
Study 2
The purpose of Study 2 was to (a) confirm the factor structure of the MASS, (b) provide additional convergent and discriminant validity data for the MASS, and in order to provide concurrent validity evidence for the mass, (c) examine the MASS as a predictor of math/science self-efficacy, interests, and goal pursuit in math and science in a sample of high school students. Hypotheses for Study 2 included:
We anticipated a small to moderate correlation between scores on the MASS and the measure of stereotypes of scientists (SOS), as this latter measure is restricted to the domain of science and also captures stereotypes of professional competencies, which are not included on the MASS. We also expected small to moderate path coefficients between STEM stereotypes and math/science self-efficacy and goals in the structural model, as coefficients between proximal contextual barriers, self-efficacy, and goals have ranged from −.11 to −.19 in prior SCCT studies examining STEM domains (Lent et al., 2001, 2003; Lent, Lopez, Lopez, & Sheu, 2008).
Method
Participants and Procedure
All procedures for Study 2 were approved by the host institution’s IRB. Participants were 358 students recruited from a high school in the Rocky Mountain region of the United States. Trained research assistants were granted permission to enter students’ classrooms to distribute and collect a paper-and-pencil survey. Students who agreed to participate in the study completed assent forms. Implied consent was obtained from parents for the study. The high school serving as the site for data collection distributed informational letters to parents describing the study procedures. Parents who did not wish for their child to participate in the study were instructed to contact the principle investigator and speak with their child about withholding participation.
The sample included 162 (45.3%) females and 196 (54.7%) males. Average age was 15.16 years (SD = 0.84). In terms of race/ethnicity, participants identified as Mexican American (70.1%), White (13.7%), Multiracial (3.1%), Spanish American (3.1%), African American (2.2%), Native American (0.6%), Central American (0.6%), Puerto Rican American (0.6%), Asian American (0.3%), and “other” (0.6%). Nineteen (5.3%) participants did not provide this information. By class rank, the sample was predominantly freshmen (50.7%), followed by sophomores (48.6%), and one senior (0.3%). Three students (0.8%) did not provide this information.
Instruments
Math/science goals
The Math/Science Intentions and Goals Scale (Smith & Fouad, 1999) was used to assess students’ math- and science-related educational and career goals. The scale includes 7 items rated on a Likert-type scale ranging from 1 (very strongly disagree) to 6 (very strongly agree). Items are summed and averaged with high scores indicative of high levels of goals in math and science. A sample item is, “I am committed to study hard in my math courses.” The scale has been shown to correlate in expected directions with measures of math/science self-efficacy, outcome expectations, and interests and coefficient α for scale scores was .81 in prior research (Smith & Fouad, 1999). Coefficient α for scale scores in the present study was .85.
Math/science interests
The Math/Science Interest Scale (MSIS; Smith & Fouad, 1999) was used to measure participants’ level of interest in math/science activities. The MSIS includes 20 items rated on a Likert-type scale ranging from 1 (very strongly dislike) to 6 (very strongly like). Items are summed and averaged with high scores indicative of high levels of interest in math-/science-related activities. A sample item is, “watching a science program on TV.” A coefficient α of .95 has been reported for scale scores on the MSIS in a sample of high school students, and the scale has been shown to correlate in expectation directions with measures of math/science outcome expectations and investigative learning experiences in prior research (Garriott et al., 2014). Coefficient α for scale scores in the present study was .93.
Math/science self-efficacy
Self-efficacy in math/science domains was assessed with the Math and Science subscales of the Expanded Skills Confidence Inventory for High School Students (ESCI-HS; Betz & Wolfe, 2005). Each subscale consists of 8 items rated on a Likert-type scale ranging from 1 (no confidence) to 5 (complete confidence). A sample item is, “calculate a shooting percentage in basketball.” Items are summed and averaged with high scores indicative of high levels of self-efficacy in math and science. The Math and Science subscales have been shown to correlate in expected directions with self-efficacy scores for associated Holland themes (Betz & Wolfe, 2005). Internal consistency estimates ranging from .80 to .90 have been found for the Math and Science subscales (Betz & Wolfe, 2005). Coefficient αs of .91 were obtained for Math and Science subscale scores in the present study.
Social desirability
The Lie Scale of the Revised Children’s Manifest Anxiety Scale (Reynolds & Richmond, 1979) was used to assess social desirability. The scale consists of 9 items rated on a Likert-type scale ranging from 1 (not at all true) to 6 (very true). A sample item is, “I like everyone I know.” Items are summed and averaged with high scores indicative of high social desirability. The Lie Scale has been used in previous research as a measure of adolescents’ propensity to engage in socially desirable responding and has been found to correlate with existing measures of social desirability (Hagborg, 1991). Coefficient α for scores on the Lie Scale in the present study was .78.
STEM stereotypes
The 8-item preliminary version of the MASS developed in Study 1 was administered. Coefficient α for scores on the MASS in Study 2 was .93.
SOS
The SOS Scale (Wyer et al., 2010) was used to measure positive and negative attitudes toward scientists. The SOS consists of 22 items rated on a Likert-type scale ranging from 1 (strongly disagree) to 6 (strongly agree). A sample item is, “have unhappy marriages.” Items are summed and averaged with high scores indicative of strong positive or negative attitudes toward scientists. Positive worded items were reverse scored to provide a total score representative of negative attitudes toward scientists in the present study. The SOS has been shown to predict STEM major choice among undergraduate students (Ryder-Burge, 2011). Coefficient α for scores on the SOS in the present study was .87.
Data Analysis Plan
Structural equation modeling (SEM) using Mplus 7.2 (Muthén & Muthén, 1998–2012) was used to confirm the factor structure of the MASS and test fit of measurement and structural models. The comparative fit index (CFI), root mean square error of approximation (RMSEA), and standardized root mean residual (SRMR) were used to determine adequacy of model-to-data fit. Researchers have recommended values of CFI ≥ .95, RMSEA ≤ .06, and SRMR ≤ .08 as indicative of close model-to-data fit and values of CFI ≥ .90 and RMSEA ≤ .08 to represent adequate model fit (Kline, 2005).
For model tests, item parceling was used to create latent variables for unidimensional scales. This strategy was adopted, as item parceling has been found to better account for measurement error in structural models with unidimensional scales and creating latent variables with individual scale items has been shown to result in more biased parameter estimates compared to parceling procedures (Bandalos, 2002). First, EFAs using principle axis factoring and varimax rotation were performed on items for the MASS, interests, and goals scales. Scree plots and parallel analyses were examined to ensure unidimensional factor structures for each scale within the present sample (Little, Cunningham, Shahar, & Widaman, 2002).
After confirming assumptions regarding unidimensionality, items for each scale were grouped into parcels such that items with high-, medium-, and low-factor scores were balanced (Little et al., 2002). Three parcels were created for the MASS and goal variables, while four parcels were created for the interest variable. The Math and Science subscales of the ESCI-HS served as indicators for the math/science self-efficacy variable.
An a priori power analysis was conducted for Study 2 to determine the necessary sample size for SEM. The R code calculator developed by Preacher and Coffman (2006) for minimum sample size calculation in SEM was used to estimate sample sizes. An α level of .05; df of 20, 48, and 49 (for the confirmatory, measurement, and structural models); and power of .80 were used for these analyses. Effect size (ε) was based on the RMSEA statistic and was set at .08 to correspond with indices suggestive of adequate model-to-data fit (Kline, 2005). Minimum required sample sizes for ε based on the various degrees of freedom were 172 (df = 20), 101 (df = 48), and 100 (df = 49). Thus, the sample of 358 students in Study 2 was deemed sufficient for primary analyses.
Results and Discussion
Preliminary Analyses
Data screening
A total of 380 students returned surveys. The missing values analysis function of SPSS 22.0 was used to examine the pattern of missing data. There were 20 missing values of 2,640 possible values in 7 of 380 cases across the 7 variables of interest in the study. Percentage of missing values ranged from 0.3% on the interest variable to 1.6% on the social desirability scale. Results of Little’s MCAR test were not statistically significant, χ2 = 7.02, p = .983, indicating data were MCAR. Nine students did not report their gender and were excluded from future analyses. Thirteen participants were deemed to have excessive (20% of items missing on at least one scale) missing data on main study variables and were also removed from the data set, resulting in a final sample of 358. The full information maximum likelihood procedure has been shown to produce unbiased standard errors (SEs) when analyzing data with missing values and was used to account for missing data in SEM analyses (Schlomer et al., 2010).
Data were next assessed for multivariate normality. Mahalanobis distance (D 2) values were calculated using the parcels and subscales for SEM analyses. A recommended p value of .001 for the critical χ2 statistic, χ2(12) =32.909, was used to screen for multivariate outliers (Kline, 2005). Eight participants had D 2 values that exceeded the critical value of 32.909, and Mardia’s coefficient was 22.68, suggesting data did not meet assumptions of multivariate normality required for SEM analyses. Thus, robust maximum likelihood estimation was used to correct for multivariate nonnormality and Satorra-Bentler (S-B) chi-square values were calculated for all analyses. Individual variables met acceptable levels of skewness and kurtosis (i.e., |3|) as well as assumptions of linearity and homoscedasticity.
Primary Analyses
CFA
A CFA was first conducted to provide additional validity evidence for the MASS. The 8 MASS items were modeled to load onto a single latent factor. In support of Hypothesis 1, fit statistics for this model indicated good model-to-data fit, S-B χ2(20) = 12.07, p = .013; CFI = .975; RMSEA = .048 (90% confidence interval [CI] = [.022, .072]); SRMR = .034. All items significantly loaded onto the single latent factor, and factor loadings ranged from .71 to .89.
Correlations
Correlations among main study variables are presented in Table 2. The demographic variables of age, gender, race/ethnicity, and grade level were not significantly correlated with main study variables (p > .05). In support of Hypothesis 2, scores on the MASS were significantly correlated with scores on the SOS Scale (r = .21, p < .001) but were not significantly correlated with social desirability (r = −.03, p > .05).
Means, Standard Deviations, and Correlations Among Study 2 Variables.
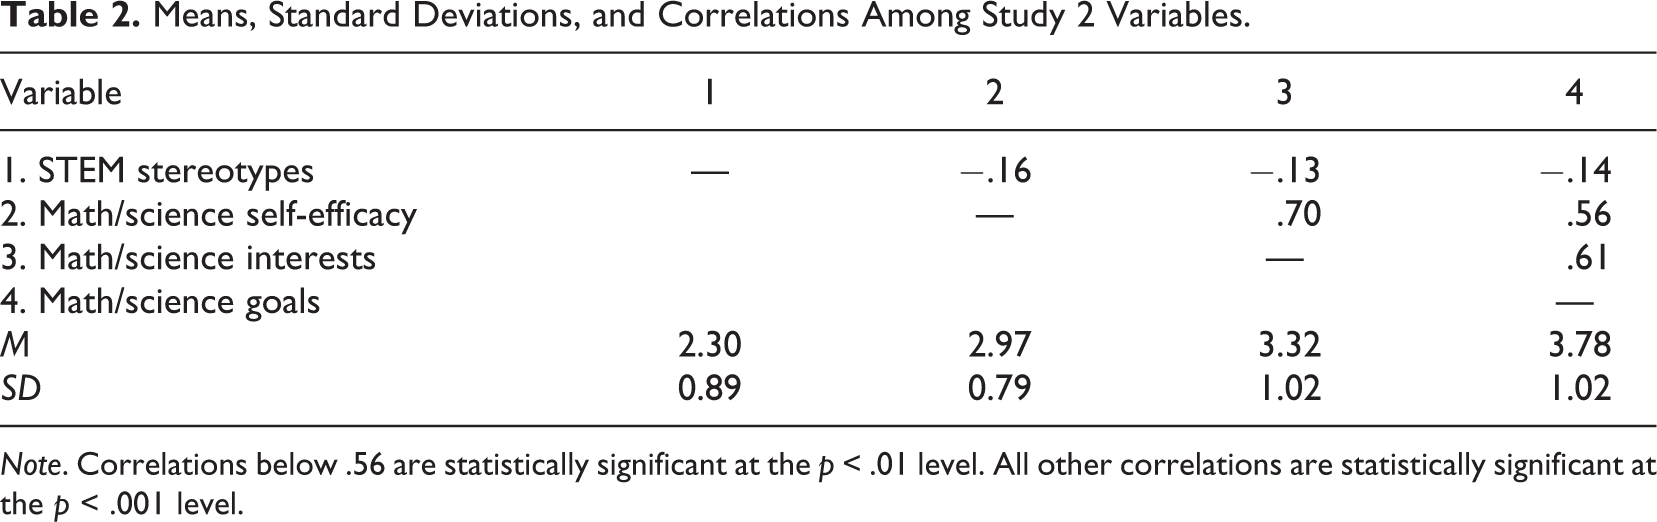
Note. Correlations below .56 are statistically significant at the p < .01 level. All other correlations are statistically significant at the p < .001 level.
Measurement model
Fit statistics for the measurement model indicated adequate model-to-data fit, S-B χ2(48) = 12.07, p = .013; CFI = .960; RMSEA = .077 (90% CI [.063, .090]); SRMR = .034. Furthermore, all indicators significantly loaded onto latent variables (see Table 3).
Means, Standard Deviations, and Factor Loadings of Observed Variables.

Note. All factor loadings are statistically significant at the p < .001 level.
Test of structural models
The hypothesized structural model fit across female and male participants provided an adequate fit to the data, S-B χ2(49) = 95.77, p < .001; CFI = .972; RMSEA = .062 (90% CI [.047, .091]); SRMR = .031. Contrary to hypotheses, several paths within this model were not statistically significant. Specifically, paths from STEM stereotypes to goals (β = −.06, p = .488), self-efficacy to goals (β = .69, p = .159), and interests to goals (β = .01, p = .546) were not significant. The strong, nonsignificant path from self-efficacy to goals, magnitude of the path between self-efficacy and interests (β = .92, p < .001), and large SEs for paths from self-efficacy and interests to goals (.44 and .45) suggested multicollinearity within the structural model (Grewal, Cote, & Baumgartner, 2004). Previous tests of SCCT in math and science with high school students have also supported a fully rather than partially mediated path from self-efficacy to goals through interests (Garriott et al., 2013). Therefore, the path between self-efficacy and goals was constrained (Marsh, Dowson, Pietsch, & Walker, 2004), resulting in adequate fit to the data, S-B χ2(50) = 97.49, p < .001; CFI = .971; RMSEA = .062 (90% CI [.048, .077]); SRMR = .036. The χ2 difference test for the original and trimmed structural models, ΔS-B χ2(1) = 1.72, p > .05, suggested differences in model fit were not significant. Because the model-to-data fit statistics were comparable, the alternative model was more parsimonious, and path estimates were more interpretable, the model without a path from self-efficacy to goals was accepted as the final structural model (Marsh et al., 2004). Within the final model (see Figure 1), STEM stereotypes significantly predicted self-efficacy, and self-efficacy significantly predicted interests. Furthermore, interests significantly predicted goals. The final model explained 78% of the variance in interests and 41% of the variance in goals.

The final structural model. Path coefficients represent standardized estimates. *p < .05. ***p < .001.
Mediation analyses
Bias-corrected bootstrap CIs were generated to test for indirect effects in the final structural model. A total of 1,000 bootstrap samples were generated and 95% CIs were examined to determine the statistical significance of mediation effects. CIs not including zero were deemed to be statistically significant at the p < .05 level (Mallinckrodt, Abraham, Wei, & Russell, 2006).
Results of mediation analyses showed that the indirect effect from STEM stereotypes to interests through self-efficacy was statistically significant (β = −.15, CI [−.328, −.039], p = .033). The indirect effect of STEM stereotypes on goals through self-efficacy and interests (β = −02, CI [−.316, .262], p = .87) was not statistically significant.
Hypotheses in Study 2 were largely supported. Results of a CFA confirmed the unidimensional factor structure of the MASS, scores on the MASS were correlated in expected directions with measures of social desirability and stereotypes of scientists, and a model with STEM stereotypes depicted as a proximal contextual barrier was an adequate fit to the data. While STEM stereotypes did significantly predict self-efficacy, they did not significantly predict goals. In partial support of Hypothesis 3A, self-efficacy explained the relationship between STEM stereotypes and interests, but not goals.
General Discussion
This study is the first to develop and test a measure of STEM stereotypes in a sample of high school students. In addition to providing initial psychometric data on a new instrument to measure STEM stereotypes, the present study suggests that the relationship between STEM stereotypes and interests may be explained by self-efficacy. The use of existing theory (i.e., SCCT) to examine these relationships may provide researchers with a useful framework for understanding how to assess and intervene in reducing STEM stereotypes.
Hypotheses in Study 1 were supported. A single factor best represented items developed for the MASS, resulting in 8-item scale and scores on the MASS correlated in expected directions with a measure of intrinsic motivation in math and science. This finding corroborates previous conceptual literature, suggesting that decreases in adolescents’ motivation in math and science are related to negative stereotypes of STEM (Anderegg, 2007). Motivation in math and science has been shown to decrease from middle to high school, and unlike general academic motivation, remains lower over time (Gottfried et al., 2001; Gottfried et al., 2007). Therefore, examining external forces that foster STEM stereotypes during this developmental period might be a useful area of future research. It is possible that greater exposure to media coupled with a desire to “fit in” leads to internalization of STEM stereotypes among high school students.
Hypotheses in Study 2 received mixed support. While the model specified according to SCCT predictions fit the data well and most paths in the final model were statistically significant, predictions related to STEM stereotypes and goals were not supported. These results suggest that STEM stereotypes primarily exert their influence on interests through self-efficacy and are weakly related to goals. Prior SCCT research has shown that proximal contextual barriers predict self-efficacy but not goals in math and science and that the relationship between barriers and self-efficacy is modest (Lent et al., 2001). Within our sample, score range restriction may have also attenuated the path coefficient between STEM stereotypes and self-efficacy. For high school students, interests may also be the more proximal and therefore, relevant career outcome variable when examining relationships among STEM stereotypes, interests, and goals.
Implications for Research and Practice
Results of the present study have several implications for future research and practice. As noted earlier, developmental shifts in intrinsic academic motivation and performance in math and science have been documented in the literature (Gottried et al., 2001; Gottried et al., 2007; NCES, 2012, 2013). Future longitudinal research should examine the role of STEM stereotypes in these academic trajectories, given these stereotypes may directly and indirectly hinder STEM-related self-efficacy and interests. Negative stereotypes of STEM professionals could also be investigated in high school students who have and have not received exposure to extracurricular programming in math and science. Specifically, STEM stereotypes could be examined as an explanatory variable in the impact of these programs on students’ self-efficacy and interests in math and science. Similarly, the effects of different pedagogical approaches to teaching math and science could be explored in relation to STEM stereotypes and interests. Given it is also possible that endorsement of STEM stereotypes is an artifact of decreased interest in STEM domains, future research might attempt to disentangle the relationship between these two variables.
Future research may also attempt to connect STEM stereotypes to other constructs within the SCCT framework. For example, outcome expectations were not assessed in this study due to our primary focus on capturing relationships between STEM stereotypes and more proximal variables in the model. However, future research may investigate whether STEM stereotypes relate indirectly to STEM-related outcome expectations through self-efficacy. Assessing indirect relations between STEM stereotypes and negative outcome expectations (Lee, Flores, Navarro, & Suh, 2015) may be particularly fruitful.
Our findings suggest that vocational psychologists and other helping professionals working with high school students should explore endorsement of STEM-related stereotypes. Individual academic and career planning with high school students might include assessment of a student’s perceptions of who occupies jobs in STEM. Attention to negative stereotypes of individuals in STEM might foster discussion of where these stereotypes were derived and interventions designed to combat negative stereotypes (i.e., informational interviews with individuals who may challenge these stereotypes). School administrators may benefit from assessing the climate around perceptions of students who are engaged in STEM-related school activities (e.g., math and science clubs, advanced placement math and science courses) to learn more about how negative STEM stereotypes may influence students’ interests in STEM careers within their specific school context.
Limitations
Although this study provides novel information on STEM stereotypes and high school students’ career development in math and science, several important limitations of our research should be noted. First, this study was cross sectional and thus did not capture causal or temporal associations between variables. Furthermore, students attending several different high schools were sampled. Although this may increase generalizability of our results, schools with specific cultures related to math and science education were not captured in this study. Given students were nested within high schools, multilevel modeling may have been an appropriate methodology. However, we did not gather information on high school attended in Study 1, which limited our ability to take this approach.
Similarly, participants in this study were almost exclusively prospective first-generation college students, and participants in Study 1 were participating in extracurricular programming to promote college attendance. These sample characteristics limit the generalizability of our results and indicate a need to also assess STEM stereotypes in students from more diverse educational and socioeconomic backgrounds. For example, participation in precollege programming may have influenced the ways in which participants in Study 1 viewed math and science education. Participants in Study 2 were also primarily in their first 2 years of high school. Although assessing STEM stereotypes at this developmental period is informative given motivation and performance in math and science appears to level off in earlier years of secondary school education (Gottried et al., 2001; Gottried et al., 2007; NCES, 2012, 2013), and these years are important precursors to future engagement in math and science (ACT, 2006), this study did not capture students in the 3rd or 4th years of high school. Thus, results of Study 2 are confined to high school students in their first 2 years of study and may not be generalizable to high school students more broadly.
Correspondingly, the sample for Study 2 was primarily Latina/o, which also has implications for generalizability of the findings. In particular, perceived characteristics of STEM professionals not captured by the MASS may have also been important within this population. For example, accurately perceiving that most STEM professionals are White could have similar or greater influence on math/science career goals for Latina/o students compared to the more general stereotypes captured in this study.
Despite these limitations, this research advances the study of how negative stereotypes of individuals in STEM may limit the entry of individuals into these careers. Results of this research may be used in the future to broaden participation of individuals in STEM and facilitate the math/science career development of those who might otherwise foreclose interest in an STEM career.
Footnotes
Declaration of Conflicting Interests
The author(s) declared no potential conflicts of interest with respect to the research, authorship, and/or publication of this article.
Funding
The author(s) received no financial support for the research, authorship, and/or publication of this article.