
Abstract
The affective nature of emojis makes them suited for anchoring scales to measure the affective preferences of vocational interest. In Study 1, we conducted a content analysis to identify the five images that best represent a bipolar continuum from strongly like to strongly dislike. In Study 2, we compared the psychometric properties of traditional lexical anchors to those of the emoji anchors identified in Study 1 and tested the predictive validity of emoji-anchored scales. Results show emoji-anchored scales possess similar psychometric properties as lexical-anchored scales. Importantly, the interest-fit using contextualized emoji scales predicts job satisfaction better compared to lexical scales (remoji (226) = .41 versus rlexical (226) = .13). Overall, this article (1) provides researchers with a validated public-domain emoji anchors, (2) demonstrates that emoji anchors possess the same the robust psychometric properties as lexical anchors, and (3) illustrates how emoji-anchored scales can be potentially better for measuring vocational interests.
Underlying an individual’s trait interest is an affective tone: a felt pleasantness or unpleasantness toward an activity when the person is engaged in or appraising an activity (Fryer, 1931; Strong, 1943). We define trait interests here as the “trait-like preferences to engage in activities, contexts in which activities occur” (Rounds & Su, 2014, p. 83). As such, the investigation of a person’s interest entails the measurement of their emotional response to a stimulus, that is, how much they feel if they were to do an activity (Frijda, 1993; Staats, Gross, Guay, & Carlson, 1973). This presence of an affective component of interest suggests that we can measure interest by replacing commonly used lexical anchors (e.g., “dislike,” “unsure,” and “like”) with a picture or icon that captures the same affective sentiment as the text label—that is, a nonverbal anchor. Such a replacement with nonverbal anchors is nontrivial, since measures that employ nonverbal anchors are better able to tap into the affective components of job attitudes such as satisfaction (Kaplan, Warren, Barsky, & Thoresen, 2009).
The evolution of technological communication has introduced a new visual component to the way we express emotions and consequently the exponential rise in emoji use. Most people, including older adults, believe that these graphic facial expressions enhance the expression of affect-laden attitudes (Evans, 2015a, 2015b; Tauch & Kanjo, 2016). As such, emojis may offer researchers and practitioners a way to better capture emotional reactions and affective preferences. We propose that using emojis as anchors in interest measurement instead of lexical anchors (“strongly like” to “strongly dislike”) provides a frame-of-reference (contextualizing) effect when measuring affective constructs. Consequently, survey items contextualized using emoji anchors can more accurately measure and predict affective variables.
The goals of this article are threefold. First, across two studies, we aim to empirically select and validate a set of public-domain emoji anchors. Second, we examine if the use of these emoji anchors comes at the cost of desired psychometric properties, for example, whether the emoji response format possesses similar reliability and profile consistency as the text format. Third, we investigate recent assertions that emojis are better at capturing emotional responses than text by evaluating their predictive validity in a vocational interest-fit framework. Overall, we examine whether incorporating emoji anchors in interest measurement improves the prediction of job satisfaction using interest congruence.
Emojis as Affective Indicators
Emojis are tools that enhance affect expression and comprehension. Specifically, emojis are ideograms, preceded by emoticons (e.g., “:-)”), used in electronic communication that symbolize an idea in a single simple image. They come in many varieties, but the most commonly used are those that resemble faces and depict detailed emotional expressions (Novak, Smailović, Sluban, & Mozetič, 2015). In Internet and text communication, people prefer to use emojis, rather than words, to express their emotions, affective preferences, or attitudes online (Emoji Research Team, 2016; Gibbs, Meese, Arnold, Nansen, & Carter, 2015). This is not exclusively for efficiency; users believe emojis can express emotions more accurately than words (Derks, Bos, & von Grumbkow, 2008). The field of electronic language expression is nascent with little peer-reviewed research. Much of the research has been undertaken by linguists who demonstrate that emojis function as units of language; specifically, emojis are paralinguistic cues essential for supporting language by providing nonverbal context, enhancing affective tone and expression (Evans, 2015b; Tauch & Kanjo, 2016).
Because emojis facilitate affective responses, we argue that emoji anchors enhance the measurement of affective constructs and improve subsequent prediction of affective variables by making the response scale more criterion relevant. Contextualized measures increase predictive validity because they provide schemas that guide participant responses in ways that are consistent with the criterion (Aronson & Reilly, 2006; Lievens, De Corte, & Schollaert, 2008; Shaffer & Postlethwaite, 2012). Frame-of-reference effects, for example, are observed when contextualized measures of personality ask participants to evaluate their expected behavior “at work,” leading to better predictions of work outcomes (Schmit, Ryan, Stierwalt, & Powell, 1995). When the researcher provides a guiding schema, participants are not forced to (a) imperfectly aggregate their tendencies across many contexts or (b) arbitrarily choose a context themselves. For emoji anchors, criterion relevance of items is improved not through increased emphasis on situation but through the emphasis on affect/emotion.
We propose that emojis can contextualize vocational interest scales such that participants respond specifically to the affective component of preferences for work activities. Interests are trait-like preferences to engage in activities that—like attitudes—can be decomposed into cognitive and affective components (Crites, Fabrigar, & Petty, 1994; Dawis, 2001; Fryer, 1930; Strong, 1943). The affective nature of interests makes them an ideal candidate for testing the utility of an emoji anchor response format. We note that such response formats are not expected to orthogonally parse affective and cognitive components, since it is difficult for people to independently evaluate emotions and cognitions. Instead, the choice of anchors in response formats provides a frame of reference that inclines respondents to use one type of evaluative process (feelings or thinking, Breckler & Wiggins, 1989; see Crites et al., 1994).
Changing the response scale anchors from text to emojis could affect the psychometric properties of the measure. As such, we sought to compare the psychometric properties between emojis and lexical response formats. Previous meta-analyses on contextualization research indicate the increase in predictive validity and does not come at the cost (or enhancement) of psychometric properties such as reliability (Shaffer & Postlethwaite, 2012). Thus, we expect the reliability, consistency, and structure between the two types of response formats to be similar.
Holland’s (1997) theory of vocational interests is founded on the idea that interests are not only affective preferences for tasks but that the congruence between those preferences and environmental characteristics (e.g., occupational tasks) will predict satisfaction. Empirical tests of the interest congruence–satisfaction relationship have yielded mixed results (Assouline & Meir, 1987; Tranberg, Slane, & Ekeberg, 1993; Tsabari, Tziner, & Meir, 2005). We hypothesize that one reason a stronger relationship between interest-fit and satisfaction is not observed is because measures of vocational interests have not been properly contextualized to capture their affective nature. Since job satisfaction contains an affective component (Judge, Hulin, & Dalal, 2012; Locke, 1969; Weiss, 2002), any measure of vocational interest that is contextualized to be more emotional inclined should have increased predictive validity. Importantly, there is some evidence that using pictorial anchors (e.g., Kunin, 1998) to measure dependent variables (e.g., job satisfaction) increases the relationship between satisfaction and affective variables compared to lexical scales (Fisher, 2000; Niklas & Dormann, 2005). This may be because facial expressions cue emotional recall, which causes people to evaluate their jobs in terms of emotional reactions (Fisher, 2000). We expect the same increase in predictive validity when vocational interests are affectively contextualized in an interest-fit model.
Overview of Studies
We conducted two studies to select and validate a set of emoji anchors for interest scales. To be useful, a set of emoji anchors needs to offer the same granularity and bipolar properties that we assume underlie Likert-type scales. That is, emojis must provide a set of facial expressions that are each distinct from one another yet holistically represent a bipolar continuum. The difficulty with placing affective anchors on a bipolar scale exists because emotions can be described in terms of two dimensions of a circumplex model (valence and arousal, indicating pleasantness and energy of the feeling, respectively, there are a variety of positive and negative emotions that could represent each pole; Feldman Barrett & Russell, 1998; Russell, 1980). It is also unclear whether emojis can unambiguously depict “strongly like” to “strongly dislike” such that each adjacent emoji captures a distinct degree of “liking” the stimuli. Fortunately, the pool of open-source emojis has recently grown quite large to be drawn upon for the construction of a bipolar continuum. We hypothesize that if participants choose from a large pool of open-source emojis, we will find a set of images that represents a continuous bipolar scale of affective responses. Further, it is important to select a set of open-source emoji anchors because these images are cost free and can legally be adapted for use in research and practice. In Study 1, we identified a set of five public-domain emoji collections that represent a bipolar continuum from “strongly dislike” to “strongly like.” In Study 2, we apply the selected emojis to a measure of vocational interests and compare the psychometric properties (reliability, consistency, and structure) of the emoji and lexical scales. Most importantly, we test whether the affective contextualization of interests when using emoji-anchored scales results in a stronger relationship between interest–job fit and job satisfaction.
Study 1
Methods
Participants
We recruited 56 participants enrolled in a career exploration course at a large mid-Western university. We excluded participants who were not from the United States for two reasons: First, we used scales consistent with Holland’s model of interests, which was developed and validated in the United States; second, culture may confound the relationship between emotion recognition and emoji interpretation (Markus & Kitayama, 1991; Park, Baek, & Cha, 2014). The final sample, after the exclusion criterion was applied, was 36 participants (56% female, Mage = 19.58yrs, SDage = 1.36) and was ethnically diverse (45% White; 19% Hispanic; 19% Black; 14% Asian). This sample size is typically deemed sufficient in studies examining content and substantive validities (see Anderson & Gerbing, 1991).
Procedure
The survey was conducted online and was embedded in a larger study that asked participants about their expected job satisfaction in various occupations (not reported here). Participants were asked to select and sort up to two emojis they thought best represented each of the five lexical anchors: strongly like, like, unsure, dislike, and strongly dislike. They repeated this process separately for each of the five emoji collections. Further information regarding the public-domain licensing and web sources of these emoji collections are provided in Appendix A. The order in which each emoji collection was presented and the order of emojis within each collection was randomized.
Analysis
To examine how each emoji corresponded to lexical anchors, we first computed two statistics. First, a percent chosen statistic: the usage of an emoji defined as the percentage of participants who chose a given emoji and sorted it into any of the lexical labels. This statistic quantifies whether an emoji corresponded to any of the five traditional lexical anchors. A higher percentage is favorable and suggests more participants thought an emoji expressed the sentiment of one or more lexical anchors. The second statistic is the percent used: the percentage a selected emoji was sorted into a single lexical anchor. A high percentage of participants sorting an emoji image to one lexical anchor and low percentages of sorting it into other categories are favorable—akin to discriminant validity.
Selecting a final set of emojis was done by evaluating four criteria. First, we required that the final set of emojis offered flexibility in licensing; ideally, the final set would allow not just public distribution but further adaptation of the images for public-domain use. Second, emojis needed high selection (percent chosen) for each image within the collection. Third, we required consistent categorization of each emoji into a single lexical anchor (percent used). Finally, the set of emojis needed to holistically represent a bipolar continuum, rather than five discrete emotions. This requires balancing two considerations: each emoji on the continuum must be visually distinct to ensure that participants interpret each anchor as a unique affective response to an activity but not so distinct that the bipolar continuum is not apparent.
Results and Discussion
The results for the five collections of emojis are displayed in Tables 1 –5. In the interest of space, each table displays the five emojis that had the highest percent chosen and percent used for each lexical label although each set contained between 12 and 15 images. Although U.S. students were used for the purposes of the analyses, we are quick to note that the pattern of results held with or without the inclusion of international students.
Emoji Collection 1 Results.

Note. Usage is the percentage of participants selecting the emoji from the larger pool; percent (usage based) is the percentage of people assigning a particular emoji to a given category (strongly dislike to strongly like); top five emojis from entire set are shown.
Emoji Collection 2 Results.

Note. Usage is the percentage of participants selecting the emoji from the larger pool; percent (usage based) is the percentage of people assigning a particular emoji to a given category (strongly dislike to strongly like); top five emojis from entire set are shown.
Emoji Collection 3 Results.

Note. Usage is the percentage of participants selecting the emoji from the larger pool; percent (usage based) is the percentage of people assigning an emoji to a given category (strongly dislike to strongly like); top five emojis from entire set are shown.
Emoji Collection 4 Results.
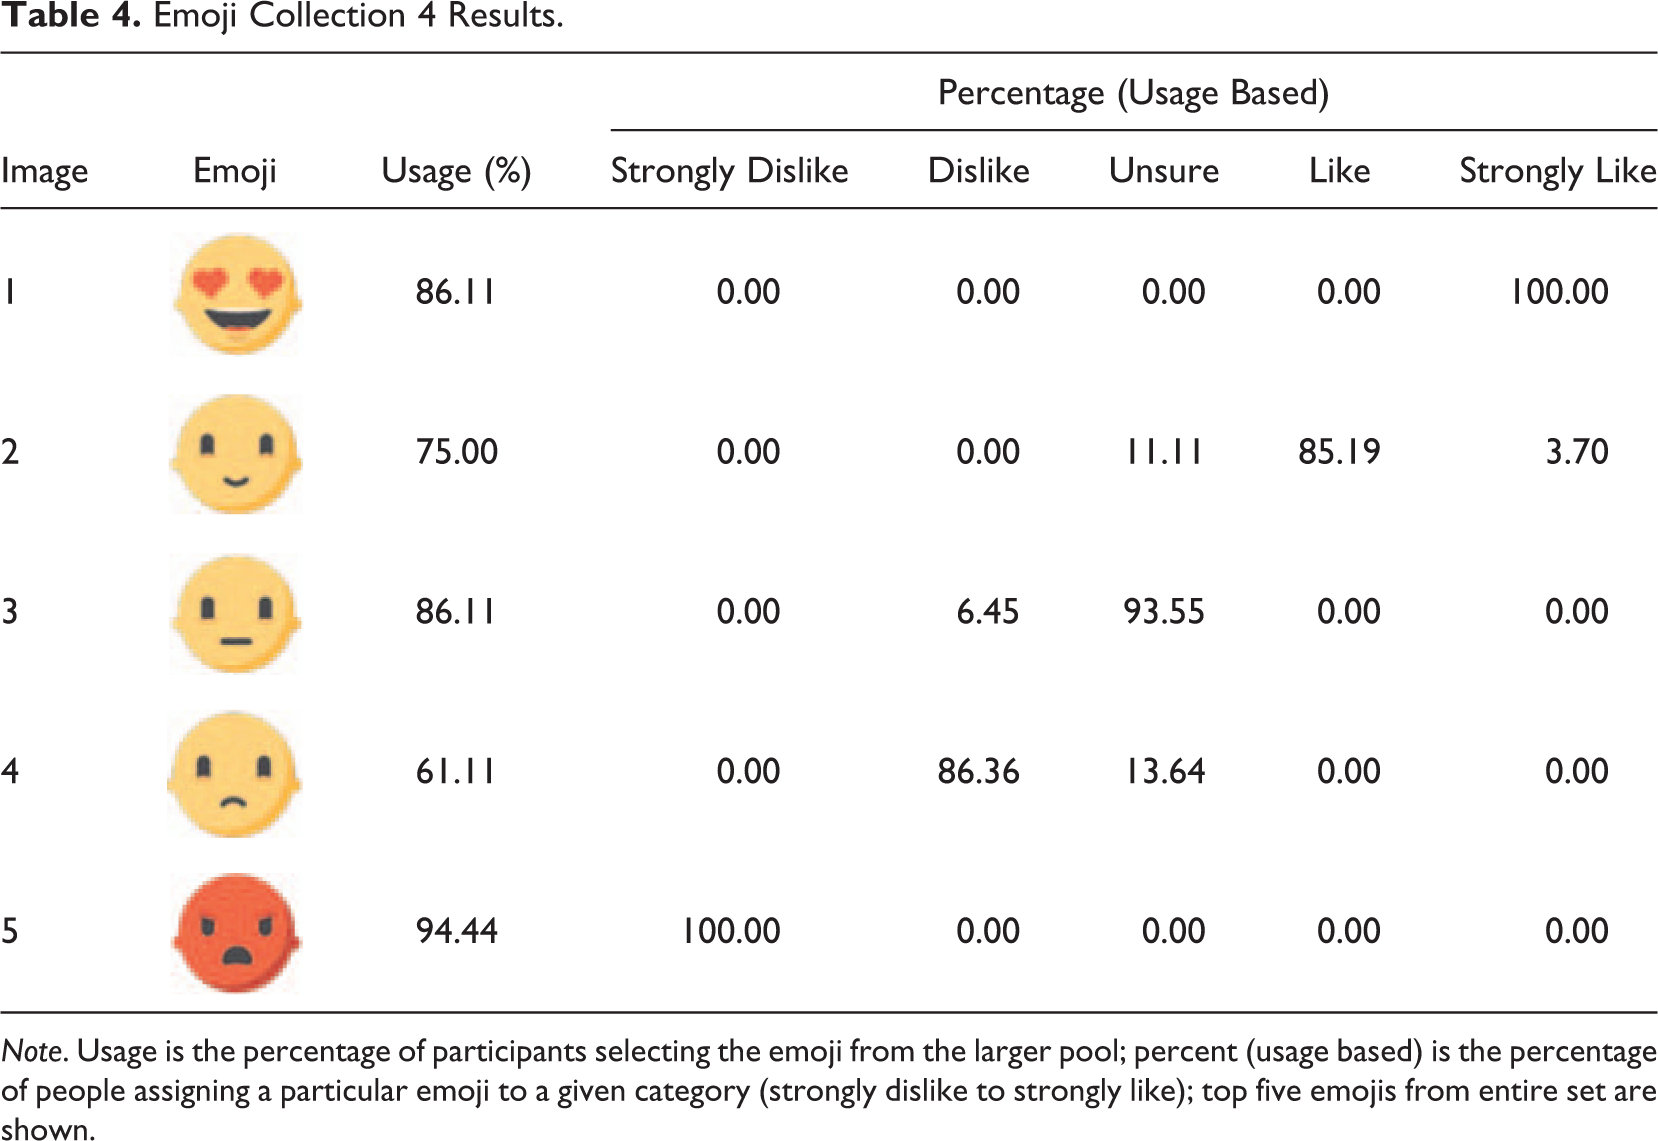
Note. Usage is the percentage of participants selecting the emoji from the larger pool; percent (usage based) is the percentage of people assigning a particular emoji to a given category (strongly dislike to strongly like); top five emojis from entire set are shown.
Emoji Collection 5 Results.

Note. Usage is the percentage of participants selecting the emoji from the larger pool; percent (usage based) is the percentage of people assigning a particular emoji to a given category (strongly dislike to strongly like); top five emojis from entire set are shown.
Collections 1 and 2 contained emojis sorted into multiple categories, suggesting ambiguity in interpretations. Collection 5 had relatively high consensus of emotion depicted for the emojis that were categorized, people were choosing different emojis from the pool to represent the scale points. Collection 4 had relatively high usage and chosen percentages but resulted in a set of emojis that varied in color (“strongly dislike” is red, while the other emojis are yellow). If an extreme anchor point is a different color than the rest, that could create response bias in which participants are either more attracted to or more avoidant of this emoji.
We determined that Collection 3 did the best creating a “strongly dislike” to “strongly like” scale. This set generally had a high chosen percentage and one of the least amount of ambiguity in categorization: For all the emojis selected, about 90% of participants reported them describing only one label. There were two emojis, however, that were frequently sorted into the “like” (emoji images 2 and 2*) and “strongly dislike” (emoji images 5 and 5*) categories. For completeness, all seven emojis are presented in Table 3. Although 2* and 5* had a slightly higher percent chosen, both sets (2 and 2* and 5 and 5*) showed reasonably high usage percentage and correct categorization. In line with selecting a set of emojis that represented an obvious bipolar continuum, it was necessary to ensure that emojis representing opposite poles (i.e., like and dislike) differed only in the affective expression displayed and not in other features irrelevant to emotion. Since the shape of the eyes and mouth in 2* are visually inconsistent with the single emoji selected for “like,” we determined that image 2 should be retained in favor of 2*. Having images 2 and 4 representing “like” and “dislike” creates a more symmetrical scale. In addition, it was important to select emojis that showed clear distinctions between adjacent images. Although 5* has slightly higher percent chosen than emoji 5, emoji 5 is much more distinct from emoji 4 (4 and 5 differ only slightly in the shape of the eyes). Unsurprisingly, emoji 5* has more double classifications than 5 (12% versus 5%). For these reasons, we retained 2 and 5. Using emojis 2 and 5 creates a bipolar scale while still maintaining clear distinctions between adjacent continuum points.
Overall, emojis from Collection 3 possessed qualities amenable for use as a public-domain emoji anchors: (a) most participants selected the same five emojis for each lexical label, (b) most participants classified these emojis to a single text description, (c) each adjacent emoji on the continuum was visually distinct, and (d) formed a symmetrical, bipolar continuum.
Study 2: Validation of Emoji Anchors
Study 2 examines the set of emoji anchors derived from Study 1 by applying the scale to an interest inventory and verifying that emoji-anchored scales maintain similar psychometric properties as lexical response-format scales, specifically: reliability, test–retest reliability, vocational interest profile consistency (profile similarity), and structural validity. We then test whether emoji-anchored scales are better at predicting job satisfaction from interest–job fit compared to the traditional lexically anchored scales.
Methods
Participants
We recruited 600 participants from Amazon’s Mechanical Turk because this platform has been shown to reliably replicate a number of key psychological findings as well as provide access to more diverse sample of participants (Behrend, Sharek, Meade, & Wiebe, 2011; Landers & Behrend, 2015). Recruitment was limited to participants with Internet protocol addresses based in the United States who were over the age of 18. Participants were asked to provide information about their occupation and employment status. To maximize honest responding regarding employment status and current occupation, we permitted anyone to participate in the study regardless of their employment status. Four hundred seventy nine participants provided job titles that could be identified in the Occupational Information Network (O*NET) taxonomy of jobs database (“O*NET Resource Center – Updating the O*NET-SOC Taxonomy: Incorporating the 2010 SOC Structure,” n.d.). For our purposes, the O*NET database (National Center for O*NET Development, n.d.) contains alternative job titles and work activities of all U.S. occupations that can be used to match participant’s job titles and descriptions to occupations. The sample was mostly male (55%) (Mage = 33.67 years, SDage = 9.95 years), mostly White/Caucasian (75%), employed an average of 38 hr per week, and most had completed at least some college (87%) with about half earning a bachelor’s degree (47%). Three quality control items and an instruction manipulation check were used to remove careless respondents (Oppenheimer, Meyvis, & Davidenko, 2009). Participants who failed at least one of the quality control items were excluded, resulting in a final sample size of 569 participants (452 of whom were employed). All 569 participants were included in the analyses of psychometric properties, and analyses for predictive validity were limited to the employed sample.
Procedure
Participants were randomly assigned to one of the four blocks. In each block, participants first completed an interest inventory (T1), followed by a distractor task, before completing the same interest inventory again (T2). The assigned blocks determined which anchor type (lexical or emoji) participants would use to respond. Block 1 used lexical anchors at both T1 and T2. Block 2 used emoji anchors at both T1 and T2. Block 3 used lexical anchors at T1 and emoji anchors at T2. Block 4 used emoji anchors at T1 and lexical anchors at T2. This design allowed us to compare scores for each anchor type for both between and within group while controlling for potential order effects (Blocks 3 and 4). Blocks 1 and 2 which administered only lexical or emoji anchors at both time points gave us a “baseline” for comparing the psychometric properties of interest inventories administered twice within a short time span. The distractor task asked participants to read an occupation description and to imagine working in the occupation. They then indicated how satisfied they would be working in the occupation.
Measures
Vocational interest
We measured participants’ trait interest using the public-domain O*NET Interest Profiler Short Form (Rounds, Su, Lewis, & Rivkin, 2010). This scale is based on Holland’s model of vocational interests consisting of six domains (Realistic, Investigative, Artistic, Social, Enterprising, and Conventional; the RIASEC). The scale consists of 60 items in which participants rated their preference for an activity either on a set of 5-point lexical labels (1 = strongly dislike, 2 = dislike, 3 = unsure, 4 = like, and 5 = strongly like) or using the emoji anchors developed from Study 1. An example investigative activity might be “develop a new medicine.” Participants taking the inventory in the lexical condition would indicate their preference to develop a new medicine by selecting the corresponding lexical label, while participants taking the inventory in the emoji condition would indicate their preference by selecting an emoji that best represented their preference toward developing a new medicine.
Job satisfaction
We measured job satisfaction using the abridged job in general scale which provides a list of eight adjectives (Russell et al., 2004). Participants rated on a 3-point scale (Yes, “?,” and No) whether the adjectives described their job in general. Responses were coded (Yes = 3, “?” = 1, and No = 0).
RIASEC environment
Participants reported their current job titles. To obtain more information about the job, respondents were also asked to provide a description of their work activities. Using both job titles and work descriptions, we obtained the environment RIASEC scores by matching participant information to corresponding job title listed on the O*NET (“O*NET Resource Center – Updating the O*NET-SOC Taxonomy: Incorporating the 2010 SOC Structure,” n.d.).
Interest congruence
Participants’ interest congruence (fit) was calculated using a Pearson profile correlation between their RIASEC interest scores and the RIASEC scores of their occupation (Rounds, Armstrong, Liao, Lewis, & Rivkin, 2008). The profile correlation accounts for the similarity of the two profiles by capturing the degree of mismatch (r = −1.00), no match (r = 0), and match (r = 1.00, see Kroustalis, Lewis, & Rivkin, 2010; McCloy, Campbell, Oswald, Lewis, & Rivkin, 1999). Compared to most other indices of congruence, the profile correlation is one of the most consistent indices of fit and importantly utilizes information across all six RIASEC domains (Rounds, Dawis, & Lofquist, 1987).
Study 2: Results
Psychometric Properties
Reliability
We examined the reliability for each interest inventory that was administered (two for each block) in two ways: (a) Cronbach’s α and (b) test–retest reliability. The descriptive and correlations are reported in Tables 6 and 7. Across all administrations of the interest inventory, the Cronbach’s α was high for all RIASEC subscales (α = .81–.94), indicating strong internal consistency regardless of the anchor used or the order of administration. Within each block, we examined the test–retest reliability using the correlation between an interest subscale’s score at T1 with the corresponding score at T2. The test–retest correlations for the RIASEC domains for each block are presented in Table 6. We used the correlations from Block 1 (lexical at T1 and T2) as a benchmark for comparing test–retest reliability. Comparing across blocks and RIASEC, we find high test–retest reliability ranging from rt1−t2 = .92 to .97; this suggests that regardless of the anchor type used, the respondents’ interest scores remain highly consistent. Thus, consistent with hypothesis 1a: emoji response formats are as reliability as lexical formats.
Means, Standard Deviations, and Test–retest Correlations for All Four Blocks.

Note. nblock1 = 149. nblock2 = 144. nblock3 = 143. nblock4 = 133, Mt1 = mean at time 1; Mt2 = mean at time 2; SDt1 = standard deviation at time 1; SDt2 = standard deviation at time 2.
Correlations and Reliabilities for All Four Blocks.

Note. nblock1 = 116–149. nblock2 = 122–144. nblock3 = 110–143. nblock4 = 104–133. Sample size differs because of missing data for employed versus non-employed participants. Correlations below the diagonal indicate relationships between Time 1 variables; correlations above the diagonal indicate relationships between Time 2 variables; RIASEC αs for Time 1 followed by Time 2 are indicated inside parentheses on the diagonal; test–retest correlation for profile correlations indicated inside parentheses; correlations > |.17| significant at p < .05 level.
Consistency (profile similarity)
To examine the rank order consistency of a person’s full profile, we calculated a profile correlation between a person’s RIASEC profile at T1 and T2, similar to how profiles between a person and occupation analyzed (Kroustalis et al., 2010). A higher correlation denotes greater rank order consistency between a person’s RIASEC profile at T1 and T2. Table 7 summarizes the profile correlations reliability for all blocks.
The profile correlation of Block 1 (lexical labeled anchors at T1 and T2) provided a baseline to benchmark the results from other blocks (r = .85). Respondents’ RIASEC profile correlations between T1 and T2 were comparable to the Block 1 benchmark, suggesting high rank order stability for all interest domains across blocks. Block 2 (emoji anchors at T1 and T2) had higher profile correlations than any other block (r = .93). Blocks 3 (r = .89) and 4 (r = .91) also had high profile correlations. Altogether, these results suggest that emoji anchors provide at least a similar level of rank order consistency across time when compared to lexical anchors.
Structural validity
We examined the interrelationships between the six RIASEC interest scales measured with different anchors. Given that the Interest Profiler was developed to measure Holland’s (1997) circumplex model of interest, there is an expected clockwise, circular ordering of the R-I-A-S-E-C domains. Testing the expected order is important for two reasons. First, the presence of such an ordering validates that Holland’s model of interest is indeed underlying the observed scores measured by a scale. Second, using interest as a predictor often requires person–environment fit indices that are heavily reliant on this expected ordering (Brown & Paul, 1994; Iachan, 1990). As such, we examined the circular ordering by both time and block, yielding eight separate structural analyses. We tested the RIASEC circular structure using the correspondence index (CI; Rounds, Tracey, & Hubert, 1992) and circular unidimensional scaling (CUS; Armstrong, Hubert, & Rounds, 2003; Hubert, Arabie, & Meulman, 1997).
Results from both statistical methods (Table 8) show that regardless of anchors used (lexical or emoji) and time (1 or 2) the expected ordering was confirmed. The CI showed that the observed RIASEC correlation matrices met orderings predicted by Holland’s model. Similarly, results from CUS analyses showed that the correlation matrices conformed to the expected quasi-circumplex ordering. For CUS, the variance accounted for (R2) serves as an indicator for how well the correlation matrices fit the quasi-circumplex ordering. A R2 of .60 or higher is expected for a sample from the United States and suggests excellent fit with the quasi-circumplex model (Armstrong et al., 2003). All correlation matrices examined had excellent fit to the quasi-circumplex, in support of Hypothesis 1b.
Correspondence Index and Circular Unidimensional Scaling.

Note. R2 in Circular Unidimensional Scaling (CUS) is for fitting the data to a quasi-circumplex model. CI = correspondence index. CI is a ratio of met and unmet predictions out of 72 possible RIASEC predictions (Rounds et al., 1992). All CI presented are significantly different from chance p < .05. Cutoffs for circular unidimensional scaling: good fit = .60, moderate fit = .44, and minimum = .36 (Armstrong et al., 2003).
Interest Congruence and Job Satisfaction
At Time 1, when participants were randomized into lexical anchor blocks, their interest congruence was significantly related to their job satisfaction, r(226) = .13, p = .048. Similarly, when participants were randomized into emoji anchor blocks, their interest congruence was significantly related to their job satisfaction, r(226) = .41, p < .01. Comparing the two effect sizes, we find that the interest congruence–job satisfaction correlation from the emoji scales were significantly higher than the correlation from lexical scales, independent Fisher’s Z = 3.22, p < .01. These results support Hypothesis 2 that anchors can be contextualized to better tap into the affective aspects of interest and that this will result in a stronger observed relationship with job satisfaction. We note that the correlation obtained using lexical anchors is similar to that observed in previous meta-analyses of congruence and job satisfaction, for example, rcorrected(k = 53) = .13 (U.S. sample; Tsabari et al., 2005) and rcorrected(k = 22) = .17 (Tranberg et al., 1993). In both meta-analyses, the 95% CI included zero.
To examine the within-group effect of response format, we ran two hierarchical regressions for response-format consistent blocks, for example, emojiT1 and emojiT2, and the mixed response-format blocks, for example, emoji–lexical (Table 9). Because the order in which emoji or lexical response formats was counterbalanced for the mixed response-format blocks, we included a dichotomous order variable to account for ordering effects (see Bing, Whanger, Davison, & VanHook, 2004). Interest congruence measured with emoji response format significantly predicted job satisfaction, after controlling for order effects and congruence scores measured with the lexical response format (β = .39, p < .001; ΔR2 = .03, p = .001; see Table 9). These results further support Hypothesis 2 because they show that after controlling for order of administration contextualizing interest using emojis improved predictive validity, beyond the traditional lexical response format. One caveat is that the two counterbalanced mixed blocks behaved differently from one another. Only the block using lexical anchors at Time 1 transitioning to emoji anchors at Time 2 demonstrated that emojis predicted job satisfaction better than lexical anchors; when emojis anchors were used at Time 1 and lexical were used at Time 2, there was no difference in the relationship between interest fit and job satisfaction.
Incremental Validity Analyses by Response-format Consistent and Mixed Blocks.

Note. nmixed-block = 214; nconsistent-block = 238.
*p < .05. ***p < .01.
Comparing the predictive validity within consistent blocks (e.g., emoji–emoji), there was no significant change between the first and second administration of the vocational interest scale. This suggests that the relationship between interest congruence and job satisfaction remained the same across both administrations of scales of the same response format.
General Discussion
As both researchers and practitioners increasingly conduct surveys online, there is a role for emojis in psychological research and applied settings. For researchers, emojis can be used as anchors in psychological measures to contextualize variables in terms of affective responses. To the extent that contextualization increases the criterion validity of measures, emojis can also help us clarify important affective workplace relationships. For practitioners, interests are one of the most widely used tools in career counseling (Savickas, Taber, & Spokane, 2002). The appeal of emojis and their ability to capture the zeitgeist mobile platforms interactions may possess considerable utility for engaging the core demographic career counseling users: youth.
Our results contribute theoretically and practically in four ways. First, we demonstrated how emoji anchors elucidate the theorized relationship between interest fit and satisfaction. Affective context is important in predicting job satisfaction from interest fit. By manipulating the anchor response format in a randomized four-block experimental design, we can better explain the variance in interest fit models. This provides support for using emoji-anchored scales as well as how differences in survey instrumentation when measuring individual difference can affect the observed predictor–criterion relationship (Lievens & Sackett, 2017). This relationship is at the core of vocational interest theory (Holland, 1997) yet historically has had mixed empirical evidence. The interest fit prediction of job satisfaction is possibly due to better matching of the affective nature of interests with the substantive affective component in job satisfaction (Dawis, 2001; Judge et al., 2012; Locke, 1969; Strong, 1943; Thoresen, Kaplan, Barsky, Warren, & de Chermont, 2003). This affective component matching principle can be observed in the stronger relationship between affective commitment with constructs that feature a substantial affective component, for example, job satisfaction, job involvement, and occupational commitment, in contrast to the smaller relationships observed with the more cognitive continuance commitment (Meyer, Stanley, Herscovitch, & Topolnytsky, 2002). Although lexical anchors using the anchors “like” can tap into affective evaluations in words, individuals potentially have an easier time focusing on affective response when they are presented visually (Kunin, 1998).
Second, we identified and validated a set of open-source emoji anchors that can be adapted for other psychological measures (available at: https://www.onetcenter.org/graphics.html?p=7). Third and relatedly, much previous contextualization effects have been demonstrated through narrowing the focus of instructions to specific situations, for example, work or school (Shaffer & Postlethwaite, 2012). We demonstrate another potential type of contextualization due to affective responding. Importantly, this type of contextualization using emoji response formats also displays the higher predictive validity typical of contextualized survey instruments.
Fourth, this investigation into alternate anchor types contributes to research on method factors (Lievens & Sackett, 2017; Sackett, Lievens, Van Iddekinge, & Kuncel, 2017). Previous studies examining such method factors have typically focused on other aspects of survey instrumentation such as the addition of tags to the end of survey items (Schmit et al., 1995) or survey instruction manipulation (Hunthausen, Truxillo, Bauer, & Hammer, 2003). We provide evidence consistent with previous discussions that anchor formats are source of method variance (Podsakoff, MacKenzie, Lee, & Podsakoff, 2003; Tourangeau, Rips, & Rasinski, 2000). Our results indicate that anchor formats should not only be considered as a relevant method factor but can enhance predictive validity of certain constructs. It would be advantageous for future researchers to be cognizant of and to assess anchor format effects.
Limitations and Future Direction
Because we adopted a bottom-up approach to finding these anchor points, there were not enough emojis in existing collections that together would be able to represent clear gradations of affect in more than 5-point scales. Some researchers have pointed out that more categories on a scale are linked to higher reliability, and 7-point scale may be superior in terms of reliability (Preston & Colman, 2000; Schutz & Rucker, 1975). In the case of the 5-point anchor in our study, however, we still observed scale reliabilities well into the acceptable range of α values (α = .81 to .94) for RIASEC interest scales (Lewis & Rivkin, 1999; Liao, Armstrong, & Rounds, 2008). Future attempts at utilizing emojis may extend our results by artificially modifying our emoji set to depict affect gradations for a 7-point scale. Relatedly, the present emoji set may not be applicable to agreement scales (“strongly agree” to “strongly disagree”). The current emoji set does depict a bipolar continuum from negative to positive valence. However, whether participants can perceive emojis anchors to represent agreement rather than affective preferences is an empirical question yet to be investigated.
In conclusion, we developed a set of emoji anchors that represent a bipolar continuum without sacrificing psychometric robustness. This research fills an important gap using response format to tap into the affective responses for an affect-laden construct (vocational interests). The present innovation in anchor formatting will be particularly useful as interest inventories specifically and surveys in general are increasing moved to mobile and web-based platforms to reach a wider audience.
Footnotes
Appendix A
Declaration of Conflicting Interests
The author(s) declared no potential conflicts of interest with respect to the research, authorship, and/or publication of this article.
Funding
The author(s) disclosed receipt of the following financial support for the research, authorship, and/or publication of this article: The authors (Jonathan Phan, Rachel Amrhein, and James Rounds) received payment and research funding to conduct Study 2 for the National Center for O*NET Development. All aspects of Study 2 were conducted by Jonathan Phan, Rachel Amrhein, and James Rounds. The National Center for O*NET Development had no more than an advisory role in the design, conduct, and reporting of Study 2. The views, opinions, and findings in this manuscript are not reflective of the views held by the funding agency.