
Abstract
The current study was aimed at understanding how social mobility relates to vocational outcomes. Drawing from Psychology of Working Theory (PWT), social mobility was operationalized as changes in experiences of economic constraints and marginalization between childhood and adulthood. We used latent profile analysis to create profiles among a sample of employed adults (N = 533) and compared profile membership to PWT informed outcomes: work volition, career adaptability, and decent work. The five profiles of social mobility that emerged were as follows: sustained privilege (low levels of marginalization and economic constraints during childhood and adulthood), downward mobility (low levels of marginalization and economic constraints in childhood, high levels in adulthood), upward mobility (high levels of marginalization and economic constraints in childhood, low levels in adulthood), highly marginalized (high levels of marginalization at both points), and sustained barriers (high levels of marginalization and economic constraints in childhood and adulthood). Participants who belonged to the sustained privilege and upward mobility groups experienced greater work volition and decent work compared to those in groups who experienced higher levels of economic constraints and marginalization throughout their lives. Implications for research and practice are discussed.
Introduction
The concept of social mobility within the United States (U.S.) is popular from both cultural and scholarly perspectives, though there is no absolute consensus on the definition of social mobility. Culturally, depictions of social mobility are omnipresent in television, movies, news, and books, often with the U.S. frame that upward social mobility is achievable. From a scholarly perspective, social mobility generally refers to changes in an individual’s status in the social and economic hierarchy over one’s lifespan, or between parents and children (Organization for Economic Co-operation and Development [OECD], 2018). Based on this operationalization, researchers have used objective socioeconomic (SES) indicators (e.g., Becchetti & Rossetti, 2009) to examine social mobility by comparing how people currently live with how they grew up and/or how their parents lived. Recently, scholars made attempts to measure changes in subjective social statuses (Kim et al., 2022) to reflect nuanced experiences of social mobility. Despite such efforts, social mobility may be a more complex concept than changes in SES and subjective social statuses. Specifically, the matrix of access to resources, power, and privilege determines social standing in society above and beyond social status (Liu, 2017; Wegener, 1991), encouraging researchers to create a novel way to measure social mobility.
Additionally, social mobility research has mostly focused on the relations between social mobility and physical and psychological well-being indicators. However, vocational psychologists have called for greater attention to understanding how social mobility relates to work outcomes because social mobility generates different discourses of vocational development (Liu & Ali, 2005; Liu, 2017; Wegener, 1991). Therefore, to operationalize social mobility in the intersection of wealth and power in social hierarchy and examine the relation between social mobility and vocational outcomes, we drew from Psychology of Working Theory (PWT; Duffy et al., 2016). This perspective proposes two contextual factors (lifetime experiences of economic constraints and marginalization) that shape individuals’ vocational development processes, such as work volition (i.e., one’s sense of career choice despite barriers) and career adaptability (i.e., one’s capacity to adapt to changes in the world of work), which in turn leads to the attainment of decent work (i.e., acceptable and aspirational employment; Duffy et al., 2016; International Labor Organization, 2012). Anchored in Psychology of Working Theory, we operationalized social mobility as changes in both income/wealth (economic constraints) and general standing in society (marginalization experiences) by assessing the degrees to which people experienced these constructs during childhood and as an adult. This way, we sought to assess social mobility associated with both subjective wealth and social standing and explore how social mobility relates to psychological processes and the access to decent work.
Social Mobility: Conceptualization and Scholarship
Social mobility is a challenging construct to be conceptualized and assessed, and it is mostly operationalized with objective and subjective indicators. For example, sociologists have operationalized social mobility as changes in objective socioeconomic (SES) indicators, such as changes in income, education, or occupational prestige (e.g., Becchetti & Rossetti, 2009), or categorized job or income statuses to show types of social mobility (e.g., Lee & Sun, 2020; Wegener, 1991; Wilson & Roscigno, 2010; Zhang et al., 2020). Although this approach is also common within social psychology (Destin, 2019; Kraus et al., 2019), using objective indicators might limit an understanding of more nuanced experiences of social mobility. For example, changes in people’s income may not reflect subjective social mobility based on different geographical locations and economic culture (Liu et al., 2004). Similarly, studies noted that gaining higher education does not necessarily promote upward social mobility in a competitive labor market (Das-Munshi et al., 2012; Mok, 2016). In this sense, measuring social mobility with SES indicators may limit identifying more subjective, nuanced, and context-dependent social mobility experiences. To address this issue, some scholars have suggested that using subjective measures would more accurately reflect the psychological experiences in social mobility (Liu, 2013; 2017). Liu and colleagues specifically proposed that social mobility could evoke psychological disequilibrium of social class worldviews, including socialization, behaviors, and lifestyles as well as degree of capital, power, and privilege (Liu, 2013; 2017). In this regard, the most common way to conceptualize social mobility is via subjective social class or social status, with mobility occurring if an individual moves higher or lower across time in either of these categories (Lee & Dean, 2004; Liu et al., 2004; Liu & Ali, 2005). Although empirical research on social mobility in psychology is limited, a handful of studies have assessed social mobility by measuring where people rank their current and childhood social status (Kim et al., 2022).
However, as noted previously, experiences of marginalization and privilege also play a role in shaping our social mobility experiences. For example, studies have found that people who achieved upward educational mobility continued to experience marginalization in their environments, such as dealing with a lack of cultural and social capital and facing classism despite securing some financial stability (Nelson et al., 2006; Rice et al., 2017; Stephens et al., 2012). Similarly, some people still experience marginalization even after they experience upward mobility in financial and career domains. Particularly, people with marginalized backgrounds, including people of color, women, and immigrants, tend to struggle with navigating middle/upper class spaces and face discrimination at work, which relegates them to a lower position in society (Carter, 2003; Li & Nicholson, 2021; Payne & Abbott, 2005). Therefore, social mobility likely manifests differently based on oppressive systems and consequent marginalization. In this regard, for the present study, measuring changes in levels of both subjective economic constraints and experiences of marginalization could provide more nuanced information regarding the intersection of resources and power associated with social mobility (Liu, 2017).
Social Mobility in Vocational Psychology
As noted previously, although research on social mobility in vocational psychology is limited, this work has identified several notable intrapersonal and systematic dynamics involved with social mobility in the world of work.
Downward Mobility and Vocational Development
Adults who experience downward mobility do so by evidencing a decrease in financial resources and/or a less privileged place in society. From a financial perspective, downwardly mobile people are more likely to report that their parents had manual labor or service occupations with low incomes, suggesting that downwardly mobile people might have experienced economic constraints in their childhood and experience intergenerational downward mobility (Huang & Sverke, 2007). From a marginalization perspective, experiencing forms of discrimination across one’s life may relate to downward mobility. For example, Black people in privileged fields tend to move down more often and faster than White people with similar qualifications in the same field (Wilson & Roscigno, 2010). Additionally, a study with women who experienced divorce-induced downward mobility demonstrated that they experienced difficulties in securing a job because they found the job market to be biased towards women with a long hiatus for childcare (Newman, 1986).
These structural barriers and economic constraints involved in downward mobility may lead to limited work volition and career adaptability in the vocational development process, which restricts people from securing decent work. In general, downwardly mobile people tend to experience academic distress, which hampers their vocational development processes (Diewald et al., 2015; Kim et al., 2022), possibly leading to more challenges long term in the world of work. Specifically from a marginalization perspective, downwardly mobile workers from marginalized backgrounds are more at risk due to their lack of financial resources and capital; therefore, they tend to attain less decent work and experience discriminative organizational practices (Eggenhofer-Rehart et al., 2018; Guo, 2013).
Upward Mobility and Vocational Development
Upwardly mobile people’s vocational development processes and their work experiences seemingly would juxtapose those who are downwardly mobile. However, previous studies have found that the relations between economic constraints and marginalization, intertwined with upward social mobility and occupational experiences, are more complex. For example, there have been mixed findings on upwardly mobile people’s job-seeking process. Specifically, some studies have shown that people who achieved upward mobility reported greater work volition and career adaptability with higher vocational aspirations (Moskal, 2020; Scandone, 2021). In contrast, others who seemingly achieved upward mobility still experienced marginalization and structural inequalities in their career development, observing that privileged groups have easier access to resources and capital for their career (Nelson et al., 2006; Scandone, 2021). This suggests that economic improvement through upward mobility does not guarantee changes or removal of marginalization.
Similarly, upwardly mobile people’s work experiences are also complex. Obviously, people who achieve upward mobility through occupational changes often secure financially decent work with benefits, resulting in greater job satisfaction and job involvement (Huang & Sverke, 2007; Moskal, 2020; Nelson et al., 2006). However, cultural and value mismatch between people’s previous backgrounds and their current status at work are also important to consider. For example, some upwardly mobile people report feeling isolated and alone identifying as a minority and comparing themselves with other people from higher social backgrounds at work, which may result in less safe working environments (Jayatilake et al., 2014; Nelson et al., 2006; Scandone, 2021). In addition, these groups often report emotional disconnection from their family of origin based on mismatched value and cultural systems at work (Cole & Omari, 2003; Nelson et al., 2006). Moreover, some upwardly mobile workers experience unfair evaluations and other forms of marginalization based on their marginalized identities (Jayatilake et al., 2014; Sánchez et al., 2011). Taken together, these studies highlight how social mobility may link to both positive and negative vocational outcomes. However, the vast majority of these studies used individual indicators of mobility, often social status, income, or educational attainment. Additionally, none of these studies used a PWT frame or examined how social mobility directly relates to key PWT constructs, in particular access to decent work.
Theoretical Framework
As noted previously, Psychology of Working Theory (PWT; Duffy et al., 2016) may be especially useful in examining social mobility from a multifaceted perspective. Psychology of working theory is primarily focused on predictors and outcomes of decent work attainment. In the PWT model, decent work is conceptualized as work that meets minimum thresholds for human rights across five criteria: safe working conditions, access to healthcare, adequate compensation, allowing for free time and rest, and having values that match family and societal values. Duffy et al. (2016) proposed that when people secure decent work, this will lead to need satisfaction which in turn will result in increased work fulfillment and general well-being. In the current study, we were most interested in predictors of decent work, including lifetime experiences of economic constraints and marginalization to operationalize a multidimensional construct of social mobility. Specifically, PWT proposes that the more individuals experience economic constraints and marginalization across their lifetimes, the less likely they will be able to access decent work. These structural factors are believed to connect to decent work via work volition and career adaptability.
Psychology of working theory views economic constraints and marginalization experiences as distinct, but related constructs that researchers should consider as a set of contextual factors. Consistently, most studies using a PWT framework have found them moderately correlated (Duffy et al., 2021; England et al., 2020; Kim et al., 2021). The theory initially conceptualized the constructs as capturing lifetime experiences. We contend that social mobility doesn’t just apply to one’s social status, income, or wealth, but the degree to which one feels they are in a more or less powerful position in society based on their group membership or identities. Therefore, it is important to attend to both economic constraints and marginalization experiences to capture social mobility in a more holistic fashion, noting that across time mobility may happen in one, the other, both, or neither.
Present Study
In the present study, we adopted instruments of economic constraints and marginalization which assessed these across the lifespan to assess participants’ experiences of these separately as children (prior to the age of 18) and as adults (18 years and older). We then used latent profile analysis to group participants in terms of social mobility across these four different indicators. This approach was chosen as it allows for distinct groups to emerge from scores on combinations of several variables, which was important as in the current study we were interested in several possible types of mobilty. After groups were constructed, we compared how group membership related to the other three variables in the predictor portion of the PWT model: work volition, career adaptability, and decent work. We were particularly interested in examining a) the degree of social mobility from childhood to adulthood among these indicators and b) differences amongst the work-related outcome variables for participants who were socially mobile in either direction.
Method
Participants
Our sample was composed of 533 working adults living in the United States (Average age = 43.23, SD = 14.54). Within our sample, the majority (415, 77.9%) identified as women, followed by men (90, 16.9%), genderqueer (5, <1%), transgender men 3, <1%), transgender women (1, <1%), and 17 participants (1.71%) selected “other” or “gender identity not listed.” The racial and ethnic identification of study participants was as follows: African/African-American/Black (n = 24, 4.5%), American Indian/Native American/First Nation (n = 7, 1.3%), Arab American/Middle Eastern (n = 5, <1%), Asian/Asian American (n = 19, 3.6%), Asian Indian (n = 1, <1%), Hispanic/Latina/o American (n = 19, 3.6%), Pacific Islander (n = 1, <1%), White/European American/Caucasian (n = 471, 88.4%), Multiracial (n = 13, 2.4%), and Other (n = 5, <1%). In terms of education, 230 participants (43.2%) held a college degree, 192 (36%) had a professional degree, 76 (14.3%) had some college experience, 19 (3.6%) attended trade/vocational school, and 14 (2.6%) graduated from high school.
Regarding average yearly household income, 46 (8.6%) participants reported having an average yearly household income of less than $25,000 per year, 134 (25.1%) participants reported having an average yearly household income between $25,000 and $50,000, 187 (35.1%) participants reported having an average yearly household income between $51,000 and $75,000, and 161 (30.2%) participants reported having an average yearly household income between $76,000 and $100,000. Finally, all survey respondents were employed at the time of the study, 73.9% (n = 394) were employed full-time, 18.9% (n = 101) were employed part-time, 2.6% (n = 14) were self-employed full-time, and 4.5% (n = 24) were self-employed part-time.
Instruments
For economic constraints and marginalization experiences, participants were asked to respond once reflecting on their childhood experiences, defined here as being under 18 years old, and a second time considering their adulthood experiences, defined here as being 18 years or older. For all other measures, participants were asked to reflect on their feelings in the present.
Economic Constraints
To determine participants’ experiences with economic constraints throughout their lives, we used the five-item Economic Constraints Scale (ECS; Duffy et al., 2019). Participants responded using a seven-point scale ranging from strongly disagree to strongly agree. Sample items include, “During the majority of my childhood, I had very limited economic or financial resources” and “For the majority of my adulthood, I have not felt financially stable.” Kim et al. (2021) and Autin et al. (2021), among other researchers, have used this scale in studies drawing from PWT and have demonstrated correlations with work volition and decent work. Consistent with numerous studies including working adults, our study showed strong estimated internal consistency reliability of scale scores for childhood (α = .97) and adulthood (α = .95) economic constraints.
Experiences of Marginalization
In line with previous studies grounded in PWT, we used the Lifetime Marginalization Experiences Scale (LEMS; Duffy et al., 2019) to assess participants’ past and present marginalization experiences. Participants were asked to respond using a seven-point scale ranging from 1 (Strongly disagree) to 7 (Strongly agree). The three items included, “I felt marginalized within various community settings during the majority of my childhood,” “During the majority of my childhood, I had many interpersonal interactions that have often left me feeling marginalized,” and “Throughout the majority of my adulthood, I had many experiences that have made me feel marginalized.” Prior to answering this scale, participants were presented with the following passage: We are interested in the degree to which you consider yourself to be marginalized in the United States. By marginalized, we mean being in a less powerful position in society, being socially excluded, and/or having less access to resources because you are a member of a specific group, have a specific identity, or life history. This often occurs due to one’s gender, race/ethnicity, sexual orientation, disability status, religious beliefs, physical appearance, or being a part of other minority groups/identities. With this definition in mind, please respond to the following items below considering the experiences you have had during your childhood/adulthood.
Previous studies have used this scale to assess marginalization experiences among racially and ethnically diverse working adults in the U.S. and employed women. These studies have demonstrated linkages with economic constraints, work volition, and decent work (Douglass et al., 2020; England et al., 2020). The estimated internal consistency reliability of scale scores in this study was .97 and .96 for childhood and adulthood marginalization experiences, respectively.
Work Volition
Previous research supports the use of the four-item Volition subscale of the Work Volition Scale (WVS; Duffy et al., 2012) to understand participants’ attitudes about their sense of choice regarding their career decision making (Douglass et al., 2017; Tokar & Kaut, 2018). Participants answered items on a seven-point scale ranging from 1 = Strongly Disagree to 7 = Strongly Agree. Example items include, “I’ve been able to choose the jobs I have wanted” and “I feel able to change jobs if I want to.” This scale has been validated among unemployed adults, undergraduate students, and U.S. veterans and scores have been moderately to strongly correlated with indicators of decent work (Bouchard & Nauta, 2018; Douglass et al., 2017; Duffy et al., 2013, 2015; Smith et al., 2020). The estimated internal consistency reliability of scale scores in the current study was .88.
Career Adaptability
We used the three-item career adaptability subscale from the Career Future Inventory Short Form (McIlveen et al., 2013) to capture the extent to which participants felt they were equipped to adjust to changes in their work. Participants were asked to respond using a 7-point scale ranging from 1 (Strongly disagree) to 7 (Strongly agree). The items used in the current study were, “I can adapt to change in my career plans,” “I can adapt to change in the world of work,” and “I will adjust easily to shifting demands at work.” In the instrument development study, scale scores were found to evidence strong internal consistency reliability and correlate in the expected direction with self-efficacy and career choice satisfaction. In the current study, the estimate internal consistency reliability of scale scores was .82.
Decent Work
To measure attainment of decent work among the sample, we used the Decent Work Scale (DWS; Duffy et al., 2017). The DWS is composed of five subscales and respondents were asked to answer items using a 7-point Likert scale ranging from 1 (Strongly disagree) to 7 (Strongly agree). Example items include, “I feel emotionally safe interacting with people at work,” “I am properly paid for my work,” and “My organization’s values align with my family values.” In the instrument development study, scale scores were found to evidence good internal consistency reliability at the subscale and total scale level and correlate in the expected direction with indicators of work related well-being. In the current study, the estimated internal consistency reliability for the subscale scores was as follows: interpersonally and physically safe working environments (α = .81), hours that allow for free time and rest (α = .95), adequate compensation (α = .95), organizational values complement family and social values (α = .93), access to health care (α = .98). Additionally, the estimated internal consistency reliability of the total scale scores was .89.
Procedure
After receiving approval from the first author’s Institutional Review Board, data were collected using ResearchMatch (Harris et al., 2012) to recruit participants for this study. ResearchMatch is an online data collection platform that has over 150,000 volunteers who are willing to participate in studies and over 1000 studies have been published using data collected via this platform. Researchers are given access to conduct studies with participants if their institution has a membership to the service. To participate, potential respondents had to meet three criteria: be 18 years old or older, be employed (full time or part time), and live in the United States. Once volunteers expressed interest in the study, they received the link to complete the survey on Qualtrics. After providing consent to participate, they were presented with a demographic questionnaire and were then asked to complete a 10-minute survey.
ResearchMatch relies on volunteers to participate in research studies, which has unique implications. For example, volunteers may be more interested in the study than the general population and researchers are not able to monitor participants live, which may make it difficult for researchers to remove faulty responses (Baruch et al., 2016; Smith et al., 2016). In order to combat some of these concerns, we included several validity checks throughout the survey. These included three questions asking participants to select a particular survey option and one question at the end asking participants if they took the survey seriously. Using an online data collection platform, like ResearchMatch, has many benefits and has provided quality data in previous PWT studies (England et al., 2020; Kim et al., 2021). Namely, it allows for a more diverse sample in terms of participants’ identities and economic background as well as increases the accessibility of research, allows for faster data collection, and reduces costs for researchers (Casler et al., 2013; Paolacci & Chandler, 2014; Rouse, 2020).
An initial group of 760 participants completed the survey. Of this group, 56 were removed due to failing one of the four validity and quality control check items in the survey. From this remaining group, another 62 were removed due to not being employed either full time or part time. Finally, we restricted our analysis sample to those whose household income was less than $100,000 per year. This was instituted to account for the negative income skew that often exists in terms of the income of participants who take online surveys, particularly on ResearchMatch. As such, we removed 109 additional participants. This resulted in a final group of 533 participants. Missing data is discussed in the following section.
Results
Preliminary Analyses
Descriptive Statistics and Correlations of LPA Indicators and Study Variables.

Note: All correlations significant at Bonferroni corrected p = .0024 level except *.
LPA of Social Mobility Groups
Latent profile analysis (LPA) was used to explore the naturally occurring profiles of social mobility groups on MPlus 8.0. LPA is an exploratory person-centered approach that is used to identify the latent subpopulation within a larger population based on variables (i.e., LPA indicators) set by the researcher (Collins & Lanza, 2009). LPA identifies latent subpopulations or groups that have varying degrees of indicators which is expressed as profiles. A stepwise approach is used to find the appropriate number of profiles in the data; LPA is run on a 2-profile model and sequentially ran on models with one more profile added (e.g., 3-profile, 4-profile; Nylund et al., 2007). To determine the number of profiles, both quantitative and qualitative criteria are assessed (Nylund et al., 2007). The quantitative criteria included entropy (Celeux & Soromenho, 1996), the Akaike information criterion (AIC; Akaike, 1987), the Bayesian information criterion (BIC; Schwarz, 1978), the bootstrapped likelihood-ratio test (BLRT; McLachlan & Peel, 2000) and adjusted LMR (Adjusted Lo-Mendell-Rubin test; Lo et al., 2001). For AIC and BIC, models with lower values indicate a better fit. For entropy, higher values indicate a better fit with the value of 1 being perfect classification; generally, values between .60 and .80 are appropriate (Jung & Wickrama, 2008). For BLRT or adjusted LMR, a non-significant (p > .05) result indicates that the model is not a better fit than the model with one less profile. The quantitative criteria were first used as a guide; and as there are no standards on how many profiles are to be examined in LPA, we ran the model with an additional profile until the addition no longer improved the quantitative criteria. The profiles generated were then analyzed using qualitative criteria (interpretability, theoretical coherence, parsimony, discrimination, and profile size) among the authors to determine the final profile model.
Comparison of Models in Latent Profile Analyses.
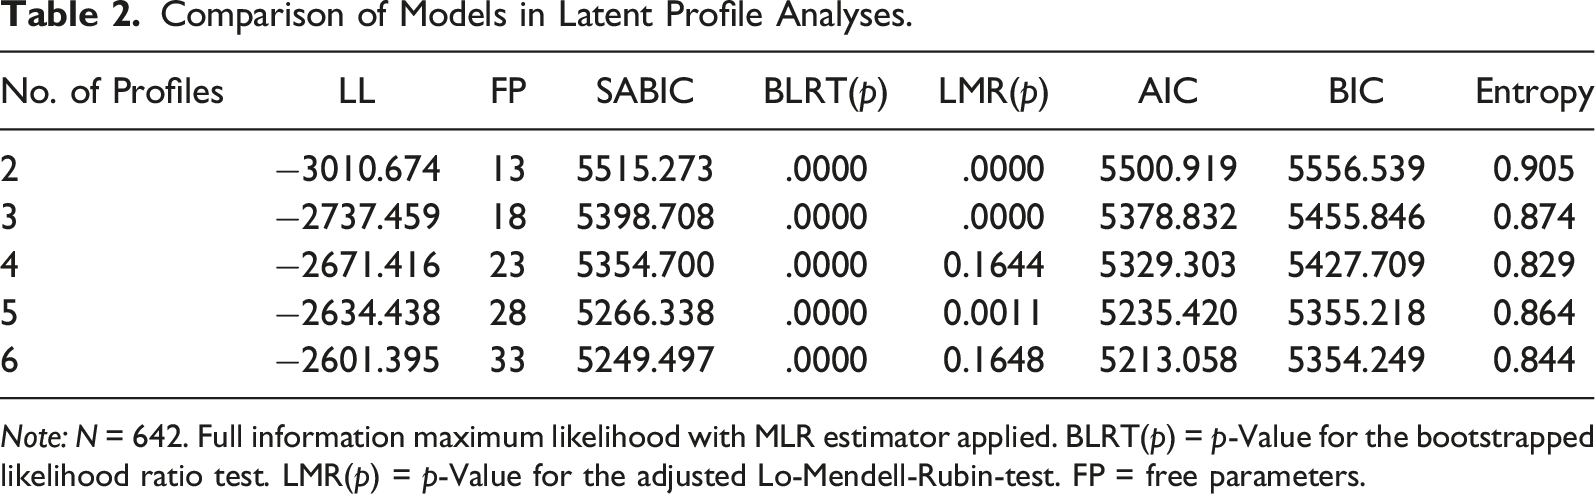
Note: N = 642. Full information maximum likelihood with MLR estimator applied. BLRT(p) = p-Value for the bootstrapped likelihood ratio test. LMR(p) = p-Value for the adjusted Lo-Mendell-Rubin-test. FP = free parameters.
The 5-profile model identified with quantitative criteria also met qualitative criteria including interpretability, theoretical coherence, parsimony, discrimination, and profile size. The final profile model selected is presented in Figure 1. The first group identified participants who had low values on all the indicators at both time points (n = 184, 34.65%) and was named sustained privilege group. The second group identified had low values on childhood indicators and high values on adulthood indicators (n = 66, 12.43%) and was named the downward mobility group. The third group identified had high values on childhood indicators and low values on adulthood indicators (n = 54, 10.17%) and was named the upward mobility group. The fourth group identified had high values on marginalization at both times points with relatively average levels of economic constraints (n = 127, 23.92%) and was named the highly marginalized group. Finally, the fifth group identified had high values on all indicators (n = 100, 18.83%) and was named the sustained barriers group. Social mobility profiles. Note. EC = economic constraints; M = marginalization experiences. Descriptive Statistics of Study Variables for Each Profile Group and the Post-hoc Statistics. Note: All post hocs for continuous variables are significant at p < .05 with Bonferonni correction. e.g., those with profile 1 had significantly higher work volition than those with profile 4 and 5. 1 = sustained privilege, 2 = downward mobility, 3 = upward mobility, 4 = highly marginalized, 5 = sustained barriers.

Group Differences
To compare the group differences, Kruskal-Wallis tests were conducted using SPSS 25.0 and the results are provided in Table 2. The profile group differences among outcome variables were analyzed using the Kruskal-Wallis test (Kruskal & Wallis, 1952), a nonparametric test as the outcome variables did not meet the assumptions for linear regression. Based on the results presented in Table 3, the omnibus effect of profile group on work volition, χ2(4) = 43.02, p < .001, and decent work was significant, χ2(4) = 40.46, p < .001, but not on career adaptability, χ2(4) = 6.27, p = .18. The eta squared was calculated using η2 = H/(N-1): 1) for work volition η2 = 43.02/(529–1) = 0.08, indicating a medium to large effect, and 2) for decent work η2 = 40.46/(522–1) = 0.08, indicating a medium to large effect.
Further decomposition of the results using Bonferroni adjusted pairwise comparison results indicated that for work volition, participants in the sustained privilege group (M = 19.67, SD = 5.73) and upward mobility group (M = 20.55, SD = 5.42) had significantly higher work volition than the sustained barriers group (M = 14.91, SD = 7.23) and the highly marginalized group (M = 17.01, SD = 6.22). For decent work, similarly, participants in the sustained privilege group (M = 80.05, SD = 16.06) had significantly higher decent work than those in the highly marginalized group (M = 71.55, SD = 17.23) and sustained barriers group (M = 66.40, SD = 19.66). Those in the upward mobility group (M = 78.33, SD = 14.77) also had higher decent work than those in the sustained barriers group.
Discussion
In the current study, we sampled a group of employed adults assessing the degree to which they experienced economic constraints and marginalization in childhood (before the age of 18) and adulthood (after 18). We used this data to construct profiles of social mobility that moved beyond merely assessing income or social status but captured mobility as a multidimensional construct comprised of experiences with one’s financial status and sense of general standing in society in both childhood and adulthood. We then examined differences in the three other predictor variables within Psychology of Working Theory (PWT; work volition, career adaptability decent work) according to profile membership. In the following sections, we discuss key findings around the construction and composition of profile groups and how group membership related to core PWT constructs.
Profile Construction and Composition
This is the first study we are aware of which has used LPA to examine social mobility groups with several different metrics. As such, the profile composition in and of itself is important to discuss. In the current study, a five-profile solution provided the best fit to the data and allowed us to examine differences amongst five fairly distinct groups. Given the exploratory nature of the study, we did not have any apriori hypotheses, but nevertheless the group compositions which emerged seemed intuitive. Namely, distinct groups emerged where individuals were privileged or faced high levels of barriers in both childhood and adulthood, were upwardly or downwardly mobile, and only faced high levels of marginalization at both time points. Importantly, over 75% of our sample had no social mobility - maintaining the same levels of economic constraints and marginalization in both childhood and adulthood. Those who were mobile were relatively split between upward (∼10%) and downward (∼12%) mobility.
It is useful to compare these numbers to other studies on social mobility, albeit using different variables to capture the construct. For example, in one the of largest U.S. population studies looking at economic mobility, the 2012 Pew Economic Mobility Project found that over 80% of individuals evidenced no mobility compared to their parents’ income, especially around the ends of the mobility spectrum, either remaining in the bottom or top quintile in terms of income. Other recent large-scale studies have demonstrated that economic mobility has become less prevalent in society over time (Chetty et al., 2016). However, none of these studies focused on individual’s experiences of marginalization. With that caveat in mind, our findings closely mirror these prior studies – suggesting that mobility in either direction is less likely than stability.
Another key finding that emerged which deserves discussion is the almost quarter of participants in our study who evidenced higher levels of marginalization and average levels of economic constraints at both time points. For the four other profile groups, economic constraints and marginalization experiences grouped together, which was not the case for this group. On the one hand, this demonstrates how intertwined these two structural factors tend to be for most people. However, on the other hand, we believe this finding showcases the critical importance of assessing mobility not only in terms of income or economic standing, but also in terms of the degree to which one feels marginalized in society. By only assessing economic constraints, it might appear that participants in this group are middle class. However, this would not account for the undocumented experiences of feeling consistently marginalized in childhood and adulthood, which is essential in understanding someone’s overall sense of social standing. We argue that the emergence of this profile group in particular makes the case for assessing both markers of income/wealth and experiences of marginalization based on one’s identity as indicators of social mobility. Additionally, we posit social mobility can extend the PWT model by drawing attention to potential bidirectional effects among the theory’s constructs.
Profile Differences
We examined group differences amongst the five profiles according to the three other variables in the predictor portion of the PWT model. Omnibus effects tests revealed significant group differences with work volition and decent work, but not career adaptability. This finding adds to a growing group of studies (Douglass et al., 2017; Duffy et al., 2018) which has shown that indicators of economic constraints and marginalization are often unrelated to career adaptability, suggesting that perhaps its fit in the model – as connected to structural factors and as a mediator between structural factors and decent work – needs to be reconsidered.
The group differences between work volition and decent work are important to consider. First focusing on significant differences, participants in the sustained privilege group and upward mobility group evidenced higher levels of work volition than the sustained barriers group and high marginalization group; each group also evidenced higher scores on decent work compared to the sustained barriers group, but only those in the sustained privilege group differed from the high marginalization group. These findings map onto research from PWT as well as other research on social mobility and career outcomes (Hu et al., 2020; Rapa et al., 2018). Individuals with less experiences of economic constraints and marginalization tend to be more likely to feel choice in their career decision making and have access to decent work.
Second, and perhaps more novel, are the non-significant findings. The data suggest that participants in the sustained privilege group and the upwardly mobile group look nearly identical in terms of vocational outcomes when compared to less privileged groups. Although approximately only 10% of participants achieved upward mobility, our findings suggest that those who experience more privilege as adults – even if this wasn’t experienced during childhood – are just as likely to have more feelings of choice and access to decent jobs as those who have experienced privilege across the lifespan. However, it is important to acknowledge this idea with some caution. Participants in the downwardly mobile group did not significantly differ with any of the other four groups in this study (including the sustained privilege and upwardly mobile group). As such, while we can claim that the more privileged groups do better vocationally then the less privileged, it is impossible to make any claims on the differences between the downwardly mobile group and the upwardly mobile or sustained privilege group. Given that the two mobility groups are of the most interest in the current study, these findings suggest similarity in terms of group membership for each profile but differences in terms of experiences of marginalization. We discuss this in more detail in the future directions section.
Limitations and Future Directions
The results of this study need to be considered in light of several limitations, many of which can inform future research directions. First and foremost, although our sample was diverse in terms of annual income, it was predominantly white women. This is a limitation of the ResearchMatch platform, and it will be essential that future studies using LPA to assess social mobility do so by having more diverse samples. It’s instructive to consider how this may have affected our results, especially the percentage of participants in each mobility group. From an intersectional perspective, white women are both privileged and marginalized within U.S. culture. On the one hand, being white affords less experiences of discrimination which may allow for an easier path to upward mobility. On the other hand, being a woman exposes individuals to greater experiences of sexism, which may limit access to upward mobility, especially as compared to white men. It is impossible to know the precise effects our unique sample had on the results but given the sample’s general lack of diversity future studies are essential to support the study’s main claims.
Second, our results failed to provide a compelling differentiation between upwardly and downwardly mobile individuals. It is possible that these groups aren’t different across a variety of metrics. However, it would be useful to look at additional explanatory variables to understand what types of upward or downwardly mobile individuals may be more likely to experiences positive vocational outcomes. Third, although we took a multifaceted approach to studying social mobility, we still only assessed two variables. We made this decision to keep in line with logic from PWT, but arguments could be made for other – or additional – metrics of social mobility to be included to fully capture the construct. It would be interesting for future studies to compare the indicators used here to other indicators, such as subjective social status and social class. Fourth and finally, we used a retrospective technique to capture participants experiences of economic constraints and marginalization during childhood. Future studies should attempt to capture these constructs during childhood, and then track participants across time into adulthood. Adding parental perceptions of each of these may also be helpful in that process, as the degree to which a 16-year-old feels economically constrained may differ from how economically constrained the child’s parent feels. This type of research would be fascinating to examine in terms of discrepancies and later vocational outcomes.
Practical Implications
The results of this study may have important implications for practice, in particular career counseling. First, the limited variability in social mobility in general is instructive for practitioners to consider when working with clients. Our findings suggest that most people will maintain similar levels of economic constraints and experiences with marginalization from childhood to adulthood. It is common in the U.S. to learn about the “American Dream” and perhaps conclude that a fairly large percentage of people will be able to achieve upward social mobility (Kraus & Tan, 2015). Yet this simply does not match with the data from the current study and many others beforehand (e.g., Kraus et al., 2019; Kraus & Tan, 2015). As such, practitioners are encouraged to empathize with clients who may desire mobility by highlighting that it is more myth than reality. In particular, inequitable systems are much more responsible for mobility in either direction then effort on the part of an individual.
Second, nearly one quarter of our sample sustained high levels of marginalization experiences even while remaining unchanged in terms of their economic constraints, which in the current study were at an average level compared to other groups at both time points. This finding speaks to the importance of clinicians being cognizant that how a client is doing in terms of income – which is often highly tied to one’s career – may be unrelated to their feelings around social standing. Regardless of how much money a client may be making in their career, having a marginalized identify may continue to be salient across one’s entire lifespan. Navigating the world of work at all levels – from access to opportunity, workforce entry, and workplace experiences – will be more challenging with marginalized identities given the discrimination that occurs at a systemic and individual level (Dickens et al., 2019; Thompson & Dahling, 2019; Velez et al., 2013). Counselors are encouraged to be open to examining how a client’s identity is affecting their experiences in the world of work and lean into highlighting inequitable systems that cause these marginalizing experiences. Studies within vocational psychology have demonstrated that developing critical consciousness, especially concerning awareness of how systems operate, is beneficial to help individuals better navigate work related discrimination (Cadenas & McWhirter, 2022).
Conclusion
In this study, we sought to understand social mobility as it relates to three variables in PWT (work volition, decent work, and career adaptability). To do so, we conducted a latent profile analysis which divided our sample into five groups (sustained privilege, upward mobility, downward mobility, highly marginalized, and sustained barriers). Overall, social mobility was limited and those in the sustained privilege and upwardly mobile group evidenced the best vocational outcomes. The results of this study are consistent with previous research that social mobility may be important in understanding people’s experiences in the world of work.
Footnotes
Declaration of Conflicting Interests
The author(s) declared no potential conflicts of interest with respect to the research, authorship, and/or publication of this article.
Funding
The author(s) received no financial support for the research, authorship, and/or publication of this article.