




Abstract
Left Bundle Branch Block (LBBB) diagnosis is crucial for patient stratification and the selection of individuals who are likely to respond to Cardiac Resynchronization Therapy (CRT). The pathophysiological distinction between LBBB and strict LBBB (sLBBB) is investigated in this research with a view to optimizing diagnostic criteria and therapy. ECG signals were transformed into the vectorcardiographic (VCG) domain, where QRS loops were divided into two halves at the time of the velocity peak computed over the discrete derivates of the x, y, and z leads. From each half, angles and norms were extracted in all VCG planes, along with ratios between VCG peak velocity and VCG fidutial points. These were used to train machine learning models for classification into Healthy, LBBB, and sLBBB categories. The analysis identified four most significant features for the discrimination task: (1,2) peak velocity time relative to QRS onset/offset, (3) maximum norm of the early QRS loop in the frontal plane, and (4) QRS angle in the horizontal plane. These features preserved essential differences in conduction dynamics and electrical disturbances among the three groups. In particular, the time from velocity peak to QRS offset was the most discriminative feature, with progressive prolongation from Healthy to LBBB to sLBBB classes. This reduced 4-feature set achieved an accuracy of 0.85 and an F1-score of 0.83, which was on par with 15-feature-based models. Finally, the integration of explainable artificial intelligence (xAI) into these simplified models enabled the derivation of transparent diagnostic rules for LBBB, improving clinical interpretability on more reliable diagnostic decisions.
Introduction
The definition of strict left bundle branch block (LBBB) was first introduced by Strauss in 2011 based on the analysis of the ECG phenotypes of patients who significantly benefited from cardiac resynchronization therapy (CRT) in the MADIT-CRT trial.
1
This subgroup exhibited specific characteristics including a QRS duration
The objective of this study is to investigate the pathophysiological aspects associated with left bundle branch block (LBBB) and strict left bundle branch block (sLBBB), aiming to refine treatment strategies and improve clinical outcomes in patients affected by these conditions.
Incorporating findings related to maximum conduction velocity might provide important insights. Understanding whether LBBB shows delayed peak conduction velocity compared to sLBBB could imply a more proximal occurrence of these blocks, with profound clinical implications. Confirmation of such distinctions would not only deepen our understanding of the underlying mechanisms but also their associations with underlying heart diseases.
While refining treatment strategies may be a longer-term outcome, the immediate value lies in advancing our physiological understanding of LBBB and sLBBB. This could pave the way for more targeted therapies, thereby enhancing clinical practice and patient outcomes.
Related work and contribution
The differentiation of Left Bundle Branch Block (LBBB) from its strict subtype (sLBBB) is a critical challenge in cardiology, as it directly impacts the selection of patients for Cardiac Resynchronization Therapy (CRT). 1 While strict electrocardiographic criteria were introduced to identify patients more likely to respond to CRT, their application can be subjective and may not fully capture the underlying electrophysiological dynamics. 3 Moreover, a more accurate LBBB diagnosis might help identify candidates for other cardiac stimulation schemes, such as His bundle pacing or other biventricular configurations.4,5
To address these challenges, many studies have turned to machine learning (ML) and deep learning (DL) for the automated analysis of ECG signals.6–10 The field has seen significant advances in computational methods for cardiac monitoring, ranging from mobile cardiac monitoring systems 8 to sophisticated prediction models for sudden cardiac death.9,10 Initial efforts in automated sLBBB detection, such as those presented in the International Society for Computerized Electrocardiology (ISCE) initiative, reported accuracies around 82%, 2 demonstrating the potential of computational approaches.
However, a significant limitation of many advanced models is their ”black box” nature. This lack of transparency makes it difficult for clinicians to understand the reasoning behind a diagnosis, which hinders clinical trust and adoption.11,12 In response, the field of Explainable Artificial Intelligence (xAI) has become crucial across various medical domains, including EEG analysis for impulsivity classification, 13 cognitive impairment assessment through clock drawing tests, 14 neonatal seizure detection, 15 and Alzheimer’s disease evaluation. 16
Recent works have begun to incorporate explainability into LBBB classification. For instance, Macas et al. (2024) developed a system using a reduced set of bio-inspired features derived from the vectorcardiogram (VCG), such as QRS-T angles and areas. They employed XAI techniques like SHAP to provide feature-level explanations, successfully identifying the most influential parameters for a ternary classification task (
Concurrently, novel signal representation methods and advanced learning algorithms have been explored. Graph theory has emerged as a powerful paradigm to model the complex inter-lead relationships within a 12-lead ECG. In this line, Macas Ordóñez et al. (2025) proposed and compared two distinct graph-based methodologies. The first approach, using Graph Signal Processing (GSP) and a Support Vector Machine, achieved superior diagnostic accuracy (mean balanced accuracy of 0.8317) by leveraging features from the graph spectral domain, although these features can be difficult to interpret clinically. The second approach converted connectivity matrices into images for a Convolutional Neural Network (CNN), incorporating xAI via Grad-CAM to visualize the inter-lead interactions influencing the model’s decision. While this second method offered enhanced visual interpretability, its accuracy was lower, and like other xAI methods, it did not generate simple, direct clinical rules. 18
The field has also seen advances in neural dynamic classification algorithms, 19 finite element machines for fast learning, 20 dynamic ensemble learning, 21 and self-supervised learning approaches for electrophysiological data. 22 However, while these previous works have made significant strides, a gap remains in developing a method that is both highly accurate and provides explanations in the form of simple, verifiable rules specifically for LBBB differentiation.
Our current study addresses this gap by introducing a framework that leverages a novel set of VCG features based on conduction velocity dynamics, specifically the timing of the peak velocity (
Relative to our 2023 ICAE study (Macas et all, 2023), the present work introduces: (i) a velocity-based VCG loop segmentation (d1/d2) that yields physiologically grounded features; (ii) a 4-feature model that attains comparable performance to the 15-feature set while improving interpretability; (iii) consolidated, high-precision Anchor rules that provide global rule sets from local explanations; and (iv) by-class xAI analyses and spectral clustering that align with Strauss-defined phenotypes. Together these advances reduce model complexity, improve transparency, and sharpen physiologic insight.
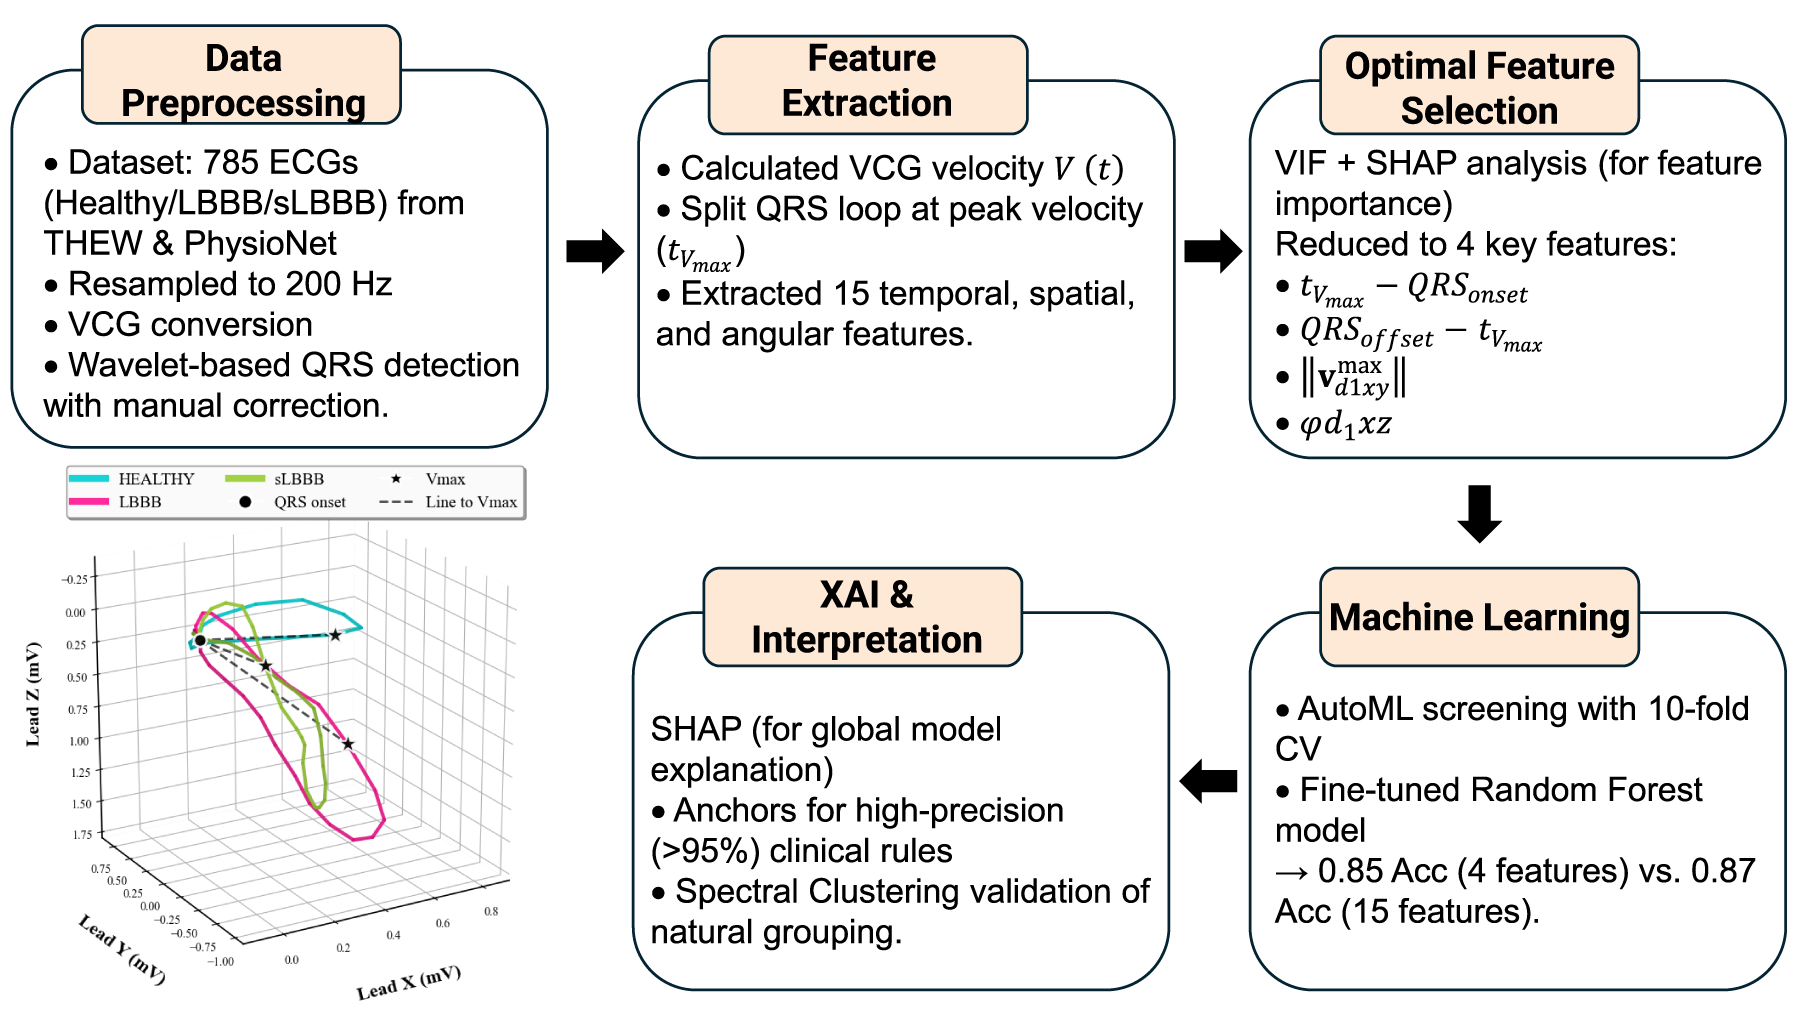
Methodology workflow: preprocessing, feature extraction/selection, ML, and XAI.
The overall workflow of the methodology, from data preprocessing to model interpretation, is summarized in Figure 1. Two databases were utilized in this study. The first database, E-OTH-12-0602-024,
23
was obtained from the Telemetric and Holter ECG Warehouse (THEW) as part of the initiative of the International Society for Computerized Electrocardiology (ISCE) in 2018.
2
This database comprises 602 ECG records from the MADIT-CRT clinical trial, conducted at the University of Rochester (Rochester, NY). It includes 331 cases of strict left bundle branch block (sLBBB) and 192 cases of incomplete LBBB and 79 cases of other cardiopathies (
The second database, a Large Scale 12-lead Electrocardiogram Database for Arrhythmia Study from PhysioNet, 24 includes ECGs from 45,152 patients in resting conditions, encompassing 64 different types of arrhythmias as well as healthy ECG records. The data were collected from Shaoxing People’s Hospital and Ningbo First Hospital. The ECGs are sampled at 500 Hz and have a duration of 10 seconds. From this database, 299 randomly selected ECG records of healthy subjects were extracted.
ECG Preprocessing
To ensure consistency in the analysis, all signals were resampled to 200 Hz. The ECG data were transformed into the vectorcardiographic (VCG) space using the inverse Dower matrix 25 and the derived VCG signals were delineated using a wavelet-based algorithm implemented with the WT-delineator library in Python. 26 This algorithm identified the onset and offset of the QRS complex, enabling the construction of QRS loops. For ECGs with abnormal morphologies, manual corrections were frequently necessary to ensure accurate delineation. For each patient, a unique mean loop was obtain by averging loops across all beats. From these mean loops, a set of 15 features were derived, as explained in the following sections.

a) Morphological segmentation of the VCG lead
Cardiac velocity
Once the time of maximum velocity
Peak velocity intervals
Based on the time for peak velocity


Figure 3 depicts the intervals constructed from the VCG fiducial points (

Comparison of VCG lead
For each time

The calculated norms were divided into two groups corresponding to the

These maximum norms represent the dominant vectors in
The angle

Figure 2 shows a representative example of loop segmentation based on peak velocity for the three classes. Notice how the d2 segment (blue) grows with pathology, from
Data conditioning for machine learning models
We initiated the process with a tabular dataset comprising 785 rows and 16 columns. Each of the 785 rows represented a unique patient, characterized by 15 features and a label column indicating the class, which was assigned one of three values: 0, 1, and 2 representing the categories
Six out of fifteen features accounted for maximum norms at
Following the feature engineering stage, we proceeded to a multicollinearity detection phase. Multicollinearity is detrimental to machine learning models as it can lead to unstable and unreliable estimates, inflated standard errors, and difficulties in interpreting the importance of individual predictors. To address this, we conducted a correlation analysis of the features and calculated the Variance Inflation Factor (VIF). VIF quantifies how much the variance of a regression coefficient increases due to multicollinearity among predictors, thereby measuring the extent of redundancy in the model. 27 High VIF values indicate strong correlations between predictors and suggest the need for feature removal or transformation to stabilize model interpretation.
Statistical analysis
To assess statistical differences in the QRS angles
Results
The segmentation of the VCG waveforms and loops produced clearly separated patterns across
In addition, to compare
Consistently, Figure 4 represents the generalization of Figure 3 to the entire population. Here, an increasing

Boxplot representation of time to peak velocity with respect to QRS offset (
Figure 5a shows the boxplots of the maximum norms from
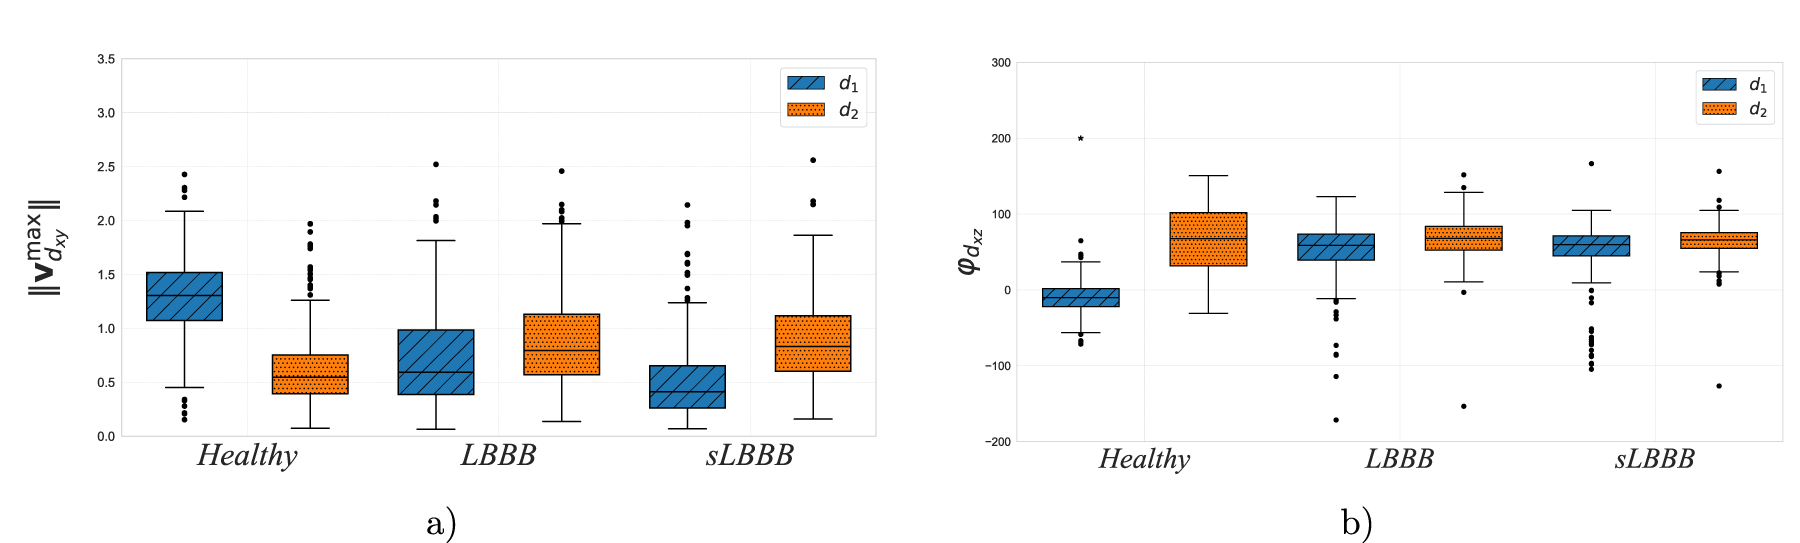
Boxplots for physiological features in
Analogously, Figure 5b illustrates the statistical analysis of QRS angles in the
In the context of classification models, situations where two or more features are highly correlated with each other can lead to several issues that affect the performance and interpretation of the model. Our multicollinearity analysis revealed high correlations (exceeding 75% in some cases) between several maximum norms and angles, respectively. Consequently, we decided to eliminate some of these features. To determine which ones to remove, we defined and fitted several basic models (based on XGBoost and Random Forest) and performed a feature importance analysis using various methods (SHAP Feature Importance, 28 Random Forest Split Entropy Importance 29 and Univariate Selection Tests, 30 among others. This comprehensive approach ensured that we retained the most informative features while mitigating the effects of multicollinearity on our models.
Feature elimination was conducted in multiple complementary steps to ensure statistical rigor. First, pairwise correlations were inspected, and one feature of each pair with
Additionally, kernel density estimates (KDE) by class were inspected to confirm discriminative patterns, particularly between
From the former analysis, we extracted a reduced set of just 4 features that achieved comparable classification metrics as the full 15-feature dataset, as will be explained in the next section. The reduced subset of features was composed of: the time of peak velocity to QRS onset ( the time of peak velocity to QRS offset ( the maximum norm of the the angle of the
Models
To evaluate the performance of various machine learning models on our 15-feature dataset, we employed an automated machine learning (AutoML) tool, specifically PyCaret, 32 to systematically assess a wide range of algorithms. Tree-based ensemble models such as Random Forest, Gradient Boosting, and XGBoost were prioritized because extensive empirical evidence shows that they outperform deep neural networks on structured, low-dimensional tabular datasets typical of biomedical studies.33–35 Deep learning architectures were not adopted since our dataset comprised fewer than one thousand subjects, a regime where such models tend to overfit and provide limited interpretability. The experimental setup utilized a 10-fold cross-validation (CV) strategy with an 80/20 train-test split. We noticed a notable superiority of ensemble-based decision tree models and gradient boosting algorithms in this particular classification task. Specifically, the Gradient Boosting Classifier (GBC) demonstrated the highest overall performance, achieving an accuracy of 0.8324, matched by its sensitivity, along with a precision of 0.8382 and an F1-score of 0.8297. The same procedure was applied to the reduced 4-feature dataset (described in the section “3.1”), with the results shown in Table 1. The outcomes were remarkably similar to those obtained with the extended dataset, suggesting that the reduced 4-feature model retains the discriminatory power of the extended dataset.
Comparison of 4-feature machine learning models.
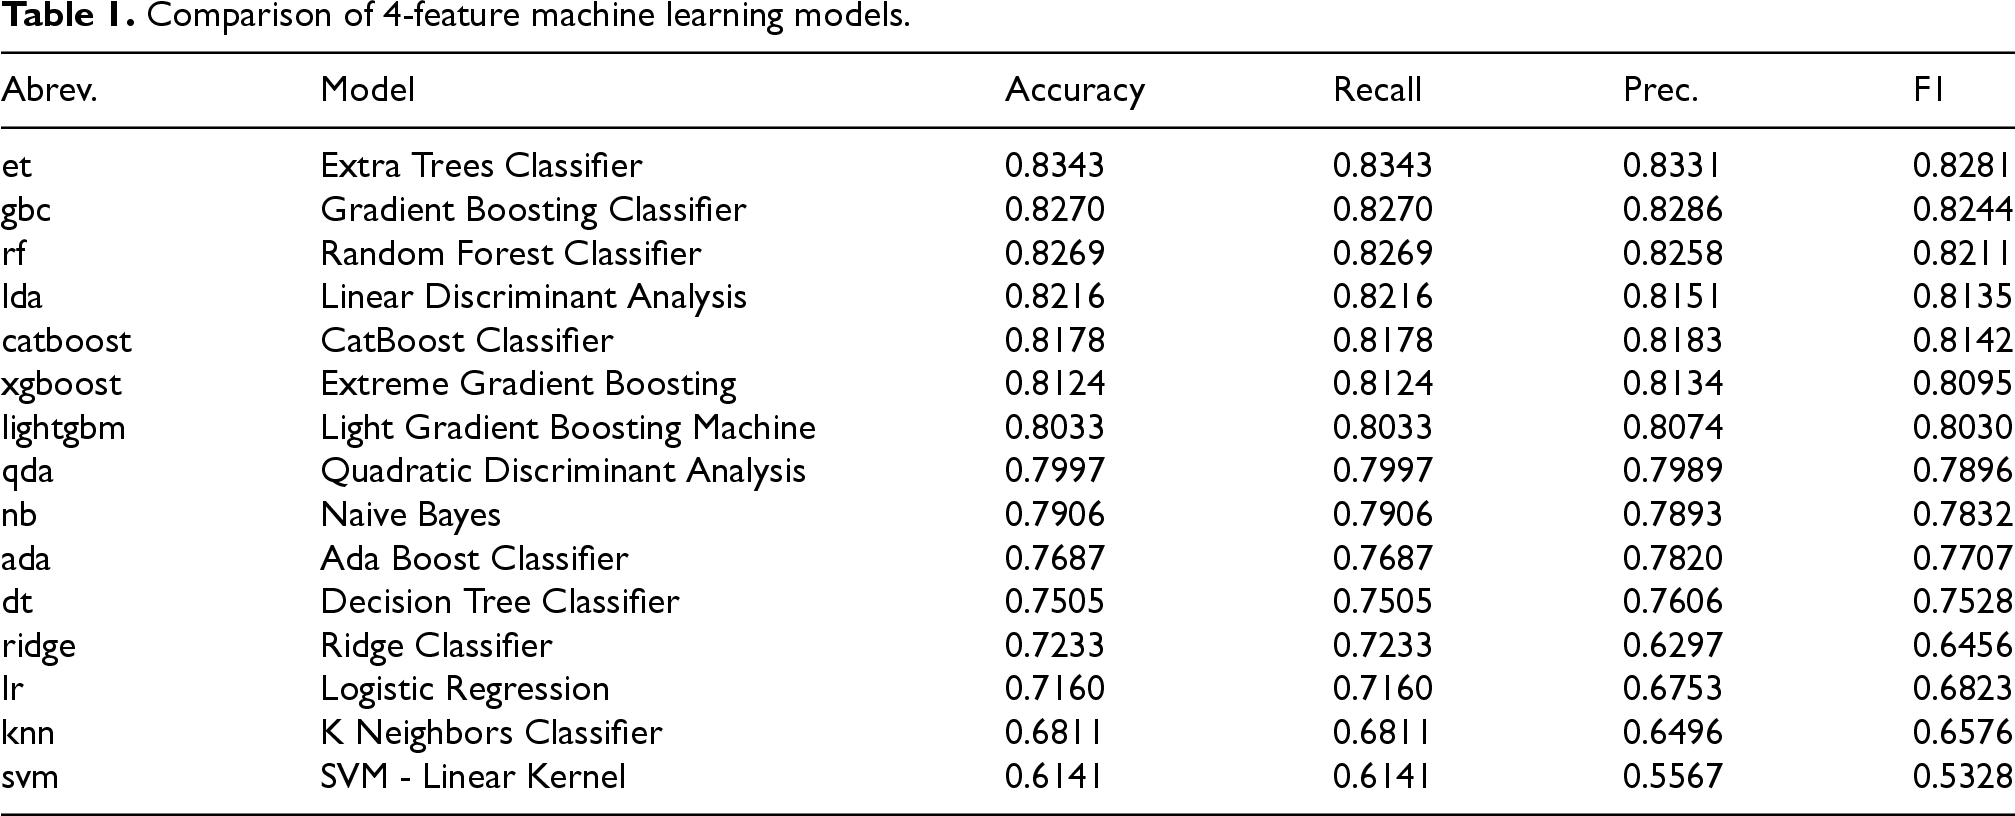
Comparison of 4-feature machine learning models.
The reduction in dimensionality from 15 features to a mere 4, achieved with just a small decrease in classification accuracy, represents a significant advancement in our research. Firstly, it facilitates the development of an explainable model, wherein a concise set of rules can be derived to elucidate individual classification outcomes. This interpretability is particularly important for medical practitioners and specialists who need to comprehend the reasoning behind each prediction. Secondly, the reduced feature space enables a more tractable analysis of feature importance and their global impact on the classification process. To this end, we employed state-of-the-art interpretability techniques such as SHAP (SHapley Additive exPlanations) and analogous methodologies, as will be seen in the next sections.
To obtain the definitive models, an ensemble of decision trees was employed, optimized through a hyperparameter search across 864 candidate configurations using 5-fold CV. The results of this fine-tuning process for both the original and reduced datasets are presented in Table 2, compared with the 15-feature model, the 4-feature model showed small absolute decreases across metrics (e.g., accuracy 0.87 vs 0.85; macro-F1 0.85 vs 0.83). Once again, it can be observed that the metrics obtained by the optimized models are remarkably similar in both cases, with the 15-feature model being slightly superior to the 4-feature model.
Comparison of final finetuned models.

Although combinations of weaker classifiers in a meta-algorithmic or ensemble framework could theoretically enhance predictive accuracy, such approaches were not pursued in this work since our main objective was to preserve interpretability while maximizing accuracy. By restricting the model to a compact set of 15 features, reduced to only 4 with small performance loss, we ensured compatibility with explainability techniques such as SHAP values and Anchors, which provide a clearer physiological interpretation of model decisions. Increasing the complexity of the model would likely reduce this clarity and hinder the extraction of clinically meaningful rules.
Explainable Artificial Intelligence (
We can conclude via
To interpret the decision process of the classification models, we used SHAP (SHapley Additive exPlanations) values, which quantify the contribution of each feature to the model’s output for each individual prediction. SHAP assigns an additive importance value to each feature based on cooperative game theory, comparing the model output with and without each feature.
For each patient, the model prediction 
In this study, SHAP values were computed using the TreeExplainer algorithm for the Random Forest model trained on the four selected features:
Figure 6 shows such feature importance by class, with the contribution for each class visually grouped and labeled in the legend, for two different models. The classification power for the
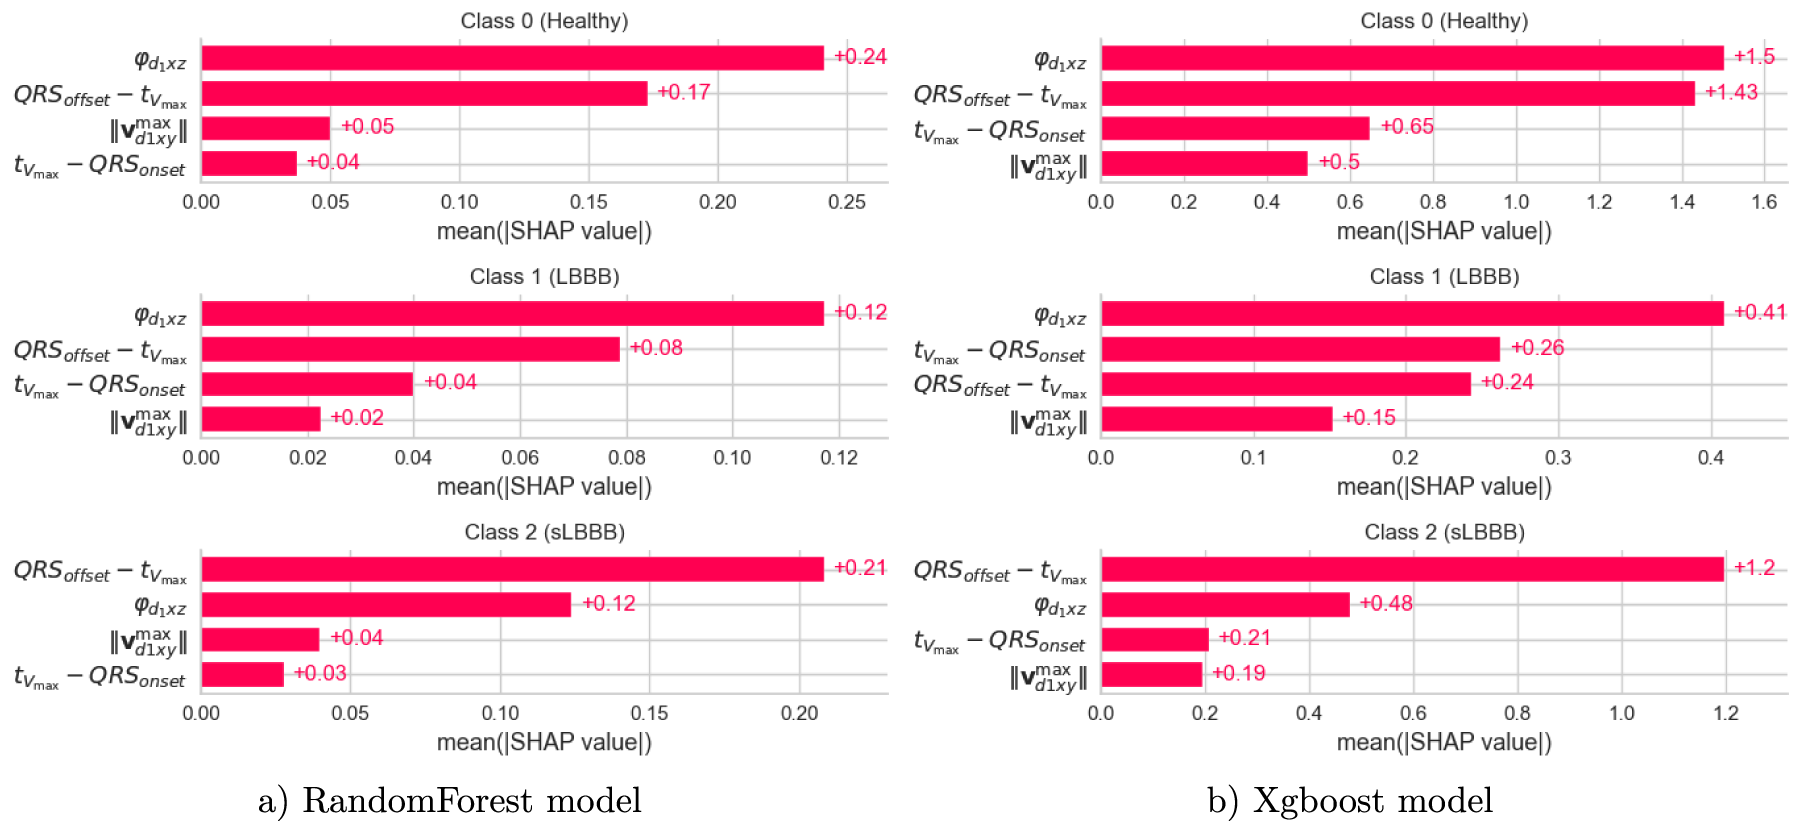
Feature importances by class for a) RandomForest and b) XGboost classifiers. Predictive power is represented by the length of the bars for each class (grouped and labeled in the legend). Notice the consistency in feature importance comparing both models. a) RandomForest model and b) Xgboost model.
Thanks to the use of explainable techniques, it becomes possible to infer the most likely class of a given observation based on the specific range of values taken by each of the four features. This relationship is clearly illustrated in the dependence plot, where distinct classes occupy different regions of the feature space.
To further explore these inter-class differences, Figure 7 presents the distribution of the feature QRSoffset–Tvmax across the three classes. As shown, the distribution progressively shifts toward higher values as the class transitions from healthy to LBBB and then to SLBBB. In particular, the healthy class can be characterized by values between 0 and 0.08 ms, the LBBB class by values between 0.08 and 0.10 ms, and the SLBBB class by values ranging from 0.10 to 0.16 ms. Notably, these ranges are consistent with the simplified decision rules previously identified for the SLBBB class (see Table 3).
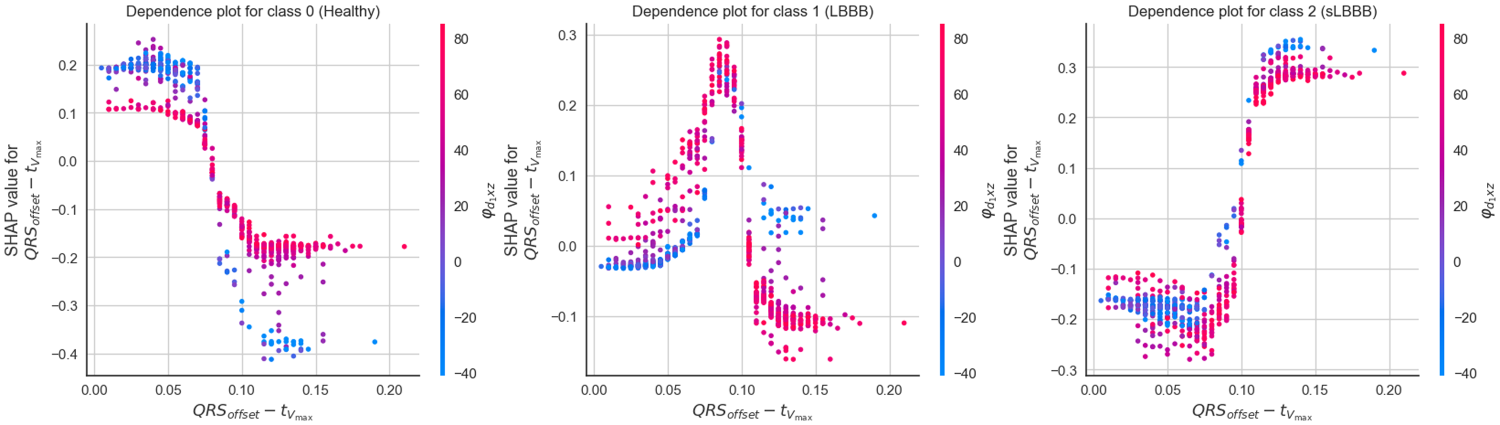
Dependence plots for feature
Anchors for class

To evaluate whether these four physiological features tended to naturally group similarly to Strauss criteria, we implemented a Spectral Clustering algorithm on these features and clustered them into three classes. The result is displayed in Figure 8. Here, samples for each class are represented in different colors for each pair of features {
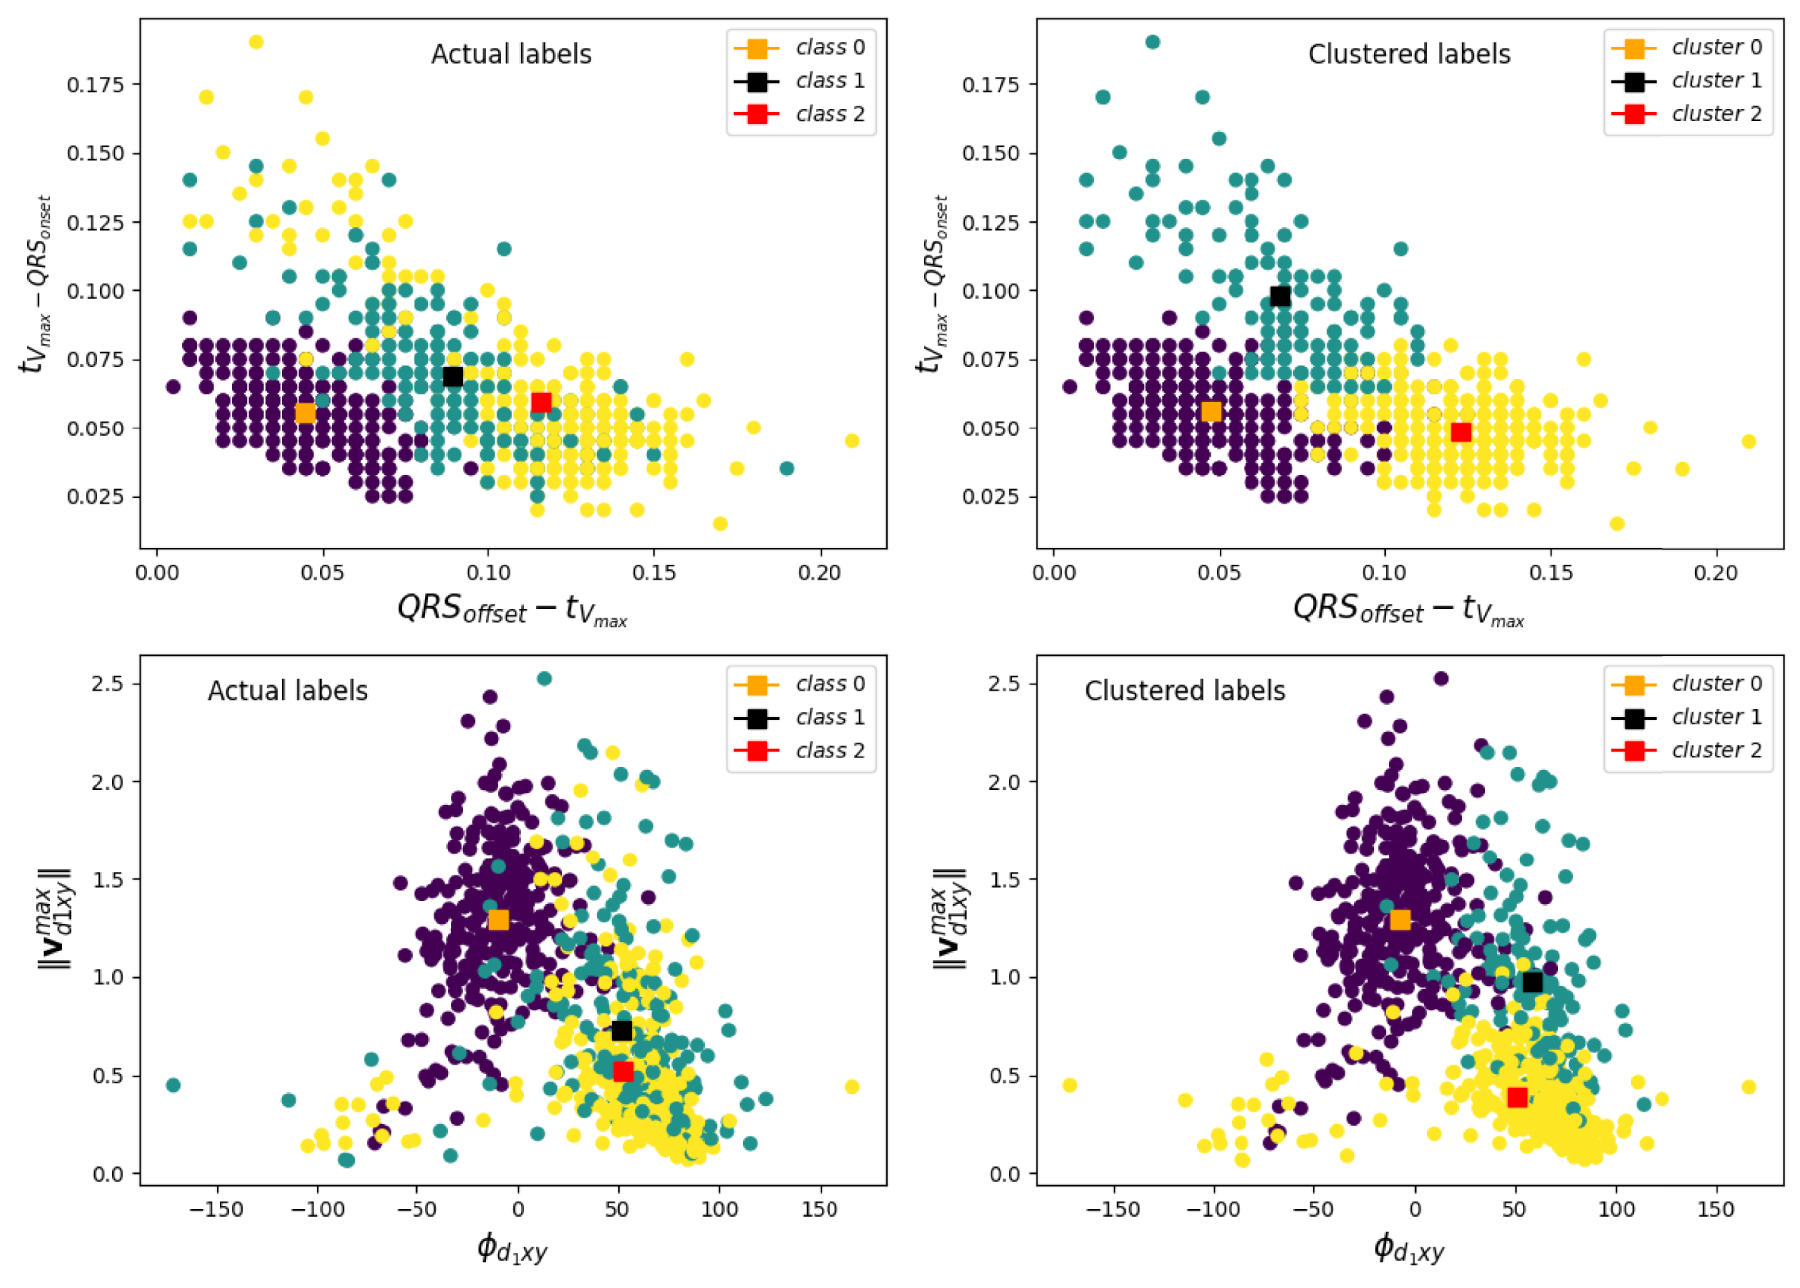
Spectral cluster for
The anchor method
36
is an
The method was explicitly designed to be highly precise, ensuring that the generated rules, when satisfied, lead to the same prediction with a (customizable) precision level.
As an example, this is the Anchor obtained for sample1 in our dataset:
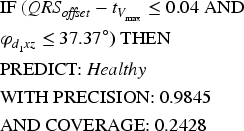
Precision represents the relative number of correct predictions. In this case, approximately 98% of the samples for which the anchor holds are classified as class
Anchor rules were generated in a stratified cross-validation setting to maximize precision subject to coverage, then consolidated by removing duplicates and retaining rules with 95% precision and highest coverage. Thresholds (e.g.,
However, Anchor Explanations provide local interpretability, meaning they explain individual predictions rather than the overall behavior of the model. In an attempt to derive global explanations from local anchor-based interpretations, we employed a novel consolidation approach. Initially, we generated anchors for all samples in the dataset using the Anchor algorithm. The Anchor algorithm obtained a total of 210 different anchors for the whole dataset. These local explanations were then aggregated to obtain a reduced set of consolidated anchors representative of the entire dataset.
The rule consolidation process involved several steps, such as removing duplicates and incorrect predictions as well as retaining only those with over 95% precision and the highest coverage. This final step resulted in just 27 rules (10, 14, and 3 for each class, respectively). The reduced set of anchors obtained for the
Discussion
To improve the response to CRT, efforts were made to enhance the stimulation wave using biphasic configurations 4 and designs inspired by neurostimulators, 37 without any success. Nowadays, a heavily explored approach for refining CRT is aimed at improving the diagnosis of LBBB, by means of a more rigid definition created empirically by Strauss. 1 The strict Left Bundle Branch Block (LBBB) criteria defined by Strauss in 2011 focus on specific electrocardiographic (ECG) characteristics that predict a better response to Cardiac Resynchronization Therapy (CRT). These criteria help identify patients who are more likely to benefit from CRT, focusing on those with a true conduction block in the left bundle branch rather than other causes of prolonged QRS duration. These criteria were designed to differentiate between regular LBBB and ”strict” LBBB, based on patient outcomes from the MADIT-CRT trial.
In this paper, we sought to find VCG-based variables that tell us about the pathophysiological differences, if any, underlying the Strauss criteria. To do this, we split up the QRS loop into two, according to the peak velocity. This procedure segmented the QRS loop into a first segment developed at preserved conduction, and a second one, developed at a much lower, non-specific conduction. On these two segments, variables such as the time of peak velocity referred to the QRS fiducial points (
On the other had, the different AI tools implemented in this work support the same concept: the
It is worth mentioning at this point, that the models tested in this piece of work produced ternary classification performances comparable to those binary classification performances compiled in the International Society for Computerized Electrocardiology in its initiative for automated LBBB detection in terms of accuracy, sensitivity and precision. 2 In this way, the best accuracy reported in the 7 participants group was of 82% (with 69% sensitivity and 87% precision). 40 Moreover, with only these 4 features, we obtained better metrics than in a previous work, who utilized sets of 7 or 19 physiological features for a ternary classification scheme. 17 It is crucial to construct good models when attempting to explain them. Explainable AI is useful and can be reliable only when the AI models themselves are useful and reliable. 12
Study limitations and future work
It is also important to contextualize our methodological approach. The primary goal of this study was to isolate and validate a set of novel VCG features as fundamental pathophysiological markers. To achieve this rigorously, our analysis was based on a single representative beat per patient. This approach allows for the establishment of a clear baseline, confirming with confidence that the observed discriminatory power comes directly from the proposed features by controlling for the variable of inter-beat dynamics. While this approach is complete for the stated objective, the analysis of multiple beats represents a valuable subsequent step. In fact, the study of beat-to-beat variability is the logical next step that builds upon the solid foundation we have established. Analyzing the variance of our features could reveal ”meta-features” with important clinical information about the stability of the block or the severity of the pathology, representing a very promising future line of research that stems directly from our findings.
Finally, a novel approach to xAI was explored to provide a simplified set of rules to quickly classify these three classes relying on the four physiological features (see Table 3). It is important to note that Anchors do not necessarily incorporate all features from the dataset, instead focusing on a select few. This characteristic imparts a sense of hierarchical importance to the rules governing model predictions. Moreover, consolidated Anchor rules can identify subsets of feature values that are sufficient conditions for the model to return a particular classification, providing a more granular understanding of feature interactions and their impact on model outcomes. We strongly believe that this technique might enhance the transparency and interpretability of AI models used in electrocardiology. However, this study is retrospective and draws on two existing datasets with subsampling and occasional manual delineation. Generalizability beyond these cohorts is unknown. In particular, it would be desirable to correlate the temporal features
Additionally, future work will include a systematic analysis of misclassified cases to investigate whether these errors reflect physiological overlap or outlier behavior within the
Conclusions
This study advances the understanding of the physiological differences between regular and strict Left Bundle Branch Block by analyzing vectorcardiographic data using machine learning and explainable AI techniques, aligning with recent research trends in the International Journal of Neural Systems that emphasize explainable AI in medical applications.13–16 Our work connects to the journal’s recent focus on transparent machine learning for clinical decision support across various medical domains, from EEG-based impulsivity classification to cognitive impairment assessment and neonatal seizure detection.
This explainable AI framework offers several contributions to clinical practice. Firstly, it improves diagnostic discrimination: The model identifies four key physiological features (conduction velocity-related time intervals, maximum VCG loop norm in the frontal plane, and QRS angle in the horizontal plane) that allow for robust differentiation between
Our methodological approach builds upon established computational cardiology research7,8 while advancing the field through explainable AI. For future extensions of this research, we plan to explore recently developed powerful classification algorithms such as Neural Dynamic Classification, 19 Finite Element Machines for fast learning, 20 Dynamic Ensemble Learning Algorithms, 21 and self-supervised learning approaches 22 that have shown promising results in electrophysiological signal analysis. These advanced computational techniques could further enhance the accuracy and robustness of our classification framework while maintaining clinical interpretability.
The clinical implications of this work include potential improvements in selecting CRT candidates by accurately identifying sLBBB, which best predicts response to CRT, thereby helping select patients with the greatest likelihood of benefit and avoiding unnecessary interventions. More precise classification may also help identify candidates for other cardiac pacing modalities, such as His bundle pacing. While this work remains a retrospective analysis requiring prospective validation, it provides a quantitative and transparent framework that could improve the diagnosis of LBBB and sLBBB, facilitating accurate selection of CRT candidates and promoting personalized, evidence-based medicine.
The submission of this work to the International Journal of Neural Systems is justified by its alignment with the journal’s recent emphasis on explainable AI in healthcare, its connection to advanced neural systems approaches for medical signal analysis, and its contribution to the growing body of research that bridges machine learning innovation with clinical applicability in cardiovascular medicine.
Footnotes
Acknowledgments
This project was funded in part by grant by grants DTS19/00175 and PDC2022-133952-100 funded by the Spanish “Ministerio de Ciencia, Innovación y Universidades” and by the European Union’s Horizon 2020 Research and Innovation Programme MSCA-SE EPISTEAM, and by Programa Iberoamericano de Ciencia/Tecnología para el Desarrollo (CYTED) (Red 225RT0169). This research has been funded by a PhD scholarship from the National Council of Science and Technology (CONICET).
Funding
The author(s) received no financial support for the research, authorship and/or publication of this article.
Declaration of conflicting interests
The author(s) declared no potential conflicts of interest with respect to the research, authorship, and/or publication of this article.
