
Abstract
This article addresses the following research questions: Do respondents participating in cross-cultural surveys differ in their response style when responding to attitude statements? If so, are characteristics of the response process associated with their ethnicity and generation of immigration? To answer these questions we conducted a mixed method study. Quantitative analysis of a large representative sample of minorities in the Netherlands shows that cross-cultural differences in responding can partly be explained by a differential response style. These differences in response style turn out to be related to the generation of immigration, both in the representative sample and in a purposively selected qualitative sample of persons of the same four cultural groups. Analysis of cognitive interviews reveals that respondents use three types of response strategies to overcome difficulties of responding to items in a cross-cultural survey. These response strategies are also related to a respondent’s generation of immigration.
Keywords
In the last decades of the 20th century many Western societies have transformed into multicultural societies as the result of a steady immigration flow. Ethnic minorities consist of a quarter of the U.S. population and the prognosis is that by 2050 ethnic minorities will form the majority. In Europe, immigrants consist of 14% of the population on average (Pan & Pfeil, 2003) and 85% of the total Europe’s total population growth results from immigration in 2005 (Munz, Straubhaar, Vadean, & Vadean, 2006). As these societies become more multicultural in nature, social scientists are increasingly interested in the differences and similarities in values, attitudes and opinions among immigrants and natives.
To investigate these issues, surveys are usually the instrument of choice to gather attitudinal information on diverse populations. Obviously, when surveys are applied in a cross-cultural design, the issue of the cross-cultural comparability of survey findings becomes important (Van de Vijver&Leung, 1997). Overlooking this issue may lead to erroneous conclusions about group differences among culturally diverse populations. Fortunately, cross-cultural researchers more and more test the comparability of survey measurements empirically (Vandenberg & Lance, 2000). However, to adequately study the comparability of survey measurements, it is not sufficient to only establish whether a particular survey measurement constitutes an equivalent or nonequivalent measurement across different cultural groups: Once measurements are found to be nonequivalent, the causes for this should also be further investigated, so that cross-cultural survey measurements can be improved. Many researchers find that respondents from culturally diverse backgrounds respond differently than would be expected given their attitudes (e.g., Van de Vijver & Leung, 1997) and attribute the cause of these nonequivalent measurements to the widespread use of response styles by respondents (e.g., Harzing, 2006; Van Herk, Poortinga, & Verhallen, 2004). We define a response style as the tendency to select particular response categories irrespective of the item content across a large range of unrelated or weakly related survey questions (e.g., Baumgartner & Steenkamp, 2001; Greenleaf 1992). In this article, we explore why these response styles occur by focusing on the role of “response strategies.” The latter is a relatively new concept within the field of cross-cultural survey research, by which we refer to the type of arguments presented in justifying these responses. This is done against the backdrop of findings from a quantitative study on the assessment of measurement equivalence and the detection of response style in a large-scale cross-cultural survey. Specifically, this article sets out to answer the following research questions: Do respondents participating in cross-cultural surveys differ in terms of their response style when responding to attitude statements? And if so, are these response styles associated with a respondent’s ethnicity and generation of immigration? Are these findings related to response strategies?
Since the 80s, survey researchers approach the survey response as the outcome of cognitive, communicative, and social processes (Belson, 1986; Bradburn, Rips, & Shevell, 1987; Hippler & Schwarz, 1987; Schwarz & Sudman, 1996; Tourangeau, 1987; Tourangeau & Smith, 1996). Each respondent is assumed to go through five stages: Interpreting the question, retrieving information, generating the judgment, mapping the judgment to the response scale and editing the response. Such theoretical models on the response process mainly focus on individual differences in responding and neglect cultural differences (for example, see Hui & Triandis, 1989; Tourangeau, Rips, &Rasinski, 2000, pp. 210-213). However, it is well-known that minorities may differ in using response styles (for an overview, see Johnson, Shavitt, & Holbrook, 2011; Yang, Harkness, Chin, & Villar, 2010). Given the vast amount of cross-cultural differences in measurement errors and response styles (for an overview, see Sudman & Bradburn, 1974), it is likely that culturally diverse respondents use different response strategies to deal with survey questions. For example, second-generation immigrants may be more accustomed to the norms and values of the receiving society than the first-generation immigrants, and may include or exclude different types of information (e.g., because of taboos) to form their answers (Bless, Schwarz, Bodenhausen, & Thiel, 2001). To explore such issues we conducted a mixed method study, of which we report the design and findings in the remainder of this contribution.
An Integrated Mixed Method Study
General Approach
A mixed method design allows us to integrate the strengths of statistical modeling and cognitive interviewing. We start with estimating a latent variable model on data from a large representative sample of the four largest minorities in the Netherlands to detect the magnitude of group differences in responding (Study 1). Then, we conduct cognitive interviews in a small purposive sample of interviewees from the same four cultural groups to study the response process in more detail (Study 2). We integrate both data sets by inferring the response style of interviewees in the purposive sample from the statistical model, and comparing the interviewees’ explanations for their response behavior in the cognitive interview accordingly.
In the quantitative study, we assess whether minorities respond differently to a selection of survey-items from a large-scale survey given their attitudes (Kankaras & Moors, 2009; Moors & Wennekers, 2003). Using the same dataset as Morren, Gelissen and Vermunt (in press), we find that response differences among Dutch minorities can be partly attributed to a differential response style. During the first phase of the cognitive interviews, we present the same items that are analyzed in the statistical model to a purposively selected sample of members of these cultural minorities in a similar fashion as a regular survey interview, that is, without providing further information, to attain comparability with Study 1. In the second interview phase, we probe the interviewees retrospectively about a selection of questions that elicited nonequivalent answers across minorities in the quantitative study or to which the interviewees demonstrated problems during the first interview phase. The probes either focus on interpretation “what does this word mean to you?” the answer categories “what makes you choose this category?” or the type of argumentation “why do you agree while giving counterarguments?” The interviewees’ justifications of their answers are analyzed qualitatively and related to the cross-cultural differences found in the quantitative study.
Data collection
In this study, we compare the answers to the Social Position and Use of Welfare Provisions by Migrants survey (SPVA) survey collected in 2002 among the four largest minorities in the Netherlands, 1 namely Turkish, Moroccan, Surinamese and Antillean people. The last two groups have—coming from former Dutch colonies—an advantage as they are more accustomed to the Dutch language, heritage, and culture (CBS, 2005). We included 15 attitude statements measured on a Likert-type scale, each having five ordered response categories that range from totally agree to totally disagree. These items operationally define three attitudes, namely the attitude toward the Netherlands, the endorsement of traditional family values, and the autonomy of children within the family. Given the substantive nature of these constructs, the minorities are expected to be subject to culturally specific sources of measurement error and possibly derive their answers to these attitude statements from systematically differing response processes. Table 1 reports descriptive statistics of all items included in the analyses for the four cultural groups:
Mean observed item response per ethnic group (N = 3549)
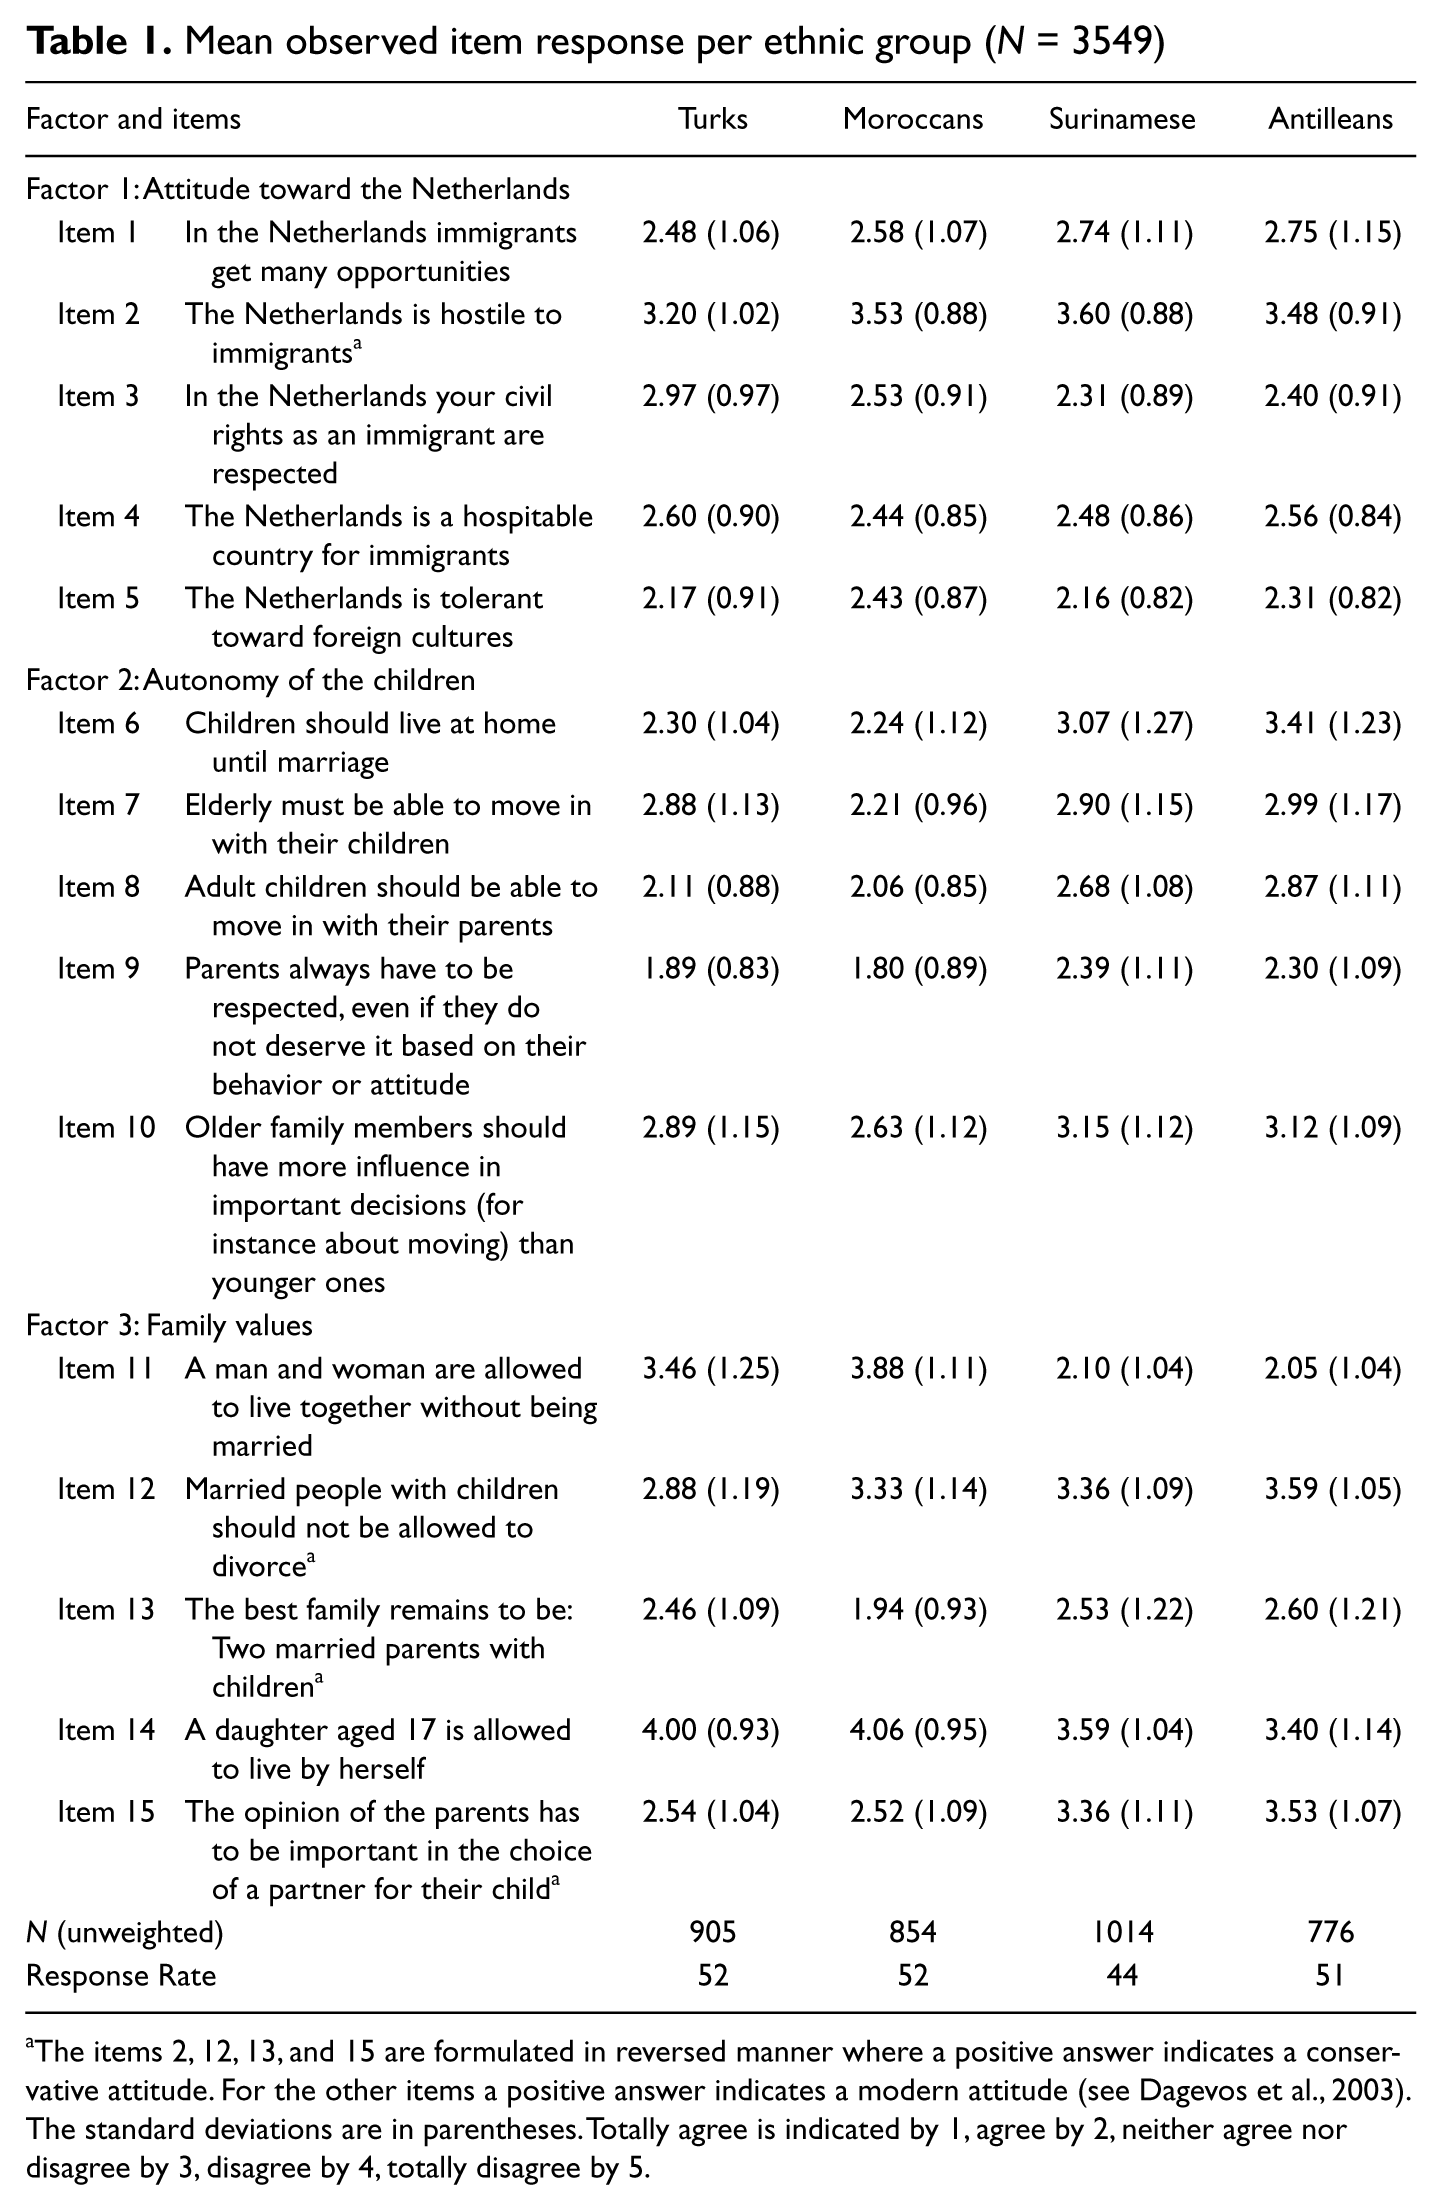
The items 2, 12, 13, and 15 are formulated in reversed manner where a positive answer indicates a conservative attitude. For the other items a positive answer indicates a modern attitude (see Dagevos et al., 2003). The standard deviations are in parentheses. Totally agree is indicated by 1, agree by 2, neither agree nor disagree by 3, disagree by 4, totally disagree by 5.
In addition, we held cognitive interviews from December 2009 until October 2010 among 24 interviewees who were recruited via unrelated contact persons, organizations, and personal contacts to avoid overlap in social background. We aimed for a heterogeneous sample as previous studies showed that the style of responding was systematically related to multiple socioeconomic characteristics. We interviewed 7 ethnic Moroccan, 7 ethnic Turkish, 5 ethnic Antillean, and 5 ethnic Surinamese interviewees. Among them, 12 interviewees belong to the second generation of immigrants, 13 interviewees are highly educated, 10 interviewees are female, 8 interviewees are older than 40, and 4 interviewees are younger than 26. The interviews lasted 45 minutes on average and were conducted at the interviewee’s home (14), at Tilburg University (5), at a public place (3) or at the workplace (2). During 8 interviews a research assistant was present who helped with transcribing and coding. Five interviews were excluded from further analyses because 2 interviews were used as a pilot, 2 interviews were conducted among family members, and 1 interview was conducted in another language using a translator. In general, some of the lower educated interviewees 2 displayed difficulties in understanding the purpose of the cognitive interviews. Presumably, a straightforward think aloud interview would have been more suitable but we persisted with the two-phase interview to maintain comparability with the other interviews.
Study 1: Measurement Nonequivalence and Response Style
Latent Variable Approach
Within the Latent Variable Modeling framework, attitudes are defined as complex theoretical constructs for which multiple empirical indicators that reflect important aspects of the attitude are needed to obtain a valid and reliable measurement of the construct (Bollen, 2002; Skondral & Rabe-Hesketh, 2004). In this approach, an attitude is modeled as a latent—unobserved—variable (also called factor or trait) for which survey questions (hereafter called items) are used as the indicators or observed variables. One important assumption in cross-cultural research is measurement equivalence (or measurement invariance): Each respondent with a certain attitude level should respond similarly to the items irrespective of his or her group membership (Meredith, 1993). Note that measurement equivalence allows for group differences in attitudes but not for group differences in the indicators, conditional on the attitudes. There is evidence for measurement nonequivalence when particular model parameters significantly differ across groups (Vandenberg & Lance, 2000).
Figure 1 depicts a latent variable based measurement model in which there is nonequivalence with respect to the first item. As can be seen, latent variable F is related to items Y1 to Y5. The group variable G is related to F indicating a group difference in the attitude, but also directly related to the first item indicating group differences in the intercepts. Finally, G also moderates the association between F and the first item indicating group differences in the factor loadings. Note that usually measurement nonequivalence occurs across several items simultaneously. The models that we test in this article are more complex than the model depicted in Figure 1. They contain three related attitudes (three latent factors) measured by five items each (see appendix). The unrestricted models allow for group differences in both the intercepts and the factor loadings in each of the 15 items. The effect of attitudes on item responses is distinguished from the effect of a response style (RS) by estimating models in which each of the three item subsets is affected by one attitude and all items are affected by a latent response style factor (Billiet & McClendon, 2000; Cheung & Rensvold, 2000). The response style is measured in an explorative way allowing the style factor to relate linearly as well as nonmonotonically to the items. Thus, the factor is able to detect response patterns induced by systematically selecting extreme or adjacent categories, midpoint responding, and to lesser extent—the item scales are unbalanced—acquiescence (Billiet& McClendon, 2000). Based on a post hoc analysis of the parameters, we are able to deduce which response style is captured by the factor (Moors, 2003; Morren, Gelissen, & Vermunt, 2011).

Measurement nonequivalence in a 1-factor model
To test for cross-cultural differences in responding, we compare unrestricted models—that allow for all possible group differences—with models assuming certain parameters to be equivalent across minorities. Table 2 reports the log-likelihood and Bayesian Information Criterion (BIC) values for the most relevant models. The BIC values can be used to compare models with one another: The lower the BIC value the better the model is in terms of fit and parsimony. Note that the models without and with the RS factor are nested. 3
Model selection estimated with SPVA data (N = 3549)
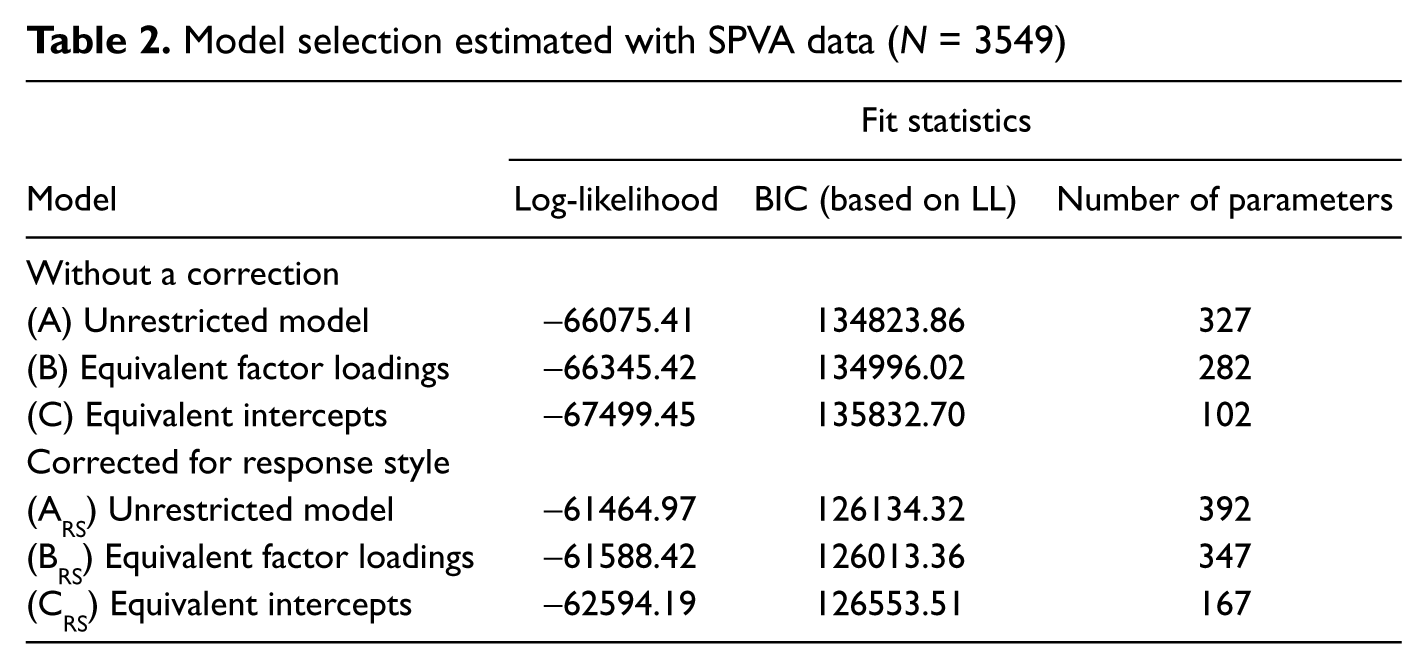
The BIC values in Table 2 show that there is evidence that ethnic minorities interpret the items differently after controlling for attitude differences. As indicated by the fact that Model A has a lower BIC value than Models B and C, these differences are visible in both the item intercepts and the factor loadings. Moreover, inclusion of the style factor improves the model fit considerably; the models with a style factor have a lower BIC value than their counterparts without a style factor. We also find that the style factor accounts for the group differences in the factor loadings; that is, after controlling for the RS factor, the model with equal factor loadings (Model BRS) is preferred over the model with unequal factor loadings (Model ARS). In summary, we find that there is measurement nonequivalence between Dutch ethnic minorities and that nonequivalence can partly be attributed to the response style factor.
For the purpose of the current study, we are mainly interested in the findings pertaining to the response style factor. Morren et al. (2011) provide more details on how to interpret this response style factor. To avoid making too strong assumptions about the distribution of respondents along the underlying RS dimension and to simplify its interpretation, we defined the RS factor to be a discrete latent variable with three ordered categories 4 (Magidson & Vermunt, 2001; Vermunt & Magidson, 2005). Based on a post hoc interpretation of the parameters, it can be concluded that the first category (latent class) captures the tendency to prefer extreme categories (i.e., totally agree and totally disagree), whereas the third category captures the tendency to avoid extreme categories and select the adjacent categories (i.e. agree and disagree), given the attitudes. In other words, respondents who prefer extreme categories have an Extreme Response Style (ERS) and are likely to belong to the first category, whereas respondents who prefer adjacent categories have an Adjacent Response Style (AdjRS) and are likely to belong to the third category. Respondents with no particular response style (NoRS) are likely to belong to the second category measuring a position in between the other two latent categories.
Effects of covariates
Cross-cultural differences in the preference for extreme response categories have been related to language use (Bachman & O’Malley, 1984; Gibbons, Zellner, & Rudek, 1999), collectivist-individualist values (Harzing, 2006; Johnson, Kulesa, Cho, & Shavitt, 2005) and acculturation (Davis, Resnicow, & Couper, 2011; Marin, Gamba, & Marin, 1992; Perreira, Deeb-Sossa, Harris, Mullan, & Bollen, 2005; Van Hemert, Baerveldt, & Vermande, 2001). We have related educational attainment, language proficiency, gender, and generation of immigration to the style factor but only the last variable related significantly to the response style. Therefore, we focus on how the acculturation process—the settlement of immigrants into the receiving society—may influence the way in which people interpret survey questions thereby leading to measurement nonequivalence (Van de Vijver & Phalet, 2004). Acculturation may also affect response style because cultural minorities may either accommodate to the values of the culture corresponding to the language in which the survey is conducted (Harzing & Maznevski, 2002; Oyserman, Sakamoto, & Lauffer, 1998; Ralston, Cunniff, & Gustafson, 1995), or affirm their ethnic background (Bond & Yang, 1982; Marin, Triandis, Betancourt, & Kashima, 1983). For instance, Van Hemert et al. (2001) show that more acculturated Dutch minorities respond more positively to individualistic-formulated questions than the less acculturated minorities. Marin et al. (1992) relate a validated acculturation scale to the use of extreme response categories among Hispanics and non-Hispanics in the United States. Davis et al. (2011) explored why less acculturated Hispanics more frequently use response styles and find that extreme or acquiescent responding is related to cultural concepts (e.g. machismo). Contrary to these studies but similar to Perreira et al. (2005), we used the generation of immigration 5 as an indicator of acculturation because no validated scale was available in the SPVA data set. Similar to the group variable G in Figure 1, the covariates ethnicity and generation of immigration are assumed to affect the response style measured by the latent variable RS. The results are presented in Table 3.
Effects (logit coefficients) of ethnicity and generation of immigration on the response style in model CRS

Note: Standard errors are shown between parentheses. According to the Log-Likelihood Ratio Test, including the variable generation of immigration improves the model fit of model BRS (ΔLL = 7; Δdf = 2, p = .029).
Table 3 shows the model parameters related to each category of RS in Model BRS with and without the covariate “generation of immigration.” In both models, we hold constant for differences in ethnic background. The parameters are logit coefficients based on effect coding, which implies that they sum to 0 across latent classes and covariate categories. A negative (positive) value indicates that a certain combination is less (more) likely to occur than average. According to Model BRS Surinamese respondents are more likely and Antilleans less likely to use AdjRS. Turkish respondents are less likely to belong to the category NoRS, whereas Surinamese and Antillean people are more likely to belong to this category. Finally, Turkish people are more likely to use ERS as a response style, whereas Surinamese people are less likely to use ERS while responding to attitude statements. An explanation for this finding is given by Van de Vijver & Phalet (2004) who suggest that—similar to Afro-American respondents (Bachman & O’Malley 1984)—Surinamese respondents may have developed their own variation on the Dutch language using fewer negative connotations. Controlling for generation of immigration (Model 2) does not alter these group differences in RS. Holding constant for differences in ethnic background, respondents belonging to the second generation are more likely to use no response style (NoRS—that is, not ERS or AdjRS). In summary, these findings indicate that both ethnicity and generation of immigration are related to the (non)usage of a response style.
Classification
Based on the model estimates resulting from the quantitative analysis (Study 1), we assign a response style to the interviewees in the qualitative study (Study 2). We have two reasons to classify the interviewees based on the model estimates of the most parsimonious model CRS. First, as the number of parameters increases, the classification of the respondents becomes more uncertain. Second, great uncertainty exists about the nature of the purposive sample in the qualitative study, which is why a relatively simple and parsimonious model may be more appropriate. Among the extreme responders, two out of three interviewees and among the adjacent responders four out of five interviewees belong to the first generation. A few interviewees of the first generation (2 out of 8) and a majority of interviewees of the second generation (9 out of 11) do not endorse a response style. Note that the quantitative analyses point in a similar direction (see Table 3).
Study 2: Investigating Response Strategies in the Response Process
Cognitive Interviews
To analyze the qualitative data from the interviews, we developed a code list, consisting of 75 codes in total, based on the survey response theory. In fact, the six main categories resemble the phases in the response process: (a) understanding wording, (b) understanding syntax, (c) judgment & argumentation, (d) mapping, (e) behavior, and (f) response process. The final two codes treat editing, whilst the first two codes interpretation and understanding. The only phase not coded is information retrieval as we found that respondents rarely discuss this process explicitly. Using this coding scheme, we paid attention to (a) type of arguments, and (b) argumentations style.
Type of arguments
All respondents’ arguments were coded according to the main categories above. First, arguments treating the interpretation of the wording were further divided into problems with auxiliary verbs, ambiguous words, adjectives and hidden assumptions. The interpretational problems with the syntax considered misunderstanding that could be attributed to the structure of the question (subordinate clauses, negative questions). Second, in justifying their answers, some interviewees predominantly refer to their personal experiences or to abstract notions transcending their own situation. We coded arguments as personal when the interviewee (a) relates his or her opinions to personal experiences, (b) emphasizes that something is only valid to him or herself, or (c) actually discusses personal behavior. An argument is coded as general—or abstract—when the interviewee (a) talks in general terms, (b) refers to his or her own life in a distant manner or (c) emphasizes other opinions. The arguments treating the mapping of the judgments were coded separately.
Argumentation style
We also coded the tone in which the arguments were brought forward. An interviewee with a convincing argumentation style seeks to persuade the interviewer of his or her norms and values, arguing in a firm manner without considering the relative value of the statements. Contrastingly, an interviewee endorsing a contemplative argumentation style argues thoughtfully, weighs arguments for and against, and carefully chooses words. Although most interviewees alternately employ—depending on the type of question—both argumentation styles throughout the interview, some interviewees use one style predominantly. Note that each argument is coded separately.
Response strategies
By distinguishing patterns in how the codes treating the type of arguments overlap with codes treating the argumentation style, we derive three separate response strategies for justifying answers.
Table 4 illustrates the differences between the response strategies. We assign five interviewees who systematically exclude personal information using a contemplative argumentation style to an attitude-detached response strategy, four interviewees who repeatedly use behavioral statements in a convincing manner to a behavioral response strategy, and nine interviewees who alternately use general and personal arguments in a mixed argumentation style to an attitude-balanced response strategy. Note that one interviewee could not be classified as he scored high on presenting general arguments in a convincing style.
Response strategies and use of arguments and argumentation style
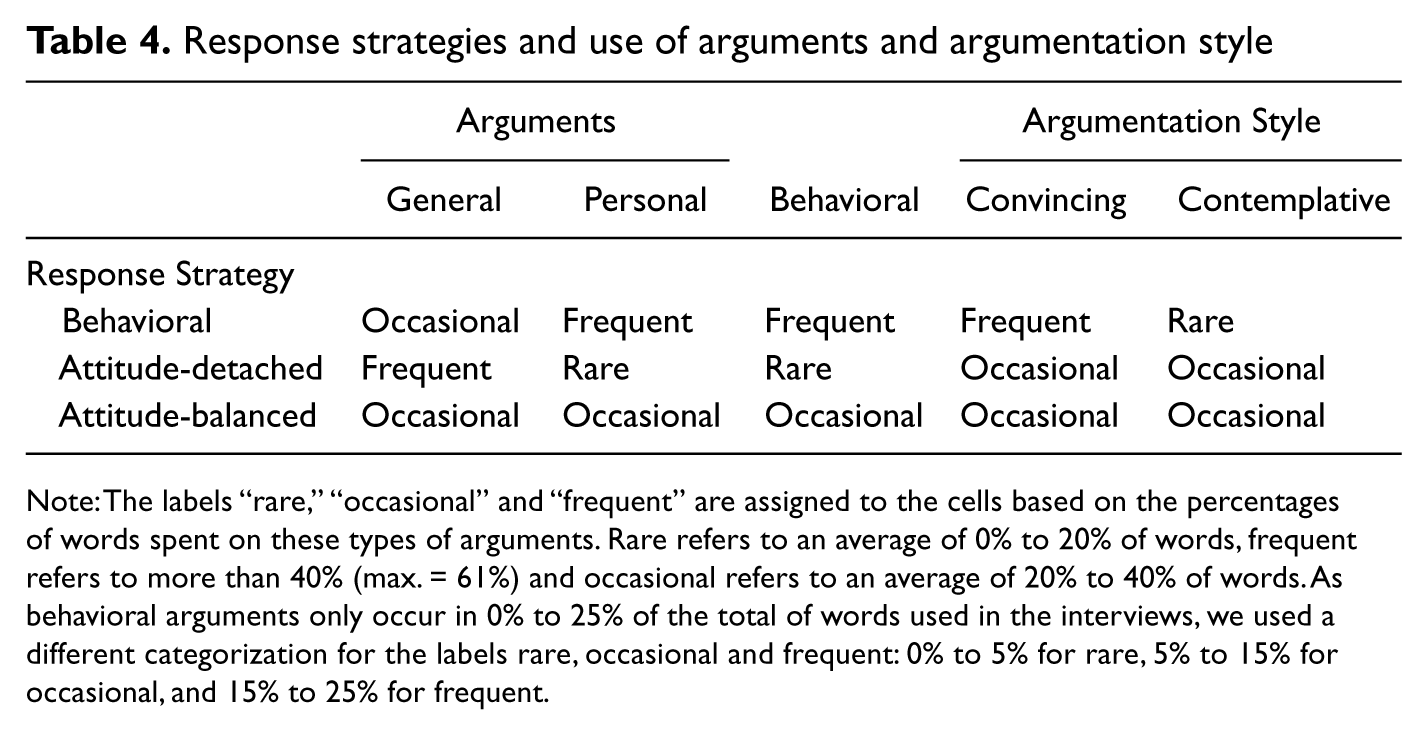
Note: The labels “rare,” “occasional” and “frequent” are assigned to the cells based on the percentages of words spent on these types of arguments. Rare refers to an average of 0% to 20% of words, frequent refers to more than 40% (max. = 61%) and occasional refers to an average of 20% to 40% of words. As behavioral arguments only occur in 0% to 25% of the total of words used in the interviews, we used a different categorization for the labels rare, occasional and frequent: 0% to 5% for rare, 5% to 15% for occasional, and 15% to 25% for frequent.
Behavioral response strategy
Interviewees who consistently answer using information about their own behavior interpret the attitude questions as if the interviewer asks about their actual personal behavior in certain situations. After the interviewer has asked them to repeat the question in their own words, they say something like: “You want to know if my parents have something to say about whether I move out?” Thinking of personal experiences can have two effects on responding: If the personal experiences support their general opinions about a subject, interviewees are likely to give a clear (possibly more extreme) answer; however, if the personal experiences contradict their opinions, they are likely to give an ambiguous (possibly less extreme) answer (Tourangeau et al., 2000, pp. 185). We find that interviewees who use personal experiences to support their attitudes often use a more convincing manner to present their arguments. An ethnic Turkish male (21) who scores high on behavioral response strategy, agrees to item 9: “I would always treat my parents very well, especially because of how they treated me until now, they raised me and uh, they made me a man.” In contrast, other interviewees integrate personal information while simultaneously regarding alternative situations in which their attitudes might not apply. An ethnic Surinamese female (27)—also agreeing to item 9—argues: “I can always count on them, they do everything for me [. . .] If I wouldn’t like their behavior or attitude, I would say something about it but that doesn’t mean I would respect them any less.” We illustrate these differences in a behavioral argumentation strategy in Figure 2.
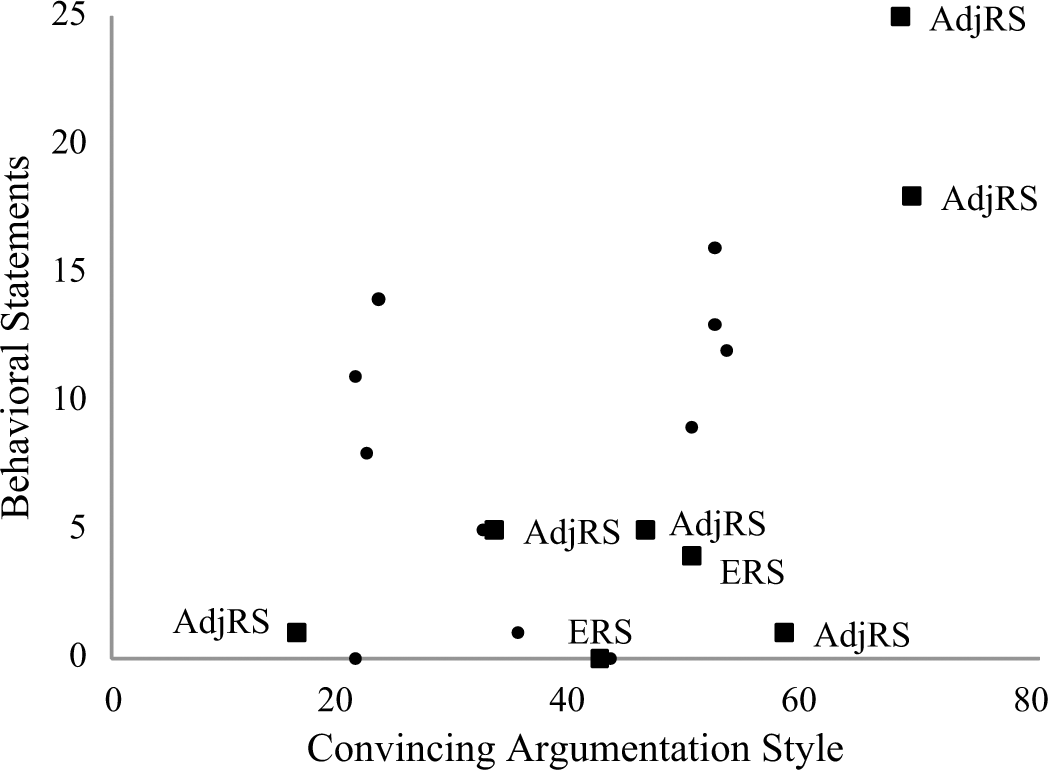
The use of behavioral statements and convincing argumentation style
In Figure 2 we plot interviewees along two dimensions by counting the words used in arguments that are either coded as arguments referring to personal experiences or arguments given in a convincing manner. The interviewees in the upper right corner use a behavioral response strategy, except for one interviewee who in addition uses many general arguments.
Remarkably, interviewees employing a response style (ERS or AdjRS) score either high or low in behavioral statements. Six out of ten interviewees using 5% or less of their words and four out of six interviewees using more than 50% of their words on behavioral statements systematically select or avoid extreme categories. We suggest that excluding personal information makes it easier to systematically translate ideas about surveys, the question topics, and the question format into particular response categories. For example, one interviewee retrospectively argues: “I didn’t think of a family situation at first, [. . .] that is the difference I guess. So earlier I answered without considering my own family and when I think about it now, I come to a different conclusion.” He changes his response from agree to totally agree after including his personal experiences. We also observe the opposite: Personal experiences that intensify attitude conflicts may lead to less extreme judgments. For instance, a single woman argues in agreeing to item 13: “To say ‘totally agree’ would imply that I do not approve of my own family situation.”
Attitude-detached response strategy
Interviewees, who shun personal information by avoiding their ethnicity or personal experiences, use a detached response strategy. They reveal only part of their attitudes through abstract, general reasoning. At some point, eight interviewees explicitly argue that they do not want to generalize their personal experiences, take their culture as abstract reference point, or give a general view on society. Two of them even declare in advance: “I will interpret the questions generally, not personally.” An interviewee using an attitude-detached response strategy argues vaguely: “That is the traditional image that everybody longs for eventually, I think, to be together but also to have children to live for.” Some mention their own norms and values in a somewhat distant manner: “You should be there for your child, no matter what” or “That is the habit in our culture, yes, here in the Netherlands it is different.” Some of these interviewees explain why they use general arguments: “My personal opinion does not mean that everyone should have the same opinion.” We plot the interviewees in Figure 3 with respect to whether they use general arguments in a contemplative manner.

The use of general arguments and contemplative argumentation style
In Figure 3, three interviewees using a detached response strategy are placed in the center (meaning they use 50% of their words on general arguments), the other two are located in the upper middle and upper right corner. Four out of five adjacent responders are located in the center of the graph, suggesting that the use of an adjacent response style is related to an average amount of general arguments. Apart from this finding, Figure 3 does not illustrate any relation between the attitude-detached response strategy, ERS or AdjRS.
Attitude-balanced response strategy
Interviewees with an attitude-balanced response strategy form an opinion by integrating thoughts and experiences across several domains: Personal surroundings, the host country and their cultural background. First, we suggest that interviewees with an attitude-balanced response strategy focus on unique characteristics of the questions instead of responding similarly to all attitude questions. As they integrate several sources of information dependent on the topic of question, they react in a more balanced way and are less likely to be categorized by a response style than others. Only two out of nine interviewees using this attitude-balanced response strategy are subject to a response style.
Response strategies, ethnicity and generation of immigration
After identifying the response strategies, we examine whether the interviewees’ ethnicity and their generation of immigration are systematically related to the response strategies that they use. The qualitative data suggests that the generation of immigration is related to the response strategy used by the interviewees. Specifically, we find that the interviewees who are less acculturated than others predominantly use personal arguments or mainly present arguments in a convincing way. Table 5 reports the percentage of words used during the interview in presenting arguments, averaged across the first-generation interviewees (10) and the second-generation interviewees (9).
Amount of words used in justifying answers among first and second generation (percentages)

Note: The percentages are obtained by dividing the words spent on these types of arguments by the total number of words spent on the retrospective justification of the answers. The items 1 to 15 are described in Table 1.
Table 5 indicates differences between the first and second generation interviewees in three aspects. First, first generation interviewees more often use a convincing argumentation style than a contemplative argumentation style. In contrast, second generation interviewees use the contemplative and convincing argumentation style to similar degree. Second, interviewees belonging to the first generation rather use more personal than general arguments when answering questions about the attitude toward the Netherlands, whereas the interviewees belonging to the second generation answer personally to questions about family matters. Third, whereas interviewees belonging to the first generation use information related to both personal experience and the ethnic background when explaining their response, the second generation interviewees avoid ethnic background. This finding could indicate that the interviewees from the first generation more likely affirm their own ethnic background (Marin, et al., 1983), whereas interviewees of the second generation more likely accommodate their answers to the cultural majority (Ralston, et al., 1995).
Table 5 also illustrates that the ethnic background is rarely referred to by the interviewees in a direct way, which could also be related to the diffuse distinction between personal and cultural experiences (Smith, 1998). With respect to ethnicity, we find that the Moroccan interviewees of both first and second generation use an attitude-balanced response strategy. This finding is in accordance with Phalet and Schönpflug (2001) who attribute a more acculturated lifestyle to Moroccan than to Turkish respondents. Similarly, Stevens, Pels, Vollebergh, & Crijnen, (2004) find that the majority of Moroccan respondents score high on identification with the Dutch as well as the Moroccan culture. This acculturation style is referred to by Berry (1990) as integration: Those who feel close to the values of the host society as well as their ethnic background. Presumably, ethnicity mainly plays a role in the response process through the mode of acculturation that differs across minorities.
Conclusion and Discussion
In this article, we demonstrate that cross-cultural differences in responding are related to a differential response style, that is, the preference for response categories across a large set of items treating diverse topics. Similar to Krosnick (1991), we argue that respondents employ response strategies to deal with the difficulty of responding to an attitude statement. Especially for minority respondents, responding to an attitude statement requires several decisions: Should they focus on their personal situation, their cultural background, or the norms and values of the majority? Ideally, respondents have beliefs, impressions and prior judgments in each situation; they attribute importance to these beliefs accordingly and base their judgment on a balanced summary of these “weighted” beliefs. Cross-cultural differences in responding may result if the respondents avoid the complexity of making a balanced judgment by focusing primarily on their personal situation, their cultural background or the degree to which they relate with the host culture. Our findings suggest that interviewees who exclude personal information or purposively relate all questions to their own experiences are more likely to use a response style (ERS or AdjRS) than the other interviewees. If their answers depend on their personal situation or ethnic background, cultural specific traditions, habits, or topics that are considered taboo become more important. This may result in culturally diverse response styles violating measurement equivalence.
When considering ethnic background, we find that all ethnic Moroccan interviewees use an attitude-balanced response strategy, which might indicate that compared to the other Dutch minorities, the Moroccan minority is more culturally aware while remaining loyal to their ethnic culture. A similar mixed pattern of Dutch values separation versus integration among Moroccan migrants is found by Stevens et al. (2004). This combined strategy of comparing themselves with the in-group while simultaneously disengaging from the ethnic characteristics perceived as negative in the Dutch society might be induced by the stigma they receive (Padilla & Perez, 2003). Some questions we pose in the interviews (i.e., the attitude toward the Dutch society) evoked more personal reactions among first generation than second generation migrants, which might be related to a strong identification with their ethnic heritage. Davis et al. (2011) find that extreme responding among Mexican Americans is positively but also negatively associated with several concepts specific to the Mexican culture. Similarly to Davis et al. (2011), we find that response style usage by respondents of the first generation is likely to be related to the topic of the questions.
Note that our cognitive interviews were based on a relatively small purposive sample of interviewees with a limited number of persons per ethnic group, which makes the detection of patterns of response strategies more challenging. For instance, response strategies may vary by gender or education level, which in turn, may be related with ethnicity, language proficiency and immigrant generation. Although we aimed for diversity within the ethnic groups with respect to education and generation of immigration, the sample is fairly small to reveal such complex patterns. Nevertheless, an interaction of these variables may influence the use of response strategies. To improve especially cross-cultural survey designs, we suggest including a short introduction in which the researcher clarifies whether the domain of interest is the host country, the cultural background, or the personal experiences. This way, respondents who come from culturally diverse backgrounds may better understand what the researcher wishes to know. As a result, his or her responses may more validly reflect the construct that the researcher intends to measure and problems of measurement nonequivalence may be reduced.
Footnotes
Appendix
Here we provide more details about the Latent Class Factor Model with a response style we used in our analysis. This model was proposed by Moors (2003). Recently, Morren et al. (2011) extended this model by showing that it is better to treat the relationship between substantive factors and items differently from the relationship between response style factor and items. More specifically, in their relationship with the response style factor, the item responses are treated as nominal variables, yielding five category-specific parameters per item. This means that no assumptions are made about the form of these relationships. For the attitude factors, only one parameter is used per item because for this relationship the items are treated as ordinal variables. More specifically, we assume that
This is a hybrid between a multinomial and an ordinal logit model. The β’s are the item parameters to be estimated: β0jc is an intercept term for item j and category c, β1j,β2j and β3j are slope parameters corresponding to the three substantive factors, and β4jc are the slope parameters for the response style factor denoted by RS i . The parameters β1j, β2j, and β3j are multiplied by the category number c, which results from the ordinal specification for the relationships with the substantive factors. Note that some of these parameters are fixed to 0 because each item loads on only one substantive factor. The other model parameters are category specific.
The Latent Class Factor Model with a response style can be estimated with the Latent GOLD software, a general package for latent variable modeling (Vermunt&Magidson, 2008). This program also provides estimates for P(RPS i |Y), that is, the probability of having a particular response style given the provided responses. This feature is used in Study 2 in which we determined the response style for each of the interviewees.
Declaration of Conflicting Interests
The author(s) declared no potential conflicts of interest with respect to the research, authorship, and/or publication of this article.
Funding
The author(s) disclosed receipt of the following financial support for the research, authorship, and/or publication of this article: This research was supported by a grant from the Netherlands Organization for Scientific Research (NWO), grant number 400-05-164.