
Abstract
We describe methods of coding and analyzing historical and archaeological data for comparative analysis of premodern cities. As part of a larger study of spatial access to urban services, we identify eight relevant contextual domains and define variables for each domain. Information from publications on each city is assembled, and the data are coded independently by three scholars and checked for agreement. To date, we have completed contextual coding for 15 cities. Here, we focus on methods to analyze relationships among variables within contextual domains using two example domains—Class Mobility and Governance. Key methodological points involve the problem of missing data, multiple tests with an appropriate correction, and the importance of variation among cases for effective analysis of a domain. Our interpretation of preliminary findings highlights a degree of independence between two different arenas of social life that may relate to collective action. Documentation of our procedures contributes to a growing body of systematic, comparative, cross-cultural analyses of mid-size samples. This study is distinctive in its focus on cities rather than cultures, societies, or polities.
The comparative, interdisciplinary study of premodern cities is important today because rapid urban expansion is an ongoing global process with many implications for society. The majority of the world’s population now lives in cities, where many seemingly intractable social and economic problems are concentrated. Urbanism has too many dimensions to be understood by any single discipline, yet most current research reflects narrow disciplinary perspectives. A comprehensive understanding of cities and urban life demands both contemporary and historical perspectives. The study of earlier cities expands the variety of known urban forms and processes, and it counterbalances overly narrow conceptual approaches (M. E. Smith et al., 2016).
By examining access to public services in early cities—an important issue for contemporary urban society (Lobao, Hooks, & Tickamyer, 2007; Wolch, Wilson, & Fehrenback, 2005)—we expand the comparative framework of urban studies (Stanley et al., 2016). Only through broad historical and comparative research can scholars distinguish common urban patterns from unique occurrences, or general trends from idiosyncratic events. However, comparing premodern cities with different urban traditions and geographical settings is challenging, given the absence of a comprehensive framework to systematically measure the social and spatial dimensions of ancient cities.
To address these challenges, we developed an interdisciplinary comparative project designed to study the antecedents of contemporary urbanism and explore causal dynamics of urban life, “Service Access in Premodern Cities.” This article focuses on the project’s theoretical background, coding, and categorical data analysis, with service access results set aside for later publication. To illustrate the application of our methods, we examine the relationships between two social domains of urban life that are critical to understanding cities throughout time: Class Mobility and Governance. For variables in these two domains, we ask how differences in governance might affect social inequality, such as upward mobility within the society. Existing research leads us to posit that more collective forms of governance will be correlated with higher levels of social mobility, whereas authoritarian regimes will exhibit less (Blanton & Fargher, 2008). Although we find no statistically significant relationships between variables, some are promising for continued examination. Many variables in the two domains appear to operate independently, indicating that in these complex societies, different facets of social life are not in lockstep with governance characteristics. Our analysis of Governance and Class Mobility is an important first step in our investigation of public service access in premodern cities and provides an opportunity to highlight our methods for cross-site comparison.
Background
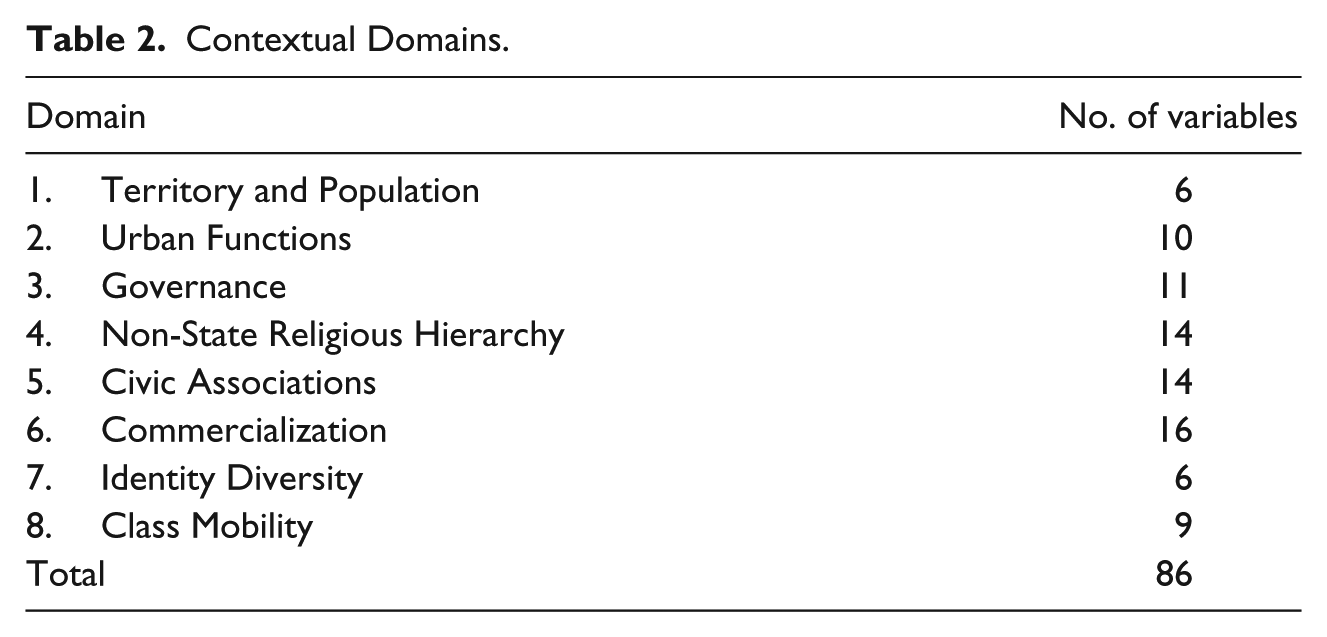
Our goal was to design a mid-range comparative project to examine variation in service access in premodern cities. To quantify this variation, our project assesses differences in neighborhood or district access to three categories of public service facilities: assembly space, religious structures, and commercial locations (Dennehy, Stanley, & Smith, 2016; Stanley et al., 2016). We selected cases representing diverse urban traditions, using published maps to identify service locations (Table 1). We also searched published sources on each city and its cultural tradition for information about a number of cultural and social traits, or variables. We coded and grouped related variables under what we refer to as contextual domains (Table 2). These domains include social topics such as Governance and Class Mobility (the examples used here), as well Commercialization, Non-State Religious Hierarchy, Identity Diversity, and Civic Associations. Other domains are more descriptive (Territory and Population, Urban Functions). Our questions necessitated both qualitative and quantitative methods (digitizing, spatial analysis, literature collection and analysis, coding, and statistical analysis), which required a multi-disciplinary social scientific team. Although ambitious, we believe our approach is amenable to many questions that cannot be answered within a traditional discipline utilizing existing large-n databases or more typical small-n comparisons.
The Sample of Cities.

Note. M indicates missing data. City abbreviations appear in other tables.
Contextual Domains.
Our contextual domains and variables are designed to monitor both governmental and non-governmental aspects of urban life to gauge the extent of collective or corporate actions versus autocratic central authority. This theoretical interest reflects recent efforts to examine variability in premodern states using concepts from the literatures on collective action, cooperation, and complexity theory (Blanton & Fargher, 2008; Carballo, 2013; Carballo, Roscoe, & Feinman, 2014; Feinman, 2011). We employ a broad concept of collective action, including consideration of corporate groups in cities, not solely focusing on their relationships to government, although that is important. Corporate or grassroots influences on urban services are accommodated in varied theoretical perspectives we recently reviewed (M. E. Smith et al., 2016): ideas related to the formation and coherence of communities, power differentials as addressed in critical theory and political ecology, and the modern examination of co-production of urban services and public choice theory.
In this article, we review past approaches to coding variability in complex societies and describe our methods of contextual coding, including efforts to insure reliable comparisons for contextual information. We focus on our program of gathering, coding, and analyzing systematic contextual data to facilitate comparative work by scholars interested in similar questions. Figure 1 diagrams the research steps in the project and acts as a basic outline for the organization of this article.

Research steps in the project “Service Access in Premodern Cities.”
Approaches to Coding Variability in Complex Societies
Coding cultural and social traits in complex societies for comparative analysis has a long, complex history, with many efforts directed at whole societies; see recent reviews by Morris (2013) or M. E. Smith and Peregrine (2012). The nature of one’s codes and samples depends on the approach to comparative analysis. Social scientists recognize a continuum of approaches that runs from systematic comparative studies—many cases and few variables—to intensive studies—few cases and many variables (M. E. Smith & Peregrine, 2012). Ragin and Amoroso (2011) recognize this contrast as part of their three-part distinctions among comparative studies, and 6 and Bellamy (2012) present a similar tripartite division. Within anthropology, the premier example of systematic ethnographic comparative data is the Human Relations Area Files (HRAF; http://hraf.yale.edu/). HRAF-style research has well-developed methods for coding and analysis (C. R. Ember & Ember, 2009) and has stimulated a large body of empirical studies (see “Explaining Human Culture,” http://hraf.yale.edu/ehc). Most comparative research by anthropologists and archaeologists, however, lies at the intensive end of the continuum, in which two or a few cultures or societies are compared based on rich contextual data (e.g., A. T. Smith, 2003).
In the past decade, comparative research in the middle range between systematic and intensive approaches has expanded. Many earlier studies, such as Robert McC. Adams’s (1966) comparison of two early states, or Bruce Trigger’s (2003) comparative analysis of eight early states, were qualitative in orientation. More recently, systematic comparisons of samples of approximately 30 cases have become more common, such as the Seshat Global History Databank including 30 premodern geographically localized cultural traditions (Turchin et al., 2015). An important predecessor of our project is the analysis of agency and collective action in 30 premodern polities developed by Blanton and Fargher (2008). Blanton and Fargher view state revenue sources as a key to the prominence of collective action and argue that reliance mainly on internal state revenues will promote more collective action; they contend that external revenues will be associated with diminished collective action and more autocratic forms of rule because the state is not as dependent on its subjects.
Blanton and Fargher’s (2008) work provides a model for our coding of domains and variables. Our dependent variables are focused on public service access, not collective action, but the tensions between collective actions via bottom-up processes versus top-down state control are incorporated into many of our variables. We hope to detect social and cultural factors related to the provision of accessible urban services, such as the prominence and resources of corporate groups, the extent of class mobility, and the degree of commercial activity, all factors that can contribute social leverage to improve access to urban services. The development of systematic contextual information about the cities is critical to examining public service in the larger comparative project, and it necessitated design of a new approach for these data. Whereas HRAF-style research compares cultures, Blanton and Fargher compare polities, and SESHAT compares localized cultural traditions, we compare diverse cities before the modern era. Our approach employs a blend of qualitative and quantitative information. We next describe the first crucial endeavor in that approach: selecting appropriate case studies for analysis.
Sampling Methods
Our approach to sampling is intermediate between the two poles of intensive and systematic sampling. We have more cases than is typical in case-study research (our sample in this article is 15 cities; Table 1), but not enough to employ most correlation-based statistical methods. When the project is completed, we expect our sample to comprise between 20 and 25 cities.
We have not located a published or established sample—analogous to the Standard Cross-Cultural Sample—that would be appropriate for our study, especially in view of our need for adequate maps for spatial analysis. The HRAF database (M. Ember, 1997) organizes data by cultures, not cities, and it lacks most of the urban variables needed for our analysis. The closest analog to our sampling program is Blanton and Fargher’s (2008) comparative analysis of premodern political systems. These scholars defined six geographical–cultural areas and selected several polities from each, for a total of 30 societies.
We initially planned to select separate samples for ancient archaeological cities and more recent cities analyzed by historians. This proved to be an artificial distinction, however. Many archaeologically documented cities also have useful historical data, and some historically attested cities have relevant archaeological findings. Instead, we designed our sampling program using the concept of the urban tradition. An urban tradition is a group of cities from a delimited region and time that share numerous cultural traits. Traditions can persist for periods ranging from decades to centuries. An urban tradition can be defined narrowly (e.g., 14th-century cities in southeastern Britain), or broadly (Medieval cities in Britain). Given the limitations of our sample size, most of our traditions are defined broadly. The spatial and chronological extent of our urban traditions is heavily conditioned by the availability of data. Our target is two or three cities from each of a number of diverse urban traditions (Table 1). Although this is clearly not a large enough sample to analyze variation within urban traditions, it does insulate us from relying too heavily on a single representative of each tradition. The cities selected are “premodern” in the sense that they are largely antecedent to effects of fossil fuel-driven industrialization or European colonization in their regions. Most have a significant agrarian economy, although commercial activity is prominent in many cases.
Perhaps the strongest influence on our sampling program is the availability of information. We require two kinds of data for each city: (a) a map to identify service facilities and neighborhood or district boundaries (in some cases we have to define them) and (b) sufficient documentation to allow coding of contextual variables. Many past cities have a period of peak occupation and activity with considerable spatial and contextual information that has led to greater scholarly attention. When we identified the period with the best published map for a city, the period often corresponded to the most extensive body of scholarship, and thus a large amount of contextual information. We used these time frames as our focal periods for data gathering (Table 1), following the lead of Blanton and Fargher (2008).
The Coding Process
Our coding process transforms textual information into data that are coded mostly as categorical variables. We employ basic methods of social science data coding (6 & Bellamy, 2012; C. R. Ember & Ember, 2009; Gerring, 2007, 2012). The process has six broad steps, listed in Figure 1.
Step 1: Establish Social Domains
The contextual information for each city is organized according to broad topics of interest in diverse social science fields. For each domain (Table 2), we conducted a literature review to identify relevant theoretical work. We developed an explicit rationale for each domain, justifying its inclusion in our coding process and indicating expectations for how the domain score will relate to our measures of service access. Finally, we considered how each domain should be scored so that cities can be easily compared within and among urban traditions. In general, higher values for variables indicate a greater likelihood of more collective action. Low to high scores mark the ends of a continuum of possible values, so that our coding procedure avoids categorizing cities into types. The variables, the scoring system, and the domains were fine-tuned in an iterative process through discussions of issues in pilot case materials. This process follows traditional inductive coding for content analysis, refined through initial pilot coding, as described by Cresswell (2013a).
We designed eight social domains with 86 associated variables (Table 2). Effects of the domains and variables on service access scores will be detected primarily when there are few missing data, when the cities vary in scores, and when effects of the independent variables are strong.
Step 2: Create Variables
After identifying our domains, we created specific variables to operationalize abstract topics with concrete observations, a deductive coding approach common in content analysis (Krippendorff, 1980). Table 3 lists the variables for the two example domains. Each variable represents a specific facet of its domain. Because we sought a coding system applicable to both historical and archaeological data, we included variables that might be more readily available in one field, but not necessarily the other. For example, in the case of class mobility, historical data may provide a list of the various castes or classes within a city known to historians, but such a list generally would not be available in a city known only through archaeological research. Because archaeologists are often interested in quantifying the degree of wealth inequality within a city (M. E. Smith, Dennehy, Kamp-Whittaker, Colon, & Harkness, 2014), at times they publish comprehensive, detailed data sets showing wealth distribution among households in a city that is well mapped—data that often are missing from historic accounts. We include variables that play to each field’s inherent strengths. When both types of data are available, the variables complement and reinforce each other, allowing us to create a stronger characterization of urban life in each city.
Variables for Class Mobility and Governance.
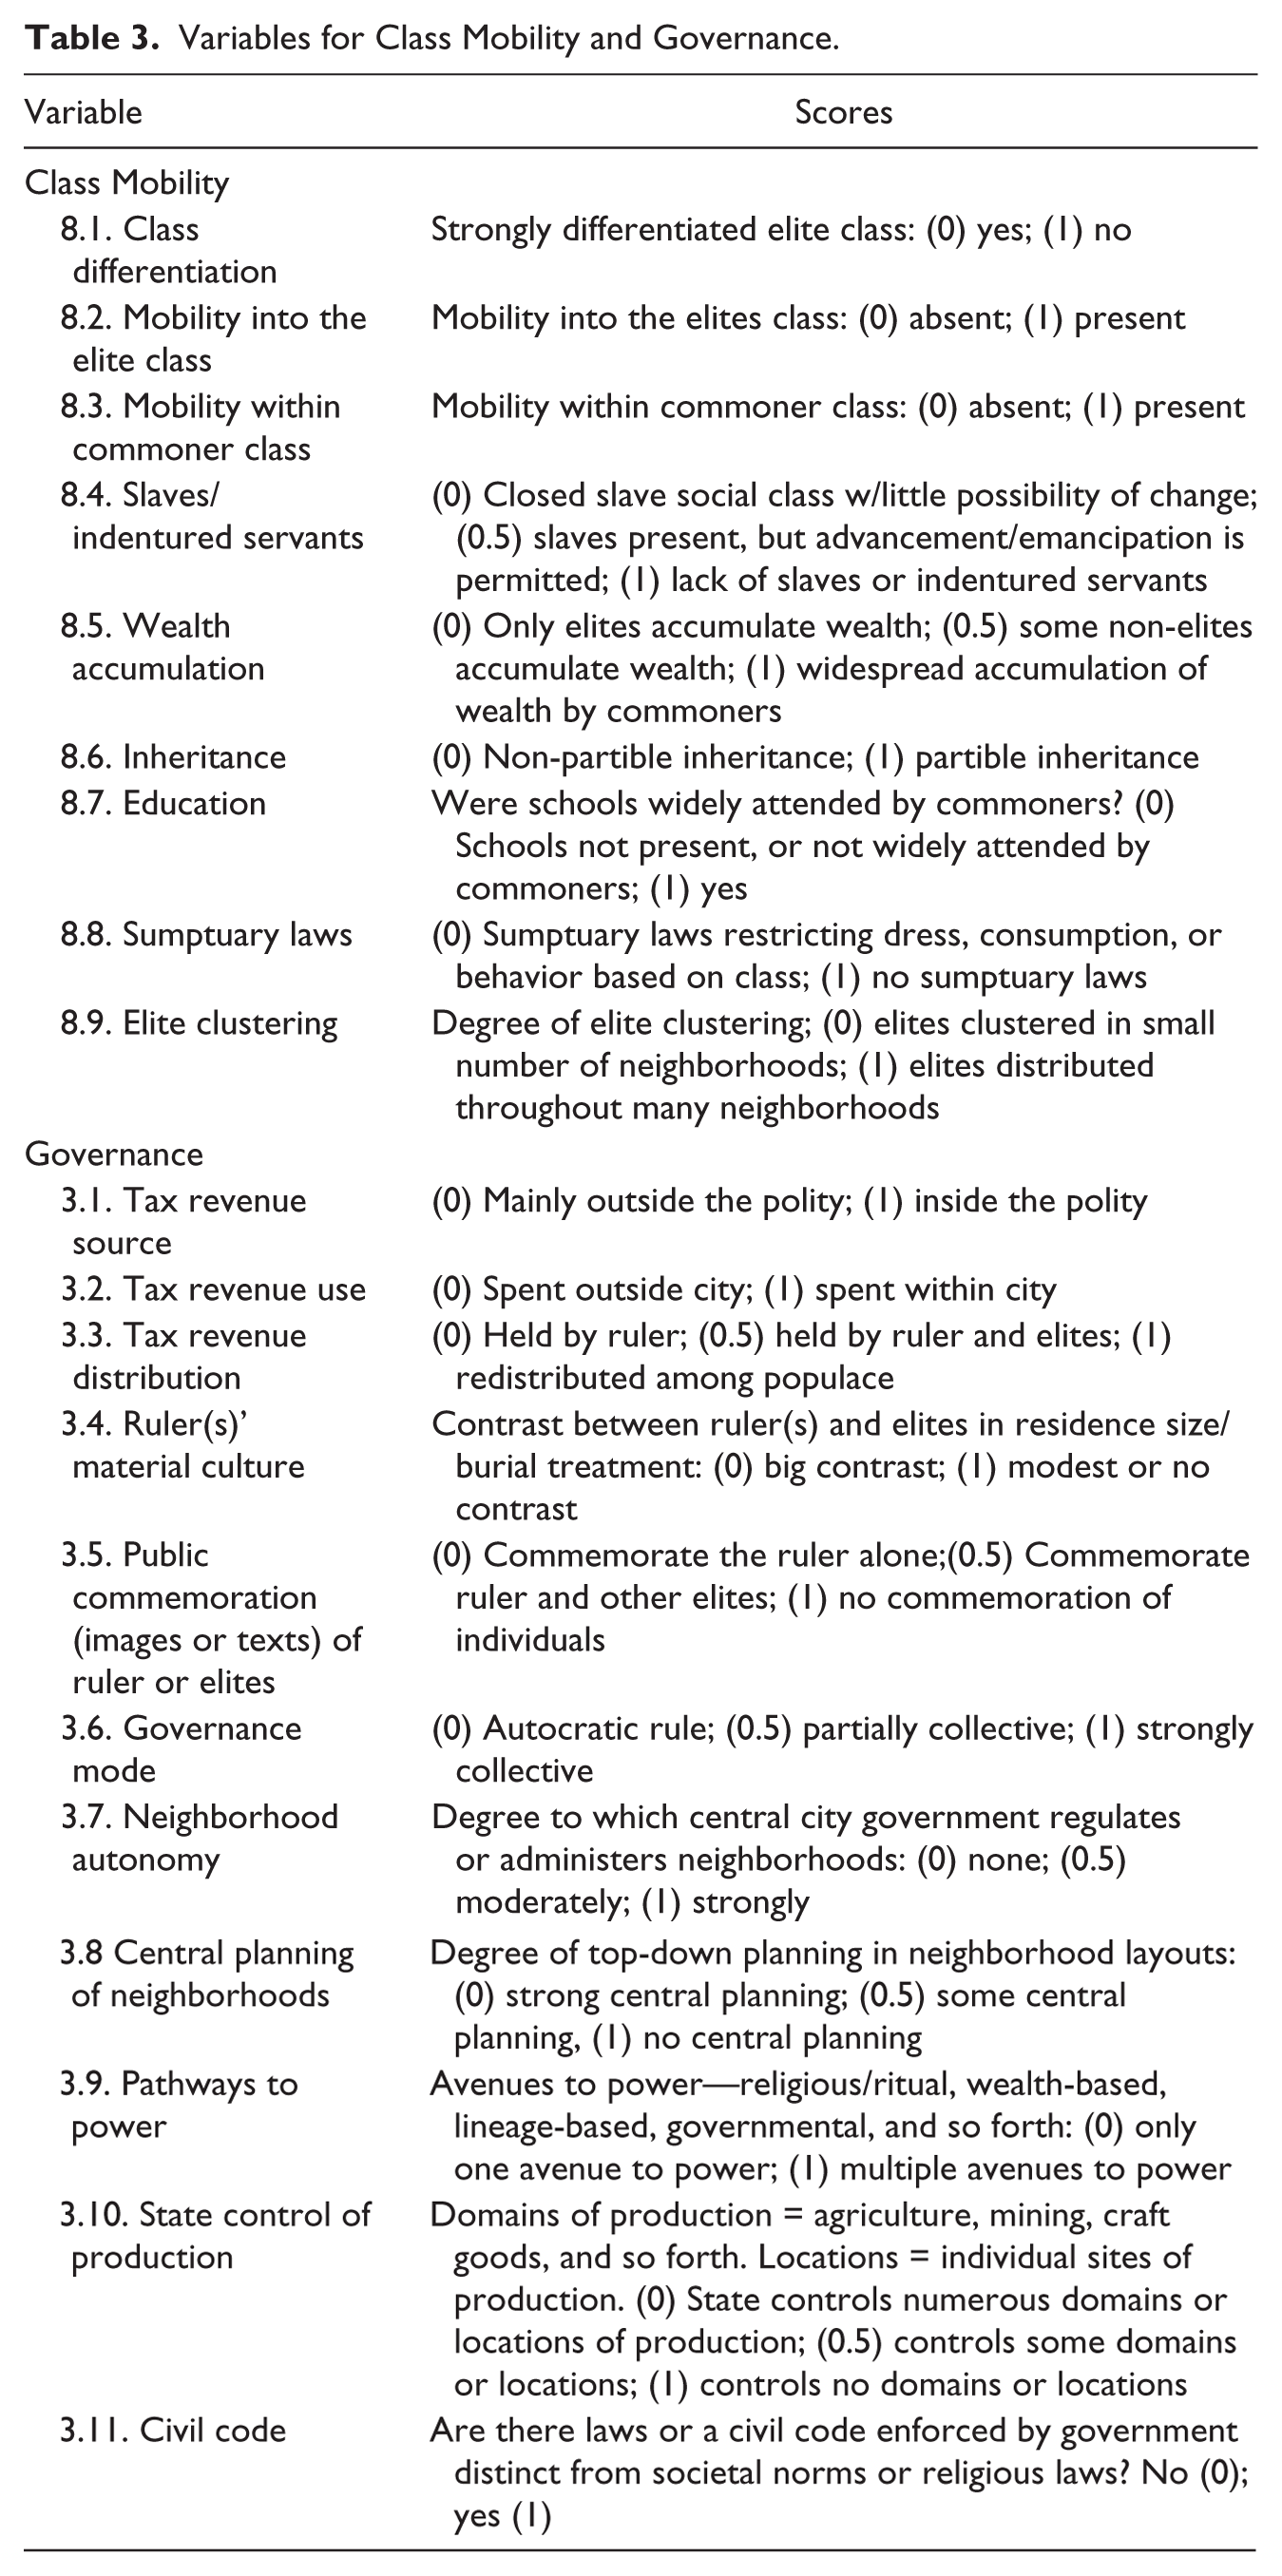
Variables are scored as either binary (0 or 1 for no–yes or absent–present) or ternary (0, 0.5, 1). Non-missing variables within a domain are used to create a domain score by calculating their proportion of the total non-missing maximum score for the domain, so that domain scores range from 0 to 1 (see Step 5).
Step 3: Compile Data From Published Sources
Once social domains and their specific variables were defined, we began coding city data. A senior project member begins the process by assembling a bibliography of published works on the city in the relevant time period. A team of student interns as well as project members examine the primary and secondary sources and compile the information most relevant to the social domains. We emphasize direct quotations from the published sources. After checking by a senior project member, these notes are compiled into a master document called the “city synthesis” that is organized by social domain and contains each variable’s definition, scope, and coding choices (see the appendix for an example of this template). It also contains the lengthy direct quotations and contextual data for each variable so that the textual information and the scoring criteria can be examined side by side. At times, information from the urban tradition is included in the synthesis and is used for scoring of a city. To take an example from our commercialization domain, if writing in commercial accounting is generally known for Japan during the focal period, it is reasonable to infer that writing was used similarly in Kyoto, even if the sources about that city do not mention it specifically.
Step 4: Scoring of Variables and Reliability
The scores for each city are coded independently by three senior project members. They work from the city synthesis, and fill in coding forms organized by domain and variable.
To counteract potential biases related to field of expertise, each team includes individuals from at least two disciplines. Generally, one team member has greater familiarity with the city information (usually through participation in the compilation stage or because of their research specialty), and we try to have at least one team member who has little or no knowledge of the city in question.
For each variable, the coder reads the compiled textual data and assigns a score based on the guidelines (e.g., Table 3). Variables with no data receive a score of “M” (for Missing; see section “Missing Data,” below). Researchers also rate the data quality as low, moderate, or high for each variable. This is a signal of the level of confidence in the assigned code. For our purposes, confidence is measured subjectively along two dimensions: (a) strength of evidence and (b) agreement among sources. This method follows recommendations by the Intergovernmental Panel on Climate Change (IPCC), a body which routinely considers multiple lines of evidence on a number of different factors gathered by disparate research teams (Adler & Hadorn, 2014). A data quality score reflects data strength based on the number of sources cited and the level of detail in sources, and the level of agreement among sources. Assigning data quality ratings allows each coder to indicate their confidence in the data and, thus, the score they assign to a given variable. Such ratings not only play an important role in the interpretation of results but they also play a more immediate role as each team attempts to arrive at a consensus score for each variable.
Step 5: Generate Consensus Scores
Using a spreadsheet of compiled scores, the three coders discuss their scores, paying special attention to variables for which they disagreed. They attempt to reach consensus for these variables through discussion about rationales for the scores assigned. Often, this allows a team member who has the greatest familiarity with the city to clarify information that may have been confusing, or provide some detail about the city or its cultural tradition that may have been missing from the synthesis. In addition, coders review data quality scores to see whether weak data or a lack of agreement among sources might be responsible for the disagreement about coding. Through these meetings, teams are able to assign a consensus score for each variable (Table 4).
Agreement Among Coders for Class Mobility and Governance.

Note. One hundred thirty-five variables coded for Class Mobility, average of 0.39 SD per variable. One hundred sixty-five variables coded for Governance, average of 0.38 SD per variable. SD = sole disagreements in initial coding (see text for explanation); CS = consensus score.
Although compilation of scores includes flagging discordant scoring for further discussion, it also allows comparison among cities according to the level of initial agreement among coders when the level and type of data differ dramatically. By quantifying the level of initial agreement among the project members, our project can identify individual cities or even entire urban traditions about which there is less agreement and, perhaps, lower confidence in scores or weaker data. We discuss discordance among coders further in the section “Intercoder Reliability” to assess the robustness of our results.
Although individual variables can be used in analysis, frequently we wish to see the effects of the domain on service access or we want to compare among domains. Once each variable in a given domain has received a consensus score, we calculate a score for the domain as a whole. Usually, this involves summing the scores of the individual variables to achieve a raw score. The raw score of non-missing values is then divided by the total number of non-missing variables for that city to achieve a domain score ranging from 0 to 1.
Step 6: Analyze Contextual Variables
Our sixth step—analyze contextual variables—is only discussed in very preliminary form in this article; see the section “Quantitative Assessments” below.
Intercoder Reliability
To both evaluate and replicate the coding processes of individual research projects, there is increasing demand for documentation of procedures used for data collection, interpretation, and analysis (Pratt, 2009). To reduce individual bias, coding is often done by multiple scientists, with the measures of interrater reliability to determine the validity of the codes (Hruschka et al., 2004). High interrater reliability metrics indicate that the codes are capturing underlying phenomena consistently, enabling exploration or tests of theoretical concepts both qualitatively and quantitatively (Cresswell, 2013b). Our small number of cases precludes many statistical assessments, but we are able to provide quantitative information about disagreements among individuals coding contextual data for the two example domains (see below).
Much of the literature on content analysis focuses on contemporary research, often with collection of interview data by the scientists conducting the coding (Schreier, 2012). Coding of secondary data, such as archival data and case studies, has been questioned in regard to data quality (see discussions in Bernard et al., 1986; C. R. Ember, Ross, & Burton, 1991). Yet, the systematic coding of cases based on existing literature may be one of the few ways to build data sets for comparative analysis, even while recognizing the limitations of data availability and quality. As addressed earlier, these data issues are not limited to the social scientific enterprise. The IPCC data quality coding process that we adopted gives us some confidence in our codes, and thus our findings (Mauthner, Parry, & Backett-Milburn, 1998).
Error rates and interrater checks are part of an iterative process. Individual scores prior to consensus scoring provide an indication of the initial disagreements among coders. To reduce inconsistency in coding particular variables over time, sometimes known as coding drift (Bartholomew, Henderson, & Marcia, 2000), we used discussions during consensus coding, varied the coding team composition, and coded on a case-by-case basis.
Reliability Results
As noted, a three-person coding team individually scored and then reached a consensus score for all variables for each city. Analysis of the degree of agreement among individual coders (Table 4) reveals that significant disagreement emerged within coding teams for a number of variables. The level and nature of disagreement, however, remained relatively constant across different cities and different variables, indicating that the coding process was largely consistent.
To further explore the consistency of our coding process, we focus on the number of “sole disagreements” among our three-person coding groups—instances in which two group members individually generated the same score for a particular variable, but one member assigned a different score, leading to group discussion about the proper consensus score to assign that variable.
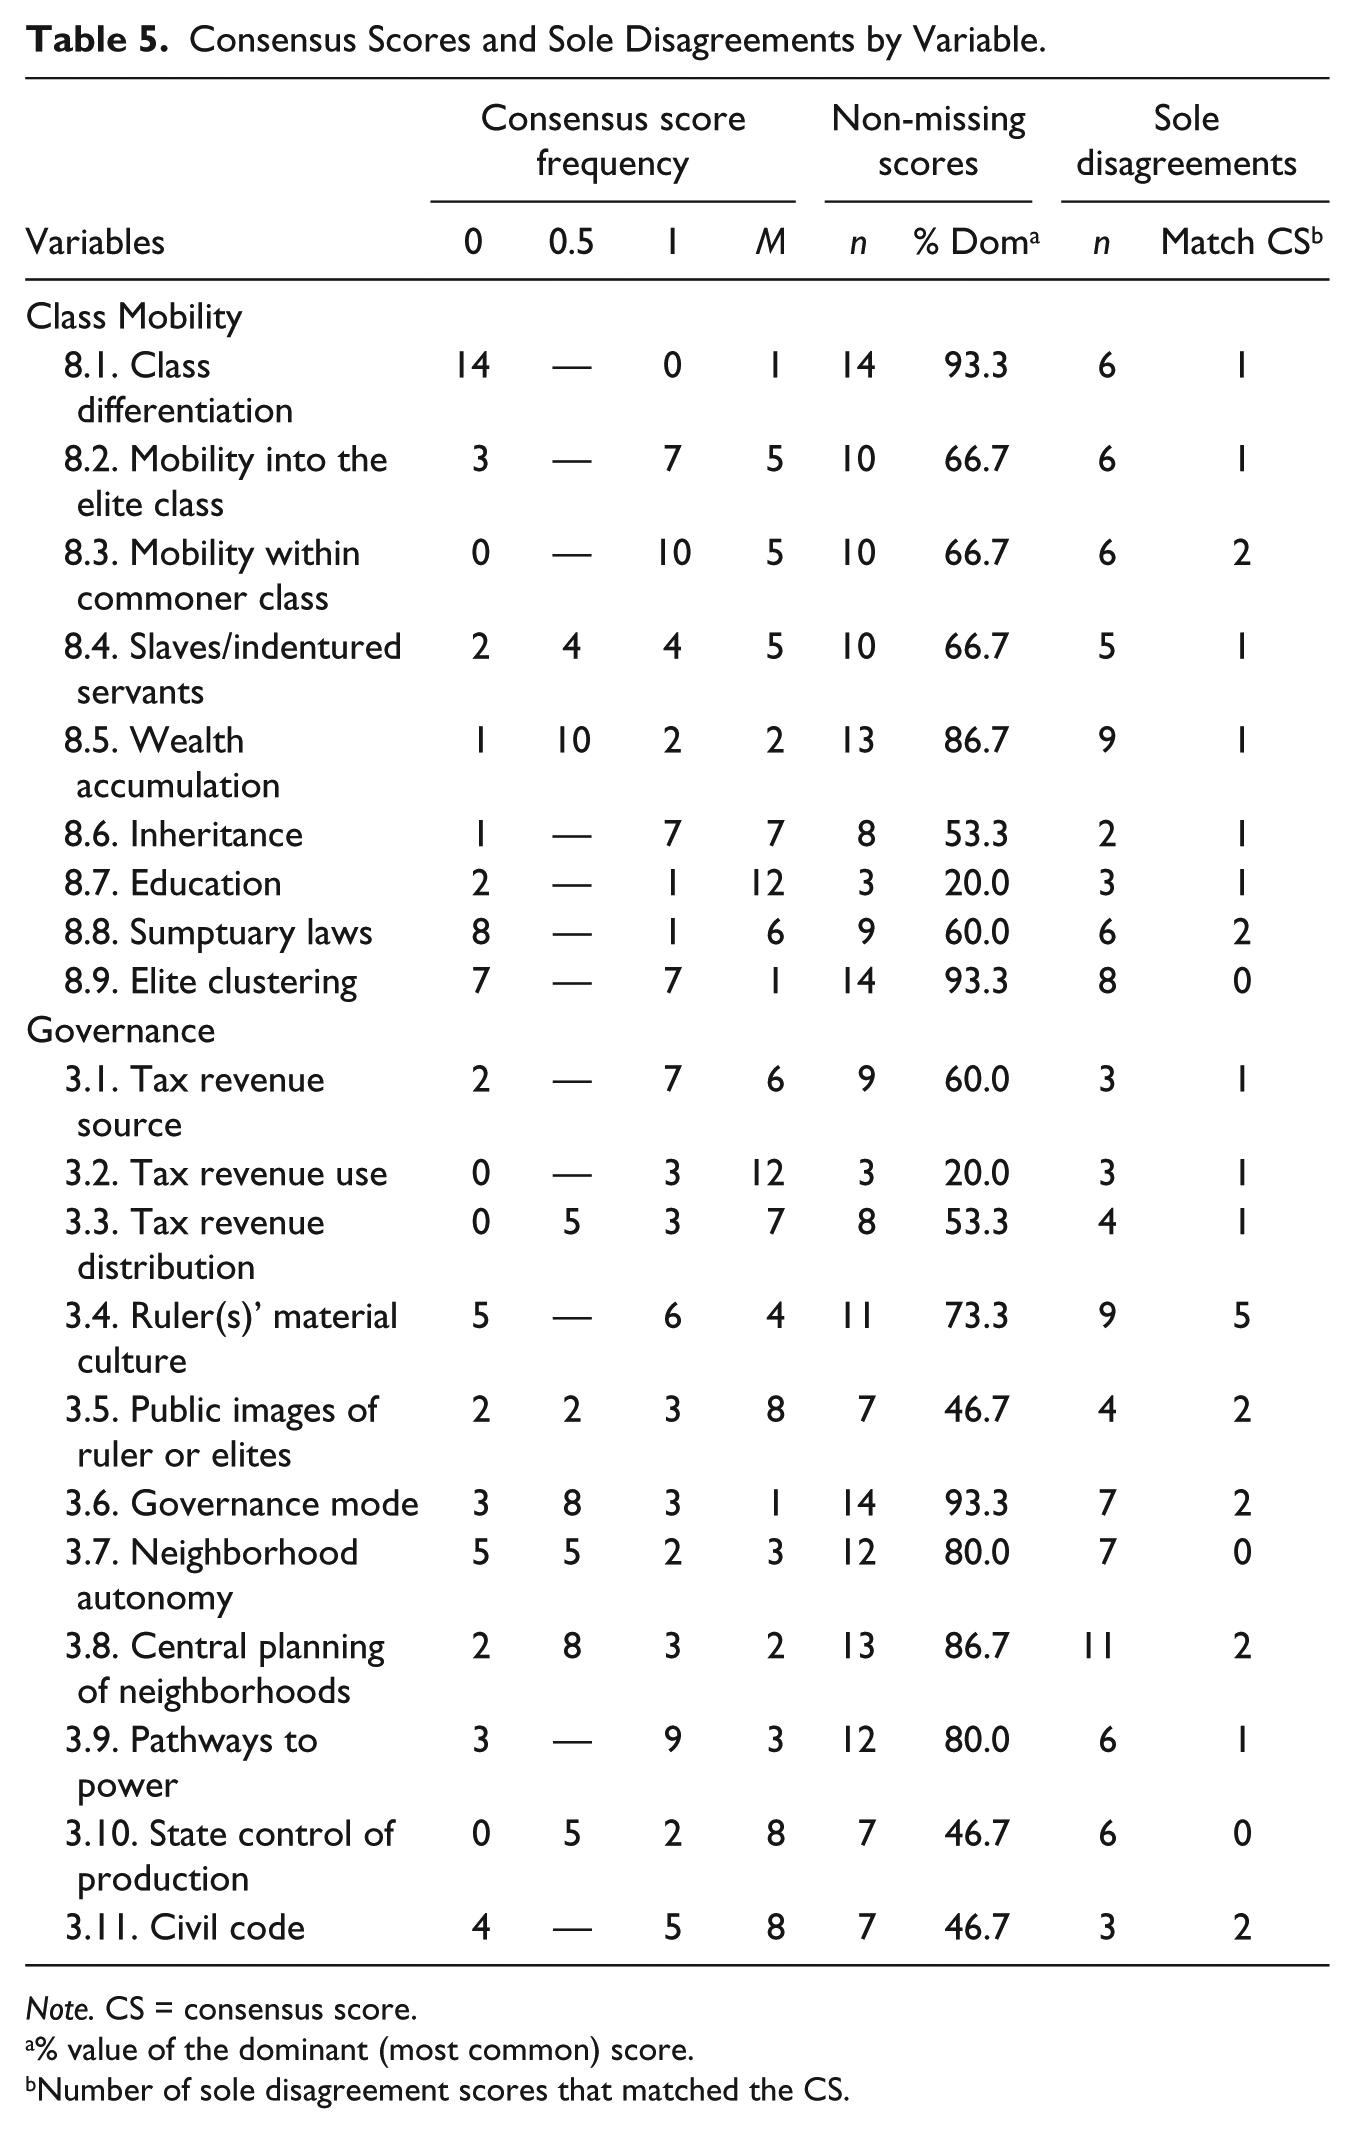
The number of instances in which an individual coder’s score diverged from the other two group members (sole disagreements in Table 4) was noteworthy, averaging about 1.2 instances per coded city across all coders in both Class Mobility and Governance. Overall, when coding Class Mobility in all 15 cities, 39% of variables involved disagreement from one coder, with a similar percentage for Governance. For coding reliability by variable (Table 5), data show a notable level of consistency across variables. For example, the number of sole disagreements per variable ranges from two to nine, with a median score of five. For Governance, a similar spread is evident, from three to 11 sole disagreements. For both domains, the number of instances where the sole disagreement was adopted as the consensus score by the coding group remains remarkably constant at zero to two instances for most variables—with one instance of four. These data indicate that, although some variables generated more disagreement than others, no variables stood out in this regard, and the odds of disagreement remained relatively constant across variables. In addition, no single individual was the source of disagreements (Table 4).
Consensus Scores and Sole Disagreements by Variable.
Note. CS = consensus score.
% value of the dominant (most common) score.
Number of sole disagreement scores that matched the CS.
Disagreements often led to productive group discussions that influenced the group’s understanding of the variable in question. For the most part, all variables showed some sole disagreements, and most included instances where one or more of those disagreements was adopted as the consensus score (Table 4).
Overall, considering the sometimes spotty information among different literature sources, the use of data from highly varied academic disciplines and modes of thought, and resulting issues about interpreting the strength and meaning of statements by sources, we consider our coding for the Class Mobility and Governance variables to be reasonably consistent. In various instances, a coder assigned a value prior to the meeting, but made note of uncertainties or questions that were addressed in the group discussion. In other situations, individual coders made simple errors such as recording an unintended score. Thus, the degree of agreement registered in Tables 4 and 5 exaggerates the actual substantive disagreements among coders—especially because coders understood that coding group meetings provided a safety net for resolving conceptual issues and correcting coding errors.
Initial Assessments
We have now described the contextual scoring steps (Figure 1) as they fit into the overall research program. Once these data steps are completed, we conduct exploratory analysis to assess the strengths and weaknesses of our data and determine which general patterns to address. With an interdisciplinary, mixed methods project, we rely on categorical data analysis of our variables and domains, as well as qualitative analysis utilizing our rich textual information to better understand the underlying phenomena and potentially causal processes. Next, we inspect and discuss the variables for each of the example domains.
Class Mobility
The variables for Class Mobility show relatively little variation among cities, as well as high levels of missing data (Table 5, column “Consensus score frequency”). The relative homogeneity of scoring for most Class Mobility variables reduces the value of this domain for explaining variation in spatial inequality among premodern cities, but this pattern does suggest that the premodern cities in our sample share some basic attributes of mobility. All have a strong differentiation of elites and commoners (variable 8.1), in line with theoretical expectations (Lenski, 1966; Trigger, 2003; Williamson, 2010). Nevertheless, nearly all cities show a moderate degree of wealth accumulation among non-elites (variable 8.5), as well as mobility within the elite class (variable 8.2) and mobility within the commoner class (variable 8.3). Again, these results fit well with theoretical and comparative expectations (Fallers, 1973; Laslett, 1971; Lenski, 1966). Given this broad similarity in class structure, it is all the more intriguing that our preliminary spatial analysis of service access shows high amounts of variation in access to important urban services (see Stanley et al., 2016).
Our sample overlaps very incompletely with the societies in Brown’s (1988) comparative study of systems of inequality. Three cities in the middle of our domain range of Class Mobility—Ottoman Cairo and Aleppo, and Chang’an—are classified by Brown (1988,) as having “open” stratification systems (p. 14). Brown classifies Medieval European societies as having a “closed” stratification system, but our Medieval cities (York and Chester) score high on this domain. Brown targeted the early Medieval or feudal period, whereas our cases come from the late Medieval period, when economic activity and social mobility were significantly higher (Nicholas, 2003; Pounds, 2005). This discrepancy can also be explained by our emphasis on cities, which were increasingly granted legal “liberties” in the period in contrast to rural feudal society (Laughton, 2008).
Governance
A larger range of variation among cities is evident among the 11 Governance variables (Table 5, column “Consensus score frequency”), pointing to diversity in systems of governance among premodern cities. These data parallel Blanton and Fargher’s (2008) main finding of major variation in premodern state governance, from highly autocratic forms to more collective or democratic forms. Their study was a major breakthrough in the comparative analysis of premodern polities, supplanting prior simplistic assumptions that all ancient states were autocratic.
Several cities in our sample pertain to polities analyzed by Blanton and Fargher; their polity-level scores are included in Table 6. Three of their polities—Ottoman, Swahili, and Yoruba—have scores on their “collective action” scale (a scale of autocratic vs. collective rule) very close to their sample median score of 36.25. In our scheme, the relevant cities show more dispersion for Governance, perhaps due to differences between governance at the city and polity levels but also likely related to differences in the coded variables used by the two studies.
Domain Scores for Each City.

Scores on the “collective action” scale (Blanton & Fargher, 2008, Tables 10 and 11).
Although we are concerned about the reliability of the domain scores for archaeological cases with high numbers of missing values, the pattern of Mesoamerican archaeological cities in Table 6 replicates the current scholarly understanding of governance in ancient Mesoamerica with Teotihuacan receiving 0.63, Tikal 0.38, and Xochicalco 0 (Table 6). Teotihuacan is generally interpreted as having a far more collective form of government than other Mesoamerica states such as Tikal and Xochicalco (Blanton, Kowalewski, Feinman, & Finsten, 1993; Cowgill, 2015), a judgment matched by our data. We now turn to quantitative analyses of the domains and variables.
Quantitative Assessments
We have two levels of information about contextual variables, domain scores that represent the sum of individual variable scores adjusted for the number of non-missing cases and the individual variable scores. Scaling of variables is nominal in this analysis because only some of the variables have rank-order scaling. In the Governance domain, seven of the variables have ranked ternary values among the 11 variables, but for Class Mobility, only two of the seven variables have ranked ternary values. The balance are nominal variables (no-yes or absent–present).
Domain Scatterplots
As an exploratory step, we examined scatterplots comparing pairs of domain scores. Here, we present the scatterplot of Governance versus Class Mobility (Figure 2). Because most domains include some instances of missing data for one or more cities, scatterplots often display fewer than 15 cities, and our example in Figure 2 shows 14. If our social domains were closely interrelated through their linkage to the degree of collective action, we might expect them to show a positive relationship. The two domains display no close relationship, which is also the case when we reduced the data set to mitigate the effects of missing data, as discussed next. In our discussion below, we note that the weak relationship between the two domains is echoed, to a considerable extent, at the individual variable level.

Scatterplot of Governance and Class Mobility domain scores for 14 cities.
Individual Variables and Missing Data
One of the biggest challenges facing our analysis is data availability, because most premodern urban traditions are represented by a highly limited range of historical, archaeological, and spatial data, published and analyzed in sometimes disparate academic disciplines. We could not predict at the outset the availability of data for the sample of cities, and the design of domains and variables reflected a theoretically informed, pragmatic, but hopeful stance. Table 7 indicates the percentage of data available per city for each domain. The data availability score represents the number of non-missing, coded variables in a particular domain divided by the total number of variables included in the domain.
Percentage of Available Data for Domains by City.

Note. Cell value = number of available variables of a domain (excluding missing) / total variables of that domain.
Note. Values equal to or greater than 0.75 are bolded.
Data availability scores for the social domains range from 0 to 1. Score 1 indicates that all variables in a particular domain per city are available. Score 0 means no variables have coded data for that domain. Five of 15 cities have two entire domains that lack data, and only three cities have a median data availability score >75% across eight domains. No city has this percentage of data available for all its domains. Thus, the extent of available data represents an analytic challenge.
Reduced Data Set
We began comparisons using the nine variables in Class Mobility and 11 in Governance, but with a modest sample of 15 cities and considerable missing data, the statistical results were inconclusive. To forge a more robust data set for statistical analysis, we combined variables with closely related content to reduce missing data; also, we eliminated variables with eight or more missing values or that produced redundant values with another variable in the domain. In the case of combined variables, we scored the combined variable using the highest positive score between (or among) the component variables; for example, in the combination of two variables for which one variable was scored as missing and the other scored as 1, the combination was scored as 1. The combination did not add scores, but used the highest component score.
For Governance, data reductions meant dropping variables 3.2 (tax revenue use) and 3.10 (state control of production), while combining 3.4 (ruler’s material culture) and 3.5 (public commemoration of ruler or elites). For Social Mobility, variable 8.1 (strongly differentiated elite class) was dropped, 8.2 through 8.4 were combined, representing mobility within and among classes, and 8.6 to 8.8 were combined, representing resource access by classes. In the reduced data set of 12 variables, Governance has eight and Class Mobility has four. As discussed in the “Initial Assessment” section, the original data set with all the variables provides useful information about individual cities, but variable reduction is a key step for the statistical analysis discussed next.
Statistical Analysis
To assess bivariate relationships between variables, we use Fisher’s exact test. Fisher’s exact test is appropriate for small-n studies of categorical data and calculates an exact distribution from the data (Agresti, 2001). The null hypothesis is that the variables are independent of one another. Because our variables represent coarse-grained observations, our initial expectations were not high that we would observe close relationships between them. On an exploratory basis, we examined instances in which the p value for statistical significance was ≤.10, as well as those for which it was ≤.05. By considering the .10 level, we might detect associations that were potentially important but less certain. We used IBM SPSS 23 to calculate Fisher’s exact test. We first discuss the Fisher’s results and then a correction for multiple tests.
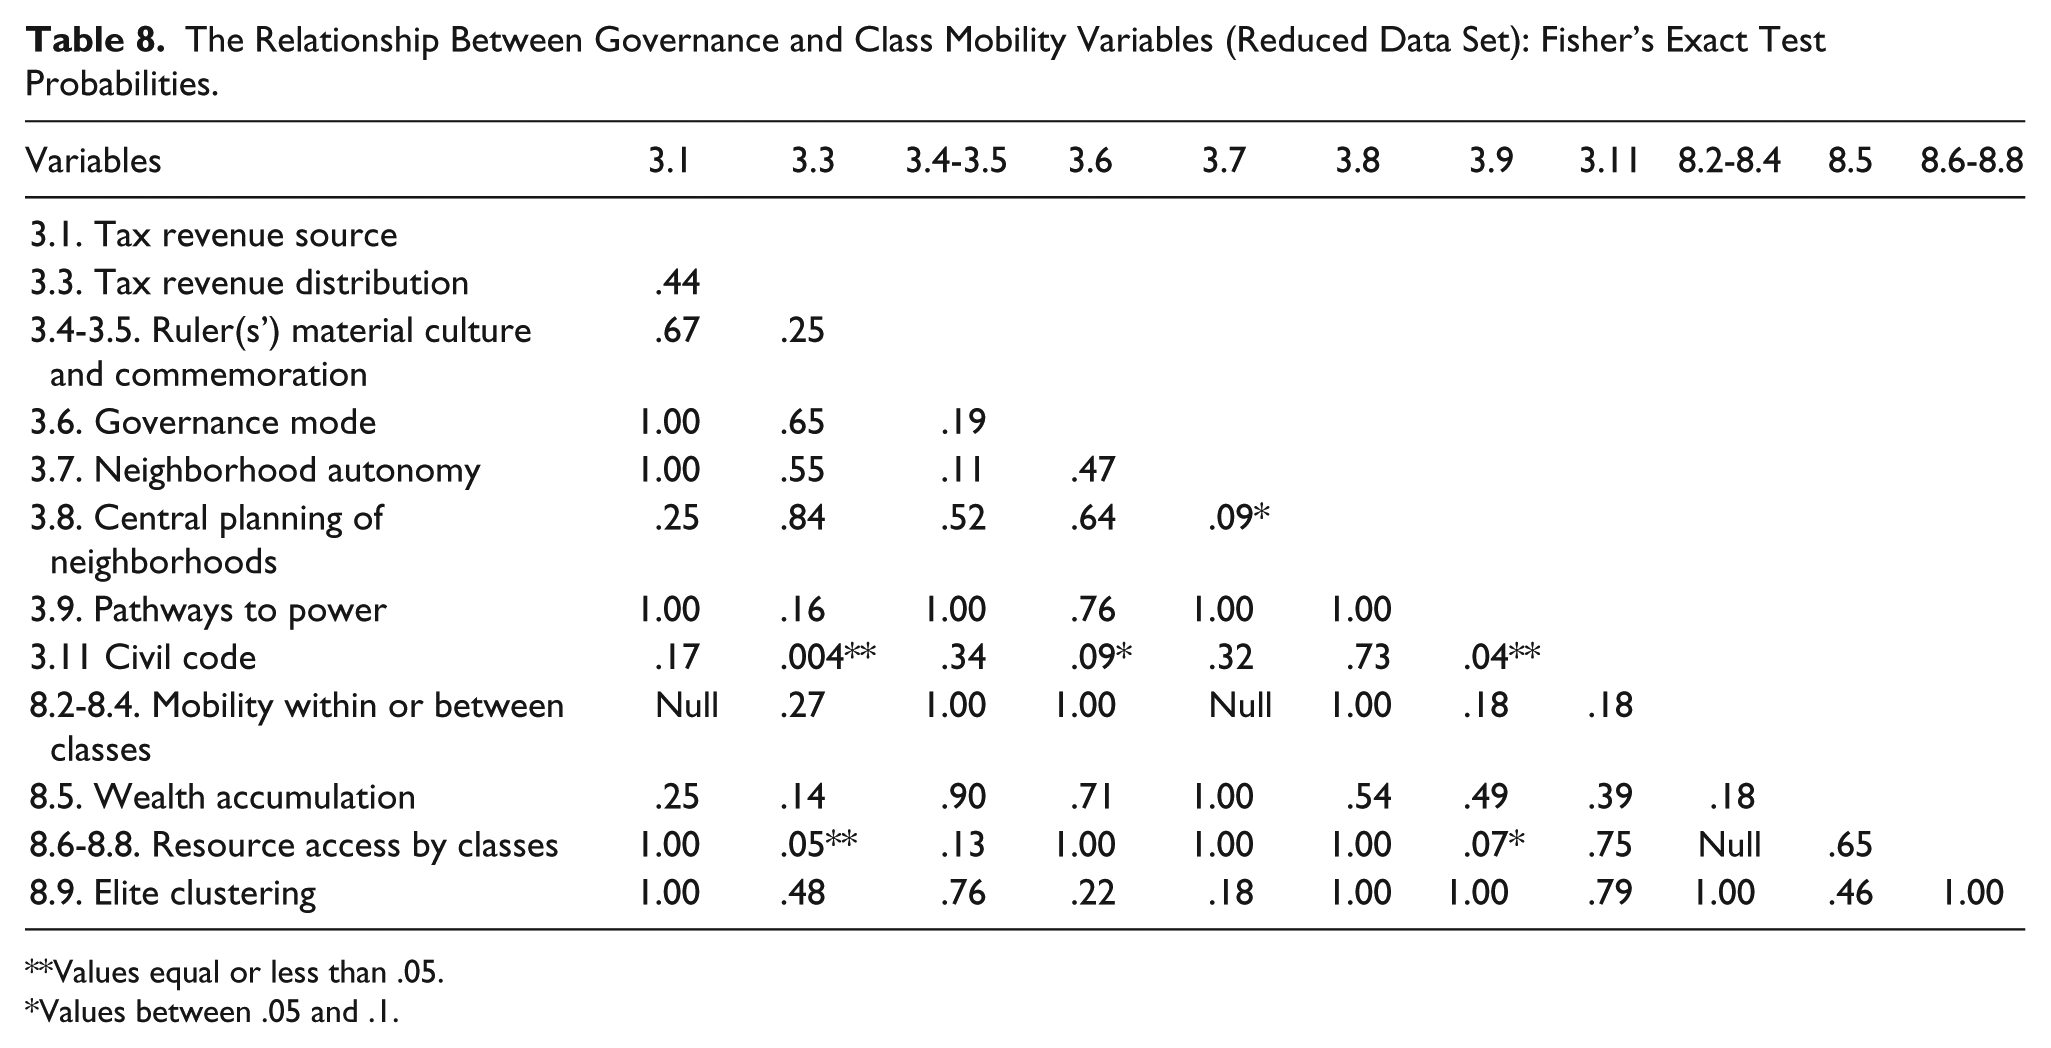
Table 8 presents the Fisher’s exact test p values. Among the 66 bivariate associations derived from the 12-variable matrix, three indicate a significant association at the ≤.05 level, while two fall within the .10 to .05 range, which we monitor only as suggestive. The three significant associations at the ≤.05 level are (a) the relationship between variables 3.11, presence of a civil code, and 3.3, tax revenue distribution; (b) 3.11, presence of a civil code, and 3.9, pathways to power; and (c) 3.3, tax revenue distribution, and 8.6 to 8.8, resource access by classes. The less certain positive relationships at a .10 to .05 level of significance are (a) 3.7, neighborhood autonomy, and 3.8, central planning of neighborhoods; and (b) 8.6 to 8.8, resource access by classes, and 3.9, pathways to power.
The Relationship Between Governance and Class Mobility Variables (Reduced Data Set): Fisher’s Exact Test Probabilities.
Values equal or less than .05.
Values between .05 and .1.
We see that the relationships at the .05 level mainly involve variables in the Governance domain, either among themselves or in relation to one of the combination variables in the Class Mobility domain. The relationships at the .10 level involve one pair of Class Mobility variables, and, again, a Governance variable. We should note that Fisher’s exact test is conservative with regard to Type I errors (Upton, 1992), finding an association where there is none.
Our multiple testing of 66 variable pairs is representative of the wider problem for the set of all the variables in all the contextual domains, which involves even more tests. The Holm–Bonferroni correction (Holm, 1979) takes account of the total number of tests to conservatively adjust probabilities to compensate for the likelihood that multiple testing increases the chance of rejecting the null hypothesis when it is true. Correction for possible errors involved in multiple tests is an important step, yet rarely done in the social sciences. Using the Holm–Bonferroni correction, we find that none of our results are significant at the .05 level, or the .10 level. We find that our lowest p value for the relationships between variables 3.11, presence of a civil code, and 3.3, tax revenue distribution, which was .004 uncorrected, upon correction has a p value of .252. With this conservative correction, relationships at the level of individual variables in these two domains are not statistically significant or especially suggestive. Although not statistically significant, overall the Governance domain exhibited more promise for finding associations with other variables than the Class Mobility domain, at least in this set of comparisons.
Of course, the modest number of cities coded and the simplified coding scheme for individual variables may obscure valid relationships. However, the sheer variability of the cities and the limitations of sources preclude a more detailed coding scheme. Also, the domain of Class Mobility proved to be one in which the societies did not exhibit a great deal of variation in its variables, undercutting our attempt to detect relationships. In sum, we find that our sample of 15 premodern urban societies exhibits substantial independent variability in these two dimensions of social life based on the Fisher’s exact test statistics.
Discussion
The contextual coding is aimed at explaining spatial access to public services, which we do not undertake here, but we have addressed our expectation that the domains and variables might be correlated among themselves by looking at the relationships among variables in the two example domains. Our expectation has not been met, but we identified Governance as the more promising of the two domains for potentially influencing access to services in premodern cities. Methodologically, we especially stress the importance of attention to the multiple testing effect (the Holm–Bonferroni correction). We are not aware of other systematic quantitative efforts to compare ancient societies at the level of individual variables (26 in the original data set, 12 in the reduced data set for the two target domains). However, as more studies examine societies or cities with intermediate sample sizes and multiple variables, our procedures for dealing with coding reliability, missing data, statistical comparisons and corrections, and assessment of multiple levels of variation will provide methodological guidelines.
As noted at the outset, we coded information about facets of society that Blanton and Fargher (2008) did not consider in their study. The procedures in our examination of contextual variables are quite distinct from theirs. They employed 31 variables in four “domains,” with variables in each domain summed to provide a domain score that, in turn, contributed to the total collective action score. Collective action scores were compared according to the revenue source (internal or external) to look for significant effects of revenue on the degree of collective action. To evaluate the relationship with revenue source, those authors used bivariate r correlations and t tests (Blanton & Fargher, 2008). Their sample of societies (n = 30), twice as large as our sample, underwrote their statistical approach. Their mainly historical cases did not include missing data. In contrast, we do not have an overall composite score, and we consider more domains to represent many different facets of urban society. We accommodate diverse levels and sectors of collective action, not solely collective action in government. The example domains point to two arenas of social organization that operate somewhat independently.
When the remaining cities are added to our data set, our sample size will increase slightly, and we will be in a position to determine the strongest domains with the least missing data, which will likely include the more descriptive domains (Territory and Population and Urban Functions). We expect to further document the diversity in city life, some of which may prove to be useful for discriminating among cities in access to public services.
Conclusion
We have described our methods for collecting, analyzing, and summarizing contextual data representing the social, economic, and political structures of premodern urban centers. Our research process includes cross-checks on coding reliability and builds in representation from multiple disciplines. We used two domains—Class Mobility and Governance—as examples to disclose our procedures and the challenges of missing data. Our coding methods inform us about urban social variation and show how these data can be used to evaluate statistically significant relationships.
As a highly interdisciplinary effort, this study incorporates a range of perspectives from archaeology, urban history, political science, geography, sociology, and social anthropology in determining the types and definitions of contextual variables. Because some variables were inspired by modern, not historical, urban studies, and given noteworthy disciplinary divergence between archaeological and historical approaches to studying the past, our set of contextual variables is diverse. Many variables are oriented toward specific information that sometimes is not available. By including variables oriented to particular disciplines, our initial research design anticipated a high level of missing data. Missing values were also inevitable given the highly incomplete records left by most premodern societies. This interdisciplinary process, however, promoted a better understanding of what premodern urban information is available. Our theoretically driven variables represent a hopeful stance, but not a certainty that relevant information can be located. This situation contrasts with the degree of control that can be exercised in social research on many contemporary societies.
Our research relies on a sample size intermediate between systematic and intensive designs. Design of contextual coding was a lengthy, iterative process, subject to revision and clarification. Complex societies are hard to summarize, let alone compare cross-culturally, and it is important to both establish strict conceptual boundaries for assessing information and be flexible in altering them when presented with new issues, even at the cost of revisiting previously coded cities. Our coding groups were designed not only to resolve specific disputes about transforming information into codes but also to maintain a critical stance about data categories.
An important realization from our coding process is our dependence on variability. Effective cross-cultural analysis depends on variability to assess causality. Several variables are so consistent across our sample—expected for some but surprising for others—that it affects our analysis of relationships among individual variables or domain scores. Our Governance domain ultimately generated more useful information than Class Mobility because it contained more variables with high variation across cases. Although scant variability in Class Mobility prevents the use of some data for analysis, the finding is not without general interest. For example, the complete lack of variation for variable 8.1—which indicates that all premodern cities under study had a strongly differentiated elite class—supports the observation of Trigger (2003) about the widespread distribution of a major distinction between elites and commoners in early states.
Ultimately, there are inherent limitations to cross-cultural comparative study informed by coded archaeological and textual information. The difficulty of using a defined baseline of socio-cultural attributes to compare fundamentally different societies possessing separate ontologies and social values remains a serious challenge. Urban traditions have varying levels of data availability, in different formats, with missing data that make valid statistical analysis difficult (both in number of cases and number of variables coded). The strength of this study lies in the organization of conceptual categories and their translation into variables amenable to assessment. By controlling for missing and low variability data, we can focus on useful domains and variables for examination of access to public services. The cultural breadth of these contextual variables offers many possibilities for future use of the data that transcend this initial focus on urban service access. Thus, the coding described in this article is an effective template for a variety of cross-cultural comparisons of past urban societies.
Once the full sample of cities is coded, we will examine domain relationships across the board to select those robust enough for comparison with public service access. To date, no insurmountable obstacles have emerged for our research design despite limits of information. In this presentation of methods, we have established some of the limits of our data set and coding, addressed appropriate procedures, and determined that, for our purposes, selective attention to domains and variables with the least missing data will prove essential. Particularly interesting is the implication from the example analyses here that different sectors of social life may vary somewhat independently of one another with respect to conditions promoting or expressing collective action.
Footnotes
Appendix
Acknowledgements
The authors thank the team of talented undergraduates for gathering contextual information and digitizing city maps, and also several anonymous reviewers for helping improve the article. They are indebted to statisticians who offered useful commentary on methods, Professors Mark Reiser, Jeffrey Wilson, and Dennis Young at Arizona State University.
Authors’ Note
Authors are alphabetical after the first two.
Declaration of Conflicting Interests
The author(s) declared no potential conflicts of interest with respect to the research, authorship, and/or publication of this article.
Funding
The author(s) disclosed receipt of the following financial support for the research, authorship, and/or publication of this article: Funding for the project “Service Access in Premodern Cities” is provided by the National Science Foundation, Grant 1260344, and by the School of Human Evolution and Social Change at Arizona State University. The initial stage of the project was funded by the President’s Strategic Fund at Arizona State University.