
Abstract
Two studies determined relations between state resident Big Five personality scores and state work satisfaction for the 50 states in the United States. Study 1 and 2 personality profiles were based on responses of 619,397 residents to the 44-item Big Five Inventory. For Studies 1 and 2, state work satisfaction scores were respectively taken from the Gallup-Healthways Well-Being Index based on 353,039 phone interviews in 2008 and on 353,564 in 2012. Higher neuroticism was associated with lower work satisfaction (r = −.49, p < .001) in both studies despite negative recession impacts in Study 2. In Study 1, the robust relation persisted with state socioeconomic status, percent of White population identified in the census, urban population percent, unemployment rate, economic conservatism, income inequality, and political conservatism controlled. In Study 2, the relation persisted while controlling for peak-recession and end-of-recession unemployment rates, 2010-2011 GDP growth, and the other corresponding control variables of Study 1.
Cross-cultural comparisons most often center on differences between nations but there also are studies that focus on differences within countries. For example, research by Barber (2001, 2015) in this journal used states of the United States as the units of analysis. Similarly, recent studies emanating from the geographical psychology perspective (Rentfrow, 2010, 2014a, 2014b; Rentfrow, Gosling, & Potter, 2008; Rentfrow & Jokela, 2016) have used American states as analytical units (e.g., McCann & Zawila, 2016; Obschonka, Schmitt-Rodermund, Silbereisen, Gosling, & Potter, 2013; Rentfrow, Mellander, & Florida, 2009). Generally, these geographical psychology studies have not been labeled explicitly as “cross-cultural” even though they can be considered empirical intranational cross-cultural investigations. The present research dealing with the relation between state resident scores on the Big Five personality variables (Rentfrow et al., 2008) and state levels of work satisfaction is firmly in this category.
Culture can be defined as “a set of beliefs, practices, or symbols that are shared in common by a particular group of people” which distinguishes this “group from other groups in some way” (Conway, Houck, & Gornik, 2014, p. 34). Cross-cultural psychology can be defined as “the scientific study of human behavior and mental processes, including both their variability and invariance, under diverse cultural conditions” (Ho & Wu, 2001; Wikipedia, 2017). In discussing cultural differences between states, Koven (1999) notes that the United States “is not homogeneous in terms of ethnic composition, political norms, natural resources, social norms, economic stature, political culture, taste in music, type of religion, moral convictions, educational attainment, physical appearance, and a host of other attributes” (pp. 41-42) which could include differences such as level of urbanization, race, population density, level and type of industrialization, degree of residential mobility, eating habits, wearing apparel, and humor. As well, Reysen and Levine (2014) make the following points that could just as well apply to states: “Cities [States] are imbued with culturally constructed meanings, symbols, normative patterns, identities, and macroenvironmental factors that influence and are constantly reproduced and modified by individuals that inhabit these everyday environments” (p. 255) and “although it may be careless to overgeneralize about the people from a single place, it would be naïve to deny the existence of significant, overall differences between places and the cultural patterns displayed by inhabitants” (p. 256). Furthermore, Rentfrow et al. (2008) have shown that states vary on state resident personality dimensions which may be related to many other state cultural differences.
In using the 50 states of the United States in cross-cultural psychology research, it is recognized that there are overlaps of state cultures, especially in certain regions, and that these regional similarities stem from various factors. For example, Woodward (2011) put forward the theory that 11 separate settler areas with different cultures underlie many of the differences between states today. From an account of Woodward’s research by Speiser (2015), Yankeedom includes states such as Massachusetts, Vermont, Michigan, and Wisconsin, and has a culture that “values education, intellectual achievement, communal empowerment, and citizen participation in government” and is “comfortable with government regulation.” The Deep South, which largely includes states such as Georgia, Alabama, South Carolina, and Mississippi, has an inflexible social structure and is opposed to government regulation that impinges on individual freedom. Greater Appalachia, which largely includes states such as West Virginia, Tennessee, Oklahoma, and Texas, values individual sovereignty and resents federal government influence. States in whole or in part stemming from these 11 “nations” may be quite different because of the differences in early settler worldviews. As Park and Peterson (2014) have stated, perhaps the states of the United States even may be considered especially fertile for cross-cultural psychology. They argue that intranational cross-cultural studies can provide better grounds for testing hypotheses because they “do a better job of minimizing potential confounds such as language, mode of government, affluence, and educational opportunities than comparative studies across nations” (p. 181).
The widely accepted Big Five personality model (e.g., Costa & McCrae, 1995; Goldberg, 1990; John & Srivastava, 1999) asserts that there are five major personality dimensions along which people differ: openness to experience, conscientiousness, extraversion, agreeableness, and neuroticism. The Big Five personality variables tap dispositional characteristics of individuals within the normal or nonpathological range. For example, those persons high on the neuroticism dimension are higher on characteristics such as vulnerability, anxiety, angry hostility, self-consciousness, depression, and impulsiveness, and they tend to be moody, discontented, insecure, emotional, unstable, envious, guilt-ridden, nervous, and tense. Briefly, regarding the other Big Five personality dimensions, those high on openness are higher on tolerance for diversity and willingness to experiment, those high on conscientiousness are higher on propensity for order and dutifulness, those high on extraversion are higher on gregariousness and excitement seeking, and those high on agreeableness are higher on compliance and trust (Costa & McCrae, 1995).
A person high on neuroticism on the Big Five Inventory (John & Srivastava, 1999) tends to not handle stress well, to worry a great deal, to get upset and nervous easily, to not remain calm in tense situations, to be depressed, to be blue, to be moody, and to be tense. Therefore, it seems reasonable to expect an employee with these normal spectrum limitations to be more frustrated and likely to produce a less favorable evaluation of his or her work environment than an employee with the opposite characteristics. Indeed, many researchers have reported that workers who score higher on measures of neuroticism have lower work satisfaction (Avery, Smillie, & Fife-Schaw, 2015; Brough, 2005; Christiansen, Sliter, & Frost, 2014; Cohrs, Abele, & Dette, 2006; Cooper, Knotts, McCord, & Johnson, 2013; Grant, Langan-Fox, 2006; Holland, 1996; Hurt, Grist, Malesky, & McCord, 2013; Judge, Heller, & Klinger, 2008; Judge, Heller, & Mount, 2002; Kim & Chung, 2014; Kirkcaldy, Thome, & Thomas, 1989; Perone, DeWaard, & Baron, 1979; Pretsch, Flunger, & Schmitt, 2012; Saksvik & Hetland, 2011; Scollon & Diener, 2006; Tanoff, 1999; Templer, 2012; Tokar & Subich, 1997; Wille, Hofmans, Feys, & De Fruyt, 2014; Winkelmann & Winkelmann, 2008; Zalewska, 2011; Zhai, Willis, O’Shea, Zhai, & Yang, 2013). Apparently, no researchers have reported a positive correlation between work satisfaction and neuroticism, and only one study could be located that found no correlation between the two constructs (i.e., Sterns, Alexander, Barrett, & Dambrot, 1983). This association between lower neuroticism and higher work satisfaction has been reported in several countries such as the United States (Judge et al., 2008), Singapore (Templer, 2012), Australia (Grant & Langan-Fox, 2006), Belgium (Wille et al., 2014), South Korea (Kim & Chung, 2014), New Zealand (Brough, 2005), Germany (Cohrs et al., 2006), China (Zhai et al., 2013), and the United Kingdom (Avery et al., 2015). The link also has been found for various job levels and categories. For example, Tanoff (1999) found that lower neuroticism was associated with lower job satisfaction in a sample of more than 800 workers in a major corporation across six areas of occupation and four job classification levels, Cohrs et al. (2006) found the association in a sample of more than 1,000 German professionals, and Cooper et al. (2013) found it in a sample of more than 800 public managers. Furthermore, after a meta-analysis of 187 studies examining relations of various personality variables to job satisfaction, Bruk-Lee, Khoury, Nixon, Goh, and Spector (2009) reported that Big Five neuroticism was the strongest predictor with a mean correlation of −.25 for cross-sectional studies.
Although Bruk-Lee et al. (2009) found that neuroticism had the strongest relation to work satisfaction in their meta-analysis of cross-sectional studies, conscientiousness, extraversion, and agreeableness also showed relations to work satisfaction. However, based on the mean-squared correlation coefficients, the conscientious correlation was only 41% as large as that for neuroticism, the extraversion correlation 23% as large, and the agreeableness correlation 27% as large. An earlier meta-analysis by Judge et al. (2002) found similar results. In that study, neuroticism was the prime predictor with a mean correlation of −.24. The conscientious correlation was 69% as large as that for neuroticism, the extraversion correlation 63% as large, and the agreeableness correlation 29% as large.
It is evident from the two meta-analyses (i.e., Bruk-Lee et al., 2009; Judge et al., 2002) that neuroticism is the most potent predictor of work satisfaction and is followed by conscientious, agreeableness, and extraversion with much weaker predictive capacities. Persons high on conscientiousness are higher on propensity for order, dutifulness, achievement striving, self-discipline, competence, and deliberation (Costa & McCrae, 1995). The characteristics of the conscientious person are likely to lead to success and rewards on the job, and this may result in higher work satisfaction (Bruk-Lee et al., 2009). Persons high on agreeableness are higher on compliance, trust, straightforwardness, modesty, tender-mindedness, and altruism (Costa & McCrae, 1995). Perhaps agreeable persons have a general tendency to view their situations, including their jobs, in a more positive way, and perhaps they get along better with coworkers, and this results in higher work satisfaction (Bruk-Lee et al., 2009). Persons high on extraversion are higher on gregariousness, excitement seeking, positive emotions, warmth, assertiveness, and activeness (Costa & McCrae, 1995). Their higher work satisfaction may stem from satisfaction derived from their generally superior productivity and from the effects of their commonly positive moods (Bruk-Lee et al., 2009). In line with the meta-analytic results, neuroticism was considered in the present research to be the most likely candidate to emerge as a predictor of work satisfaction at the state level, but the other four Big Five variables were included in the analyses.
Work satisfaction has been assessed at the American state level. Between 2008 and 2013, the Gallup-Healthways Well-Being Index project (Gallup, 2015) included a “work environment” index essentially gauging the degree of work satisfaction in each state. More than 350,000 phone survey respondents throughout the nation each year were asked four questions regarding work including, “Are you satisfied or dissatisfied with your job or the work you do?” Levels of worker satisfaction varied considerably from state to state. For example, in 2013, North Dakota was highest with 60.7 points and Mississippi was lowest with 41.0 (Gallup, 2014).
Perhaps differences in degree of job satisfaction in different states are somewhat dependent upon factors stemming from the nature of the typical work environments in the different states. However, the present research takes a different tack and considers the possibility that the modal or average personality characteristic of different state work forces is at least partially responsible for different levels of job satisfaction across different states. In other words, it might not be just elements of the work environments but also aspects of the personalities of the employees that are contributing to state differences in worker satisfaction in the United States. Big Five personality profiles certainly do differ across the states of the United States and are reflected in various cultural indicators (Rentfrow et al., 2008). Therefore, the present macro-level geographical psychology research was conducted to determine whether Big Five personality dimensions, especially state resident levels of neuroticism, can account for variance in the degree of work satisfaction across the 50 states.
A basic theoretical premise of the emerging perspective of geographical psychology as articulated by Rentfrow et al. (2008) and Rentfrow (2010, 2014a, 2014b) is that a geographical area’s aggregate position on a personality variable reflects the central tendency of the geographical area’s individuals on that dimension, and is associated with the pervasiveness in that geographical area of the psychological and behavioral tendencies associated with that personality dimension. In fact, geographical psychology theory (Rentfrow et al., 2008) suggests that links between aggregate-level and individual-level relations can develop and persist through five different pathways. In Path A, the basic theoretical premise, disproportionate levels of a trait in different geographical areas generate corresponding behavioral and psychological manifestations in those areas. In Path B, prominent behavioral and psychological manifestations of a trait in an area may eventually produce institutions to maintain such manifestations. In Path C, such behavioral and psychological manifestations may encourage a psychosocial climate of conformity to area norms. In Path D, institutional and social structures in an area may have an impact on behavioral and psychological manifestations through the provision of opportunities for those with certain personality characteristics. In Path E, area social norms may influence trait prevalence through socialization processes, through people with similar traits choosing to relocate in that area, and through people with dissimilar traits choosing to move out. Therefore, the geographical psychology perspective provides a framework to understand aggregate or mass phenomena as derived from and reflecting processes occurring at the individual level. Through this lens, perhaps some of the variance in the state levels of work satisfaction can be understood as the state outcomes of corresponding Big Five dispositional variables at the individual level, particularly neuroticism.
In their formulation of the basic principles of geographical psychology, Rentfrow et al. (2008) were keenly aware of inherent risks in simply extrapolating relations from one level of analysis to another. The “ecological fallacy” (Robinson, 1950) occurs when it is assumed that aggregate-level relations generalize to the individual level. The “compositional fallacy” (Pettigrew, 1997) occurs when it is assumed that individual-level results generalize to the aggregate level. Geographical psychology responds to such cross-level extrapolation issues by carrying out nomothetic empirical studies of aggregate-level variable relations wherein geographical boundaries of one sort or another specify the individuals to be included in each aggregate analytical unit. On the contrary, mainstream psychology fundamentally focuses on individual behavior and mental processes and uses persons as analytical units in nomothetic empirical research, and sometimes it is tacitly assumed that research results at the individual level of analysis generalize to the aggregate level. For example, most psychologists probably assume that because authoritarian personality is related to prejudice, then prejudice is likely to be elevated in aggregates in which individuals are higher on the authoritarian personality dimension. However, without aggregate-level supportive data, we can only assume that this will be so. Other factors at the aggregate level may minimize or eliminate such a connection.
A geographical psychology approach also has the capacity to further inform in important ways those charged with attempts to bring about changes in society. From an applied perspective, aggregate-level research can provide information to change agents that individual-level research cannot. For example, the following passage from McCann (2011c) articulates such a view regarding obesity but it could apply just as well to work satisfaction: It furthers our understanding to know whether personality may be a contributing factor to obesity [work satisfaction] and whether observed differences in state obesity prevalence [work satisfaction] ultimately stem at least in part from differences in personality at the individual level when they are aggregated at the state level. Conventional individual-level analysis can provide results that may be useful for applications by states and the federal government if there are no differences on the personality dimensions across different states, or if personality differences across states are not related to criteria of interest such as obesity prevalence [work satisfaction]. But if there are state differences in personality that are associated with a criterion of interest, then state-level relations between personality and that criterion become important and facilitate the development of tailored interventions aimed at improvement in that criterion. (p. 423)
For the present study, state-level Big Five personality estimates were obtained from Rentfrow et al. (2008), who computed mean levels of the Big Five personality variables for each American state based on the responses of more than 600,000 surveyed residents to the Big Five Inventory (John & Srivastava, 1999) between 1999 and 2005. These state Big Five scores reflecting modal or mean state resident personality on the Big Five traits have been related empirically to a number of state-level variables such as political ideology and partisanship (e.g., McCann, 2014a; Rentfrow, Jost, Gosling, & Potter, 2009), social tolerance (Rentfrow, 2014a), crime (Rentfrow, 2014a; Rentfrow et al., 2008), gun laws (McCann & Zawila, 2016), cancer and heart disease mortality rates (e.g., McCann, 2014b; Rentfrow, 2014a), suicide (McCann, 2010b; Voracek, 2009), smoking (McCann, 2010a), emotional health (e.g., McCann, 2011b), creativity (e.g., McCann, 2011a; Rentfrow, 2014a), economic innovation and entrepreneurship (e.g., Obschonka et al., 2013; Rentfrow, 2014a), social capital (e.g., Rentfrow, 2014a), religiosity (Rentfrow et al., 2008), social involvement (Rentfrow et al., 2008), residential mobility (McCann, 2015), well-being (Rentfrow, 2014a; Rentfrow et al., 2009), tightness–looseness (Harrington & Gelfand, 2014), and social, enterprising, artistic, and investigative occupations (Rentfrow et al., 2008).
The present geographical psychology research includes two studies. Both examined relations between state levels of work satisfaction as assessed for the Gallup-Healthways Well-Being Index (Gallup, 2014, 2015) and state levels of resident Big Five personality dimensions as assessed by Rentfrow et al. (2008). Study 1 determined the capacity of neuroticism and the other Big Five personality variables to account for variance in the 2008 assessment of state levels of work satisfaction. Study 2 similarly examined the capacity of neuroticism to explain variance in 2012 state levels of work satisfaction after the nation had experienced a severe recession which began officially in late 2007. Both studies used correlation and multiple regression strategies. Each study also exercised the statistical control of several appropriate state-level demographic variables such as income levels, educational levels, White population percent, 1 urban population percent, unemployment rates, income inequality, economic conservatism, political conservatism, and growth in GDP.
Study 1
Study 1 involved a correlation and multiple regression examination of the relation of state resident Big Five scores as assessed by Rentfrow et al. (2008) to the 2008 state work satisfaction scores, the first such annual work environment scores produced by the Gallup-Healthways Well-Being Index project (Gallup, 2015). The relation of the Big Five personality variables to work satisfaction also was tested without and with a variety of statistical controls previously demonstrated to have a relationship with a predictor of interest or a criterion in the present research.
Higher work satisfaction has been found to be associated with higher income levels (e.g., Sweet, Benson, Nelson, & Moberg, 2015), higher educational attainment (e.g., Zainuddin & Din, 2009), being self-identified as White (e.g., Kovner, Brewer, Wu, Chenge, & Suzuki, 2006), working in a rural setting (e.g., Bratt, Baernholdt, & Pruszynski, 2014), and living in a time or area of low unemployment rates (e.g., Tay & Harter, 2013). As well, in geographical psychology studies with the states of the United States as analytical units, the Big Five personality variables have been related to economic conservatism (e.g., McCann, 2014a), income inequality (e.g., de Vries, Gosling, & Potter, 2011), and political conservatism (e.g., McCann, 2014c). In addition to the preceding empirically demonstrated associations, the respective authors also presented theoretical speculations as to the underlying nature of the processes that give rise to these associations. To eliminate potential alternative explanations, it was considered important to account for any variance in work satisfaction that could be attributed to these variables. Therefore, state-level demographic variables based on these demonstrated associations served as control variables in examinations of the relation of personality to work satisfaction using sequential multiple regression strategies in Study 1. The selection and usage of these control variables largely adhered to guidelines recently provided by Bernerth and Aguinis (2016).
Method
Participants
Rather than being persons as in conventional individual-level research, the “participants” in this study were the 50 states of the United States. In this state-level research, each case was a state with data on several state-level variables.
Measures
Work satisfaction
The Gallup-Healthways Well-Being Index for 2008 (Gallup, 2009) was based on the results of 353,039 phone interviews on more than 350 days throughout the year with a representative sample of U.S. residents at least 18 years of age. The work environment domain score was one of six domain scores contributing to the overall well-being index. For the 190,776 respondents with a job, the following questions were asked: “Are you satisfied or dissatisfied with your job or the work you do? At work, do you get to use your strengths to do what you do best every day, or not? Does your supervisor at work treat you more like he or she is your boss or your partner? Does your supervisor always create an environment that is trusting and open, or not?” Responses to the four questions were combined and presented on a scale of 0 to 100 to form the work environment index for the 50 states, which served as the state work satisfaction measure in the present study. The work satisfaction measure showed high reliability with a Cronbach’s alpha of .77. The state mean was 51.2 and the standard deviation was 2.6.
Big Five personality variables
Rentfrow et al. (2008) provided state z scores based on state mean raw scores and standard deviations for openness to experience, conscientiousness, extraversion, agreeableness, and neuroticism as assessed by the 44-item Big Five Inventory (John & Srivastava, 1999) in an Internet survey of 619,397 U.S. residents conducted between December 1999 and January 2005. State sample sizes ranged from a minimum of 1,536 in Wyoming to a maximum of 71,873 in California (M = 12,344.84, SD = 12,718.33). Correlations between state sample sizes and state Big Five z scores were not statistically significant. Their analysis showed that the sample was representative of the national population and drew state respondents in direct proportion to 2000 population and racial composition census but somewhat less so regarding social class. Rentfrow et al. also reported that the Big Five had high reliabilities with mean Cronbach’s alphas of .81 at the individual level and .89 at the state level. State resident personality estimates based on three randomly selected samples each containing more than 206,000 participants produced high reliabilities with mean rs of .93 for openness, .78 for conscientiousness, .62 for extraversion, .80 for agreeableness, and .85 for neuroticism. Two time-based subsamples also produced high reliabilities with rs of .88 for openness, .88 for conscientiousness, .70 for extraversion, .77 for agreeableness, and .86 for neuroticism. As well, Rentfrow et al. (2008) reported that “the state-level factor structure was virtually identical to the factor structure commonly found at the individual level” (p. 349) with a total congruence factor of .91. 2
SES 2007
A state SES composite was formed from two economic and two educational variables. Data for 2007 for each state were taken from the Statistical Abstract of the United States (U.S. Census Bureau, 2010a) pertaining to personal income per capita in current dollars, percent of individuals living below the poverty line (which subsequently was reversed by multiplying by −1), percent of population 25 and over with at least high school graduation, and percent of population 25 and over with at least an undergraduate degree. The four variables were converted to z scores, summed, and divided by 4 to produce an SES score for each state. The resulting SES composite had a Cronbach’s alpha of .88.
White percent
The percent of the population that was identified as White in each state in 2007 was calculated from tabled state White and total population data from the U.S. Census Bureau (2009).
Urban percent
The percent of the population that was urban in each state in 2007 was estimated from data for 2000 (U.S. Census Bureau, 2010a) and 2010 (U.S. Census Bureau, 2010b). The 2000 and 2010 values produced a Pearson correlation of .995. To produce estimated state percentages for 2007, 2000 values were subtracted from 2010 values and the differences were multiplied by .7 and added to the 2000 values.
Unemployment rate
State unemployment rates were taken from the U.S. Census Bureau (2009) for 2007 and from the U.S. Census Bureau (2010a) for 2008. Rates for 2007 and 2008 were highly correlated (r = .79). The mean for the 2 years served as the value for each state in the present study.
Economic conservatism
The Pacific Research Institute formed the 2004 U.S. Economic Freedom Index from 1995-2003 state data on 143 welfare spending, government size, judicial, regulatory, and fiscal variables (Huang, McCormick, & McQuillan, 2004). The 2008 U.S. Economic Freedom Index was similar to the 2004 version but used updated data on the 143 variables (McQuillan, Maloney, Daniels, & Eastwood, 2008). The 2004 and 2008 versions were highly correlated, r(45) = .82, p < .001, so the two measures were converted to z scores and their mean was used to create composite economic conservatism values for each of the 50 states. Each of these state composite values was then multiplied by −1 so that a higher score reflects greater economic conservatism.
Gini index
The Gini index is a measure of income inequality based on residents’ net income. It is commonly used to assess the income gap between the rich and the poor. Scores range from 0 to 1; higher values reflect greater income inequality. Gini coefficients of income inequality for each of the 50 states in 2007 were provided by the U.S. Bureau of the Census (2008).
Political conservatism
The percent voting Republican in the presidential elections of 2004 (i.e., Bush) and 2008 (i.e., McCain) served as the basis for a state measure of political conservatism. State percentages for each election were provided by Leip (2014). The 2004 and 2008 variables were highly correlated, r(48) = .92, p < .001. Consequently, the present study used the mean of the two as the operational definition of political conservatism.
Analytic procedure
Means, standard deviations, and Pearson correlations were computed for the 13 variables in Study 1. Several multiple regression equations with various degrees of control and order of variable entry were then formulated to determine the relations of the Big Five personality variables to state levels of work satisfaction. As a benchmark, relations were considered statistically significant at the .05 probability level with two-tailed tests.
Results
Table 1 displays the means, standard deviations, and Pearson correlations for the 13 state-level variables in Study 1. Work satisfaction correlated significantly with neuroticism (−.49), the White population percent (.50), the unemployment rate (−.36), economic conservatism (.40), the Gini index (−.30), and political conservatism (.42). Neuroticism also correlated significantly with the unemployment rate (.33), economic conservatism (−.49), and the Gini index (.50).
Potential Predictors of Work Satisfaction in 2008: Means, Standard Deviations, and Correlations for the State Variables in Study 1.
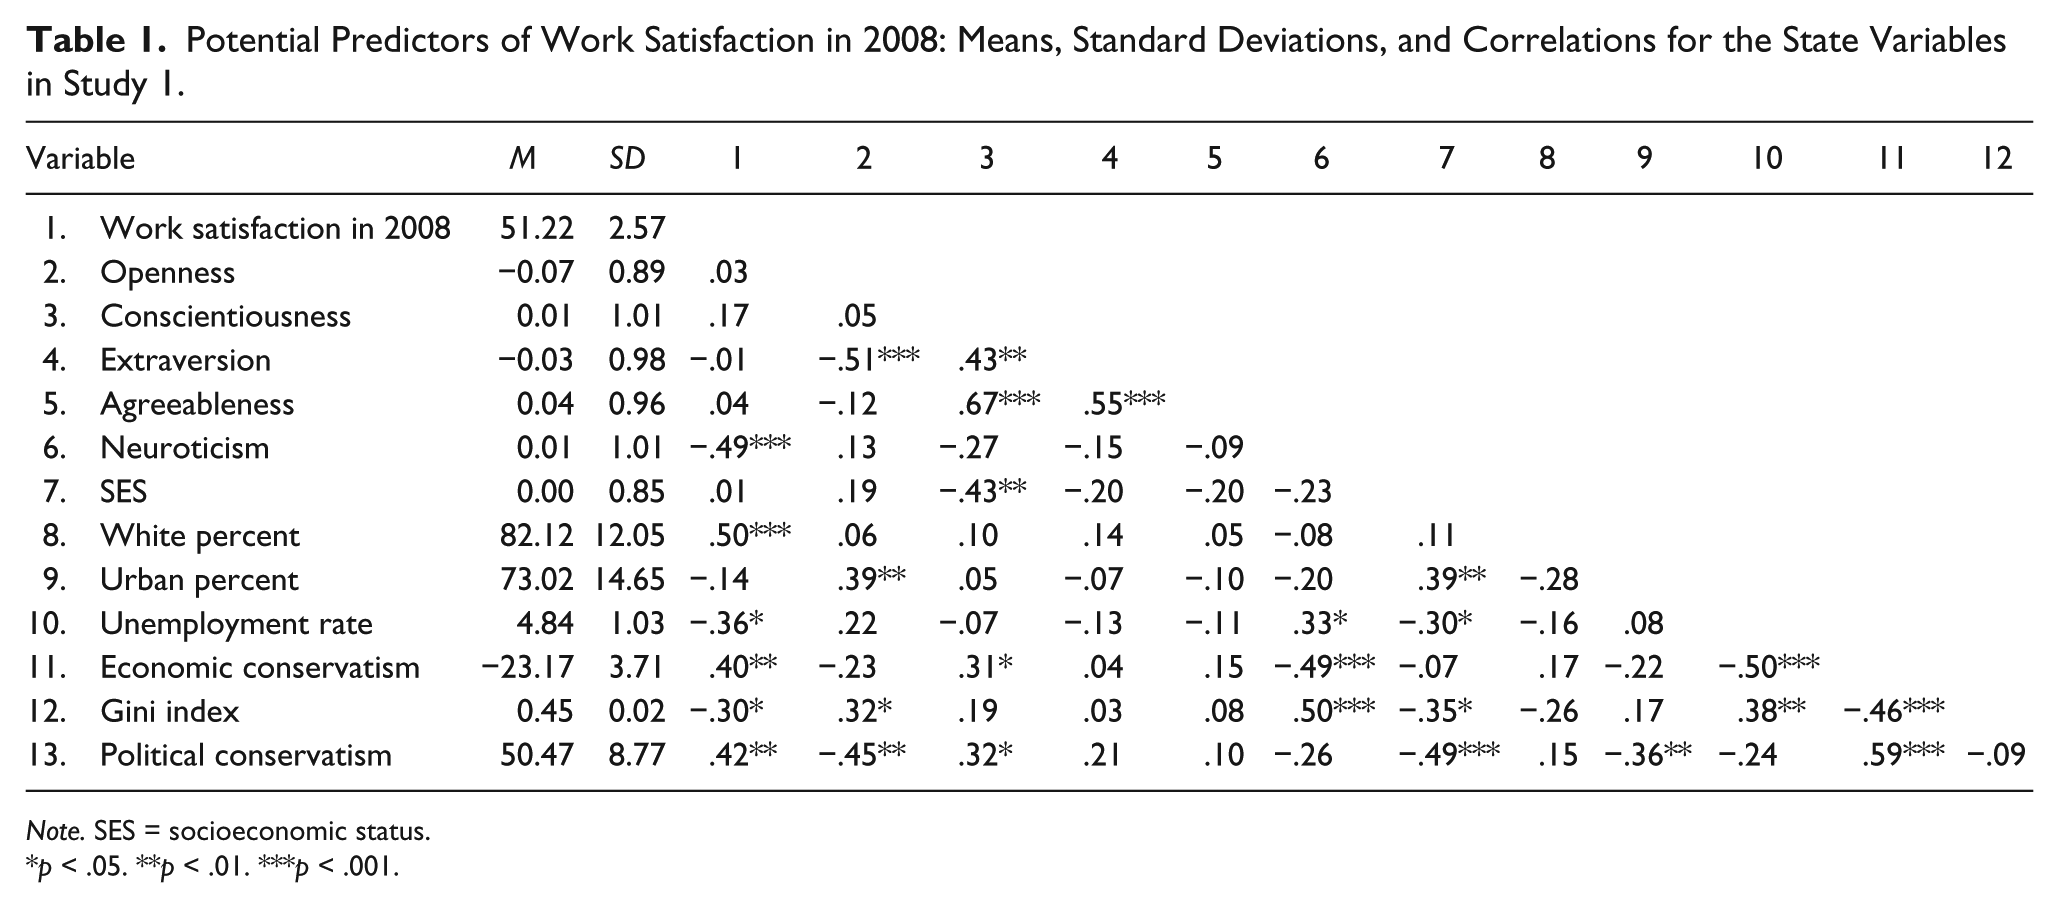
Note. SES = socioeconomic status.
p < .05. **p < .01. ***p < .001.
The possibility that outliers had an undue impact on the Pearson correlations between work satisfaction in 2008 and the Big Five was explored. Corresponding Spearman correlations were computed using state ranks. For neuroticism, openness, conscientiousness, extraversion, and agreeableness, respectively, the Spearman correlations were −.49 (p < .001), .05, .19, −.04, and .03, and the Pearson correlations were −.49 (p < .001), .03, .17, −.01, and .04. The corresponding correlations were very similar in magnitude and none changed statistical significance status. A scatterplot of neuroticism and work satisfaction in 2008 also showed no extreme outliers or other distributional issues (see Figure 1).
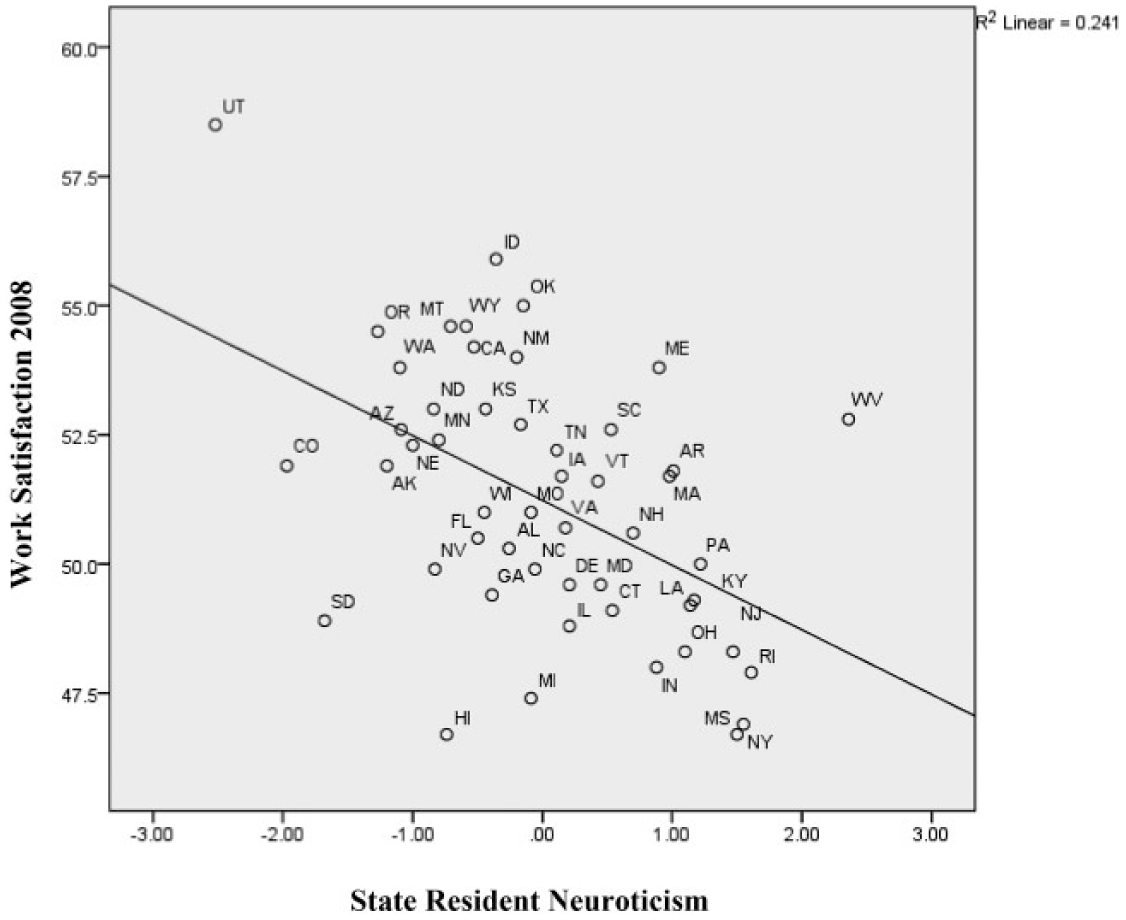
Scatterplot of state resident neuroticism and work satisfaction in 2008.
Neuroticism was the only Big Five variable related to work satisfaction not only in Table 1 but also when the other Big Five variables were statistically controlled in a standard multiple regression equation (Equation 1, Table 2). The Big Five jointly accounted for 25.6% of the variance in work satisfaction. Neuroticism was the only significant independent predictor (β = −.49).
Multiple Regression Equations Computed With 2008 Work Satisfaction as the Criterion in Study 1.
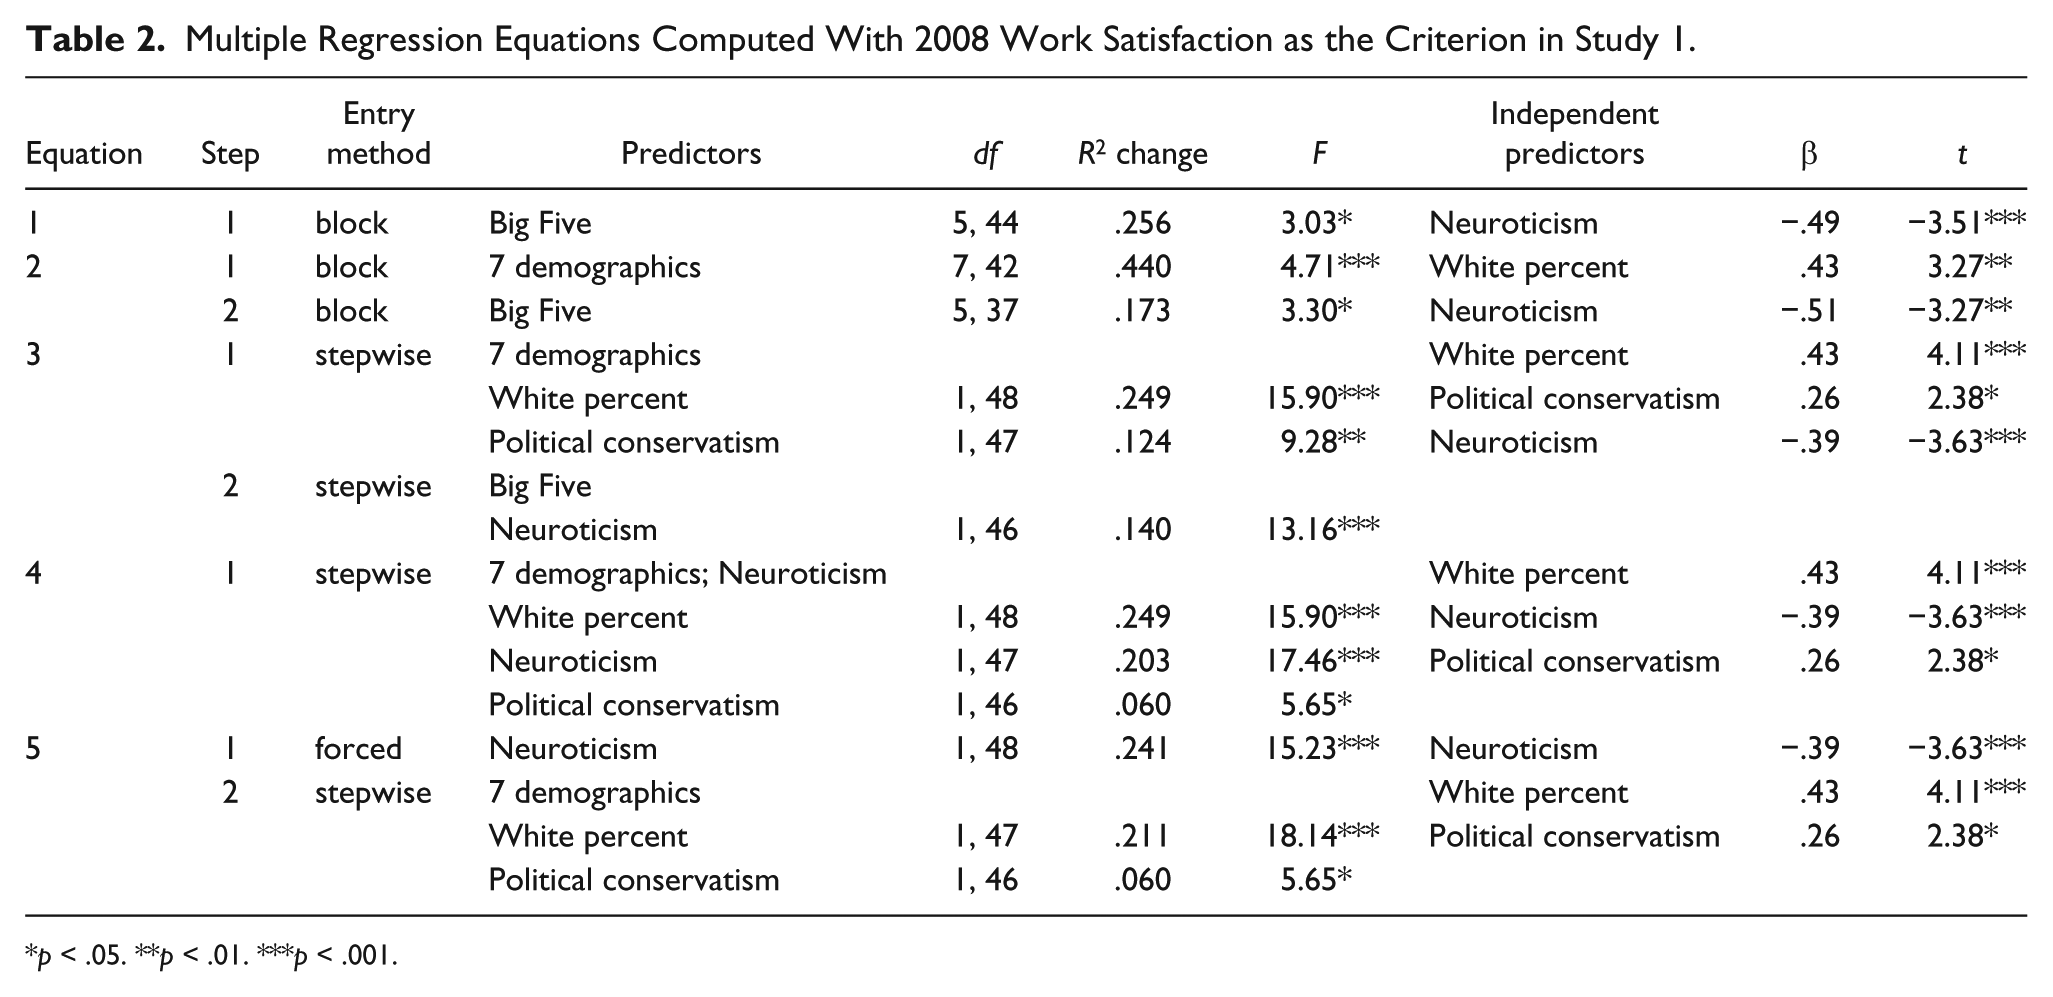
p < .05. **p < .01. ***p < .001.
As well, neuroticism was the only Big Five variable to emerge as an independent Big Five predictor when the seven control variables—SES, White population percent, urban population percent, the unemployment rate, economic conservatism, the Gini index, and political conservatism—were entered as a block and were followed by the Big Five entered as a block (Equation 2, Table 2). The seven demographic controls jointly accounted for 44.0% of the variance, and the Big Five accounted for a further 17.3%. Higher state resident neuroticism was associated with lower state work satisfaction (β = −.51).
To eliminate redundant and nonsignificant contributors, the preceding equation was modified so that the seven control variables were entered first in stepwise mode and the Big Five were entered second in stepwise mode (Equation 3, Table 2). White population percent accounted for 24.9% of the work satisfaction variance, political conservatism accounted for another 12.4%, and neuroticism accounted for a final increment of 14.0%. Higher state work satisfaction was associated with a higher White population percent (β= .43), higher political conservatism (β = .26), and lower resident neuroticism (β = −.39).
To pit the variance-accounting capacity of neuroticism against the other seven control predictors, a multiple regression equation was computed in which all seven demographic variables and neuroticism were selected with the stepwise procedure (Equation 4, Table 2). White population percent entered first and accounted for 24.9% of the criterion variance, neuroticism entered second and accounted for another 20.3%, and political conservatism entered last and accounted for a final 6.0%. Of course, the β coefficients were identical to those in Equation 3.
Finally, to determine the variance-accounting capacities of the seven “control” variables with state resident neuroticism controlled, a multiple regression equation was calculated with neuroticism entered on the first step and followed by the seven demographic variables selected stepwise (Equation 5, Table 2). Neuroticism accounted for 24.1% of the variance in work satisfaction, White population percent accounted for another 21.1%, and political conservatism accounted for a final 6.0%. Again, all three β coefficients remained as in Equation 3 and Equation 4.
Discussion
The results of Study 1 clearly show that higher state levels of satisfaction with work are associated with lower levels of state resident neuroticism or, in other words, higher levels of state resident stability. The state-level work satisfaction scores of 2008 were significantly correlated in a negative fashion with state-level neuroticism scores (r = −.49). As well, neuroticism was the only significant independent predictor of work satisfaction to emerge from a standard regression equation with the Big Five entered as a block of potential predictors. This result persisted when state SES, White population percent, urban population percent, state unemployment rate, economic conservatism, the Gini index, and political conservatism were entered as a block of state demographic controls and the Big Five followed as a block. Neuroticism also was a significant predictor when the seven control variables were entered stepwise and were followed by the Big Five entered stepwise. Furthermore, when the seven control variables and neuroticism were jointly entered stepwise, neuroticism entered second and accounted for 20.3% of the variance in work satisfaction, and, when neuroticism was entered on the first step and followed by the seven control variables entered stepwise, it accounted for 24.1% of the variance and only White population percent and political conservatism accounted for significant additional variance. Neuroticism clearly was a potent and robust predictor of work satisfaction in 2008.
Study 2
The United States was officially in the greatest economic recession since the Great Depression of the 1930s from December of 2007 until June of 2009, although lingering effects obviously persisted much longer (Sauter & Hess, 2013). Study 2 was carried out to determine whether state resident neuroticism is robust enough as a predictor of state-level work satisfaction to maintain its predictive capacity in a socioeconomic context wherein other economic variables may have increased impact on work satisfaction, especially so in some states more than others. The work satisfaction criterion for Study 2 was based on the Gallup-Healthways Well-Being Index for 2012 (Gallup, 2015).
In a similar fashion to Study 1, Pearson correlation and sequential multiple regression were used to examine the relation of state resident neuroticism and the other Big Five personality factors as assessed by Rentfrow et al. (2008) to the 2012 state work satisfaction scores in Study 2. Relations to work satisfaction also were tested with a variety of statistical controls. These included modified variables based on each of the controlled factors in Study 1: income, educational attainment, race, living in a rural or urban setting, employment status, income inequality, economic conservatism, and political conservatism. As well, GDP has been shown to relate to work satisfaction (e.g., Augner, 2015), and therefore, GDP growth served as a state control variable in Study 2.
Method
Participants
As in Study 1, the “participants” or cases in this study were the 50 states of the United States.
Measures
Work satisfaction
The Gallup-Healthways Well-Being Index for 2012 (Gallup, 2015) used the same approach and format as for 2008. It was based on the results of 353,564 phone interviews conducted throughout 2012 with a representative sample of U.S. residents 18 years of age and older. The work environment domain dealt with job satisfaction, perceptions of the work environment, and workplace interactions, in the same manner as the 2008 index. For the 50 states, on the 0 to 100 composite work environment scale, the mean was 47.9 and the standard deviation was 2.87.
Big Five personality variables
State resident Big Five personality scores provided by Rentfrow et al. (2008) for Study 1 also were used in Study 2.
SES 2010
The following four variables were used to form a simple additive composite state SES variable: population percent 25 years and above with at least high school graduation, population percent 25 years and above with at least a bachelor’s degree, personal income per capita in constant dollars, and percent of individuals below the poverty line. Data were obtained from the U.S. Census Bureau (2012). For 2010, data were not available for high school graduation, bachelor’s degree, or poverty line. Therefore, 2009 values served as substitutes for these three variables. Each of the four variables was converted to z scores for each state, and the sign was reversed for the poverty line variable. Subsequently, the four z score variables were summed and divided by 4 to produce an SES score for each state. Cronbach’s alpha was .87 for the 2010 SES composite.
White percent
The percent of the population that was White in each state in 2010 was calculated from tabled state White and total population data from the U.S. Census Bureau (2012).
Urban percent
The percent of the population that was urban in each state in 2010 was taken from the U.S. Census Bureau (2010b).
Peak-recession unemployment rate
Study 2 used peak-recession rates compiled by Sauter and Hess (2013) for each state for the most severe U.S. recession since the 1930s which ran officially from December of 2007 to June of 2009.
End-of-recession unemployment rate
Study 2 also used state unemployment rates at the end of the 2007-2009 recession compiled by Sauter and Hess (2013).
Economic conservatism
The economic conservatism of each state was gauged by scores on an economic freedom index for 2010 produced by the Fraser Institute (Bueno, Ashby, & McMahon, 2012). Each of the 50 states was analyzed at the subnational level. It is based on 10 components in three broad categories: size of government, labor market freedom, and takings and discriminatory taxation. For example, a few of the components are “general consumption expenditures by government as a percentage of GDP, . . . social security payments as a percentage of GDP, . . . sales tax collected as a percentage of GDP, . . . minimum wage legislation, . . . uniondensity” (pp. 6-9). A 10-point scale is used to provide a score for each state with higher scores indicating greater economic freedom, or higher economic conservatism.
Gini index
Gini coefficients of income inequality for each of the 50 states in 2010 were provided by the U.S. Census Bureau (2011). Scores range from 0 to 1 with higher values signifying higher income inequality.
Political conservatism
The percent voting Republican in the presidential elections of 2008 (i.e., McCain) and 2012 (i.e., Romney) served as the state measure of political conservatism in the present study. State percentages were provided by Leip (2014). The 2008 and 2012 variables correlated highly, r(48) = .97, p < .001, so the present study used the mean of the two as the political conservatism variable.
GDP growth
Percent increases in the GDP of each state in 2011 also were taken from the compilation of Sauter and Hess (2013) and used as an indicator of state-level economic prosperity. GDP values ranged from −1.2 in Wyoming to 7.6 in North Dakota.
Analytic procedure
Means, standard deviations, and Pearson correlations were computed for the 11 variables in Study 2. Several multiple regression equations with various degrees of control and order of variable entry then were formulated to determine the expected negative relation of state resident neuroticism to state levels of work satisfaction. The other Big Five personality variables also were evaluated. Relations were considered statistically significant at the .05 probability level with two-tailed tests.
Results
Table 3 displays the means, standard deviations, and Pearson correlations for the 15 state variables in Study 2. Work satisfaction in 2012 correlated significantly with neuroticism (−.49), SES (.32), the peak-recession unemployment rate (−.47), the end-of-recession unemployment rate (−.55), and the Gini index (−.53). 3 Neuroticism also correlated significantly with economic conservatism (−.36) and the Gini index (.46).
Potential Predictors of Work Satisfaction in 2012: Means, Standard Deviations, and Correlations for the State Variables in Study 2.
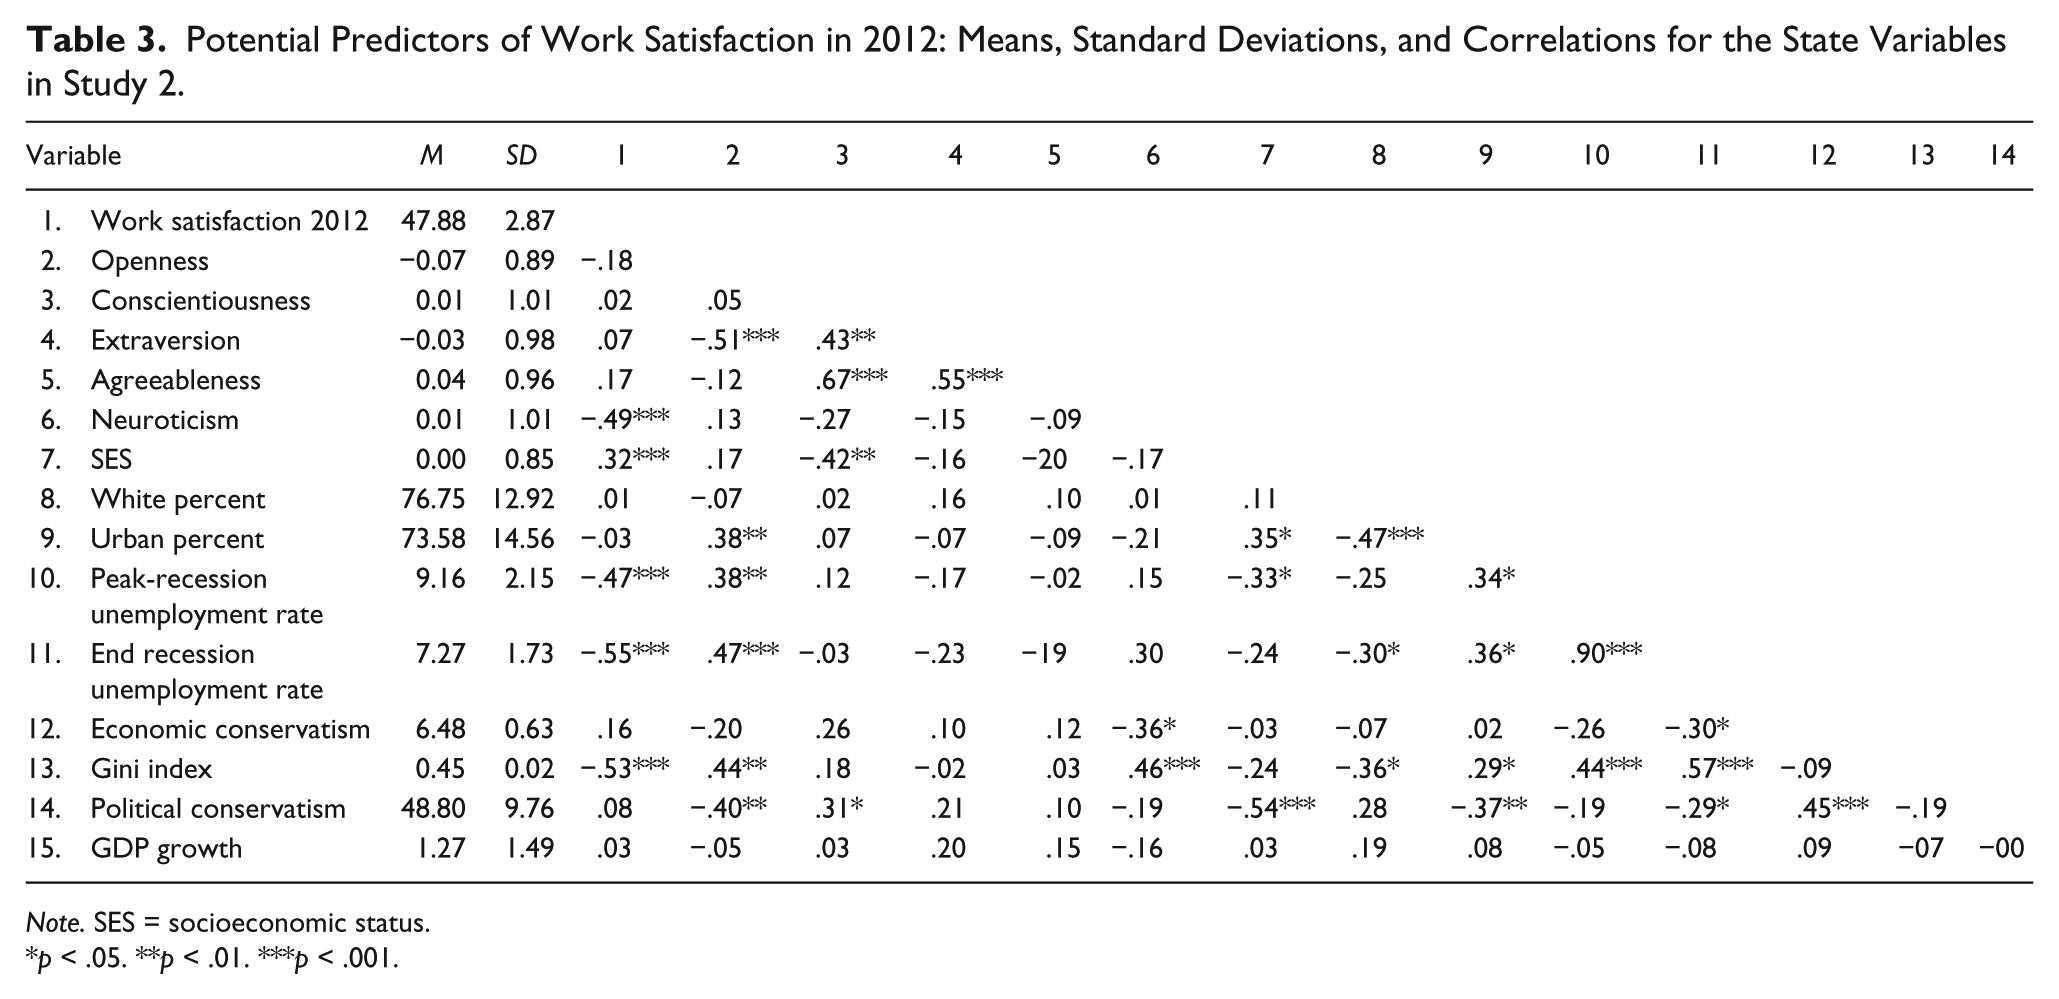
Note. SES = socioeconomic status.
p < .05. **p < .01. ***p < .001.
To determine whether outliers might have had an impact on the size of the Pearson correlations between work satisfaction in 2012 and each of the Big Five personality variables, corresponding Spearman correlations were computed using state ranks. The Pearson and Spearman correlations were quite similar in magnitude and identical in statistical significance status. The respective Pearson and Spearman correlations were −.49 (p < .001) and −.51 (p < .001) for neuroticism, −.18 and −.11 for openness, .02 and .06 for conscientiousness, .07 and .01 for extraversion, and .17 and .11 for agreeableness. A scatterplot of neuroticism and work satisfaction in 2012 also revealed no extreme outlier states or other distributional issues (see Figure 2).

Scatterplot of state resident neuroticism and work satisfaction in 2012.
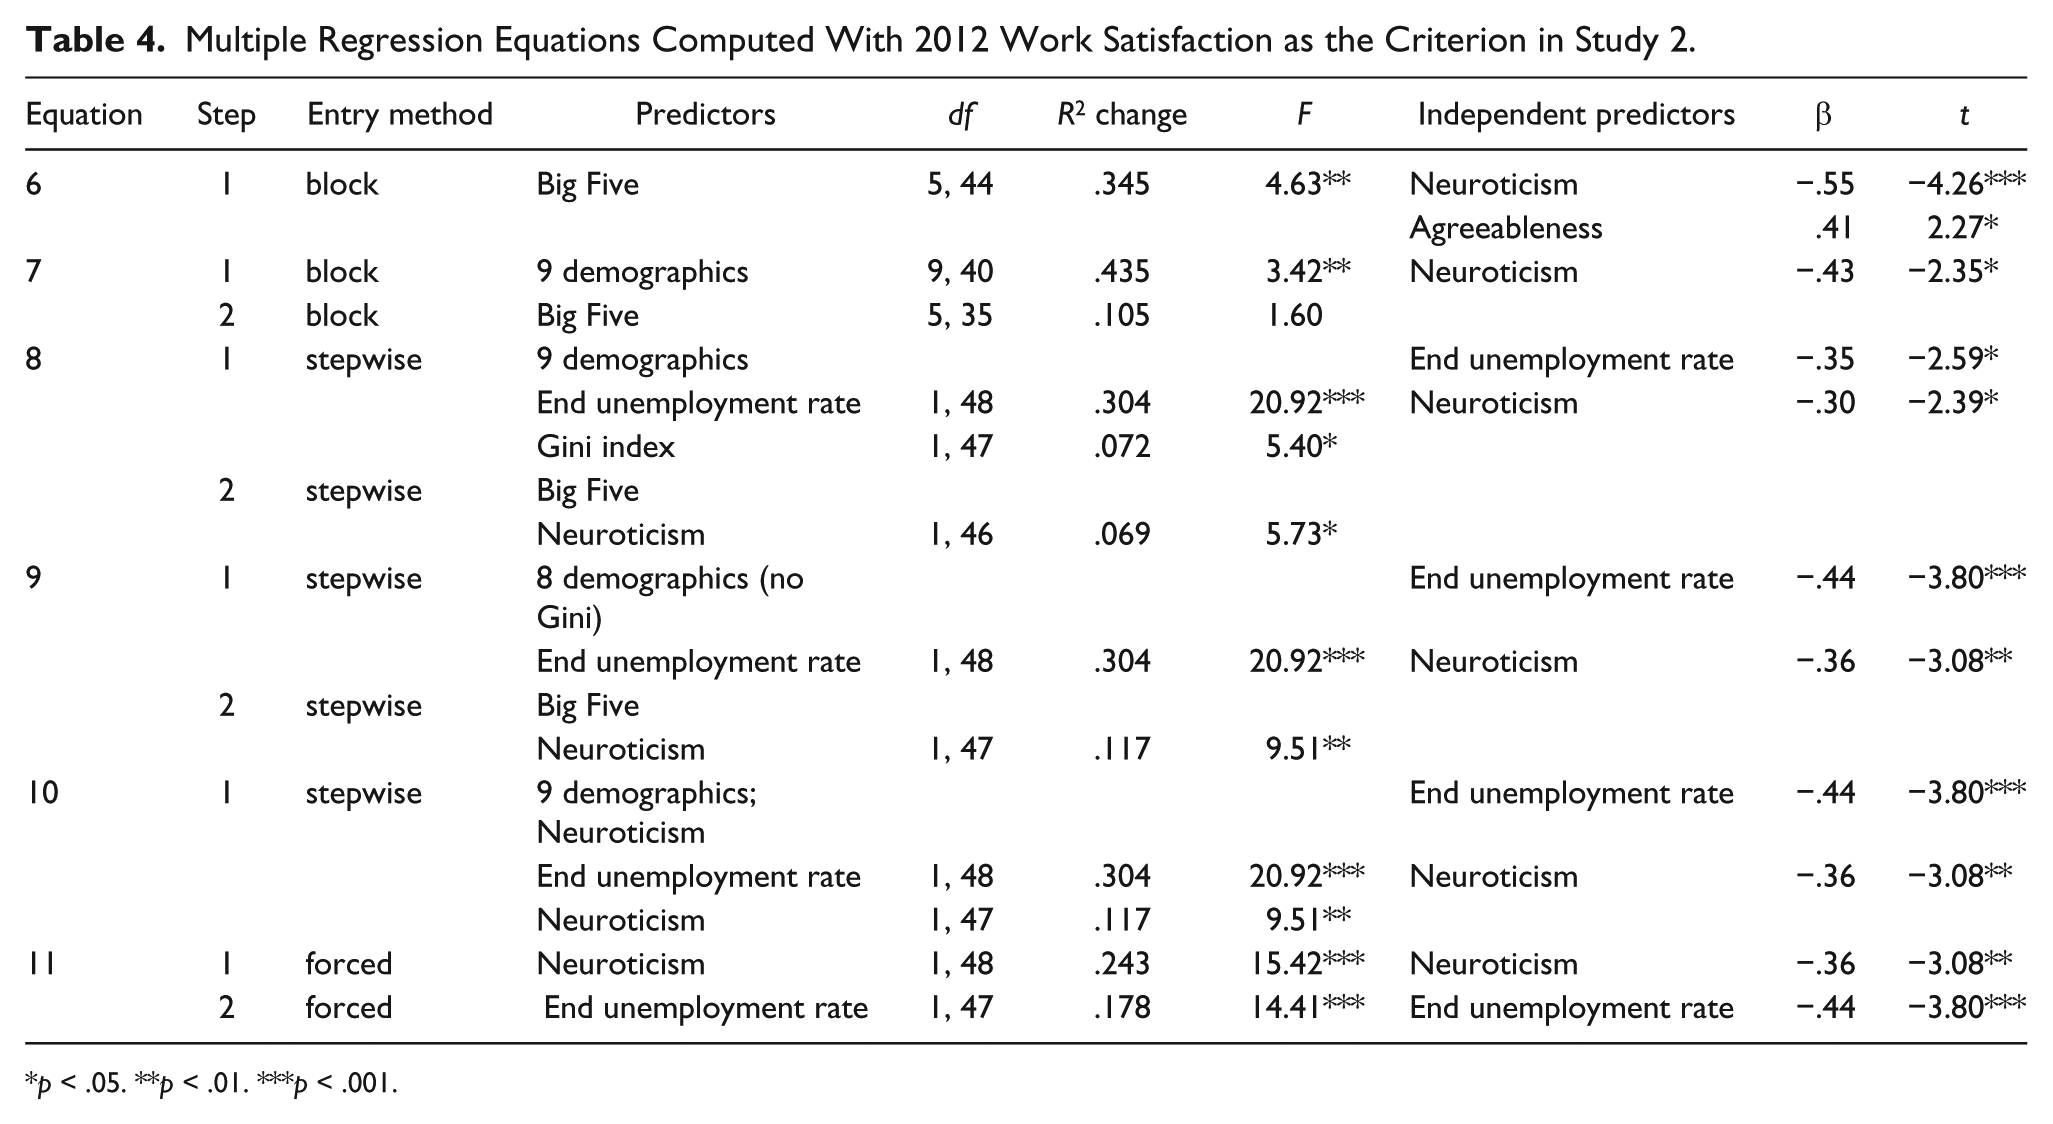
When the other Big Five variables were statistically controlled in a standard multiple regression equation (Equation 6, Table 4), neuroticism and agreeableness were significant independent predictors of work satisfaction in 2012. The Big Five jointly accounted for 34.5% of the variance in work satisfaction. Regression coefficients were significant for neuroticism (β = −.55) and agreeableness (β = .41).
Multiple Regression Equations Computed With 2012 Work Satisfaction as the Criterion in Study 2.
p < .05. **p < .01. ***p < .001.
However, neuroticism was the only independent Big Five predictor when the nine control variables—SES, White population percent, urban population percent, peak-recession unemployment rate, end-of-recession unemployment rate, economic conservatism, the Gini index, political conservatism, and GDP growth—were entered as a block and were followed by the Big Five entered as a block (Equation 7, Table 4). The nine demographic controls jointly accounted for 43.5% of the variance, and the Big Five accounted for a further nonsignificant 10.5%. The only significant regression coefficient was for neuroticism (β = −.43).
A sequential multiple regression equation then was computed by entering the nine demographic variables first in stepwise mode and entering the Big Five second in stepwise mode to eliminate nonsignificant and redundant predictors (Equation 8, Table 4). The end-of-recession unemployment rate accounted for 30.4% of the work satisfaction variance, the Gini index accounted for another 7.2%, and neuroticism accounted for a final increment of 6.9%. Regression coefficients were significant for end-of-recession unemployment rate (β = −.35) and neuroticism (β = −.30). Higher state work satisfaction was associated with a lower end-of-recession unemployment rate and lower resident neuroticism. However, the regression coefficient for the Gini index was not significant (β = −.20). Subsequently, the preceding equation was recalculated without including the Gini index (Equation 9, Table 4). End-of-recession unemployment rate accounted for 30.4% of the work satisfaction variance and neuroticism accounted for a final increment of 11.7%. Resulting regression coefficients were significant for end-of-recession unemployment rate (β = −.44) and neuroticism (β = −.36).
Another equation was computed to pit the variance-accounting capacity of neuroticism directly against the nine control predictors. The Gini index was placed back in the demographic pool along with neuroticism and a stepwise selection was made from the 10 variables (Equation 10, Table 4). The results were identical to those of the preceding equation (Equation 9, Table 4).
Finally, to determine the variance-accounting capacity of the end-of-recession unemployment rate variable with state resident neuroticism controlled, a sequential multiple regression equation was calculated with neuroticism entered on the first step and end-of-recession unemployment rate entered on the second step (Equation 11, Table 4). Neuroticism accounted for 24.3% of the variance in work satisfaction and the end-of-recession unemployment rate accounted for a final 17.8%. Of course, both regression coefficients were identical to those in Equation 9 and Equation 10.
Discussion
The results of Study 2 demonstrated an association between lower levels of state resident neuroticism and higher state levels of work satisfaction in 2012. Neuroticism was significantly correlated with work satisfaction with states as the units of analysis (r = −.49) and was an independent predictor when the Big Five entered a standard multiple regression equation as a block. As well, although 2012 work satisfaction was correlated significantly with prime recession indicators such as the peak-recession unemployment rate (r = −.47) and the end-of-recession unemployment rate (r = −.55), neuroticism had the only statistically significant regression coefficient (β = −.43) when all nine state demographic variables were entered as a block and followed by the Big Five entered as a block. Neuroticism also accounted for significant variance in 2012 work satisfaction and emerged as an independent predictor in a multiple regression equation in which the Big Five entered the equation stepwise after the nine demographic controls were selected stepwise, another in which all nine demographic controls and neuroticism were entered stepwise, and one in which neuroticism was entered on the first step and the end-of-recession unemployment rate was entered on the second step. Neuroticism was a potent and robust predictor of work satisfaction even though the higher unemployment rates of the recession also had demonstrable impacts on work satisfaction in 2012.
General Discussion
The present research showed that states with higher levels of resident neuroticism tended to have lower levels of work satisfaction. Importantly, this association persisted when a variety of state variables were statistically controlled including SES, White population percent, urban population percent, unemployment rate, economic conservatism, income inequality, and political conservatism in Study 1, and SES, White population percent, urban population percent, peak-recession unemployment rate, end-of-recession unemployment rate, economic conservatism, income inequality, political conservatism, and GDP growth in Study 2.
This is the first research to examine the relation between the Big Five personality variables and work satisfaction using states rather than individuals as the units of analysis. However, the state-level association of higher neuroticism and lower work satisfaction found here is consistent with the individual-level association found in many studies mentioned earlier in this article (e.g., Cohrs et al., 2006; Cooper et al., 2013; Judge et al., 2002). It is quite plausible and probable that the state-level relations reflect the individual-level relations between neuroticism and work satisfaction. Nevertheless, it is still possible that parallel relations at the individual and the state level may stem from different factors at each level as Rentfrow et al. (2008) were aware. But this does not seem to be a strong possibility here given the degree of statistical control of other factors and the strength of the relation between neuroticism and work satisfaction in the present context.
The pathway approach of Rentfrow et al. (2008) outlined earlier in this article suggests that states with residents higher on the neuroticism dimension may develop and sustain lower levels of work satisfaction through five different channels (see Figure 3). Path A (“personality affects behavior”), Path C (“social influence affects behavior”), and Path E (“social norms affect trait prevalence”) appear to be most important in this context. Nevertheless, it is possible too that Path B (“group behavior affects geographic representation”) and Path D (“institutions affect behavior”) contribute to some degree to the relation between resident neuroticism and work satisfaction. (The preceding quotations are from Rentfrow et al., 2008, p. 344.)

Five pathways through which higher state resident neuroticism can result in lower state levels of work satisfaction.
Conscientiousness and extraversion did not surface as predictors of work satisfaction in Study 1 or Study 2. Relations of these variables to work satisfaction found at the individual level in the meta-analyses of Judge et al. (2002) and Bruk-Lee et al. (2009) perhaps simply were too weak to emerge as state-level predictors in the present research. Based on the mean correlations for work satisfaction and these two Big Five personality variables reported in the two meta-analytic studies, the relation involving conscientiousness was only 55% as large as the relation involving neuroticism and work satisfaction, and the relation involving extraversion was only 43% as large.
Using the same approach, the relation involving agreeableness was only 28% as large as the relation involving neuroticism. Nevertheless, higher agreeableness was significantly associated with work satisfaction in the multiple regression equation in Study 2 in which the Big Five variables entered as a block without demographic controls. However, it was not related to work satisfaction in any other analysis in either Study 1 or Study 2.
Issues and Limitations
Caution should be exercised in the interpretation of the effect sizes of relations between neuroticism and work satisfaction at both the aggregate and the individual level of analysis. They can be markedly discrepant. The correlations found in the present studies are relatively large. Elevated effect sizes commonly result in part from the process of aggregation (e.g., Erikson, Wright, & McIver, 1993; Ostroff, 1993; Rushton, Brainerd, & Pressley, 1983). Measurement errors tend to cancel out during the aggregation process, and this produces correlations after aggregation that are larger and more stable than correlations based on the original individual cases. Ostroff (1993) examined the question of whether a higher correlation at the aggregate level means that there are different processes occurring at the individual and the aggregate level. Ostroff concludes that when the same processes are assumed to be operative at the individual and the aggregate level, “similar correlations at both levels are expected” (p. 570). In the present context, Path A tends to satisfy this assumption. However, Path B, Path C, Path D, and Path E, as articulated in Figure 3, suggest quasi state-level effects, even though they ultimately depend on state differences in the level of resident neuroticism. They would appear to have much less impact than the Path A process. Therefore, one might expect the state-level correlation to be marginally stronger than the individual-level correlation. But as Ostroff points out, “when measurement error is present and a researcher concludes that the (aggregate) correlation is stronger than the individual correlation without accounting for measurement-error effects, the conclusion is erroneous” (p. 579). However, in the present research, individual-level data were not available to the author to compare aggregate and individual-level correlations to determine the magnitude of the part that individual-level error variances contributed to the differences between individual- and state-level neuroticism-work satisfaction correlations.
As noted earlier, Rentfrow et al. (2008) cautioned that there are inherent risks in cross-level extrapolation. Relations at one level do not mean necessarily that similar relations will be found at the other level. Results at the aggregate and individual level may be logically independent. Furthermore, it can be argued that relations at the aggregate and the individual level may demonstrate consistency but processes producing the parallel relations still may be logically independent. However, parallel associations between lower neuroticism and higher work satisfaction now have been empirically documented at both the state and the individual levels, and Paths A, C, and E, and perhaps Paths B and D to a lesser extent, provide plausible explanations for how resident neuroticism may come to be expressed at the state level. Such empirical evidence and explanatory processes strongly suggest that relations between neuroticism and work satisfaction at each level are dependent but cannot unequivocally rule out some degree of independence between individual-level and state-level dynamics.
Although all state-aggregated variables were based on high-quality data from large and representative state samples, some readers might be concerned that there may have been little overlap in who was selected for each of the samples. This issue would apply most to those in the personality sample and those in the work satisfaction sample. The state-level control variables were from official government sources, and it can be assumed that they demonstrated sound psychometric properties and reflected clearly the standing of each state. However, the possible lack of sufficient overlap in those serving in the personality and work satisfaction samples should not be viewed as detrimental. The goal was to use state-aggregated estimates for state-level analysis. If the state-level relations found in the present research are dependent on individual-level relations between personality and work satisfaction as suggested, then sample incongruence would reduce the chances of finding such state-level relations. But such relations were found, and this can be interpreted as attesting to the apparent strength of those suggested underlying individual-level relations.
Of course, the usual caution that one cannot infer causation from correlational research applies to this study. The present report suggests that higher state levels of resident neuroticism result in lower work satisfaction, but a sound directional conclusion cannot be drawn empirically from the correlation-based analyses. However, it must be understood and appreciated that a personality variable or any other individual difference variable that is integral to the person can never be an independent variable in a true experiment, the only available research tool for a sound causal inference. For example, we may assume that differences in intelligence cause differences in behavior but such a causal connection cannot be empirically verified because intelligence levels cannot be randomly assigned to participants in a true experiment. Consequently, the only empirically verified causal variables in psychological research must remain environmental variables. This subtle but overwhelming artifactual bias in published research toward environmental causation based on the limitations of research design and statistical inference seems most often to be overlooked. The directional sequence from neuroticism to work satisfaction implied in the present report seems most plausible as the foundation for the association between state resident neuroticism levels and work satisfaction.
Another theoretical possibility is that a low work satisfaction environment may have some impact on resident levels of neuroticism. However, it may be more appropriate to speculate that a low satisfaction work environment may have some impact on expressions of neurotic tendency but not on the underlying neuroticism dimension. A chief architect of the Five-Factor framework, McCrae asserts “that traits have only biological bases” and that culture shapes “the expression of traits but not their levels” (Hofstede & McCrae, 2004, p. 74). This contrasts sharply with the view of others such as Hofstede who contend “that culture explains levels of trait scores” (Hofstede & McCrae, 2004, p. 71).
It is also possible that unspecified variables related to both neuroticism and work satisfaction are responsible for the relations found in the present work. However, it is clear from the analyses that the relation between neuroticism and work satisfaction cannot be accounted for by state differences in SES, White population percent, urban population percent, unemployment rate, economic conservatism, income inequality, political conservatism, or GDP growth.
Some readers may have concerns about multiple regression analysis of small samples. The case-to-predictor ratio was far from optimal for multiple regression analysis in the present research. A small sample size also limits the number of predictors that can be used because degrees of freedom are rapidly reduced for significance tests. When the ratio of cases to predictors is somewhat less than optimal for multiple regression analysis, some degree of instability in the predictors and the coefficients that result can be expected. These problems can occur even with minor changes in criteria or sample composition. Although cautious interpretation always is in order, such inferential concerns regarding the present research should be minimized. The primary purpose of inferential statistics is to estimate the degree of confidence in generalizing from a representative sample to a population, but the present research is unusual in that potential errors of inference regarding population parameters are not pressing issues because the sample and population are one and the same, the 50 states. Because the sample and the population are isometric, what is found in the sample applies directly to the population. The population parameters are known beforehand and do not have to be “estimated” in the usual inferential sense. Nevertheless, the database and the criterion largely remained constant in each of these two studies and the careful selection of potential predictors and use of composites (e.g., SES) minimized loss of degrees of freedom. Such regression and correlation strategies with small samples often have been successful in past research (e.g., Barber, 2001, 2015; de Vries et al., 2011; Erikson et al., 1993; McCann, 1992, 1997, 2008, 2014a; Pesta & McDaniel, 2014; Simonton, 1986, 2001, 2006).
Potential Applications
The research of others has demonstrated that work satisfaction also relates to several important work outcomes such as absenteeism, voluntary termination, and organizational citizenship behavior (e.g., Konovsky & Organ, 1996; Porter & Steers, 1973). As well, conventional wisdom asserts, and many studies have confirmed, that higher worker satisfaction leads to greater worker productivity (e.g., Isen & Baron, 1991; Judge, Thoresen, Bono, & Patton, 2001; Riketta, 2008), although some studies also have shown that there may be bidirectional effects (e.g., Brown, Cron, & Leigh, 1993; Lawler & Porter, 1967). Such connections of work satisfaction to core aspects of productive worker behavior emphasize the importance of the study of work satisfaction at the state level of analysis.
With 52.3% of Americans reporting in a national survey that they were unhappy with their jobs in 2013 (Adams, 2014), it is beneficial to know where in the nation work dissatisfaction is highest and whether the variance in state levels of such dissatisfaction stems from stable resident dispositional features or more mutable job characteristics. The present research provides such information, at least regarding state resident dispositional features. Knowledge of state-level relations between satisfaction and job characteristics certainly would be helpful, but to the degree that neuroticism contributes to work dissatisfaction, it may be beneficial for governments and other relevant entities to tailor approaches to encourage greater engagement and higher morale in the workplace depending upon the average level of neuroticism of the state workforce.
Future Research
Future research could be conducted at the state level to pit the robustness of the relation between neuroticism and work satisfaction against other categories of work satisfaction antecedents not controlled in the present study. 4 For example, it would seem possible to quantitatively estimate the degree to which key job characteristics (e.g., Hackman & Oldham, 1976) such as skill variety, autonomy, and task significance exist in each state. Perhaps quantitative state estimates of organizational factors (e.g., Levy, 2003) such as opportunities for promotion and the receiving of equitable rewards also could be included as controlled variables in such research.
As well, there is nothing in the present results that suggests that the same relations between neuroticism and work satisfaction would not occur in other nations and geographical units. Both key variables would appear to occur universally with sufficient variance to support such relations. Therefore, future cross-cultural research also could pursue a multinational approach to examine whether potential cultural moderators such as prosperity/poverty and individualism/collectivism have an impact on the association between higher neuroticism and lower work satisfaction or whether the neuroticism–work satisfaction association is relatively invariant. Several relatively recent studies have examined cross-national Big Five personality profiles and their relations to various other national-level indicators (e.g., Allik & McCrae, 2004; Bartram, 2013; McCrae & Terracciano, 2007; Schmitt, Allik, McCrae, & Benet-Martınez, 2007; Vazsonyi, Ksinan, Mikuka, & Jiskrova, 2015).
Conclusion
In a general sense, the present study exemplifies the usefulness of the state-level Big Five personality variables in the testing of hypotheses based on the results of psychological theory and research at the individual level. To Rentfrow et al. (2008), such macro-level research expands the scope of our understanding of human behavior and fosters integration of aggregate-level and individual-level strategies. To some degree, such an approach serves to help create theoretical and methodological bridges between psychological, sociological, and other social science perspectives, perhaps especially within a cross-cultural context.
Footnotes
Declaration of Conflicting Interests
The author(s) declared no potential conflicts of interest with respect to the research, authorship, and/or publication of this article.
Funding
The author(s) received no financial support for the research, authorship, and/or publication of this article.