
Abstract
We evaluate two models that may explain variation in the inclusiveness of governments and their ability to provision public goods. The revenue model predicts that a government’s source of revenue determines whether elites invest in effective bureaucracy and the provision of public goods that benefit wide swaths of society or the extraction of resources from society to benefit a limited network. In this model, a cooperative society with high social capital is an outcome of effective, collective government. The combined model predicts that social capital has a semi-independent causal effect, in addition to revenue, on the inclusiveness of governments. Our results indicate that the combined model of collective governance fits the data on U.S. states better than the revenue model alone. The combined model of governance predicts that revenue and social capital moderate the population size–political complexity relationship, and data from the U.S. states are consistent with these predictions.
Introduction
A substantial body of research in anthropology suggests that variation in the complexity of political systems results, in part, from the various ways that social actors use power to solve collective action problems (Blanton & Fargher, 2008, 2016; Blanton, Feinman, Kowalewski, & Peregrine, 1996; Blanton, Kowalewski, Feinman, & Finsten, 1993; Carballo, 2012; Carballo, Roscoe, & Feinman, 2014; Feinman, 2011). Collective action problems occur in situations where an individual’s short run self-interest conflicts with the interest of a group as a whole. For example, when a government official has the choice to funnel tax money into a private account or spend it on a new bridge that benefits society at large, this simple choice-set embodies a collective action problem. The goal of this article is to evaluate models developed by archaeologists and political scientists that may explain the development of more inclusive versus exclusive political systems.
Inclusive governments serve the broader interests of society rather than the narrower interests of individuals or special interest groups (Acemoglu & Robinson, 2012; Blanton et al., 1996). These governments are formed via the deployment of corporate power strategies. Corporate power strategies share power across segments of society in such a way as to limit exclusion and the accumulation of resources by individuals within a limited network of social relationships (Blanton et al., 1996; North, Wallis, & Weingast, 2009). Exclusive governments, by contrast, favor narrower over broader interests, creating relationships based on precedent and the extraction of resource rents (material, spiritual, or financial) by a few at the expense of everyone else (Acemoglu & Robinson, 2012; Blanton et al., 1996). These governments are formed via coalitions of elites that use an exclusive power strategy. Exclusive power is the ability of social actors to monopolize a source of power, like revenue from a resource, and use the revenue to create personal networks (Blanton et al., 1996). These are not ideal types, but, rather, different integrative strategies for coordinating political action in social groups (Blanton et al., 1996; North et al., 2009). Any society will contain a mix of the strategies; however, the dominant strategy will vary. More inclusive governments simply contain elites and commoners who solve collective action problems in ways that benefit larger swaths of society via the provision of public goods more often than exclusive governments.
In the sections that follow, we evaluate two models that may explain the formation and effectiveness of more inclusive governments: A revenue model that places causal emphasis on the incentives that a government’s basic revenue source provides for collective action and a combined model of governance that proposes revenue and generalized reciprocity, a form of social capital, have semi-independent causal effects on collective action and the formation of inclusive governments. To conclude, we explore the mutual effects of a state’s revenue source and social capital on the population–political complexity relationship. Consistent with theory developed by archaeologists, we find that revenue and generalized reciprocity both have effects on the formation and effectiveness of collective governments, and both factors interact with population size to moderate the population–political complexity relationship among modern U.S. states. The results of our study are consistent with the idea that the distinction often made in social science between modern and premodern political systems is artificial; the same underlying causal dynamics that affect the development and performance of premodern states appear relevant for understanding the performance of postindustrial, U.S. states.
Two Ideal Models of Collective Governance
Inclusive governments require individuals to self-organize and solve two collective action problems (Knack, 2002). First, commoners must demand fair treatment and hold government elites accountable for not acting in a fair manner (e.g., providing jobs to cronies), perpetuating inequality (Bowles, Durlauf, & Hoff, 2006). This is a collective action problem because holding elites accountable is voluntary and entails an opportunity cost for individuals. A sufficient number of people must participate in actions such as protests, letter writing, voting, or other strategies (i.e., choose not to free ride) to demand equitable governance and the associated provision of public goods (Knack, 2002; Putnam, Leonardi, & Nanetti, 1993). Furthermore, elites, who are the principal decision makers in a government (e.g., elected officials, monarchs, regents), must choose to invest resources to benefit many in society rather than themselves and a limited network, which, again, is a collective action problem because there are opportunity costs associated with such investments. Second, once in power, elites must act collectively to set policy rather than simply fight and end up in deadlock. The basic assumption here is that variation in the inclusiveness of governments is an outcome of variation in the ability of some populations to solve these collective action problems using corporate power strategies rather than exclusive power strategies (Blanton & Fargher, 2008; Knack, 2002; Putnam et al., 1993).
Blanton and Fargher (2008) propose that the source of a government’s revenue has direct and indirect effects on the ability of populations to solve the collective action problems necessary to form collective governments (the “revenue model”). Drawing on rational choice theory, they argue that the source of a government’s revenue determines the willingness of elites to provision public goods and invest in a professional bureaucracy, as well as constraints on the power of elites (Figure 1a). The logic behind this model is as follows: Where elites are dependent upon revenues obtained from selling resources that are easily controllable, like the export of point source natural resources (so-called external revenue), elites maximize their revenue intake by underinvestment in public goods and hoarding the revenue generated by controllable resources to create exclusive networks (see also Acemoglu & Robinson, 2012; Gilberthorpe & Papyrakis, 2015). Conversely, where a government’s finances come from an internal tax base (i.e., a diverse population of tax payers), failure to serve the broader social interest by providing public goods and investing in a quality bureaucracy should cause rational tax payers to stop paying taxes. Thus, rational elites (who have the goal of maximizing revenue) will serve the broader interests of society, investing in corporate power strategies, whenever they depend on more internal tax revenue to help ensure that commoners (citizens) receive public goods, which provides an incentive for individuals to voluntarily comply with tax laws (Blanton & Fargher, 2008; Levi, 1988).

Models of governance: (a) “revenue model” and (b) “social capital model.”
For example, Acemoglu and Robinson (2012) contrast the colonial regimes of Spain in South and Central America and Britain in North America to illustrate the dynamics of a model of inclusive versus extractive states that shares many assumptions with the revenue model. In South and Central America, Spanish colonials could coerce indigenous labor to extract point source resources, such as gold, silver, and agricultural products for the benefit of elites. The whole colonial system was set up to maximize top-down control over commoners and maximize the revenue taken above the subsistence level of commoners by elites in the colonies and in Spain. In contrast, Acemoglu and Robinson argue that the Virginia Company initially tried the extractive approach, but this failed because the point source resources, like gold mines, were not available, and the population density (and, thus, potential labor force) of North America was much lower. Acemoglu and Robinson (2012) state, Just as the attempt to impose draconian rule in Virginia failed, so did the plans for the same type of institutions in Maryland and Carolina . . . In all cases it proved impossible to force settlers into a ridged hierarchical society, because there were simply too many options open to them in the New World. Instead they had to be provided with incentives for them to want to work. And soon they were demanding more economic freedom and political rights. (p. 27)
In sum, where it is difficult for elites to extract revenue from controllable resources, the best bet for political elites to maximize their revenue is to provide public goods and better quality governance. In turn, inclusive governance provides incentives for individuals to work hard and generate surplus wealth, which can then be taxed or skimmed off by elites.
In contrast to the revenue model, Putnam et al. (1993) place causal emphasis on a feedback between social capital, governance, and prosperity (Figure 1b). In this social capital model, participation in civic organizations create norms of generalized reciprocity and networks of (genetically) unrelated individuals who have social bonds. Where organizations and actors engage in strategies to increase generalized reciprocity, the ability of individuals to solve the collective action problems associated with holding government officials accountable and working toward common goals improves. Where governments serve the broader interests of society rather than narrower special interests, including an official’s self-interest by establishing patronage networks, governments are better at providing public goods, like roads, sanitation, and the rule of law (Fukuyama, 2011). The more effective provision of public goods leads to increases in prosperity, which leads to more civic engagement and maintains high levels of generalized reciprocity in a virtuous cycle (Putnam et al., 1993). The linchpin of this model is the effect of generalized reciprocity on collective action and, thus, inclusive and effective governance.
Generalized reciprocity is a form of social capital and contrasts with social capital built via membership in exclusive networks (Ahn & Ostrom, 2008; Putnam et al., 1993). Exclusive networks often have high levels of social capital that favor cooperation within a well-specified group. Generalized reciprocity, conversely, is a form of social capital that widens networks of individuals by providing incentives to treat unknown individuals like they are kin. Norms of generalized reciprocity (which we call social capital from here on) are argued, in turn, to improve collective action because they reduce in-group–out-group conflicts, the temptation to free ride, and the costs of monitoring others’ behaviors (Knack, 2002; Putnam et al., 1993). Thus, commoners are more likely to invest in voluntary actions (voting, letter writing, etc.) that hold government officials accountable. And, individuals within a government are more likely to work toward broader group interests when norms of generalized reciprocity incentivize their decision making. In a sense, norms of generalized reciprocity can sometimes override self-interest because the sense of community created by such norms provides an incentive to cooperate widely. The improvements in collective action caused by investments in norms of generalized reciprocity, in turn, lead to more effective governments designed to serve more inclusive public interests, the better provision of public goods, and, eventually, this leads to more prosperity (Putnam et al., 1993).
The critical difference between the revenue model and the social capital model is the causal structure. In the revenue model, revenue source has a direct causal effect on the quality of governance, both in terms of the provision of public goods and the quality of the bureaucracy. Importantly, in the revenue model, the revenue source of a government also has an indirect effect on the quality of the bureaucracy. This is a subtle causal pathway, and Blanton and Fargher (2008) do not provide an explicit mechanism for this indirect effect. The indirect effect means that where governments are dependent upon more internal tax revenue for funds, government officials have an incentive to provide public goods. In turn, the provision of public goods leads to a more professional and effective bureaucracy. One mechanism that might explain this indirect effect is that where public goods are more prevalent, the human capital (e.g., education and training) of a population increases. Such increases could increase the pool of qualified persons to run the bureaucracy, thereby increasing the quality of the bureaucracy (Freeman, Coyle, & Baggio, 2016). Furthermore, in the revenue model, social capital is an implied outcome of collective governance rather than a causal force that shapes governance. As Acemoglu and Robinson (2012) tell us, “the extent to which people trust each other or are able to cooperate, are important but they are mostly an outcome of institutions, not an independent cause” (p. 57). This implies that social capital is an indirect consequence of the main revenue source in a society.
Conversely, in the social capital model, norms of generalized reciprocity have an effect on governance, providing incentives for officials to work toward broader public interests and, more importantly, providing incentives for elites to create a flexible, autonomous bureaucracy populated by individuals committed to providing services to a large population. In turn, and in contrast to the revenue model, the collective and effective bureaucracy leads to the more effective provision of public goods. In sum, social capital, in the form of generalized reciprocity, has a semi-independent causal role in the formation and performance of collective governments. Investments in social interactions that promote such norms—for instance, by actors establishing civic organizations apart from the government—affect the structure of a political system by increasing the incentives for collective action, which leads to more collective governance.
Predictions
While the revenue and social capital models are alternatives in the literature, developed independently, they are not mutually exclusive (e.g., see Blanton & Fargher, 2008). Indeed, Blanton and Fargher (2016) have recently developed a set of arguments, building on the revenue model, that mirror those of Putnam and colleagues. In particular, they argue that there is a “coactive causal process” in which increases in collective action, commercialization, standard of living, population, and productivity all mutually reinforce each other and, under the right conditions, lead to more inclusive states and prosperous (materially) societies. Blanton and Fargher (2016) discuss the potential for production elasticity, wealth inequality, the challenges of urban living, and the formation of markets to all foment or limit the coactive causal process. Most similar to Putnam and colleague’s argument is the idea that when markets are run by paragovernment organizations (civic organizations in Putnam’s terms), these markets provide a model of how equitable and efficient organizations that solve problems are run, and this social model “spills over” into society at large.
In market places, people came to imagine that the possibility that a form of governance could be problem solving and efficient, with the goal of providing management services commensurate with what is demanded of those services and to do so on a socially equitable basis. (Blanton & Fargher, 2016, p. 280)
Therefore, here we do not compare the revenue and social capital models but, rather, the strict revenue model and a combined model of collective governance. The combined model proposes a causal structure similar to the social capital model, but proposes that revenue source and the creation of social capital, in the form of generalized reciprocity, are potentially countervailing or amplifying causal processes that affect collective action and, thereby, the inclusiveness of states. There are two key open issues.
(a) Is social capital an outcome of political organizations and policies (revenue model) or does social capital have causal effects on the formation of a professional bureaucracy and, subsequently, the provision of public goods, in addition to revenue source (combined model)? (b) Does investment in public goods mediate the effects of revenue on the development of a professional bureaucracy (revenue model) or vice versa (combined model)? Our objective below is to evaluate whether the causal structure of the revenue model or the combined model of collective governance is more consistent with data on the performance of inclusive state governments. The causal structures of the revenue and combined model of collective governance are illustrated in Figure 2.
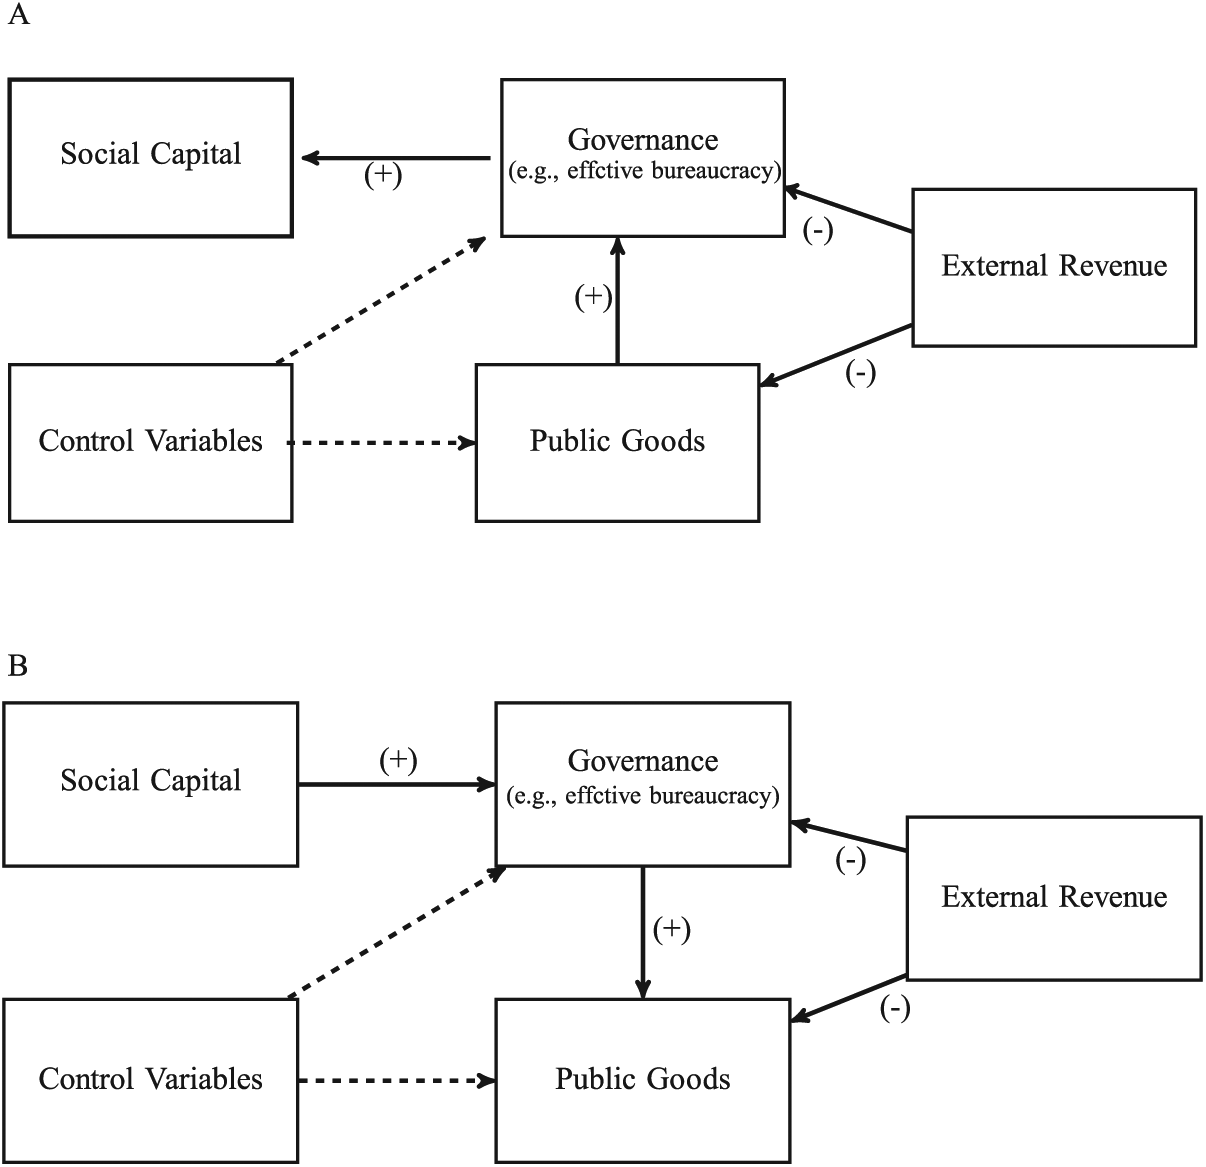
Models of governance: (a) “revenue model” and (b) “combined model.”
Figure 2a illustrates the predictions of the revenue model. (a) Following Blanton and Fargher (2008), we predict that external revenue has a direct, negative effect on the quality of the government bureaucracy and the provision of public goods. (b) External revenue has an indirect, negative effect on the bureaucracy. This is caused by the negative effect of external revenue on public goods, which, in turn, has an effect on the quality of the bureaucracy. (c) The quality of the bureaucracy has positive effects on social capital, especially norms of generalized reciprocity. This means that as the provision of public goods and the quality of the bureaucracy increase, norms of generalized reciprocity increase in a population, reflecting higher, more inclusive forms of social capital. This is because the effective and fair administration of government policies creates a situation in which citizens can freely associate, building norms of generalized reciprocity. (d) Finally, external revenue has a negative, indirect effect on social capital. This means that the downstream consequence of more external revenue is a decline in social capital, especially generalized reciprocity.
Figure 2b illustrates the predictions of the combined model of collective governance. (a) Holding the effect of revenue constant, social capital has a positive, direct effect on the quality of the bureaucracy. (b) Holding the effect of revenue constant, social capital has a positive, indirect effect on the provision of public goods via the effect of the quality of the bureaucracy on public goods. (c) Holding the effect of social capital on the quality of bureaucracy and public goods constant, the amount of external revenue obtained by a government has a negative effect on the quality of the bureaucracy and the provision of public goods, as well as a negative, indirect effect on the provision of public goods via the effect of the bureaucracy on public goods.
Finally, we make three predictions in an attempt to control for additional processes that may confound our ability to evaluate the predictions of the revenue and combined models of collective governance. (a) Population has a positive effect on the formation of effective bureaucracy and the provision of public goods. Previous work illustrates that population has a positive effect on measures of government effectiveness, in both modern and premodern states (Blanton & Fargher, 2008; Knack, 2002). The cause of this positive association is not clear, but it may result from the fact that large populations are more likely to contain more qualified individuals (Page, 2008). More qualified individuals in a population means that bureaucracy and elected officials are better equipped to manage complex organizations and provide goods. (b) Inequality has a negative effect on the quality of the bureaucracy. The more unequal the society in terms of access to resources, the higher the probability that some individuals are able to monopolize government to suit their narrow interests, staffing bureaucracies with cronies and “captured” administrators (Stiglitz, 2012). (c) Diversity can counteract the positive effects of generalized reciprocity on effective bureaucracy. Where in- and out-groups form, groups may associate among like individuals and may support policies beneficial to their in-group at the expense of others, decreasing how effectively bureaucracies are staffed and run, favoring in-group interests over individual talent, ability, and training (Putnam, 2007).
Data and Methods
To evaluate the revenue and the combined model of collective governance, we use data from the U.S. states. The U.S. states all have collective governments. We assume that U.S. states display less variation than a global sample of governments would; however, there is still variation. Because exclusive versus inclusive political organization falls along a continuum, there is no a priori reason that the theories discussed above should not be useful to explain variation in the governance qualities of collective states, even if, from a global perspective, the variance is clustered toward the inclusive side of the continuum. If the models of collective governance formation proposed above are useful, the models should allow us to predict variation in the effectiveness of these governments. By effectiveness, we mean the degree of professionalism in government bureaucracy and how well states provide public goods. As inclusive states lose effectiveness, political actors within should emphasize more exclusive power structures.
To estimate the provision of public goods and the performance of a state’s bureaucracy, we use grades from the Pew Charitable Trust’s Government Performance Project (GPP; 2005). The GPP rates state governments along four dimensions of governance: money, people, public infrastructure, and information systems. Here, we use the public infrastructure variable to estimate how well state governments provision public goods. The GPP uses five criteria to grade the quality of public infrastructure (GPP, 2005). The state (a) has a transparent process for assessing infrastructure needs and selecting projects, (b) has an effective process for monitoring the quality and completion of infrastructure projects, (c) maintains existing infrastructure according to engineering standards, and (d and e) has effective processes for managing infrastructure (e.g., a park service) and quality interagency cooperation to manage infrastructure. The higher the public infrastructure grade, the more effective state governments are at provisioning public goods, at least in terms of infrastructure like roads, bridges, and parks. We convert all grades into numeric values on a 12-point scale (A = 12, A– = 11, etc.).
To estimate the quality of a state government’s bureaucracy, we use the people dimension of governance graded by the GPP. The “people grade” for each state is based on five criteria (GPP, 2005): (a) strategic planning for workforce needs, (b) hiring the people necessary to complete and fulfill services, (c) retaining skillful employees, (d) training employees, and (e) managing employee performance. States with high grades hire qualified personnel, invest in training personnel, and have strategic plans to meet hiring needs. We assume that states with higher grades have more professional and better staffed government agencies, and, thus, a higher quality bureaucracy. Again, we convert the letter grades into interval values by using a 12-point scale.
To estimate a state’s dependence on external revenue, we calculated the fraction of a state’s GDP obtained from oil, gas, and coal, so-called extractive economic activities, by dividing the GDP of these industries by a state’s total GDP in 2005 (Bureau of Economic Analysis [BEA], 2005). This variable measures the fraction of a state’s economy generated by point source resources sold on a market outside of the state. To be clear, we assume that the larger this sector of the economy, the more revenue that principals in a state government obtain from corporate developers and the sale of such resources outside state boundaries. It is important to note that the mechanisms of revenue transfer here are more subtle than, for instance, a royal family simply owning a nationalized oil company. We posit that the external revenue comes in the form of campaign donations and, much more directly, through regulatory capture. Regulatory capture occurs on two fronts: (a) principals support, for example, opening public land to mining or drilling in return for a job as a lobbyist after they retire from public service and (b) principals are educated by the corporate industries that they are meant to regulate via all expense paid trips to conferences in Aspen or Jaxson Hole. This measure is not perfect, though it is a starting point (see the “Conclusion” section for more discussion).
Social capital could refer to rules and norms that favor cooperation, trust, or the structure of social networks. Here, following Putnam and colleague’s theory, we need to measure the strength of rules and norms that favor generalized reciprocity. To estimate this form of social capital, we operationalize the strength of norms of generalized reciprocity in a state using the estimated number of per capita volunteer hours. We use the strength of such norms because the ability of unrelated individuals to solve collective action problems should increase as generalized reciprocity increases in a society, widening the scale of social networks, trust, and perceptions of collective interest. Per capital volunteer hours estimates how much time individuals spend volunteering in a given state (Corporation for National & Community Service [CNCS], 2013). This is a reasonable way to infer the strength of generalized reciprocity in a state because the stronger the norm to engage in such behavior, the more individuals should invest time in prosocial behavior, like volunteering. In turn, this behavior should maintain the strength of norms of generalized reciprocity.
To estimate economic inequality, we use the U.S. Census Bureau’s Gini index from 2000 to 2005. A Gini value of zero represents perfect income equality, while a value of 1 would represent a state in which a single household received a state’s entire income. To estimate diversity, we use the percentage of 2005 U.S. Census respondents who self-identify as non-Hispanic White. States with smaller percentages of White residents have greater ethnic and racial diversity. Finally, we use U.S. Census records to estimate the size of each state’s population in 2005.
Path Models
We use path analysis to assess whether the causal structure of the revenue model or the combined model of collective governance is more consistent with the structure of the data. Path analysis is appropriate because it allows one to explore causal structure. Our goal is evaluate whether the causal structure of the revenue or combined model of collective governance better represents the structure of the data. Path analysis examines the effect of a mediator variable on relations between a predictor and response variable. Three effects are estimated: total effect, direct effect, and indirect effect. The total effect includes the direct and indirect effects of a predictor on a response variable. For example, in Figure 2a, external revenue has direct effects on public goods and the quality of the bureaucracy, and an indirect effect on the quality of the bureaucracy mediated by public goods. The indirect effect means that revenue affects public goods, which, in turn, has an effect on the quality of the bureaucracy. In this example, revenue also has a total effect on the quality of the bureaucracy, which is simply the sum of the direct and indirect effects.
We control for possible correlation between residuals and find very weak correlations—thus, our path analysis resembles a multistage regression—and we calculate bootstrapped standard errors with 1,000 repetitions for each path model. To assess the robustness of model fits, direct, indirect, and total effects to changes in model specification (i.e., changing the path structure or adding/deleting control variables), we construct 16 total path models. We run path models that replicate the causal structure illustrated by Figures 2a and 2b, plus 14 control models that evaluate all possible combinations of the predicted effects of the control variables (population, diversity, and inequality). We conduct our analysis in two steps.
First, we evaluate the fit of each path model using the chi-square, comparative fit index (CFI), root mean square error of approximation (RMSEA), standardized root mean residual (SRMR), and Akaike information criterion (AIC). Chi-square tests are sensitive to sample size and can show significant effects (indicating poor fit) with large samples; CFI, RMSEA, and SRMR are less sensitive to sample size. Model fit is considered adequate for CFIs greater than 0.90. RMSEA values less than 0.02 are considered excellent fits, less than 0.05 good, and less than 0.08 mediocre fits (MacCallum, Browne, & Sugawara, 1996). SRMR values less than 0.08 are considered good fits (Hu & Bentler, 1999). AIC is a measure of fit and complexity that allows us to compare different models; the lower the value, the better the model balances fit and complexity. No one measure is adequate to assess a path model’s fit (Barrett, 2007). Thus, we observe all of these fit measures for the path models illustrated in Figures 2a and 2b, plus the control models. By comparing the fits of the revenue models and the combined models of governance, we can identify which causal structure is better specified for the data set. The model(s) with the best fit measures better represent the structure in the data. We infer that the models with the best fit measures are a better specification of causal structure, though this could be data set specific and requires future research that replicates our analysis across multiple data sets at different scales.
Second, we report standardized coefficients to compare the relative effect size and the consistency of the each variable’s direction of effect on our response variables. We focus in particular on the consistency of effect size and the direction of a variable’s effect across the eight path models constructed to assess each causal model of collective governance (16 total models). Our analysis concentrates on the consistency of a variable’s effect size and direction to adding and deleting control variables. More consistency means that we can have more confidence that the effect size and direction of effect represent true structure in the data rather than an artifact of any particular path model that we choose to construct (Baggio, Rollins, Perez, & Janssen, 2015; Freeman et al., 2016). We consider a p value of <.1 as sufficient evidence to reject the null hypothesis that a predictor’s coefficient is zero. We use p < .1 because of our sample size and the desire to better balance Type I and Type II errors. The risk of Type II error increases with smaller sample sizes.
Results
In sum, our analysis reveals three main results. First, in this data set, the combined model of collective governance fits the data better than the revenue model. Second, external revenue and social capital both have significant effects on the provision of public goods by governments. And, third, the data indicate that the quality of a state’s bureaucracy mediates the effect of external revenue on the provision of public goods rather than vice versa.
Model Fits
Table 1 compares the fit statistics of the revenue model and associated control models with the combined model of governance and associated control models. This table illustrates that the combined model fit the data better than the revenue model. All of the fit statistics are better for the combined model; however, three in particular are important to note. The combined model of governance has a CFI greater than 0.90 and a SRMR less than 0.08, which are both rules of thumb for identifying a model with an adequate fit. The revenue model, as well as the seven control models, does not meet any known rules of thumb for identifying an adequate model specification for the data set. Furthermore, every control model associated with the combined model of governance has a lower AIC than the revenue model and associated control models. Finally, both sets of control models indicate that adding our control variables (population, Gini, and percent of White residents) decreases the fit of our path models. One potential reason for this pattern is that we have not well specified the effects of the control variables.
A Summary of Model Fit Statistics.

Note. CFI = comparative fit index; RMSEA = root mean square error of approximation; SRMR = standardized root mean residual; AIC = Akaike information criterion.
Path Coefficients
Figure 3 illustrates the standardized coefficients and the robustness of the sign of each coefficient associated with the variables in the revenue and combined models of governance (see the appendix for complete tables). Consistent with the revenue model, Figure 3a illustrates that governance has a robust positive effect on social capital, public goods has a robust positive effect on the quality of the bureaucracy, and external revenue has a robust positive effect on public goods. However, the effect of external revenue on the quality of the bureaucracy is almost zero and, in 6/8 models, the effect is positive rather than negative. This result is inconsistent with the prediction of the revenue model that external revenue has a negative, direct effect on the quality of the bureaucracy.

Path results: (a) “revenue model” and (b) “combined model.”
In addition to the direct effects displayed in Figure 3a, in the revenue model external revenue has a standardized, indirect effect on social capital of –0.008 (p = .87), virtually zero. The weakness of this indirect effect is consistent across all of the control models, and in two control models the effect is weakly positive. External revenue also has a very weak standardized, indirect effect (–0.07, p = .17) and total effect (–0.1, p = .51) on the quality of the bureaucracy. These weak effects are consistent across all of the control models.
Consistent with the prediction of the combined model of governance, Figure 3b illustrates that social capital has a positive and robust effect on the quality of the bureaucracy of a state government. In turn, the quality of the bureaucracy has a positive and robust effect on how well states provide public goods. Similarly, external revenue consistently has a negative effect on the quality of the bureaucracy and the provision of public goods. Although the direct effects of external revenue are not significant (see the appendix), the signs are consistent with the theory that external revenue weakens the quality of the bureaucracy and the provision of public goods, and the effect sizes of these direct effects are consistent across all control models.
Finally, the standardized, indirect effect of external revenue on the provision of public goods in the combined model is very weak and consistently negative (–0.062; p = .299). The standardized total effect of external revenue on the provision of public goods, however, is robust, negative, and significant (–0.272; p = .03). This is consistent with the prediction of the combined model of governance that external revenue provides incentives for government officials to underinvest in public goods. Finally, the indirect effect of social capital on the provision of public goods is positive, robust to adding and deleting control variables, and significant (0.105; p = .06). The effect size of greater than 0.1 is also consistent across control models. This result is consistent with the combined model of collective governance, which posits that social capital has a positive effect on the quality of the bureaucracy, which, in turn, enhances the provision of public goods. In short, in this data set, social capital and external revenue both have effects on the effectiveness of collective governments.
Implications for Variation in Political Complexity
So far, we have evaluated the fits of the revenue and combined social capital and revenue models of collective government. The main difference between these models is the causal structure. In the revenue model, the revenue source of government officials determines whether individual officials invest in the provision of public goods. This, in turn, has effects on the professionalism of the bureaucracy. In turn, inclusive versus extractive policies implemented by government officials (and bureaucrats) determines the level of social capital typical of a population (Figure 2a). Conversely, in the combined model, social capital has a causal effect on the ability of populations to solve collective action problems and form collective governments. In this model, revenue source determines how much officials invest in forming a professional bureaucracy that serves the needs of tax payers by providing public goods, rather than one staffed by cronies (Figure 2b). Our results, above, indicate that the combined model of collective governance fits the data on U.S. state governments better than the revenue model alone (Table 1). Furthermore, our measures of social capital and external revenue have significant effects on investments in public goods (Figure 3). The positive effect of social capital and the negative total effect of external revenue indicates that these socioeconomic variables create differing incentives for individual officials and commoners to solve collective action problems in ways that serve the broader interests of society.
In this section, we outline the implications of our results for explaining variation in political complexity. Political complexity is variation in the number and function of social-political units (Feinman, 2012). These units may vary vertically in a hierarchy of decision-making units or horizontally as a population is divided into subunits that are difficult to rank vis-à-vis each other (Blanton et al., 1993; Feinman, 2012). Given that our sample is the U.S. states, here we are interested in explaining variation in horizontal political complexity. In particular, assuming that as a population increases in size, horizontal political complexity increases simply to accommodate more people, we aim to evaluate the moderating effects of external revenue and social capital on the number of government units in each state.
Like the pure revenue model, the combined model of governance proposes that as governments depend more on external revenue they become more extractive and invest less in the provision of public goods, and our results are consistent with this proposition (Figure 3b). A prediction that follows from this dynamic is that as governments depend more on external revenue, they become less complex in terms of the number of administrative units and government officials (Blanton & Fargher, 2008). This is because government officials who obtain more revenue from external sources should invest less in administrative capacity to monitor the public, beyond security reasons, and invest less in the provision of public goods. Conversely, where governments depend on taxing a large population for revenue, governments must (a) quantify the population and the amount of taxes owed and (b) provide public goods to maintain the incentive for individuals to pay taxes. Both of these tasks require bureaucrats and administrative organizations dedicated to the tasks (North et al., 2009).
Feinman (2011) extends this line of argument by combining the effects of population and extractive versus collective governments on political complexity. He argues that as population increases, the number of administrative units in a government must also increase to manage larger populations (Carballo et al., 2014; Ember, 1963; Johnson, 1983). However, in addition to population, because revenue source explains why some governments are more exclusive and others are more collective, revenue source should moderate the relationship between political complexity and population size (Feinman, 2011, Figure 9). Specifically, as population size increases, initially, populations with governments funded by external revenue should be more complex than populations with governments funded by internal revenue. This is because more extractive polities need to invest more at small population sizes to monitor commoners and hold a polity together. If population increases, however, governments that obtain their revenue from external resources only need to keep pace with population growth by growing security services and patronage networks. In contrast, if population increases among governments funded by internal revenue, political complexity should increase much faster than among populations with governments funded by external resources. This is because as population grows, officials in collective governments funded by internal revenue need to invest more in the provision of public goods and open access to these goods up to as many people as possible so that they will pay their taxes, in addition to monitoring and collecting taxes.
The combined model of collective governance also suggests that social capital moderates the population–complexity relationship. Holding all else equal, social capital should have a positive moderating effect on the population–political complexity relationship. This moderating effect should be the opposite of the moderating effect of external revenue. Holding population constant at a small size, populations with higher levels of social capital will be less politically complex than societies with lower levels of social capital. This is a simple matter of efficiency. Higher social capital means more efficient administrative units and the need for fewer administrative units per unit of population to provision goods and services.
However, if population increases among groups with high social capital, the effectiveness of the bureaucracy and the provision of public goods should provide an incentive for individuals, both elites and commoners, to invest in more administrative units. That is, government performs well, so populations are willing to create more governmental units to solve the problems associated with increases in population. Government officials have an incentive to do this because it illustrates that they are working to help keep the social and economic relationships in society functioning. At some threshold, as population increases, populations with higher social capital should become more complex than populations with lower levels of social capital. Again, although populations with lower levels of social capital are more complex at lower levels of population, the inefficiency of the government should mean that as population increases, commoners and elites alike, will not want to invest in more government that does little beyond exist.
In sum, we know from previous research that increases in population have a positive effect on political complexity (Ember, 1963; Feinman, 2011), but much more than population size matters (Blanton & Fargher, 2008; Blanton et al., 1996; Carballo et al., 2014; Feinman, 2011). The variables that determine how effectively societies integrate, or act collectively, should moderate the population–complexity relationship (Blanton et al., 1996; Feinman, 2011, 2012). The negative effect of revenue on the performance of collective governments suggests that the source of a government’s revenue moderates the effect of population on political complexity, leading to more complexity per unit of population increase among governments more dependent on internal revenue than governments dependent on external revenue (Carballo et al., 2014; Feinman, 2011). Similarly, higher levels of social capital should lead to larger increases in political complexity per unit of population increase than lower levels of social capital.
These predictions are straightforward to evaluate, in a preliminary way, with data from the 50 U.S. states. A regression model with interaction terms captures the predictions:

where
To evaluate Equation 1, we log transform the number of government units in each state (Pc), population size (N), and the proportion of GDP from export driven sources (Re). We make these transformations to meet the assumption that the variables are normally distributed inherent to the ordinary least squares (OLS) method of regression. Next, we converted the variables into z scores. This is a common procedure when using OLS to evaluate interaction effects (e.g., population multiplied by revenue or social capital). This is done to avoid excessive variance inflation, which biases coefficients and leads to a greater risk of Type I Error with regard to the coefficients in an OLS model. To assess the effects of the interaction terms, we use effect plots. Effect plots allow us to observe the effect of population on political complexity holding revenue and social capital equal. This is important because interaction effects can be nonlinear and such processes are not apparent by just observing the summary coefficient associated with an interaction parameter (Fox & Hong, 2009). We use a p value of <.1 as sufficient evidence that a regression coefficient is different from zero. Again, given that our sample size is limited, this value better balances the risk of Type II error against the risk of Type I error than the equally arbitrary α = .05.
Table 2 illustrates the coefficients, standard errors, t-values, and p values associated with each explanatory variable outlined in Equation 1. As expected, population has a positive effect on political complexity. More importantly, population interacted with external revenue and population interacted with social capital both have significant effects at p < .1.
Regression Coefficients, Standard Errors, and p Values.
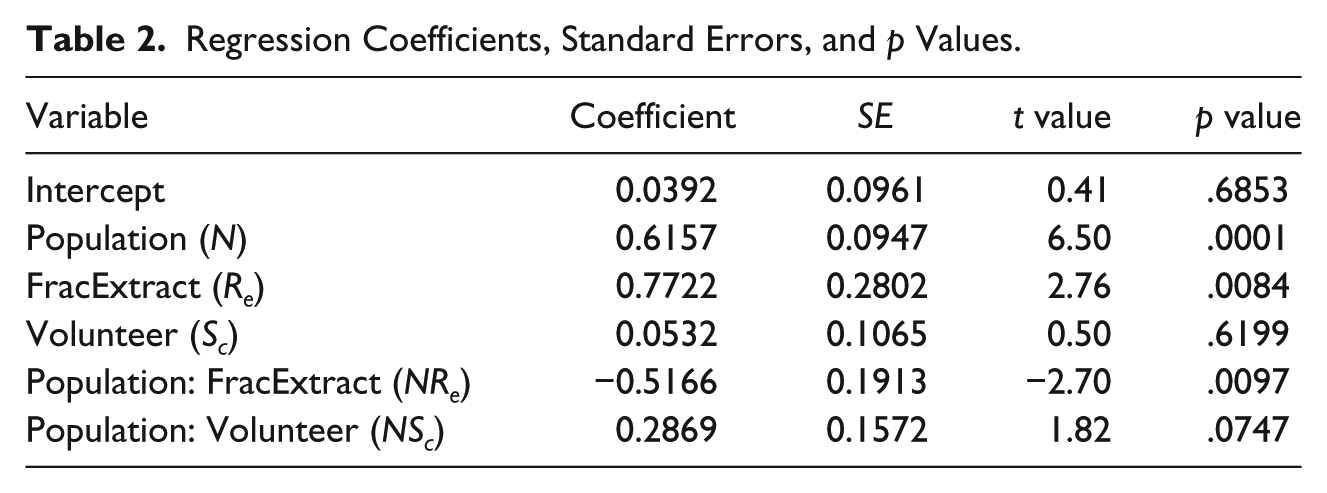
The patterns in Figure 4a are consistent with the predicted effect of social capital on the population–complexity relationship. Figure 4 is an effect plot that illustrates how social capital and external revenue moderate the population–political complexity relationship. In Figure 4a, the short-dashed red line illustrates the relationship between population and political complexity holding social capital equal at 1.5 standard deviations below the mean level of social capital in this data set. The green-dashed line illustrates the same relationship holding social capital equal at the mean, and the solid blue line illustrates the population–political complexity relationship holding social capital equal at 1 standard deviation above the mean. At low population sizes, states with high social capital are less politically complex than states with lower social capital (the y-intercept of the solid blue line is less than the intercept of the dashed lines). However, as population increases, states with higher social capital increase in political complexity much faster than states with lower social capital (the slope of the blue line is steeper than the dashed lines).

(a) The effect of population on political complexity (number of administrative units), holding social capital (volunteer hours) constant and (b) the effect of population on political complexity, holding the fraction of revenue from extractive, external resources constant.
The patterns in Figure 4b are also consistent with the predicted effect of external revenue on the population–political complexity relationship. Again, in Figure 4b, the short-dashed red line illustrates the relationship between population and political complexity holding external revenue equal at 1.5 standard deviations below the mean level of external revenue in this data set. The green-dashed line illustrates the same relationship holding external revenue equal at the mean, and the solid blue line illustrates the population–political complexity relationship holding external revenue equal at 1 standard deviation above the mean. At low population sizes, states with low external revenue are less politically complex than states with high external revenue (the y-intercept of the short-dashed red line is less than the intercept of the long-dashed green and solid blue lines). However, as population increases, states with low levels of external revenue increase in political complexity much faster than states more reliant on external revenue. In fact, holding all else equal, states with very high levels of external revenue, in this data set, actually decrease in political complexity as population size goes up (the solid blue line in Figure 4b).
Conclusion
The formation of collective governments is an important research problem in anthropology and social science in general. A growing body of research indicates that variation in the complexity of political systems results, in part, from the various ways that populations integrate to solve collective action problems (Blanton & Fargher, 2008; Blanton et al., 1996; Blanton et al., 1993; Carballo, 2012; Carballo et al., 2014; Feinman, 2011). The goal of this article has been to contribute to understanding the factors that explain the formation of collective governments and the consequences for understanding variation in political complexity. We have used data from the U.S. states to evaluate a revenue model of collective governance and a combined social capital and revenue model of collective governance. Our analysis indicates that the combined model is a better representation of data from U.S. states than the revenue model alone. We argue that revenue and generalized reciprocity both have effects on the formation of collective governments and both factors interact with population size to moderate the population–political complexity relationship.
For clarity, we offer the following final points:
Our study does not falsify the revenue model proposed by Blanton and Fargher (2008). Indeed, while the combined model of governance is a better fit for the data than the pure revenue model, revenue source is a critical variable. The fraction of GDP from point source resources has a significant total effect on the provision of public goods by U.S. states. This is consistent with the underlying logic of the revenue model.
Our study clarifies the causal relationship between a professional bureaucracy and the provision of public goods. The pure revenue model suggests that a population’s main revenue source effects how much individuals, both commoner and elite, value and contribute to the provision of public goods. In turn, either the effective or ineffective provision of public goods has an indirect effect on the quality of a government bureaucracy (Figure 2a). The combined model of governance flips this logic around. Declines in the quality of a bureaucracy, caused by either increasing use of external revenue, which motivates elites to use bureaucratic jobs to create patronage networks, or declines in social capital, which favors more self-interested behaviors on the part of government bureaucrats, decrease how effectively public goods are provisioned (Figure 2b). Our results are more consistent with the combined model and, thus, the primacy of creating a professional bureaucracy to more effectively provision public goods (Fukuyama, 2011).
Like all studies that rely on data culled from macro-social and economic data sets, a weakness of our study is an inability to observe individuals and the decision-making process. We can only assume that the broadscale patterns observed in our study are the outcomes of many decision makers making similar decisions. All large statistical comparisons are subject to the possibility that the relationships observed are the result of some as yet unaccounted for variables. Similarly, our study is synchronic and, like all synchronic studies, has difficulty studying feedback processes. While these are limitations, we would also note that these are true of all comparative, synchronic studies and, thus, the reason we need multiple, repeated studies with different data sets across disciplines and at multiple scales of analysis guided by the same causal models.
How we measure external revenue in democratic, capitalist economies needs more development. Here, we have used GDP from extractive resources. This required us to assume that in more extractive economies, there is a closer relationship between special interests, which profit from maximizing extraction and principals than in states with less extractive economies. We assume that closer relationships between extractive developers and principals result in more campaign donations and the pernicious process of regulatory capture. A potential weakness of this approach is that it does not capture all extractive special interests that may profit by funneling revenue to principals, often via legal means, but means that influence government policy and structure toward narrow special interests nonetheless. More work is needed on how to measure the capture of revenue by public officials in more inclusive political economies. A couple of possibilities are to rate all industries in their profit making from export, extraction, and dependence on government policy and regulation. The more money that comes from more highly rated industries to principals could be useful. Another possibility is that while U.S. states are semiautonomous political units, revenue transfers do occur via the federal government between states. The extent that a state’s budget is derived from such revenue transfers might be legitimately considered another source of external revenue. Measuring this source of revenue may be useful for follow-up studies.
Finally, so many models developed by social scientists wall off the present from the past, yet our work illustrates that the causal dynamics proposed by archaeologists, from their knowledge of archaeological cases and ethnographic, premodern states, are relevant to explaining variation in the governance of U.S. states. Explaining political development is a hard problem, and better integration across the social sciences, we argue, is key to achieving this goal. Part of this effort means evaluating causal theories in contexts not necessarily anticipated by their original authors.
In this article, we have argued that generalized reciprocity (social capital) and the revenue source that elites can access are semi-independent causal forces that determine the development and maintenance of collective governments. In turn, revenue source and norms of generalized reciprocity, as expected, moderate the population size–political complexity relationship. How governments integrate, at least among U.S. states, indeed partly determines political complexity.
Footnotes
Appendix
Acknowledgements
We would like to thank three anonymous reviewers for their thoughtful and helpful comments on an earlier draft of this article, as well as the USU 2016 GIS seminar in archaeology and sociology where this paper originated.
Authors’ Note
All mistakes are, of course, our own.
Declaration of Conflicting Interests
The author(s) declared no potential conflicts of interest with respect to the research, authorship, and/or publication of this article.
Funding
The author(s) received no financial support for the research, authorship, and/or publication of this article.