
Abstract
Studies of happiness or subjective well-being (SWB) employ a variety of conceptualizations and item formats. Some authorities prefer to focus on the cognitive or evaluative component of SWB in studies of national happiness, and consider the affective component a lesser priority. However, we show that the latter component has unique and important predictive properties. We measured the stable element of the affective component (being “usually happy and in a good mood”) in 44,096 respondents recruited probabilistically from 56 societies (nations and some ethnic groups), from all inhabited continents. Consistent with previous studies, we obtained the highest positive affect scores in the nations of northern Latin America and Africa, whereas the highest percentages of respondents “rarely in a good mood” were recorded in East Asia, Russia, Italy, and the Arab world. Our happiness measure is a significant negative predictor of national suicide rates and cigarette consumption, after controlling for other plausible predictors, including other SWB measures from the World Values Survey, Veenhoven’s World Database of Happiness, and climate and socioeconomic variables.
Introduction
Happiness, or subjective well-being (SWB), has a cognitive or evaluative component (evaluation of the quality of one’s life, also known as life satisfaction or contentment) and an affective or hedonic component (one’s emotional balance or hedonic level of affect). The latter can be further decomposed into positive affect and negative affect (Helliwell, Huang, & Wang, 2015; Suh & Oishi, 2002).
The cognitive-evaluative and the affective component of SWB are related (Veenhoven, 2015). Yet, they have been studied separately in single-country studies and in large multi-country cross-cultural studies. In the World Happiness Report 2015, Helliwell et al. (2015) cite the Organisation for Economic Co-Operation and Development’s (OECD) Guidelines for the Measurement of Subjective Well-Being, which state explicitly that the different components of SWB should be studied separately and that the evaluative component should be the primary measure, whereas the affective component should be considered a lower priority. Helliwell et al. (2015) agree with this view. They indicate that they make primary use of life evaluation measures in their comparisons of national SWB because those measures “are more international in their variation and are more readily explained by life circumstances” (p. 15).
The view that either of the two main components of SWB should be given priority in studies of national SWB, whereas the other one should be considered of lower importance, is debatable. The merits of a particular national indicator should not be estimated solely or primarily on the basis of what explains it but also on the basis of what that measure explains. If an aggregate measure of the affective component of SWB has convincing predictive properties with respect to important national differences over and above the properties of other predictors, including the evaluative component of SWB, that would be a strong argument against the view that the affective component deserves less attention than the evaluative component.
Concept and Structure of the Present Study
This study starts with a brief literature review explaining why SWB can be hypothesized to predict national suicide rates and national cigarette consumption. Of note, many studies report associations between “happiness” and national indicators without attempting to disentangle the predictive properties of the SWB components. Yet, our study will attempt to do that. We will also discuss other plausible predictors of national differences in suicide rates and cigarette consumption, such as economic variables, culture and personality traits, and climatic measures.
Then, this study introduces a new measure of national happiness (affective component), relying on large, probabilistically recruited samples from 56 societies in 52 nations. The new element of the measure is its format, avoiding the use of a Likert-type scale. The latter is known to cause serious comparability problems in cross-cultural studies (Heine, Lehman, Peng, & Greenholtz, 2002), one of which is uniform culturally determined responding patterns regardless of item content (e.g., Harzing, 2006; He, Bartram, Inceoglu, & van de Vijver, 2014; Kemmelmeier, 2016; Meisenberg, 2008; Smith, 2004, 2011; Smith et al., 2016). Instead of using a Likert-type scale, the new measure asks the respondents to choose from two opposites or a neutral option. Details are provided in the “Method” section. The new measure of national happiness is validated through correlations with similar measures in other large-scale studies, some of which are nationally representative. Finally, our new happiness measure is tested as a predictor of national suicide rates and cigarette consumption by means of regression analyses with other plausible predictors, including other SWB measures.
Happiness as a Predictor of Suicide and Tobacco Consumption
Measures of happiness, and measures of personality traits related to happiness, have been associated with suicide and tobacco consumption across individuals, or countries, or both.
Koivumaa-Honkanen, Honkanen, Koskenvuo, and Kaprio (2003) found that the risk of suicide increased with decreased happiness. Hirsch, Duberstein, and Unutzer (2009) concluded that positive emotions decrease the risk of suicidal thoughts in the context of medical illness and that treatment designed to identify sources of joy and enhance happiness might decrease suicide risk. Using data from the nationally representative European Values Survey and the World Health Organization, Bray and Gunnell (2006) reported a negative association between national suicide rates and happiness across 32 European countries. 1 Suicide is commonly associated with mood disorders (Oquendo et al., 2001). Therefore, measures of the affective component of happiness seem more promising as predictors of suicide rates than measures of life satisfaction. We expect to find a negative association between national suicide rates and our national measure of the affective component of happiness.
Based on a large nationally representative study of 6,923 respondents in the United Kingdom, Shahab and West (2012) reported a negative association between smoking and happiness, such that ex-smokers and people who had never smoked were happier than current smokers. The same association was reported in a nine-nation study of 18,000 individuals (Stickley et al., 2015). We believe that a partial explanation for this phenomenon is provided by Munafo, Zetteler, and Clark (2007). Their meta-analysis confirms previous reports of a positive relationship between Big-Five neuroticism and smoking. In other words, neurotic individuals, who in principle tend to be less happy than those scoring low on neuroticism (Cheng & Furnham, 2003; Gutierrez, Jimenez, Hernandez, & Puente, 2005; Hayes & Joseph, 2003; Soto, 2015), also tend to smoke more. We expect to find a negative relationship between happiness and cigarette consumption also across nations.
Other Potential Predictors of National Suicide Rates and Cigarette Consumption
National suicide rates and cigarette consumption are likely related not only to happiness but to a variety of other factors as well.
Suicide rates may be related to unemployment rates. This association has been found across countries (Prichard, 1990) and within countries (Blakely, Collings, & Atkinson, 2003; Kposowa, 2001; Medianos, Alexiou, Patelakis, & Economou, 2014), although other studies (Andres, 2005) have failed to replicate it. Another economic factor related to national suicide rates may be socioeconomic disadvantage (Cairns, Grahams, & Bambra, 2017).
Suicide rates may also be affected by alcohol consumption rates (Andres, 2005; Sher, 2006). Climatic factors have also been linked to suicide (Ruuhela, Hiltunen, Venalainen, Pirinen, & Partonen, 2009). Turnover of serotonin is lowest in the winter and is directly related to the duration of bright sunlight, which provides an explanation for seasonal affective disorders (Lambert, Reid, Kaye, Jennings, & Esler, 2002). Because of its effect on serotonin levels, sunlight, or the lack of it, may have an effect on suicide ideation (Azmilia, 2010). As Islam and Christianity forbid suicide, cultural factors, such as level of religiousness and conservatism, may also play a role. It is also worth considering Schwartz’s (2011) view that cultural values may have a direct influence on well-being; hence, values may be related to suicide rates. Voracek (2004, 2006) claimed a positive relationship between national IQ and suicide rates. All these explanations of differences in national suicide rates can be tested across a fairly large sample of countries, representing all continents.
Some other explanations cannot be tested convincingly as sufficient worldwide data are not available. For example, Schomerus, Evans-Lacko, Rusch, and Mojtabai (2015) found a negative association between suicide rates and social acceptance of mental illness but their sample consisted of only 25 European countries studied by the Eurobarometer.
Large cross-national studies analyzing the predictors of national differences in cigarette consumption across many countries from all continents do not seem to exist. Some hypotheses about potential predictors of national differences in cigarette consumption can be formulated on the basis of sociological studies at the individual level of analysis. According to the Tobacco Atlas (2016b), across the globe, smoking is prevalent in the poorest segments of the populations of most countries. This suggests that a similar relationship may be found at the national level: national differences in wealth may account for some of the national variance in cigarette consumption. In a study across nine European countries, Giskes et al. (2005) found that individuals with tertiary education were less likely to smoke. Thus, a similar relationship may exist at the national level: countries with a higher mean number of years spent in education may have a lower cigarette consumption rate. Another potential predictor is van de Vliert’s (2009) harshness-of-summers-and-winters index as extreme weather may contribute to the amount of negative affect in a society and hence increase cigarette consumption. Van de Vliert (2009) is well known for his view that national climatic differences correlate with national SWB differences.
Method
Background of the Current Study
This study is part of a larger study of personality and culture carried out in 2015-2016.
Samples
Data for this study are available from 44,096 respondents from 56 societies in 53 countries, adequately representing all continents and nearly all main cultural regions of the world on the Inglehart–Welzel cultural map of the world (www.worldvaluessurvey.org) and in Ronen and Shenkar’s (2012) tree of cultural clusters. An exception is the Arab world, represented only by Egypt, and Oceania, which is not at all represented in our study beyond Australia and New Zealand.
The samples were chosen probabilistically so that they reflect the national census as closely as possible. This target was achieved in most economically developed countries, where the samples represent each nation more or less adequately in terms of gender balance, age distribution, education, occupation, ethnic or racial group, native language, and regional origin. The samples from the developing countries also represent the national census relatively well except that they consist mostly of respondents with higher education as less educated ones were hard to reach. Nevertheless, in nearly all developing countries, we have at least 100 randomly selected respondents with no more than a high-school degree. Differences between respondents with higher education and those without higher education are relatively small on most items across the whole questionnaire, and have a minimal effect on country-level patterns. Yet, for the sake of precision, we report national happiness scores for each of the two types of respondents separately. Detailed sample characteristics will be provided upon request by the corresponding author as well as by Hofstede Insights, the consulting company that keeps the data (https://www.hofstede-insights.com/).
The sample composition in South Africa is an exception. It does not reflect the actual racial and ethnic composition of the population of that country. Because of the enormous differences between the responses of Black and White South Africans on many items, including the happiness item, we report separate scores for Blacks, as well as for Afrikaners and Whites of English origin. The Malaysian sample is the other exception in our database. As it does not reflect Malaysia’s proportions of Malays, Chinese, and Indians, we split it into Malays and ethnic Chinese, leaving out the very small number of ethnic Indians that answered the questionnaire.
Questionnaire
The original questionnaire was written in English, subsequently translated into native local languages and back-translated into English. An exception was made for countries where English is not necessarily a predominant native language but is an official language of instruction at school and is sufficiently well-spoken by educated citizens: India, Kenya, Nigeria, Singapore, and South Africa.
As previously explained, Likert-type scales were not used to avoid culturally induced response bias. All items ask the respondents to choose between two opposites, such as “usually shy” or “usually bold,” with a third option: “I am somewhere here, in between these two.”
Our goal was to measure the stable affective component of happiness: the degree to which people are usually in a good mood. The item that measures happiness explicitly associates happiness with good mood. This is consistent with lay concepts of happiness encountered in various parts of Africa, especially Nigeria. Some of the authors of this study regularly interview Nigerian students and other Africans about an apparent paradox in the World Values Survey: Nigeria, Ghana, and Tanzania tend to score very high on the happiness item but low on the life satisfaction item. The typical African explanation is that happiness is in fact joyfulness and good mood, probably an innate trait, whereas life satisfaction comes from achievement. We did not have the necessary resources to conduct a worldwide test of this African concept. Yet, we find that it is surprisingly close to the conclusions of neurological studies of happiness, reported by Davidson and Schuyler (2015): “Sustained activation across time in response to positive incentives in the ventral striatum and dorsolateral prefrontal cortex predicts psychological well-being, a form of sustained happiness that may not depend directly upon external circumstances” (p. 92). We constructed a happiness item based on this concept, and tested it along with other questionnaire items, in pilot studies. The happiness item is provided below: Please describe yourself in terms of the personal characteristics below. Each question consists of two opposites. Please choose the one that describes you more accurately. If you think that you are somewhere in between these two opposites, please choose the option in the middle. 1. I am usually happy and in a good mood. 2. I am somewhere here, in between these two. 3. I am rarely in a very good mood.
This item format clearly asks the respondents to think of their happiness in terms of prevalent mood, not satisfaction with life. Pilot studies suggested that an earlier version of the third response option, “I am usually unhappy and in a bad mood,” is unrealistic because hardly anybody chooses it, not even in Eastern Europe, a region known for its low happiness. 2
Although this response format does not allow a very nuanced measurement of intensity at the individual level, it is appropriate for societal comparisons as intensity at that level can be measured through percentages of respondents who have chosen a particular option.
A pilot study in the United States and Singapore generated objections of various kinds to various items in the questionnaire. A number of objections clearly suggested that some conceptualizations clashed with those of the respondents and had produced incoherent items from their viewpoint. For instance, we were told that the original item that asked the respondents if they like to compete and show that they are better than other people is incoherent because it incorporates two unrelated concepts. The happiness item, however, did not generate any criticisms, either in the United States or in Singapore.
Next, the questionnaire was translated into Spanish, Russian, and Kazakh, and discussed with local social scientists: Puerto Rican and Peruvian for Spanish, and Kazakh native speakers of Russian for Russian. The Spanish version was tested in telephone interviews with 100 randomly selected Puerto Ricans in Puerto Rico and 100 Dominicans in the Dominican Republic. The Russian and Kazakh versions were tested in face-to-face interviews across all regions of Kazakhstan. The happiness item did not generate any objections anywhere, suggesting that the African concept of equating happiness with good mood is not alien to U.S. Americans, Latin Americans, and Asians (Singapore Chinese). This does not mean that other conceptualizations of happiness would not be considered acceptable, too. It simply suggested to us that our happiness item seemed appropriate for fielding across the world. As stated earlier, the utility of fielding such an item was to be determined empirically, based on the item’s predictive properties.
For our analysis, our happiness measure was percentages of respondents without higher education who have chosen the first response option: “I am usually happy and in a good mood.” We note that national percentages of happy respondents without higher education and those with higher education are correlated so strongly that it practically does not matter which measure we choose. Still, we preferred respondents without higher education as they are a strong majority in any nation, including rich ones, such as the United States. According to the U.S. Census Bureau, only one third of U.S. adults have a college degree or higher education (Ryan & Bauman, 2016).
To compare the predictive properties of our happiness measure, we used alternative measures of SWB from Veenhoven’s (2016) collection of national SWB indicators, including life satisfaction measures. We also used national percentages of World Values Survey respondents who reported that they were “very happy” in the latest wave (2010-2014). Those data are from the association’s official website (www.worldvaluessurvey.org). We also used a combined measure, averaging the World Values Survey percentages “very happy” across the three latest waves, from 2000 to 2014. This average measure is from Minkov and Bond (2017). Percentages “very happy” in the World Values Survey may provide a viable alternative to the mean scores in Veenhoven’s database and may be closer to our happiness measure. Percentage “very happy” seems to be a categorical measure, excluding potentially ambiguous answers, such as “rather happy” or “quite happy,” which in some cultures and languages, such as the native language of the corresponding author, could mean “somewhat happy but not exactly.” A person who provides this self-presentation would not be perceived as happy.
As many of the SWB measures in Veenhoven (2016) provide data for only a small number of countries or only European countries, we used only those measures that adequately cover all continents. We always used the average scores, across all years for which data are available, as provided by Veenhoven (2016). 3 Using these average scores is justified by the fact that, despite the fluctuations, it is very clear that all measures collected by Veenhoven converge to a very stable baseline.
We included also two other lines of research so as to compare the predictive properties of our happiness data and validate their reliability. First, we used a national happiness measure (“Component 1”) from Kuppens, Ceulemans, Timmerman, Diener, and Kim-Prieto (2006), which is clearly a measure of the affective component of SWB rather than life satisfaction. We also used SWB data from two worldwide nationally representative studies by the Pew Research Center in 2014 and 2017 (Johnson, 2018; Pew Research Center, 2014). In these studies, the respondents were asked “How would you describe your day today—has it been a typical day, a particularly good day, or a particularly bad day?” One might suspect that answers to this question might be volatile. Yet they are remarkably stable at the national level. The national percentages of respondents who chose “a particularly good day” in 2014 correlate with those in 2017 at .89 (p < .0001, n = 33 nations). We find the Pew Research Center’s method of measuring SWB interesting because the response format closely resembles ours even though the item content is very different.
We also used all available national indices of the Big-Five personality traits (Gebauer et al., 2015; McCrae, 2002; McCrae & Terracciano, 2005; Schmitt, Allik, McCrae, & Benet-Martinez, 2007) as potential alternative predictors of national suicide rates and cigarette consumption. As neuroticism and extraversion are related to SWB, national Big-Five aggregates may predict either of our dependent variables or both.
The average national suicide rates for men and women that we used are the latest available, for 2015, from the World Health Organization (2017). We must note that the same source provides data also for previous years. They clearly show that, despite some fluctuations in some countries, suicide rate differences across the world are very stable. Cigarette consumption per person data are also the latest available, from 2014, from the Tobacco Atlas (2016a). Again, despite the fall in cigarette consumption across most of the world, differences across countries have remained fairly stable.
As a measure of national socioeconomic advantage or disadvantage, we used gross domestic product (GDP) per person data from the UN Statistics Division (2009), whose data are actually from the World Bank. The GDP-per-person data are for 2007, approximately the median year for many of Veenhoven’s (2016) measures. As GDP-per-person data from different years are correlated extremely strongly, later or earlier national wealth measures would yield the same results.
National unemployment rates (data for 2014, the only recent data available) were obtained from the World Bank (2017). Total national recorded and unrecorded annual consumption of pure alcohol per person (data from 2008 to 2010, the latest available) are provided by the World Health Organization (2017). Our climatic data are van de Vliert’s (2009) harshness-of-summers-and-winters index. Latest, still unpublished, national cultural value scores for “embeddedness” (cultural conservatism), as well as scores on other value-based dimensions of culture, were personally provided by Shalom Schwartz in 2016. We also tested the predictive properties of Minkov, Blagoev, and Hofstede’s (2013) “personal-sexual” dimension of national culture. This is a nation-level measure of the degree to which various morally debatable behaviors, including suicide, are justifiable in the minds of the World Values Survey respondents.
National IQs are provided by Lynn and Vanhanen (2012). Average national years of schooling in 2015 were obtained from the United Nations Development Program (2017).
Results
Happiness measures are provided in Table 1 which shows the percentages of respondents in each nation who have selected each of the two categorical response options.
National Happiness Ranking and Scores.
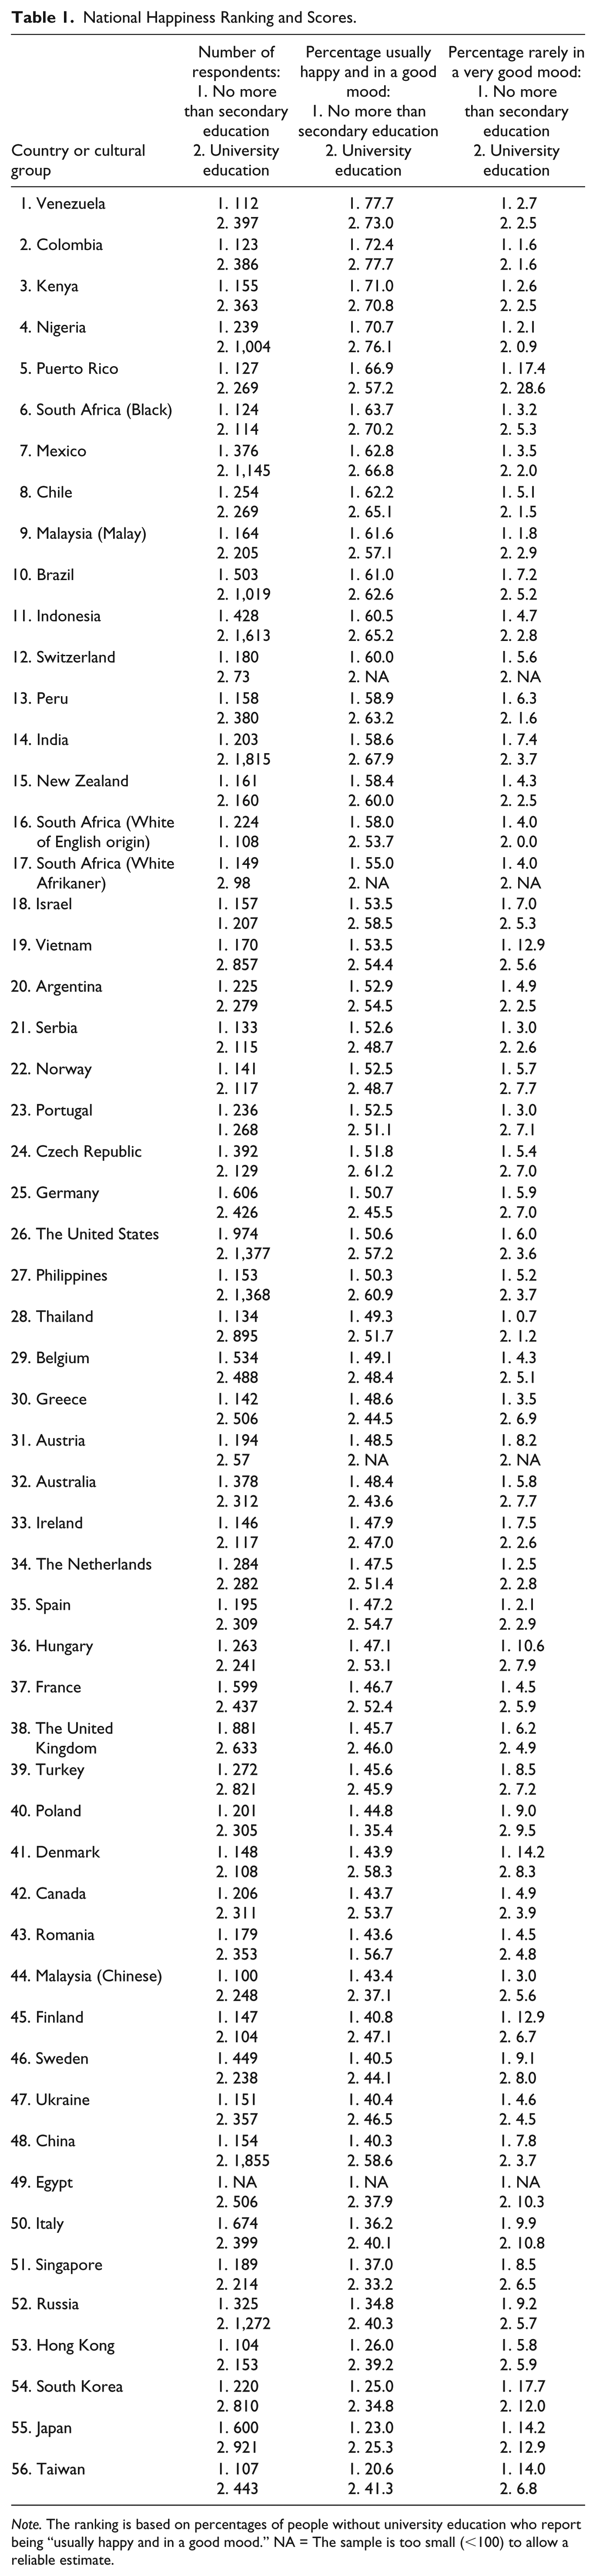
Note. The ranking is based on percentages of people without university education who report being “usually happy and in a good mood.” NA = The sample is too small (<100) to allow a reliable estimate.
In Table 2, we provide correlations between our happiness measure and other measures of national SWB.
Correlations Between the Happiness Measure in This Study and Other Nation-Level Measures of Subjective Well-Being and Related Constructs.

Correlation significant at .05. **Correlation significant at .01.
Table 2 shows clearly that our measure is highly correlated with other measures of positive affect as well as descriptions of the day of the interview. Table 2 demonstrates that our happiness measure is unrelated to measures of general life satisfaction.
Figures 1, 2, and 3 provide visualizations of the relationship between our measure of happiness and those in the latest Pew Research Center study (Johnson, 2018), Kuppens et al. (2006), and the World Values Survey (Minkov & Bond, 2017), which are the closest to ours. The first of these (Johnson, 2018) is percentage of respondents (nationally representative samples) who describe the day of the interview as “particularly good.” The second measure (Kuppens et al., 2006) is factor scores on a component that measures positive affect. The third (Minkov & Bond, 2017) is average national percentages of respondents in the three latest waves of the World Values Survey (2000 through 2014) who describe themselves as “very happy.”

A visual comparison of the national happiness scores in this study and in those in the 2017 Pew Research Center Study.
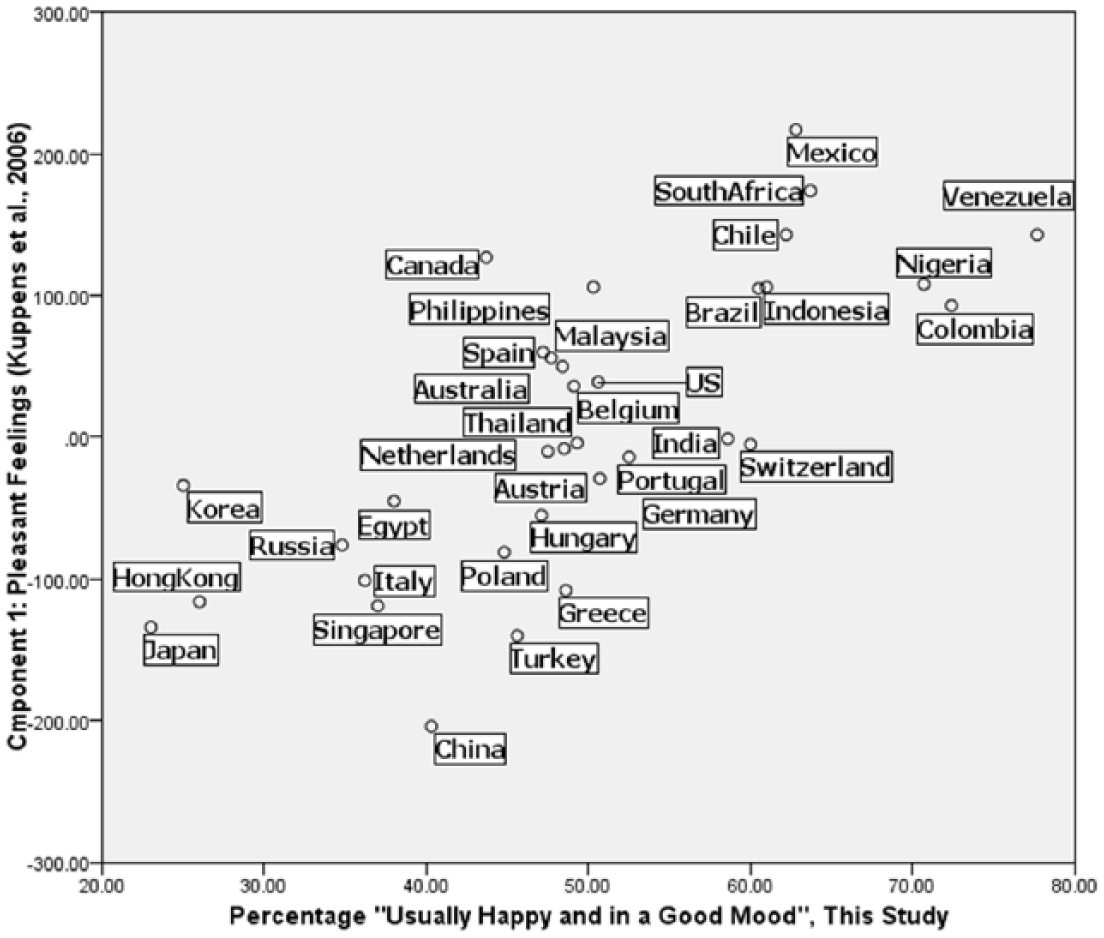
A visual comparison of the national happiness scores in this study and in Kuppens, Ceulemans, Timmerman, Diener, and Kim-Prieto (2006).
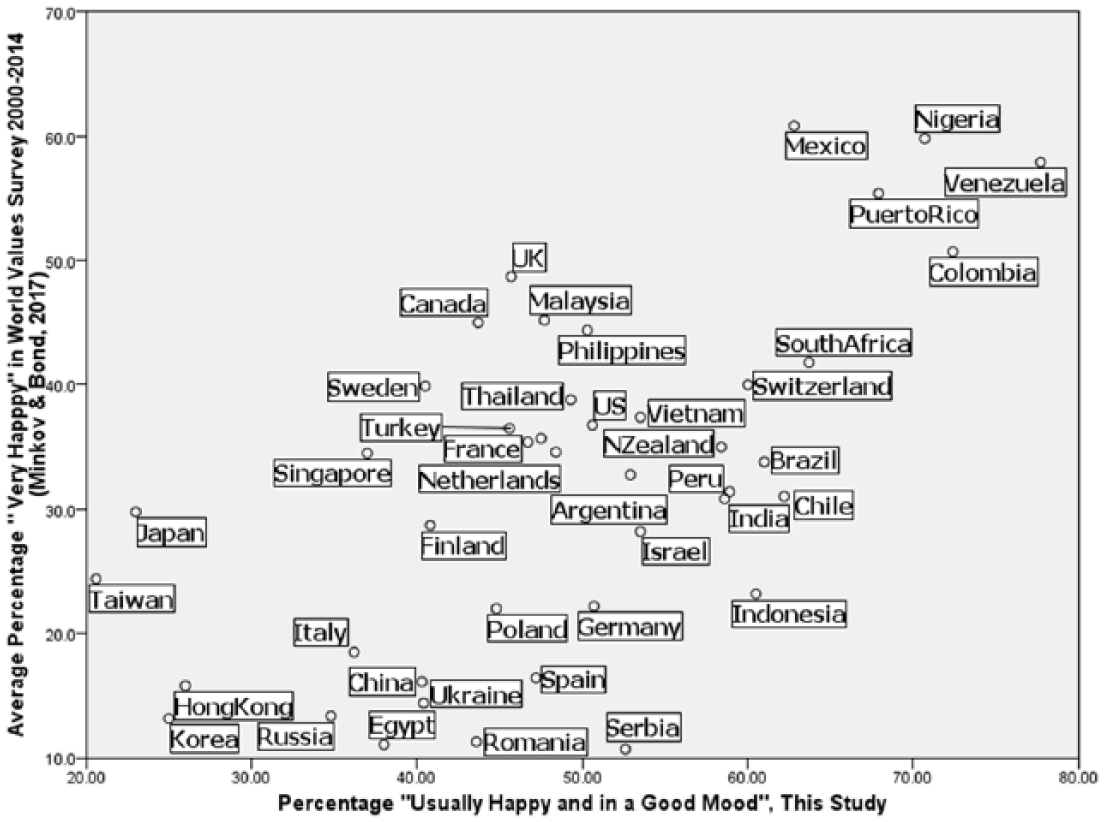
A visual comparison of the national happiness scores in this study and percentage “very happy” across the three latest waves of the world values survey (Minkov & Bond, 2017).
Table 3 compares the predictive properties of our happiness measure with other published SWB measures, including the main SWB measures in Veenhoven (2016)—those that provide data for a large number of countries from all continents. Four of the 12 measures, including ours, are highly associated with national cigarette consumption (r > .60), yet our happiness measure is the only one that produces a significant zero-order correlation with suicide rates that exceeds .40.
Zero-Order Correlations Between National Happiness Measures and Suicide Rates, Cigarette Consumption.
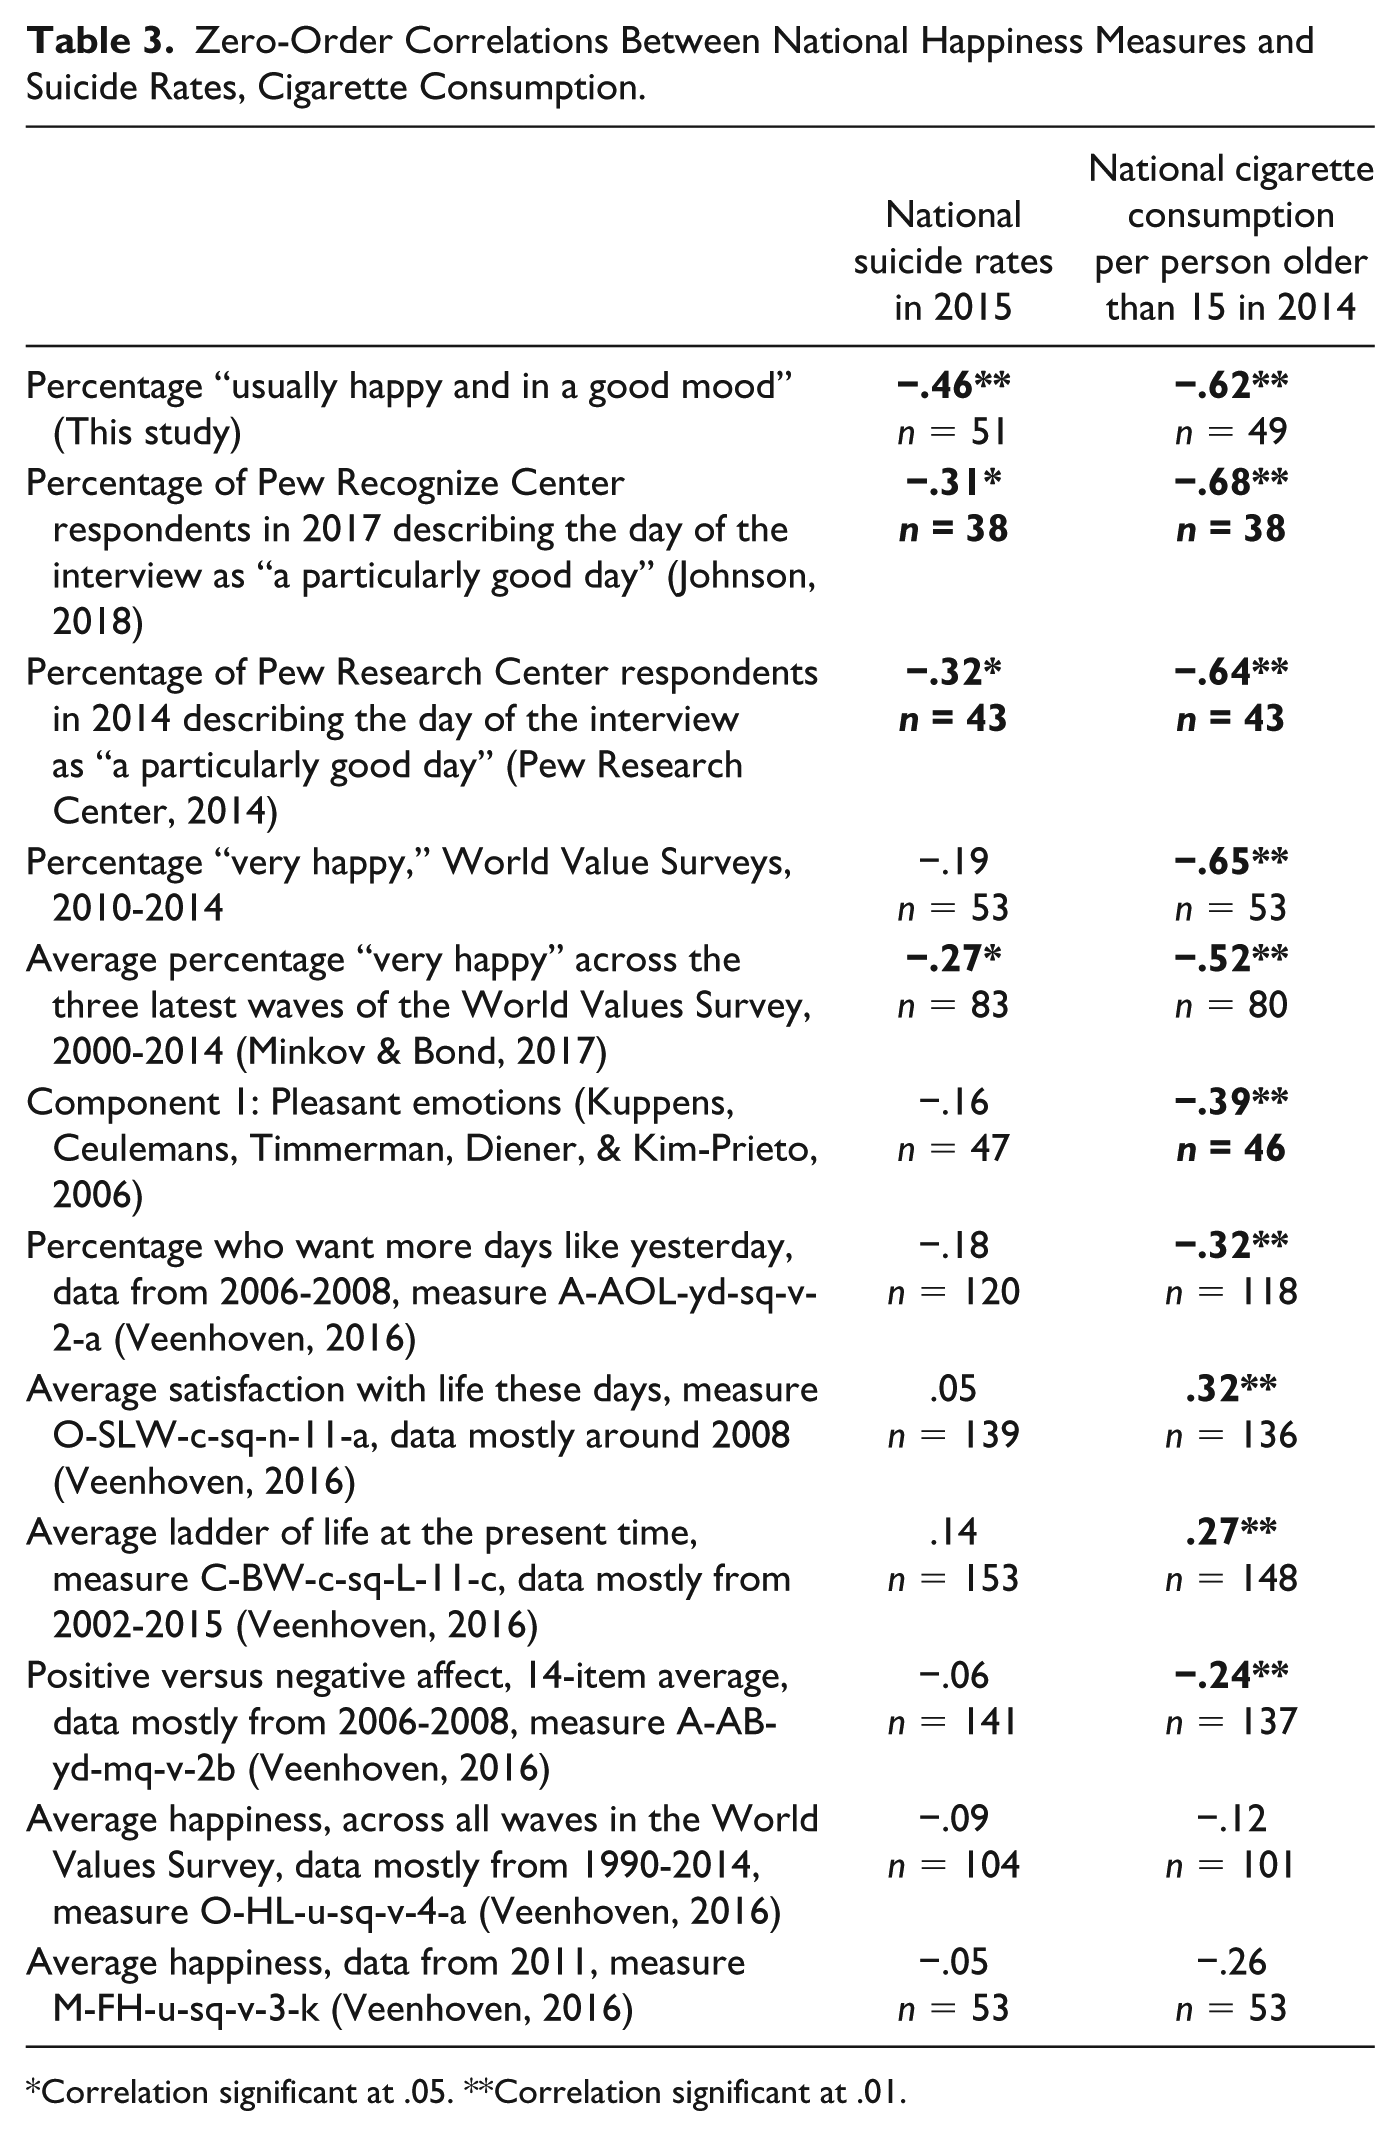
Correlation significant at .05. **Correlation significant at .01.
Figure 4 visualizes the relationship between our happiness measure and national suicide rates in 2015, whereas Figure 5 shows the linear regression line when the former variable is a predictor of the latter. Figure 6 visualizes the relationship between our happiness measure and national cigarette consumption in 2014, whereas Figure 7 shows the linear regression line when the former variable is a predictor of the latter.
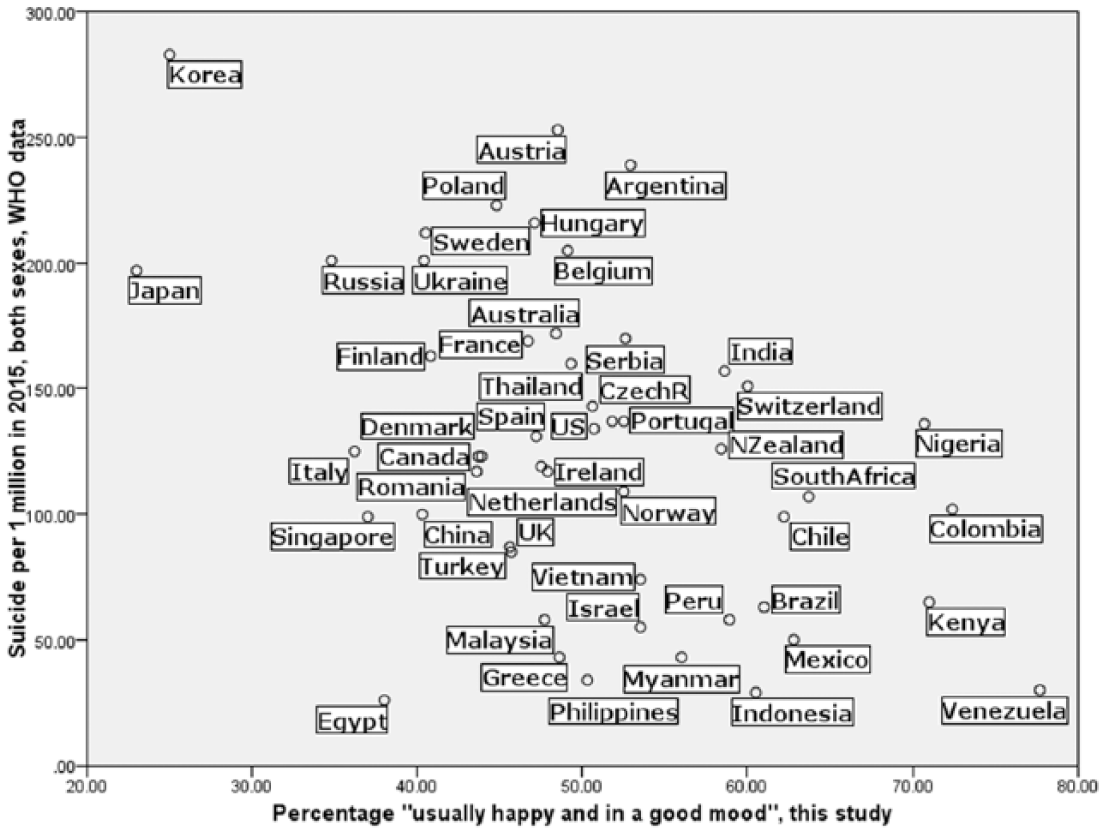
A visual comparison of the national happiness scores in this study and national suicide rates in 2015.
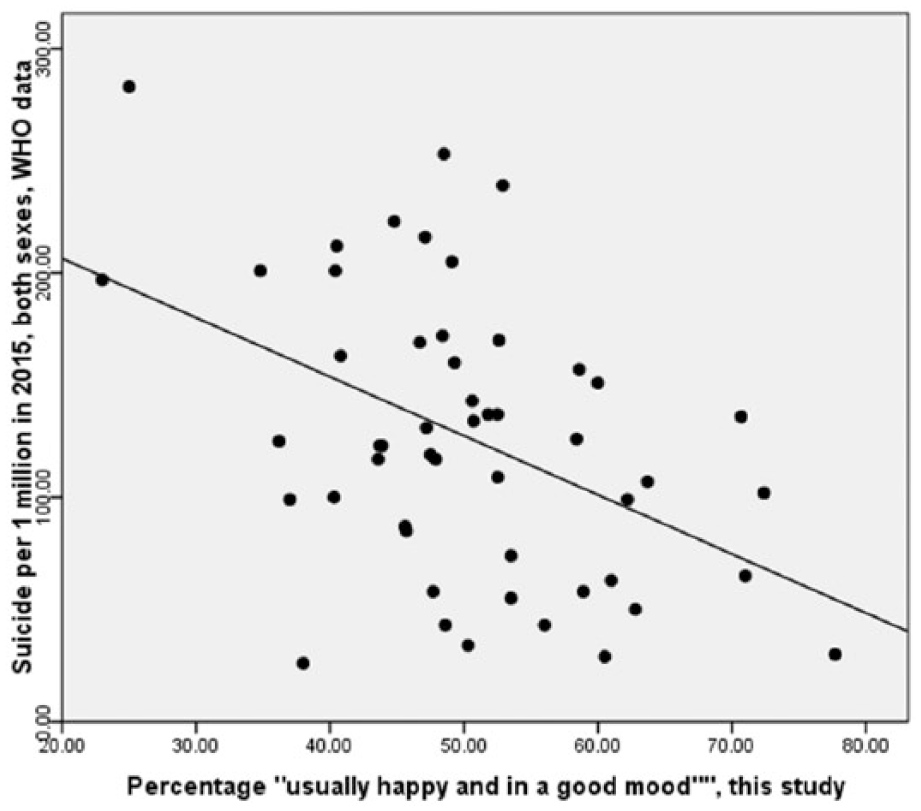
A visual comparison of the national happiness scores in this study and national suicide rates in 2015, with a linear regression line.
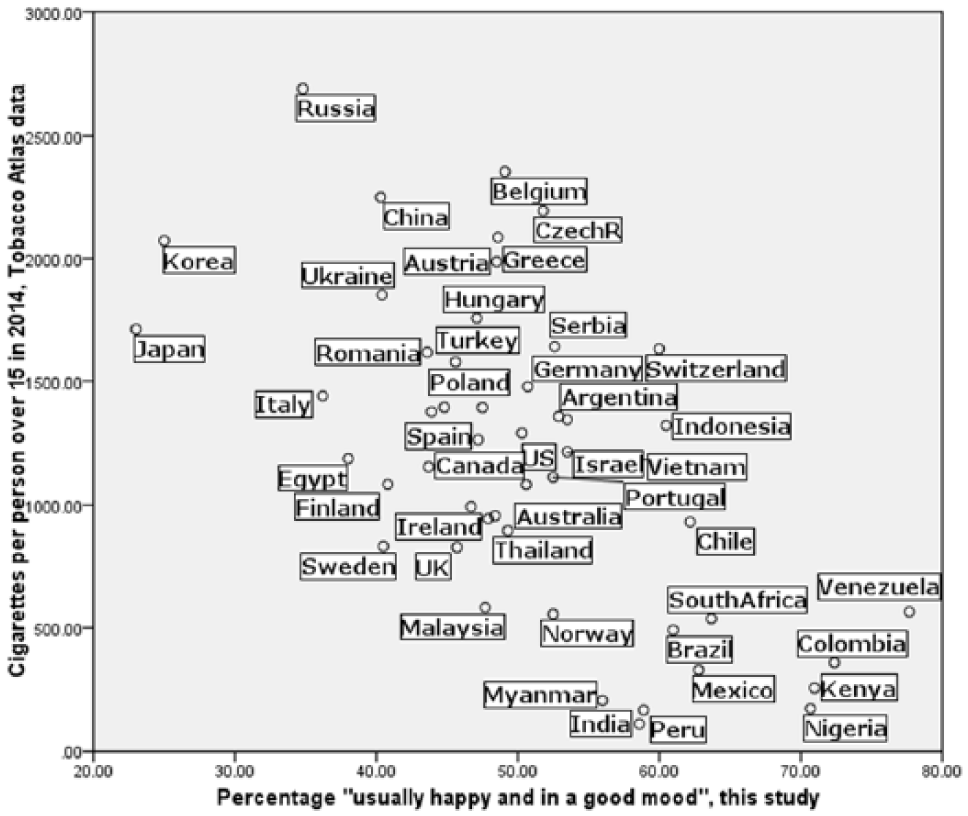
A visual comparison of the national happiness scores in this study and national cigarette consumption in 2014.
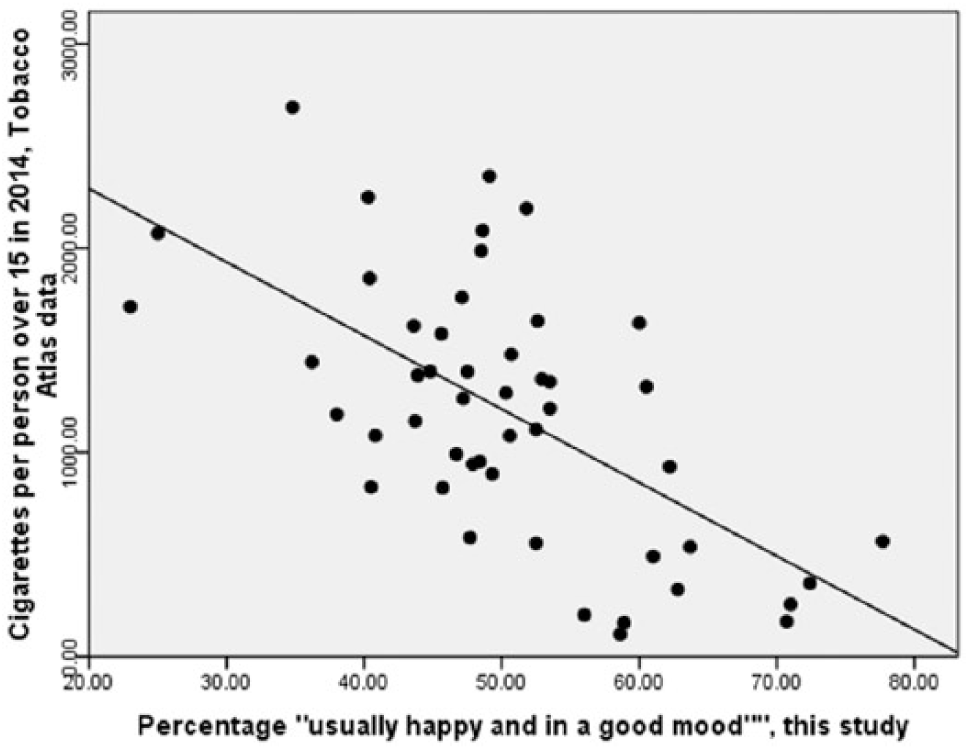
A visual comparison of the national happiness scores in this study and national cigarette consumption in 2014, with a linear regression line.
We built regression models with each of the two dependent variables—suicide rates and cigarette consumption—and all plausible predictors, starting with our happiness measure and adding other independent variables. Tables 4 and 5 provide the most plausible regression models for the two dependent variables. Our first plausibility criterion was a high number of countries in the model. As we started with 52 countries for which we have our own happiness scores, we thought that we should not lose more than 25% of them due to data unavailability. Therefore, our regression model should contain at least 40 countries. A plausible regression model should also have a reasonably high R2 value, approaching .50, because that means that the independent variables explain at least 50% of the variance in the dependent variable. Although none of our models completely satisfied this criterion, we obtained results that are close to it. The model need not contain insignificant predictors as these in principle do not explain any variance while having the potential to obscure the relationship between the significant predictors and the dependent variable. Finally, a plausible model is a model with low collinearity.
Significant Predictors of National Suicide Rates in 2015: Results From a Multiple Regression Analysis.
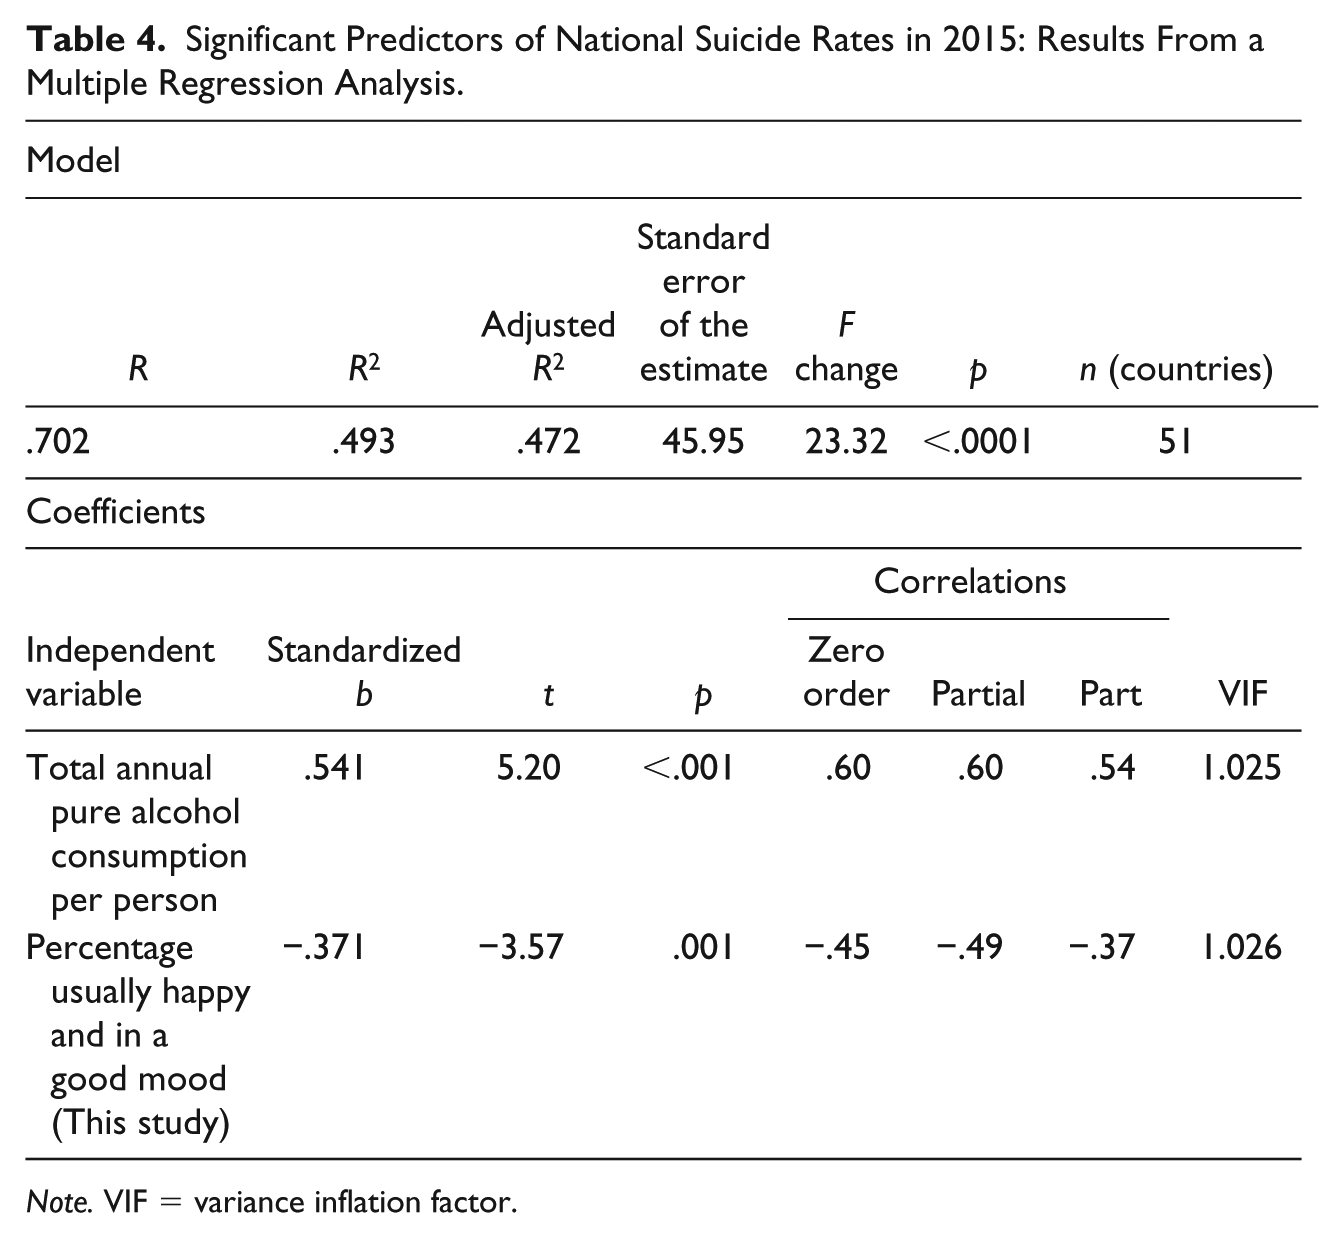
Note. VIF = variance inflation factor.
Significant Predictors of National Cigarette Consumption in 2012 Results From a Multiple Regression Analysis.
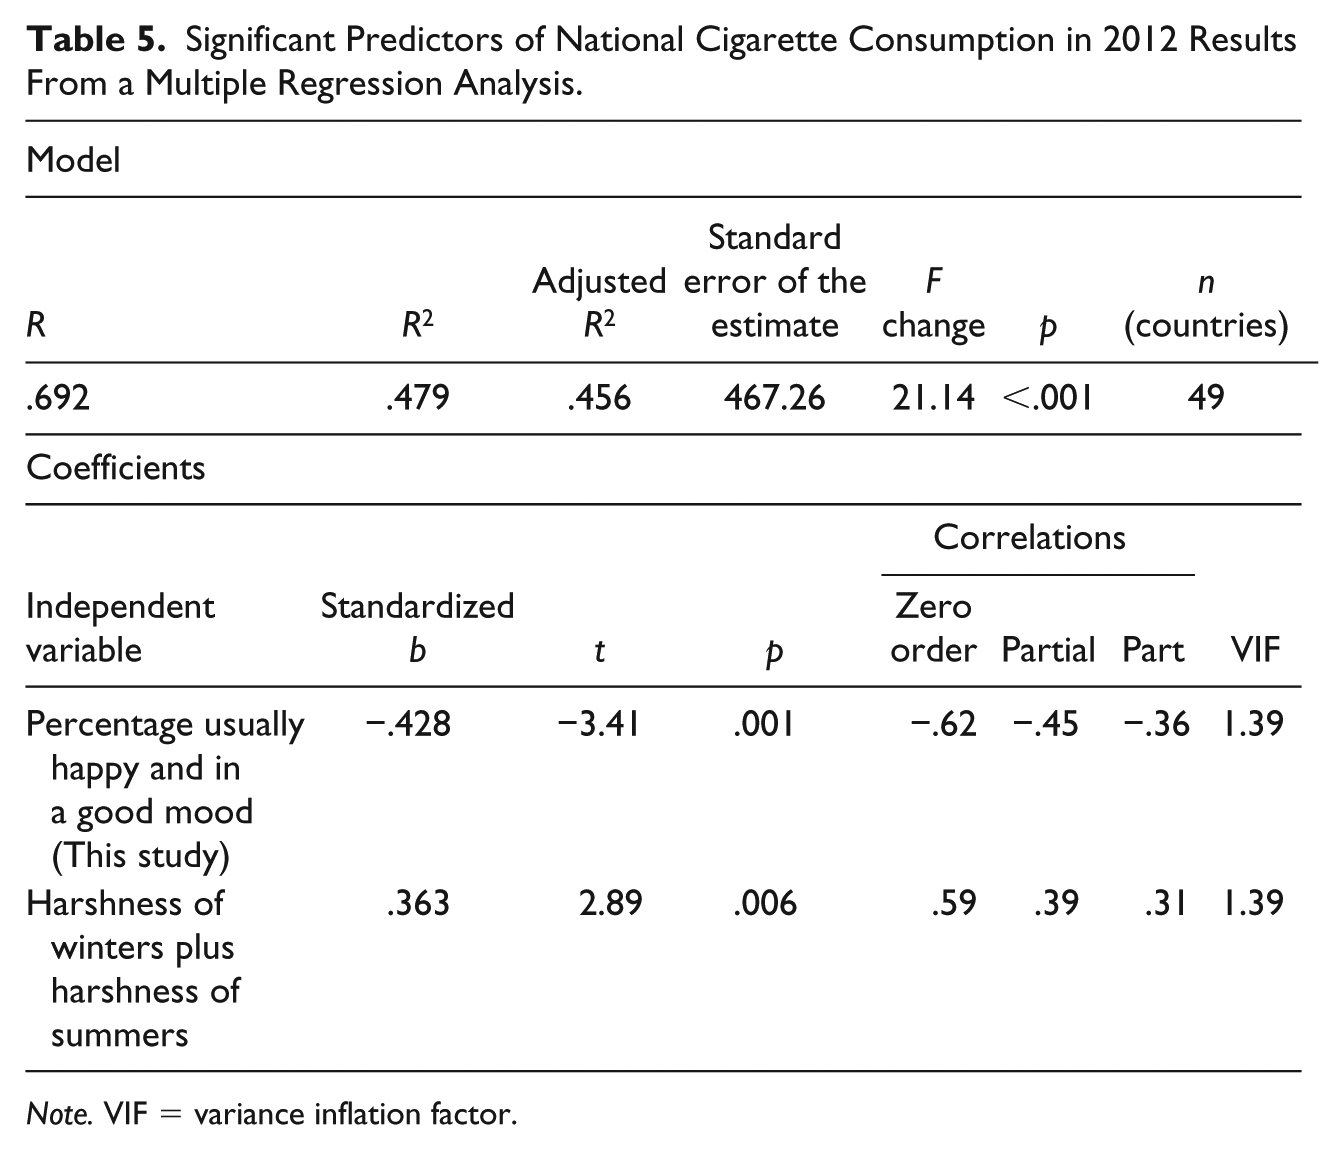
Note. VIF = variance inflation factor.
When added to either of these regression models, none of the remaining independent variables—measures of SWB, personality traits related to SWB, or other—was a significant predictors of either suicide rates or cigarette consumption, regardless of the combination of independent variables that we used. In fact, with few exceptions, all those independent variables were very far from statistical significance.
Discussion
Our study provides a new measure of national happiness, capturing the stable affective component of it. Effectively, for the purpose of our study, aggregate national happiness is equated with a particular aspect of aggregate national personality as personality traits are defined as “dimensions of individual differences in tendencies to show consistent patterns of thoughts, feelings, and actions” (McCrae, 2002, p. 2; McCrae & Costa, 1990). The goal of our study was not to find if this is the best approach to the study of national happiness but to provide an empirical assessment of the utility of this approach.
Our happiness measure is expressed as percentages of respondents who categorically state that they are usually happy and in a good mood, rather than as average national scores on a Likert-type scale. In this way, we avoid suspicions that the answers are contaminated with culturally induced acquiescence or extreme responding.
Our approach has evidently resulted in a realistic national indicator as it creates a clear geographic contrast between Africa and northern Latin America (highest percentage of people who usually feel happy and in a good mood) and East Asia (lowest percentages). Besides, this contrast closely replicates the results of two successive nationally representative studies by the Pew Research Center, in 2017 and 2014, of respondents’ evaluations of the day of the interview. It also replicates Kuppens et al.’s (2006) study of positive affect and resembles the outcomes of the World Values Survey.
We find that our happiness measure is the only SWB measure that explains national differences in suicide rates and cigarette consumption. The finding that suicide rates are highly correlated with the affective component of happiness explains why East Asia has some of the highest suicide rates in the world, whereas Africa and northern Latin America have some of the lowest rates. Yet, our happiness measure leaves a fair amount of unexplained variance. We find that high alcohol consumption accounts for an even higher part of the variance in suicide rates.
We remind the readers that our study provides an ecological analysis. The findings do not necessarily have implications for individuals. Thus, our study does not suggest that a sizable proportion of individuals who commit suicide have a history of alcohol abuse. In fact, the national alcohol consumption measure may be a proxy for a measure of societal differences in tolerance of excessive self-indulgence versus intolerance and restriction, alienation versus social support, or disorientation versus a sense of purpose or calling. Unfortunately, with some notable exceptions (for instance, Rochelle, Yeung, Bond, & Li, 2015), the cross-cultural field has done relatively little so far to elucidate the association between alcohol consumption and culture or social climate.
The fact that we do not find a nation-level association between unemployment rates and suicide does not invalidate studies that report such a correlation at other levels of analysis. It simply means that within-country patterns do not necessarily replicate patterns across countries. For example, the within-country relationship between increases in unemployment rates and suicide rates need not be mirrored by a nation-level relationship between snapshots of suicide rates and snapshots of unemployment rates at a given point.
This is the first large-scale nation-level study showing that national differences in cigarette consumption are associated with happiness differences. Although our measure seems to be the best predictor of cigarette consumption, several other happiness measures also yield significant and high zero-order correlations. This suggests that the nation-level association between happiness and cigarette consumption is unlikely to be spurious. We find that environmental stress (harsh winters and summers) also contributes to cigarette consumption. Admittedly, our study cannot clearly show the direction of the cause-and-effect relationship. At either the individual level, or the societal, or both, it is possible that tobacco consumption is not only an outcome of insufficient positive affect but a contributor to it as well, for instance, by causing diverse diseases.
Our study has methodological implications for the study of happiness or SWB. Obviously, measuring the affective component of SWB, defined as being usually in a good mood, is a legitimate approach to the study of national happiness. Compared with currently more popular measures in the SWB literature, focusing on the evaluative component of SWB (life satisfaction), our measure has at least some superior predictive and explanatory properties with respect to important societal indicators. We consider attempts to equate and conflate happiness with life satisfaction by asking respondents how “happy, rather than how satisfied, they are with their life as a whole” (Helliwell et al., 2015, p. 16), inappropriate. First, the English language usage, in which “happy with something” is synonymous with “satisfied with something,” is not a universal phenomenon and the former phrase may be untranslatable literally. Second, while measures of happiness as positive affect have demonstrable interesting predictive properties, it is unclear for now what important societal differences can be explained in terms of life satisfaction differences. These may be easily explained in terms of wealth differences or related phenomena (rule of law, etc.) but we need further studies to understand better how measures of national life satisfaction elucidate cultural patterns across the world. This is important in view of the correct observation by one of the reviewers of this article that the cross-cultural field needs some integrative model for nation-level findings. We have shown that national happiness, defined as good mood, can clearly be integrated in a larger framework of national differences. The geographic distribution of happiness defined as positive affect—rising from East Asia in the direction of Latin America and Africa—is reminiscent of other important differences on this continuum and may be part of a large single pattern, awaiting appropriate conceptualization and empirical demonstration.
Footnotes
Declaration of Conflicting Interests
The author(s) declared no potential conflicts of interest with respect to the research, authorship, and/or publication of this article.
Funding
The author(s) disclosed receipt of the following financial support for the research, authorship, and/or publication of this article: The data collection for this study was sponsored financially by Mediacom Ltd. has not influenced the data collection, the writing of this article, or the decision to publish it, in any way.