




Abstract
To examine cultural, parental, and personal sources of young adults’ long-term romantic partner preferences, we had undergraduates (n = 2,071) and their parents (n = 1,851) in eight countries (Canada, India, Italy, Japan, Mexico, Malaysia, Philippines, the United States) rate or rank qualities they would want in the student’s partner. We introduce and use a method for separating preference patterns into normative patterns (shared across families and generations) and distinctive patterns (that characterized particular families or individuals). We found that youth everywhere wanted partners who aligned with both their own dispositions and their parents’ preferences, and these alignments reflected both culturally normative preferences and preferences distinctive to specific individuals or families. Students also predicted their parents’ responses: Their predictions were reasonably accurate reflections of what a typical parent prefers, but also reflected distinctive assumed agreement (i.e., they overestimated the degree to which their particular parents shared their particular preferences for qualities that diverged from culturally normative ideals). Culturally normative patterns exerted a stronger influence on actual or assumed parent–child agreement and accuracy in relatively collectivistic Southeast Asia (Philippines and Malaysia) than in relatively individualistic English-speaking North America (the United States and Canada). Conversely, preferences for partners who shared one’s distinctive personal dispositions were stronger in Western than Asian countries.
Keywords
Seeking, forming, and sustaining long-term romantic relationships are among the most pivotal chapters in the lives of most individuals. Romantic relationships have continuing consequences for the partners’ mental and physical well-being (Feeney & Collins, 2015). They also affect broader family relations, sometimes bringing different families closer and sometimes alienating individuals from their family of origin. Over many generations, by influencing who does or does not mate, partner preferences may have shaped the course of human evolution (Darwin, 1871). Given the manifold consequences of partner choice, the current study aims to advance our understanding of the influences on partner preferences.
One influence on partner preferences may be a general preference for others who are similar to the self (i.e., self-ideal similarity). For example, numerous studies have found positive associations between individuals’ self-ratings on certain personality traits (e.g., conscientiousness, openness) and preferences for those same traits in a long-term partner (Botwin et al., 1997; Furnham, 2009; Liu et al., 2018; Watson et al., 2014).
Another potential influence is parents. Throughout history, parents have attempted to govern their children’s mate choices, presumably because they doubt their child will spontaneously share their opinions of potential partners (Apostolou, 2017). Indeed, although only a few studies have directly compared young adults’ preferences for attributes in a long-term partner or spouse with their parents’ preferences for attributes in a son/daughter-in-law (i.e., Apostolou, 2015; Guo et al., 2017; Perilloux et al., 2011), those studies identified reliable areas of parent–child disagreement. Specifically, youth preferred entertaining, exciting, attractive partners more and preferred religious partners less than their parents wanted them to.
Youth demonstrate some understanding of which attributes tend to evoke parent–child disagreements: When asked whether various attributes of potential partners would be more unacceptable to them or to their parents, young adults generally expected they would consider smelly, unattractive, uncreative, unexciting, humorless partners more unacceptable, whereas their parents would consider uneducated partners from different religious or ethnic backgrounds more unacceptable (Buunk & Castro-Solano, 2010; Buunk et al., 2008; Dubbs et al., 2013). However, no studies have directly tested the accuracy of youth’s perceptions of their parents’ partner preferences. Moreover, studies comparing compared youth’s perceptions of their parents’ general life values with their parents’ actual values have found at best moderate correlations (Stattin & Kim, 2018). Thus, one reason young adults may not share their parents’ preferences is they do not accurately comprehend their parents’ preferences (Knafo & Schwartz, 2004), and thus may not recognize when they are confounding rather than accommodating their parents’ wishes. One potential source of inaccuracy is assumed similarity—that is, presuming others share your attributes or preferences (Cronbach, 1955; Kenny, 1994). Assumed similarity has been shown to influence many types of judgments, including adolescents’ perceptions of parents’ personal values (Stattin & Kim, 2018).
The current study adds to previous research in two ways. First, the partner preference studies reviewed above sought to identify which particular partner attributes youth valued more than parents did or vice versa. In contrast, the current study concerns not which specific attributes were preferred, but instead—on average across a diverse sample of partner attributes—how closely young adults’ partner preferences align with their self-concepts (self-ideal similarity), their perceptions of their parents’ preferences (assumed agreement), and their parents’ actual preferences (actual agreement), as well as how closely their perceptions of their parents’ preferences align with their parents’ actual preferences (accuracy). Second, the current study of partner preferences is the first to examine if nationality predicts levels of self-ideal similarity, parent–child agreement, assumed agreement, or accuracy.
Moderating Effects of Culture
Although previous partner preference research has not tested if self-ideal similarity, parent–child agreement, assumed agreement, or accuracy differs between countries, related research—and cultural theory—suggests such differences are likely. Cultures that are more individualistic and less collectivistic tend to give individual preferences more priority than family or in-group cohesion (Hofstede, 2001). Accordingly, relatively individualistic (e.g., North American) cultures are more apt to construe marriage as joining two compatible individuals, whereas relatively collectivistic (e.g., Asian) cultures are more apt to construe marriage as joining two compatible families (Dion & Dion, 1996). If young adults in more individualistic cultures give more weight to personal preferences, then we might expect them to prefer a partner whose personality mirrors their own personality (i.e., greater self-ideal similarity).
In contrast, parental involvement in choosing partners is both more expected and more accepted in relatively collectivistic than relatively individualistic cultures (Buunk et al., 2010). Members of more collectivistic cultures may thus give more weight to the partner preferences of parents and close others (MacDonald et al., 2012). For example, Zhang and Kline (2009) found Chinese to be more likely than Americans to describe the approval or disapproval of friends and family a decisive factor in who they would date or marry. If young adults in more collectivistic cultures give their parents’ preferences more attention and respect, then we might expect them to better understand—and to want to conform to—their parents’ preferences (e.g., greater accuracy and actual/assumed agreement).
Normative and Distinctive Sources of Congruence
Actual or assumed agreement, accuracy, and self-ideal similarity are all forms of congruence. Self-ideal similarity is congruence between qualities a youth has and qualities the youth prefers in a partner. Accuracy is congruence between qualities a youth believes her or his parents prefer and qualities her or his parents actually prefer. Finally, agreement and assumed agreement are congruence between qualities a youth prefers and qualities that either her or his parents prefer or she or he believes her or his parents prefer.
Cultural differences in these types of overall congruence may be attributable to cultural differences in either normative congruence or distinctive congruence. Normative congruence reflects response patterns that are commonly shared within a culture, thus making it likely that responses from random unrelated individuals within that culture will be consistent with each other. Distinctive congruence reflects response patterns that are characteristic of an individual or family but are not shared with random others from the same culture (e.g., Barni et al., 2014).
To illustrate, suppose parent-youth agreement is greater in Culture A than Culture B. One reason may be that an average (normative) parent’s preferences is more like an average (normative) youth’s preferences in Culture A than Culture B. In other words, normative agreement between random unrelated parents and youth is greater in Culture A than Culture B. Another reason may be that within each family, a parent’s distinctive preferences (how this parent’s preferences deviate from those of the average parent) is more like a youth’s distinctive preferences (how this youth’s preferences deviate from those of the average youth) in Culture A than Culture B. In other words, distinctive agreement between related (rather than random) parents and youth is greater in Culture A than Culture B. These are conceptually and statistically independent explanations; thus, Culture A could show greater normative (but not distinctive) agreement, greater distinctive (but not normative) agreement, or both greater normative and greater distinctive agreement.
Assumed agreement, accuracy, and self-ideal similarity can likewise be divided into normative and distinctive components. Table 1 provides definitions and simple examples of normative, distinctive, and overall agreement, assumed agreement, accuracy, and self-ideal similarity.
Definitions and Simple Examples of Overall, Normative, and Distinctive Assumed Agreement, Accuracy, Agreement, and Self-Ideal Similarity.
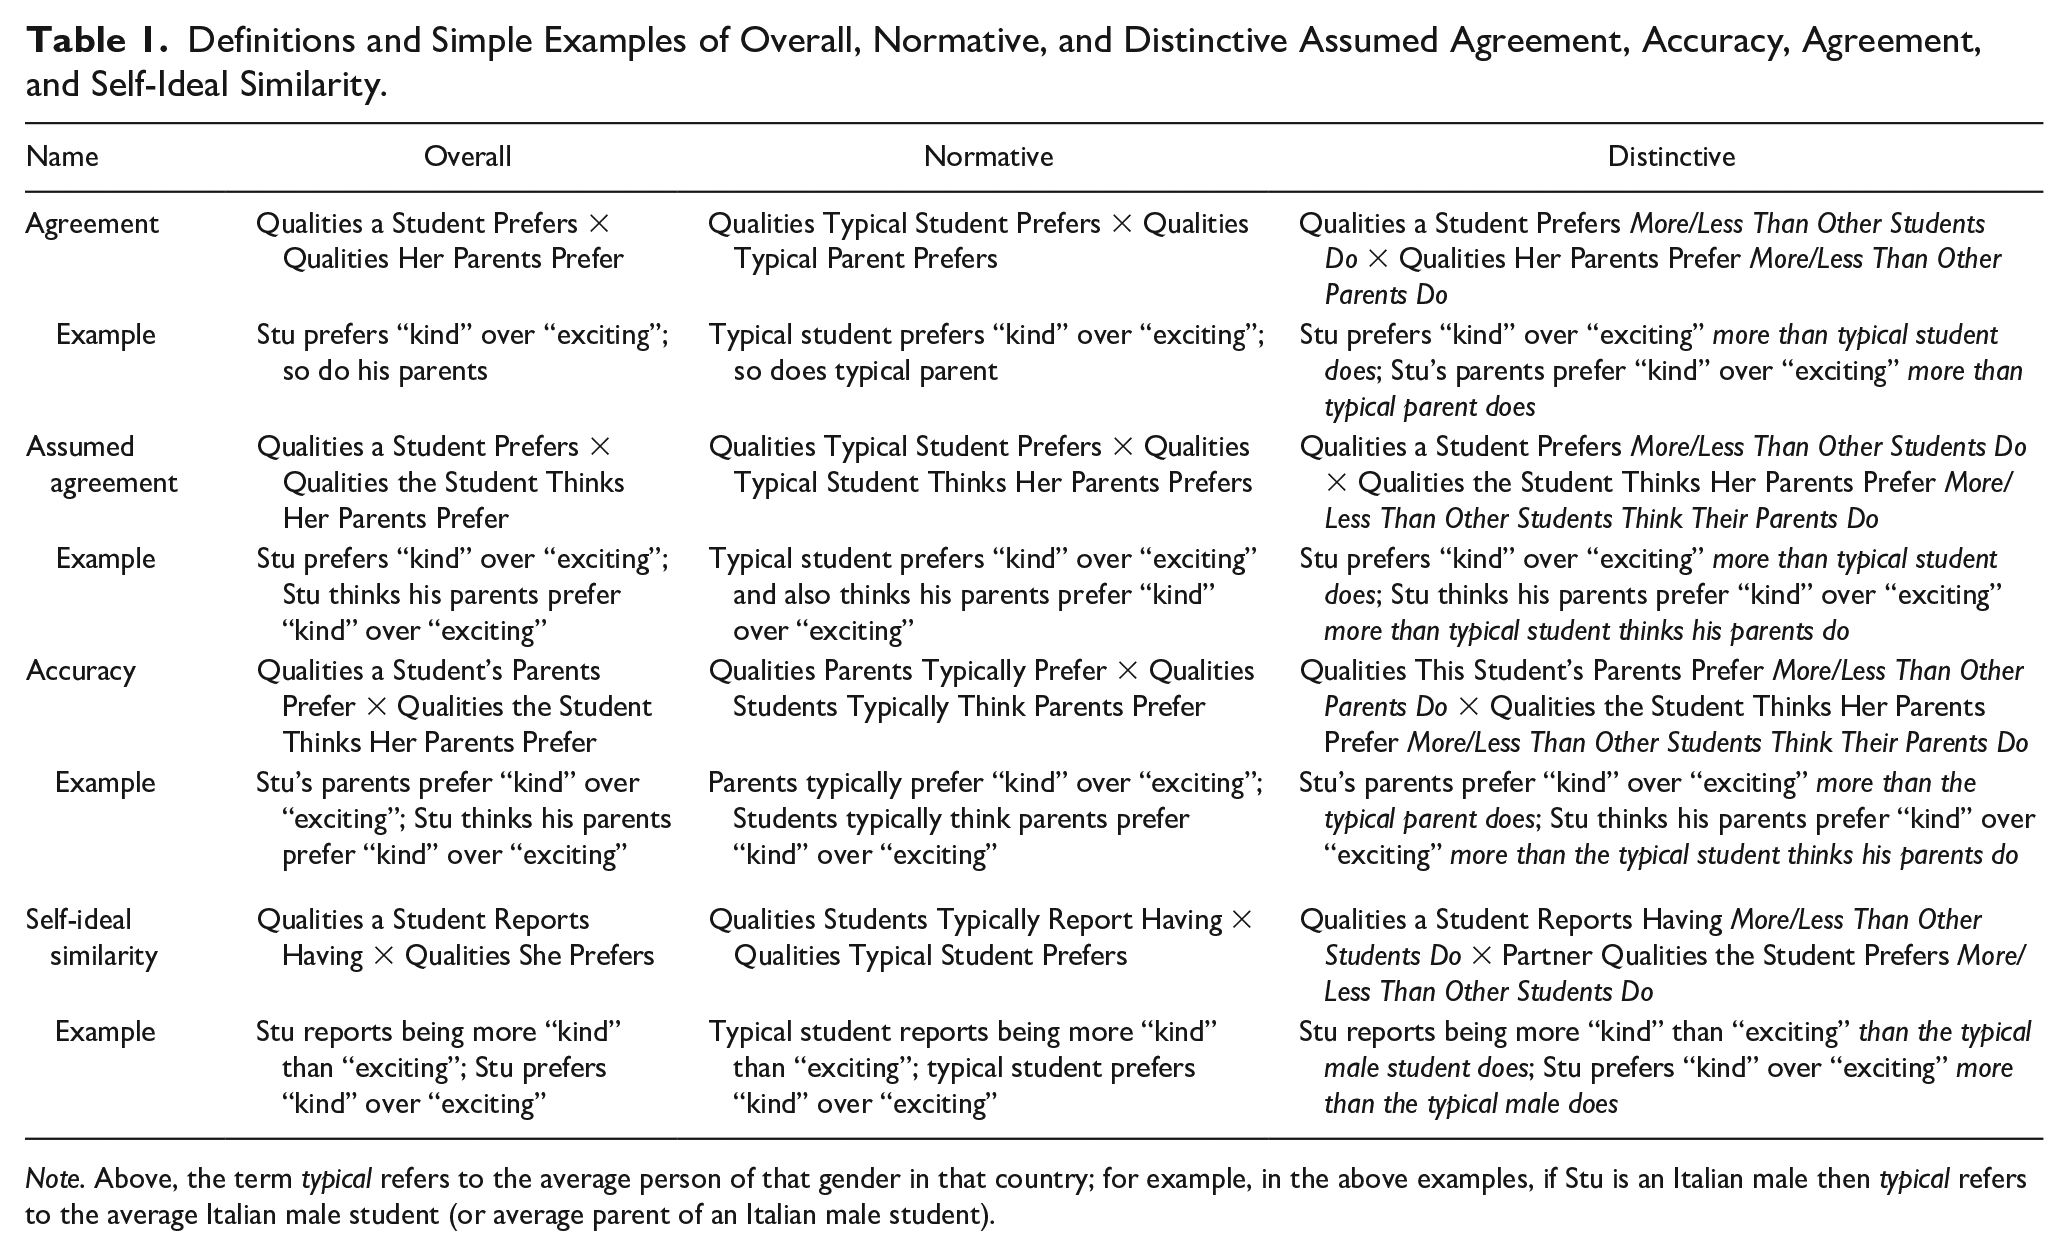
Note. Above, the term typical refers to the average person of that gender in that country; for example, in the above examples, if Stu is an Italian male then typical refers to the average Italian male student (or average parent of an Italian male student).
Summary of Study
The current study examined if nationality moderated how closely young adults’ partner preferences aligned with their own traits and their parents’ actual or assumed preferences. We collected data from parents and their young adult children in eight geographically and culturally diverse countries: Canada, India, Italy, Japan, Mexico, Malaysia, the Philippines, and the United States. To explore the generalizability of our findings, participants reported their partner preferences both by rating the desirability of various traits (e.g., shy, outspoken) and by ranking the desirability of various attributes (e.g., intelligent, attractive). We hypothesized that understanding of and alignment with parental preferences would be weaker—whereas alignment of preferences with one’s own personality would be stronger—among youth from more individualistic cultures. We tested the effects of nationality on normative congruence and distinctive congruence separately, but did not make a priori predictions regarding how nationality might differentially affect normative versus distinctive congruence given the absence of prior research on that topic.
Method
Participants
The participants were unmarried undergraduates who desired a long-term partner of a different gender, were ≤30 years old, citizens of the country where data were being collected, and residents of that country for ≥5 years. Canadian participants were 295 University of Toronto students (103 men, 192 women; Mage = 18.7, SD = 1.3); they identified their ethnic backgrounds as European (n = 120), Asian or Pacific Islander (n = 111), and other/missing (n = 64). Indian participants were 133 Bangalore, Goa, or Karnatak University students (23 men, 110 women; Mage = 21.5, SD = 1.6); their religious backgrounds were Hindu (n = 91), Christian (n = 31), Islam (n = 6), and other/missing (n = 5). Italian participants were 290 Catholic University of Milan students (98 men, 192 women; Mage = 20.8, SD = 2.0). Japanese participants were 255 Kansai University students (130 men, 125 women; Mage = 20.3, SD = 1.2). Malaysian participants were 325 National University of Malaysia students (172 men, 153 women; Mage = 20.5 years, SD = 1.2). Mexican participants were 273 National Autonomous University of Mexico students (100 men, 173 women; Mage = 19.8 years, SD = 1.9). Philippine participants were 229 De La Salle University students (93 men, 136 women; Mage = 18.9, SD = 1.3). Of those reporting their ethnicities, 81% described themselves as Filipino and 14% as Chinese or Filipino-Chinese. U.S. participants were 271 University of Idaho students (86 men, 185 women; Mage = 19.3, SD = 1.8); they identified their ethnic backgrounds as European (n = 229), Latino/Hispanic (n = 19), multiracial (n = 15), and other/missing (n = 8). In total, we obtained responses from 2,071 undergraduates. We also obtained responses from 1,851 parents (227 American, 197 Canadian, 97 Indian, 288 Italian, 208 Japanese, 266 Mexican, 296 Malaysian, 227 Filipino; 76.6% female; Mage = 50.2). Parent gender yielded no noteworthy main or moderating effects and will not be discussed further.
Materials
The original English materials were translated into Italian, Japanese, Malaysian, Spanish, and Tagalog (Filipino) by native speakers. Different translators translated the materials back into English, and minor modifications were made to resolve discrepancies with the original materials.
Trait rating measure of partner preferences
We selected traits from a pool of traits whose social desirability had been judged on 1 (extremely undesirable) to 9 (extremely desirable) scales by two large independent samples (Hampson et al., 1987; Norman, 1967). To prevent floor or ceiling effects, we chose 10 traits that lacked extreme positive or negative evaluative implications (i.e., whose desirability—averaging across the two samples—was greater than 4 but less than 7). To ensure that they assessed different qualities, we chose traits that formed pairs that were contrasting in meaning. Specifically, the traits were as follows: quiet, outspoken; cautious, carefree; shy, frank; traditional, nonconforming; and mischievous, predictable. Students rated how well each of the 10 traits described them on the following 7-point scale: extremely untrue of me (1), very untrue of me (2), somewhat untrue of me (3), neither (4), somewhat true of me (5), very true of me (6), and extremely true of me (7). Students also rated “how desirable or undesirable you consider each trait to be in a long-term mate or marriage partner for you” and “how desirable or undesirable your parent would consider each of these traits to be in a long-term mate or marriage partner for you” on the following 7-point scale: extremely undesirable (1), very undesirable (2), somewhat undesirable (3), neutral (4), somewhat desirable (5), very desirable (6), and extremely desirable (7). Finally, one parent of each student rated “how desirable or undesirable you consider each trait to be in someone your child might marry.”
To verify that the traits did not receive uniformly high or low ratings, we examined the mean rating of each trait in each country. For students’ self-ratings, 88% of the 80 means (from Eight Countries × 10 Traits) fell in the middle third of the 1-to-7 response scale (i.e., between 3 and 5) and 100% fell in the middle two thirds (i.e., between 2 and 6). The corresponding percentages for students’ partner ratings were 68% and 98% and for parents’ partner ratings were 61% and 94%. In sum, some traits in some countries received mostly high or mostly low ratings, but in no case did the ratings seem hindered by floor or ceiling effects.
Attribute ranking measure of partner preferences
The ranking preference measure, which has been used in numerous studies (e.g., Guo et al., 2017; Perilloux et al., 2011), involves ranking the following attributes from 1 (most desired characteristic) to 13 (least desired): kind and understanding; good earning capacity; college graduate; religious; good heredity; intelligent; exciting personality; healthy; easygoing; physically attractive; creative and artistic; wants children; and good housekeeper. Students ranked their “desirability in someone you might marry.” Students also ranked “how desirable [your parent completing this study] would consider the characteristics below in someone you might marry.” One parent of each student ranked their “desirability in someone [your child completing this study] might marry.”
Procedure
Students completed a questionnaire containing, in order, the following measures: ratings of their own traits; attribute ranking and trait rating measures of their own partner preferences; and attribute ranking and trait rating measures of their perceptions of parents’ preferences. Interspersed were demographic questions and two personality inventories irrelevant to the current study. Students provided us with one parent’s contact information. We mailed parents a briefer questionnaire which only contained the attribute ranking and trait rating measures of preferences for a partner for their child. To protect anonymity, parent and child surveys were linked by a random code number. The data are available on the Open Science Framework: https://osf.io/67rkv/
Operationalizing Overall, Normative, and Distinctive Congruence
We operationalized parent–child agreement, assumed agreement, accuracy, and self-ideal similarity as within-person or within-family covariation between profiles of ratings or rankings of preferences for various partner attributes; for example, parent–child agreement is the covariance between the attributes a child rates as more/less important and the child’s parent rates as more/less important. Profile covariances (or correlations) were the appropriate index for the current study because in a single number they show the tendency for judgments to align or misalign on average across all attributes. To clarify what profile covariances capture, note that we could obtain essentially identical results by analyzing the average of the squared differences between ratings (e.g., the squared difference between a parent’s rating and a child’s rating) for each attribute in a profile (see Cronbach & Gleser, 1953); however, profile covariances have multiple advantages, including being simpler to compute and yielding instantly interpretable values (e.g., correlations ranging from −1 to +1).
In addition, a profile of ratings can be divided into a normative profile and a distinctive profile. A normative profile shows how members of a group (e.g., Mexican women) rate each attribute on average. An individual’s distinctive profile shows the degree to which each of the individual’s ratings is above or below the group average and is computed by subtracting the normative profile from the individual’s raw profile of ratings. As depicted in Equation 1, the covariance between two overall profiles (cov12) equals the sum of the covariance between the two normative profiles (covN1N2), the covariance between the two distinctive profiles (covD1D2), the covariance between the normative component of Profile 1 and distinctive component of Profile 2 (covN1D2), and the covariance between the normative component of Profile 2 and distinctive component of Profile 1 (covN2D1):

Distinctive covariance (covD1D2) varies both between and within groups; normative covariance (covN1N2) varies between but not within groups (because within groups there is only one normative profile per type of rating profile), and covN1D2 and covN2D1 vary within but not between groups. Specifically, averaging across group members,

Thus, group differences in overall profile covariance equals group differences in normative profile covariance plus group differences in distinctive profile covariance. Because the current study only concerns differences between (not within) cultural groups, it will only examine overall, normative, and distinctive covariance. 1
The preceding is a general approach that can be applied to any profile congruence data. The following describes how we applied and tailored this methodology to the current study. First, each raw profile of ratings or rankings from each individual was standardized (relative the mean and standard deviation of that individual’s profile), thereby placing the subsequently computed covariances onto comparable correlational metrics. Second, we computed separate normative profiles for the male students, female students, parents of males, and parents of females within each country. Third, we computed distinctive profiles by subtracting the relevant normative profiles from individuals’ raw profiles; for example, if Stefano is a male Italian student, then Stefano’s distinctive profile of self-ratings was computed by subtracting the average Italian male’s self-ratings from Stefano’s raw self-ratings. Agreement, assumed agreement, and accuracy were computed for both the attribute ranking and trait rating measures; however, because self-ratings could only be obtained for the trait rating measure, self-ideal similarity could only be computed for the trait rating measure. Finally, if for a particular profile of ratings or rankings a participant either failed to respond to most of the items or gave all items the same rating (e.g., rating all traits “very desirable”), then that participant was excluded from that analysis.
Results
To provide a broad overview, Figure 1 juxtaposes overall and distinctive agreement, assumed agreement, accuracy, and self-ideal similarity (averaging across all participants and both preference measures). Because overall covariance is the sum of normative and distinctive covariance, within each column the difference between overall and distinctive covariance is the normative covariance. Figure 1 highlights three related patterns. First, overall assumed agreement exceeded overall actual agreement; thus, youth overestimate the degree to which their preferences and their parents’ preferences align. Second, distinctive assumed agreement and self-ideal similarity exceeded distinctive agreement and accuracy; thus, youth specifically overestimate the degree to which their distinctive preferences and their parents’ distinctive preferences align. Finally, the normative component accounted for a larger percentage of overall agreement (82%) and accuracy (79%) than of overall assumed agreement (58%) or self-ideal similarity (40%). Thus, about 20% of child–parent agreement and accuracy reflected response patterns uniquely shared by students and parents from the same family, whereas about 80% reflected response patterns typically shared by any student and parent from that normative sample.
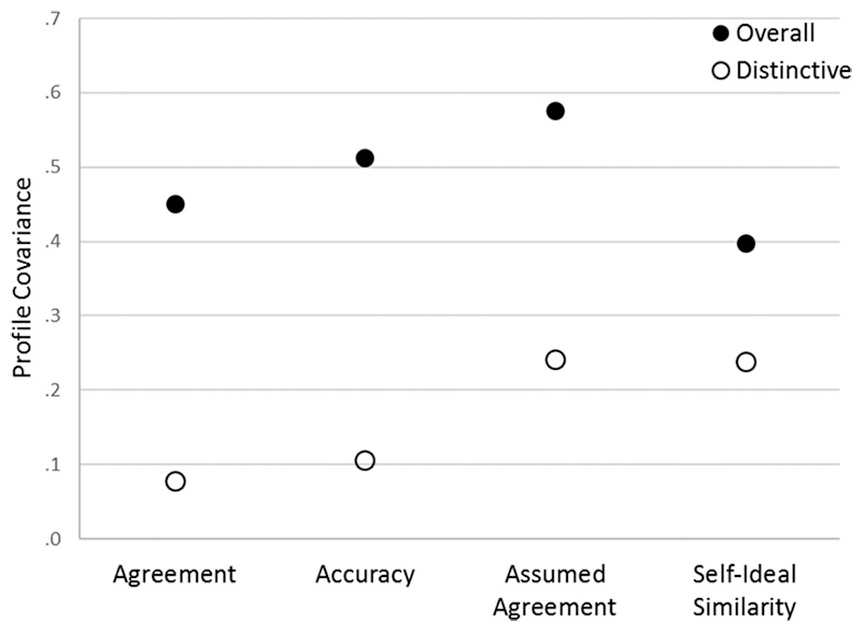
Overall and distinctive agreement, accuracy, assumed agreement, and self-ideal similarity (averaging across all participants and both preference measures).
Effects of Nationality
Tables 2 to 4 show the average normative, distinctive, and overall agreement, assumed agreement, accuracy, and self-ideal similarity for each country. To test for effects of nationality on overall and distinctive self-ideal similarity, agreement, accuracy, and assumed agreement, we conducted General Linear Model analyses (i.e., 14 separate analyses, one for each row in Tables 3 to 4), with Nationality and Gender as between-participants predictors. Given the large samples, we will only discuss effects significant at p < .0001 (approximately 95% power to detect effect sizes = .15). There were no Nationality × Gender interaction effects and only two Gender effects: Compared with males, females showed greater overall assumed agreement for ratings and overall accuracy for rankings. Because both gender differences were weak (
Normative Agreement, Assumed Agreement, Accuracy, and Self-Ideal Similarity by Nationality.

Note. Values reflect the normative portions of the overall (agreement, assumed agreement, accuracy, or self-ideal) coefficients, which when combined with the corresponding distinctive portions shown in Table 3 will equal the overall correlations shown in Table 4. CA = Canada; IN = India; IT = Italy; JP = Japan; MX = Mexico; MY = Malaysia; PH = Philippines; US = United States; ALL = all participants.
Distinctive Agreement, Assumed Agreement, Accuracy, and Self-Ideal Similarity by Nationality.
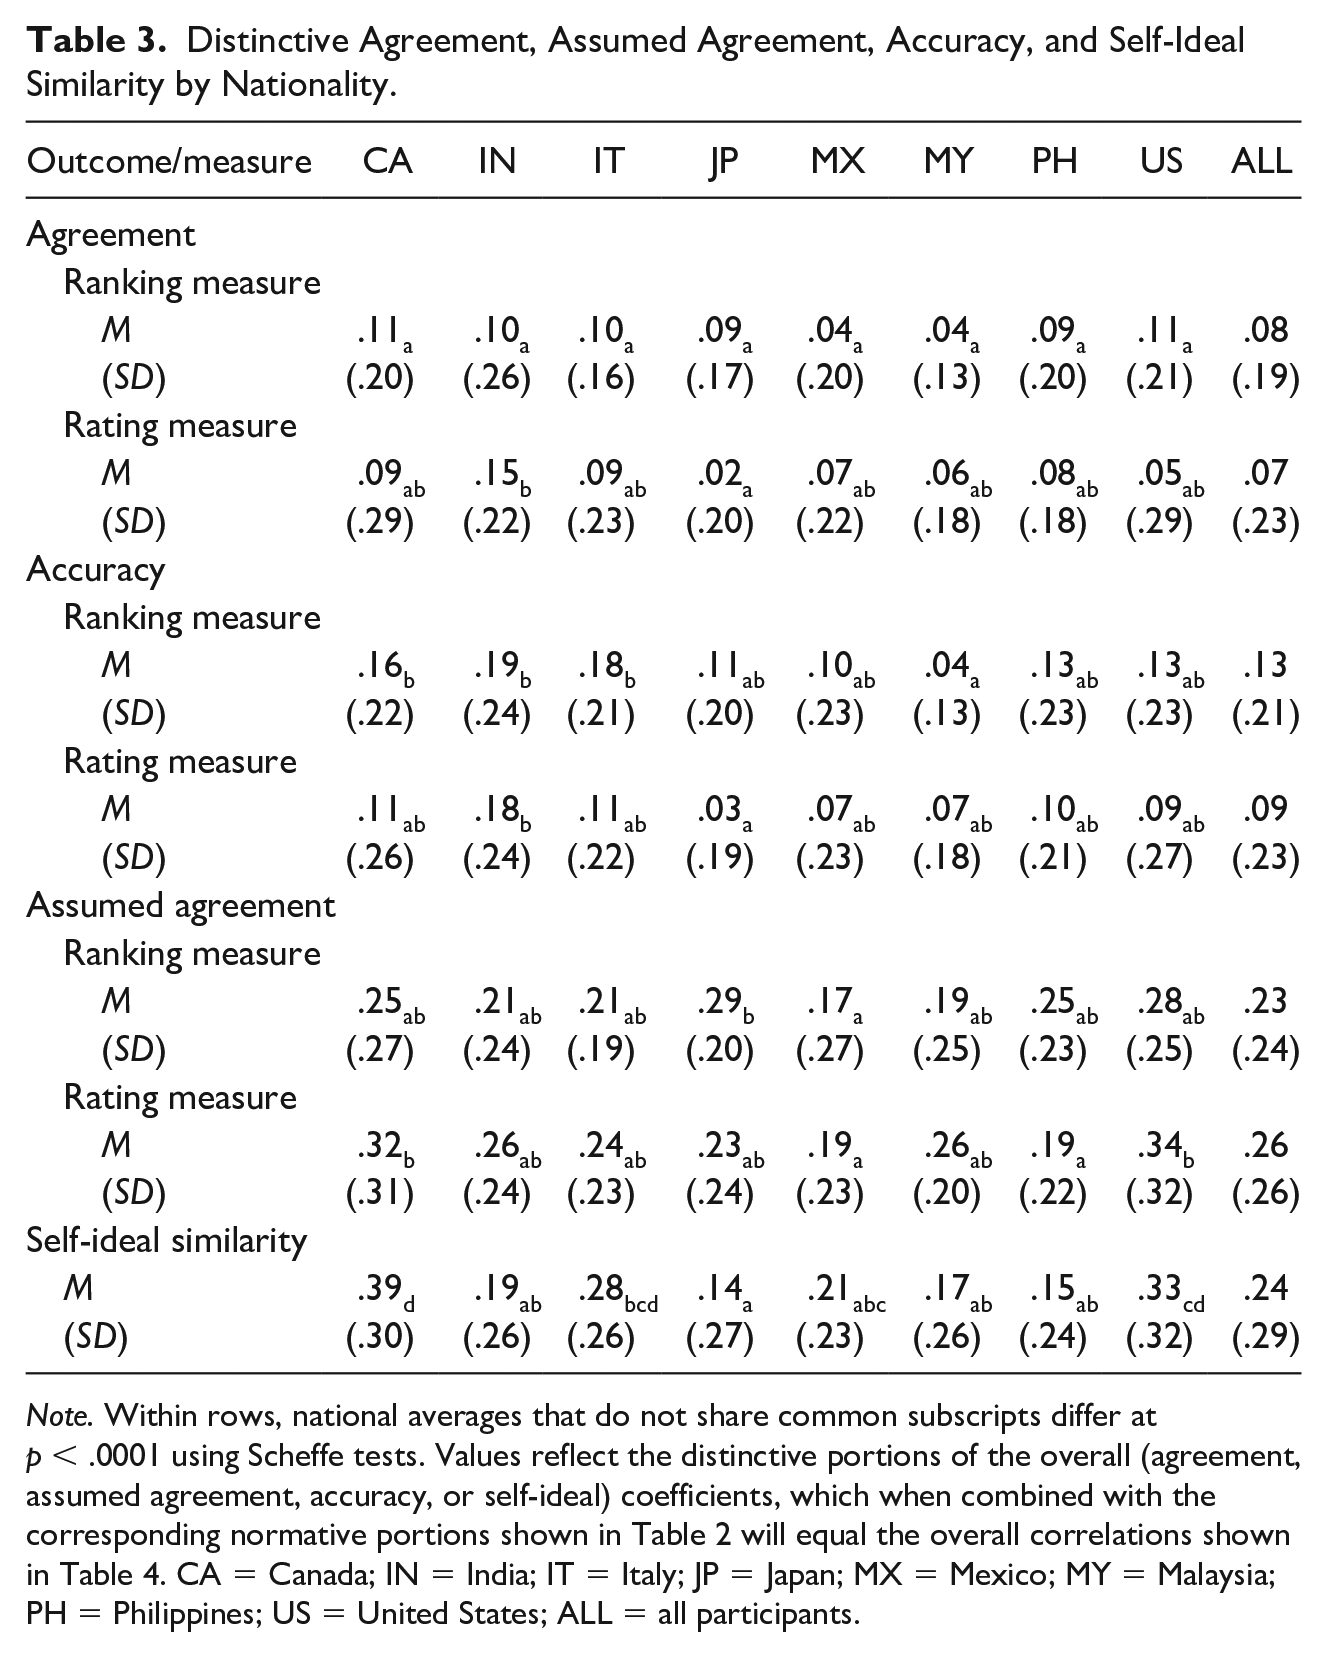
Note. Within rows, national averages that do not share common subscripts differ at p < .0001 using Scheffe tests. Values reflect the distinctive portions of the overall (agreement, assumed agreement, accuracy, or self-ideal) coefficients, which when combined with the corresponding normative portions shown in Table 2 will equal the overall correlations shown in Table 4. CA = Canada; IN = India; IT = Italy; JP = Japan; MX = Mexico; MY = Malaysia; PH = Philippines; US = United States; ALL = all participants.
Overall Agreement, Assumed Agreement, Accuracy, and Self-Ideal Similarity by Nationality.

Note. Within rows, national averages that do not share common subscripts differ at p < .0001 using Scheffe tests. Values are correlation coefficients that could range from −1 to +1. CA = Canada; IN = India; IT = Italy; JP = Japan; MX = Mexico; MY = Malaysia; PH = Philippines; US = United States; ALL = all participants.
Effects of Nationality on Raw and Distinctive Agreement, Assumed Agreement, Accuracy, and Self-Ideal Similarity.
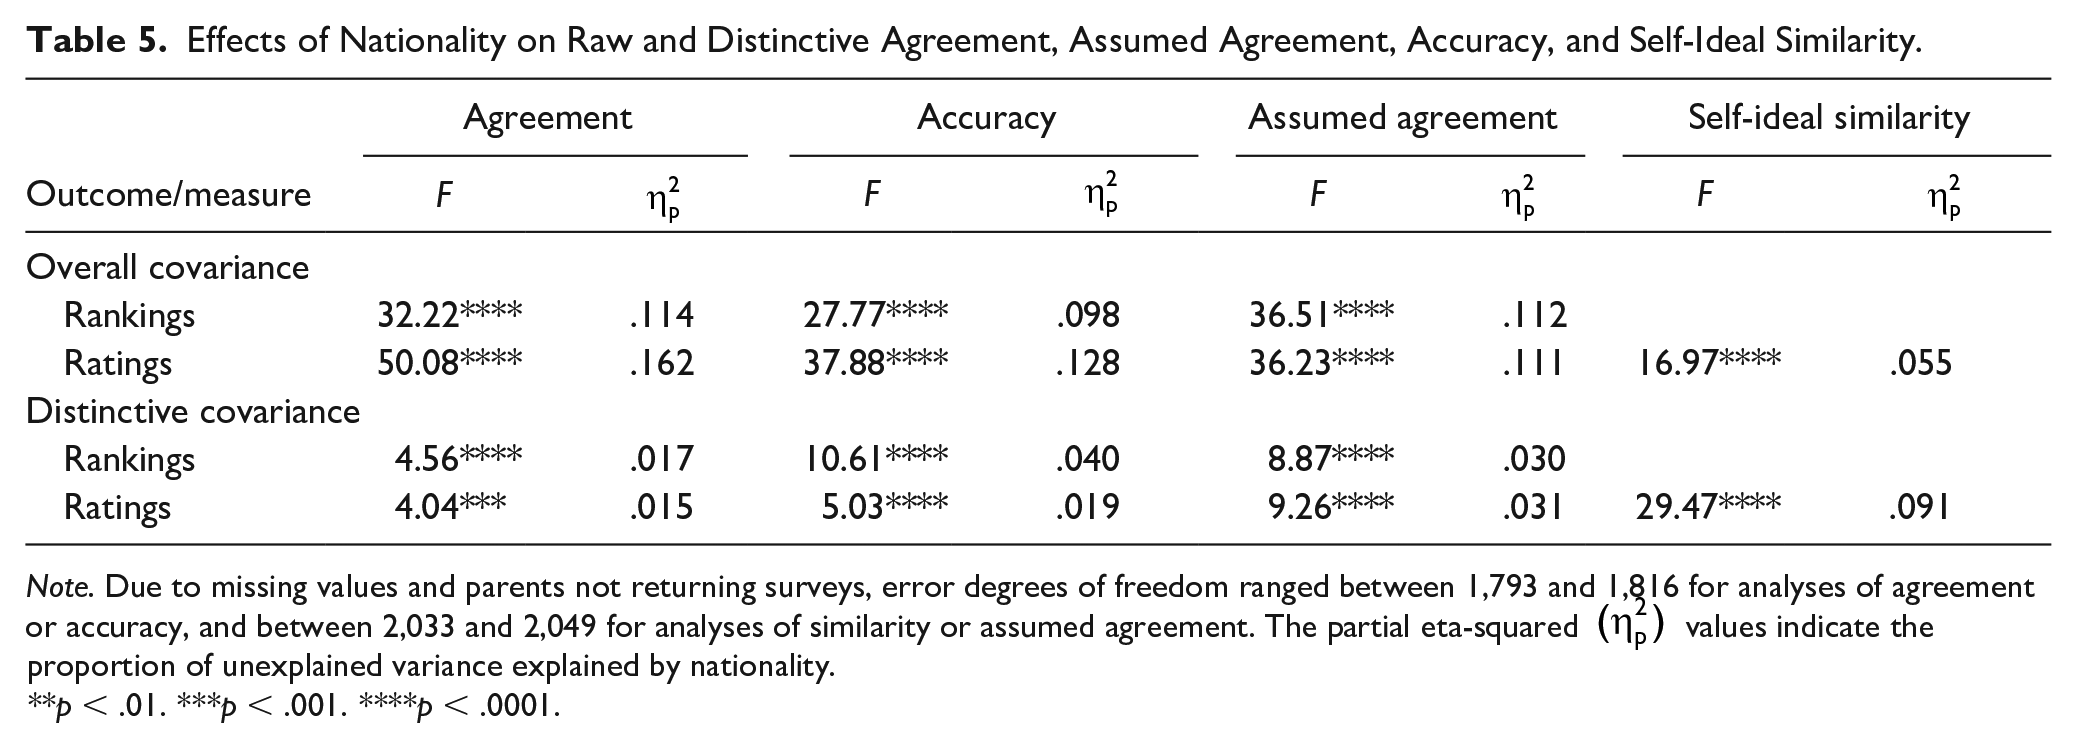
Note. Due to missing values and parents not returning surveys, error degrees of freedom ranged between 1,793 and 1,816 for analyses of agreement or accuracy, and between 2,033 and 2,049 for analyses of similarity or assumed agreement. The partial eta-squared
**p < .01. ***p < .001. ****p < .0001.
Agreement, accuracy, and assumed agreement
Overall agreement was, for ratings, highest in the Philippines and lowest in the United States and Canada, and, for rankings, highest in Malaysia and lowest in Mexico and India. Overall accuracy was, for ratings, highest in the Philippines and lowest in the United States and Canada, and, for rankings, highest in Malaysia and lowest in Mexico. Overall assumed agreement was, for ratings, highest in Malaysia and the Philippines and lowest in the United States and Canada, and, for rankings, highest in Malaysia and lowest in Mexico and India.
Between-country differences in overall agreement, accuracy, and assumed agreement were largely was attributable to between-country differences in normative agreement, accuracy, and assumed agreement; therefore, after subtracting the normative component, between-country differences in distinctive agreement, accuracy, and assumed agreement were small. Nonetheless, there were some significant differences. Distinctive agreement was lower in Japan than India on the rating measure. Distinctive accuracy was lowest in Japan (on the rating measure) and Malaysia (on the ranking measure), and highest in India on both measures. Finally, distinctive assumed agreement was higher in the United States and Canada than Mexico and the Philippines on the rating measure and higher in Japan than Mexico on the ranking measure.
Self-ideal similarity
Normative self-ideal similarity was relatively low in the United States, Canada, and Japan. In contrast, distinctive self-ideal similarity (the inclination to regard one’s distinctive traits as strangely appealing rather than unappealingly strange) was higher in Canada, the United States, and Italy than in the Asian countries and especially Japan. The combination of low normative plus high distinctive self-ideal similarity meant overall self-ideal similarity was not lower in the United States and Canada than elsewhere. In contrast, the combination of low normative plus low distinctive self-ideal similarity meant overall self-ideal similarity was lowest in Japan, and significantly (p < .0001) lower there than anywhere except India and Malaysia. 2
Effects of Individualism
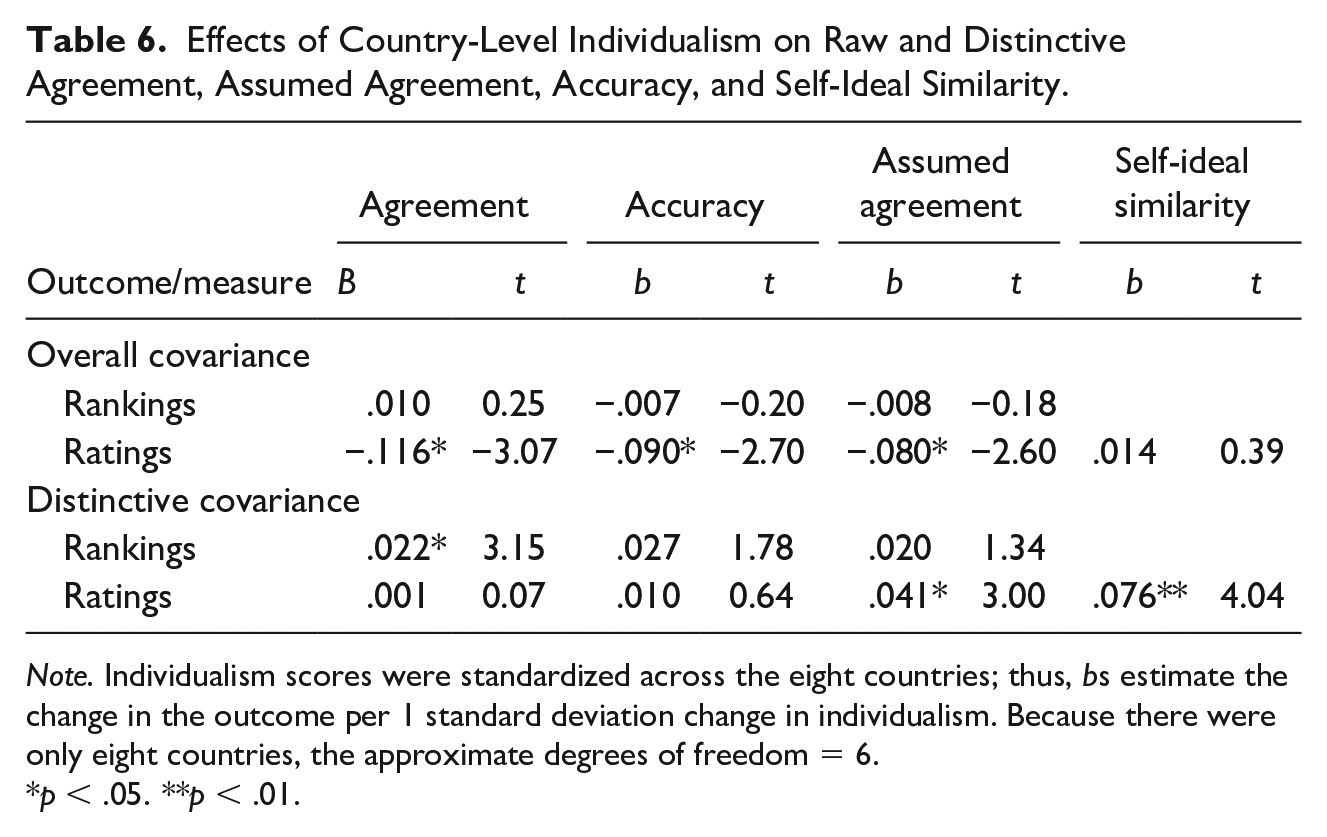
To test if between-nation variance in individualism explained between-nation variance in overall or distinctive congruence, we used multilevel regression (with students nested within countries). For example, if analyzing overall agreement, the model would be: Agreement ij = b00 + b01Individualism j + u0j + rij, where Agreement ij is country j’s student i’s overall agreement level, b00 is overall agreement averaged across all students, Individualism j is country j’s level of individualism, b01 is the effect of country-level individualism (i.e., the effect of interest), and u0j and rij are country- and student-level residuals. Individualism was operationalized using Hofstede’s index, which can range from 0 to 100 (Hofstede et al., 2010). Table 6 shows the results. To facilitate interpreting the results, Figures 2 to 4 plot overall and distinctive agreement, accuracy, assumed agreement, and self-ideal similarity as a function of individualism.
Effects of Country-Level Individualism on Raw and Distinctive Agreement, Assumed Agreement, Accuracy, and Self-Ideal Similarity.
Note. Individualism scores were standardized across the eight countries; thus, bs estimate the change in the outcome per 1 standard deviation change in individualism. Because there were only eight countries, the approximate degrees of freedom = 6.
p < .05. **p < .01.
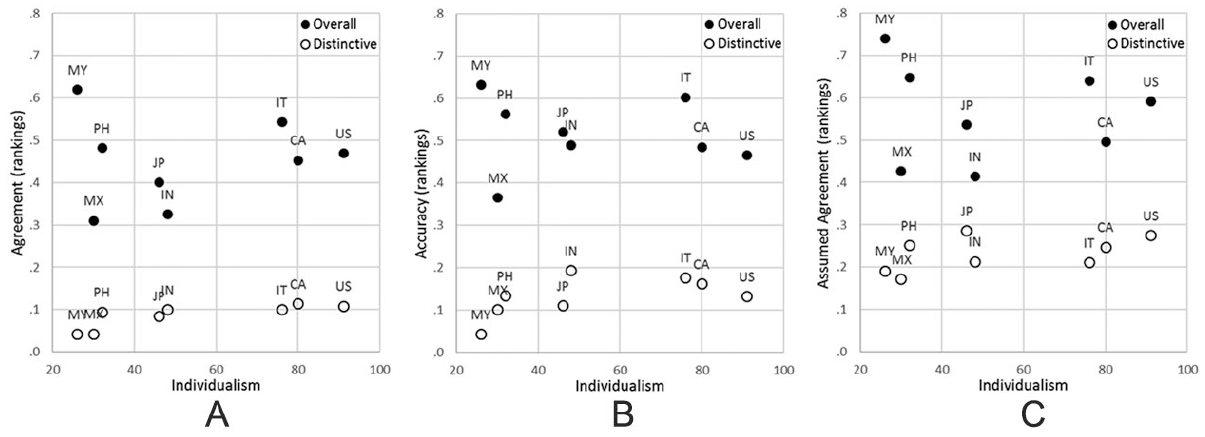
Overall and distinctive agreement (Panel A), accuracy (Panel B), and assumed agreement (Panel C) as a function of individualism for the ranking measure of partner preferences.

Overall and distinctive agreement (Panel A), accuracy (Panel B), and assumed agreement (Panel C) as a function of individualism for the rating measure of partner preferences.
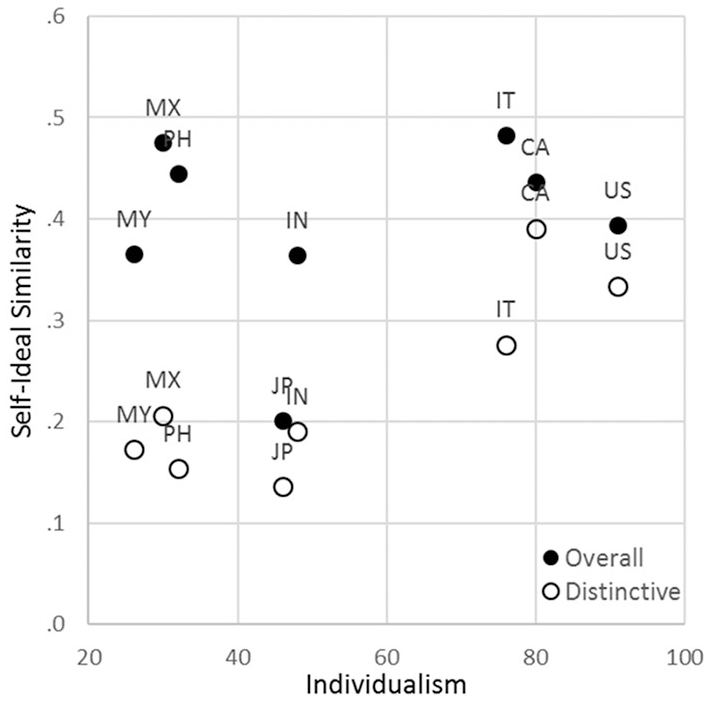
Overall and distinctive self-ideal similarity as a function of individualism.
On the ranking measure (Figure 2), individualism was unrelated to overall agreement, overall or distinctive accuracy, or overall or distinctive assumed agreement. Individualism was positively related to distinctive agreement (mainly due to low distinctive agreement in Malaysia and Mexico), but the absolute differences between countries were small.
On the rating measure (Figure 3), stronger individualism predicted weaker overall agreement, accuracy, and assumed agreement, mainly because the coefficients were lowest in the two most individualistic countries (the United States and Canada) and tended to be highest in the less individualistic Southeast Asian countries. Individualism did not predict less distinctive agreement, accuracy, and assumed agreement; thus, individualism’s negative associations with overall coefficients were attributable to individualism’s negative correlations with normative agreement, accuracy, and assumed agreement (rs = −.79, −.81, and −.83, respectively). Indeed, after removing the normative component of assumed agreement, more individualism predicted more distinctive assumed agreement (because levels were relatively high in the United States and Canada—see Figure 3, Panel C).
Finally, individualism was positively associated with distinctive self-ideal similarity (Figure 4). Because there was an opposing weak negative association between individualism and normative self-ideal similarity (r = −.67), individualism did not predict overall self-ideal similarity.
Discussion
Global Patterns
Averaging across countries, overall self-ideal similarity and parent–child agreement coefficients were moderately positive. Thus, the partner characteristics young adults preferred tended to align with both their own traits and parents’ preferences. The proportion of profile congruence explained by the distinctive component was understandably greater for self-ideal similarity and assumed agreement, which reflect within-person congruence (students’ preferences matching their own beliefs about either themselves or their parents), than for accuracy and agreement, which reflect within-family but between-individual congruence (i.e., students knowing and sharing their parents’ preferences).
One implication is that students’ accuracy regarding their parents’ preferences largely reflects their understanding of a typical parent’s preferences (rather than their understanding of their own parent’s unique preferences). Students may lack distinctive accuracy in part because they tend to overestimate how much their parents share their distinctive preferences, as evidenced by distinctive assumed agreement greatly exceeding distinctive actual agreement. Collectively, these results suggest that youth will sometimes be surprised when their parents disapprove of their preferred partner, and such surprises will occur most often when the partner’s attributes deviate from the attributes that are normatively preferred within their culture.
Nonetheless, the positive (albeit weak) distinctive agreement coefficients indicate that parents and children did share distinctive as well as culturally normative preferences. Research on preferences for broad life values (e.g., benevolence, hedonism) has likewise found that parent–child agreement reflected parents and children sharing both culturally normative patterns and patterns distinctive to their family (Barni et al., 2013).
Finally, it is also noteworthy that students wanted partners whose personalities were distinctively like their own personalities. Because normative personality profiles correspond closely to what the average person considers the most desirable personality profile (Edwards, 1957), this means that people preferred similar partners even when that similarity involved exhibiting various traits to a greater degree or lesser degree than most people would consider optimal.
Cultural Differences
Culture exerted similar effects on accuracy, actual agreement, and assumed agreement (i.e., on youths’ understanding, sharing, and believing that they shared their parents’ preferences). Unexpectedly, though, the two partner preference measures produced somewhat different results. Specifically, when participants rated partner personality traits, normative (and, concomitantly, overall) agreement, assumed agreement, and accuracy were negatively associated with a country’s individualism, mainly because levels were high in Southeast Asia (Philippines and Malaysia) and low in English-speaking North America (the United States and Canada). When participants ranked a more varied set of attributes, normative (and, concomitantly, overall) agreement, assumed agreement, and accuracy were again high in the Philippines and especially Malaysia. However, levels were also relatively high in Italy—which Hofstede et al. (2010) rated high in individualism—perhaps because Italian culture incorporates Mediterranean family-oriented collectivism as well as Western European individualism (Caprara et al., 2011). Conversely, levels were relatively low in Mexico, which Hofstede et al. rated low in individualism (but whose culture reflects a complex mixture of European and indigenous influences). The net result was that individualism was not related to normative (or overall) agreement, assumed agreement, and accuracy on the ranking measure.
After subtracting the normative component, cultural differences in distinctive accuracy and actual/assumed agreement were small. Only two effects of nationality were consistent across preference measures: Indians demonstrated superior distinctive accuracy (knowing parents’ distinctive preferences) and Mexicans showed little distinctive assumed agreement (assuming parents’ distinctive preferences match one’s own). Interestingly, across the eight countries, individualism was positively related to distinctive assumed agreement (students assuming parents shared their distinctive preferences) when rating traits and to distinctive agreement (students and parents actually sharing distinctive preferences) when ranking attributes.
Self-ideal similarity yielded a quite different pattern of cultural differences. Overall self-ideal similarity was unrelated to individualism because levels were moderate (.36 < r < .49) in every country except Japan. However, in Japan, overall self-ideal similarity was unusually low (r = .20) because both normative and distinctive self-ideal similarity were low; in other words, a Japanese student was unusually prone to describe her personality as deviating from the personality that a typical student—and even this student herself—would deem desirable in a partner. This finding may be an instance of a general tendency for Japanese to describe themselves in less socially desirable terms than do people in most other countries (Heine & Hamamura, 2007; Locke et al., 2017).
In six of the countries, between 33% and 66% (M = 50%) of overall self-ideal similarity was distinctive (preferring partners with personalities distinctively like one’s own) rather than normative (preferring partners with a typical, normal personality). In contrast, the percentage of overall self-ideal similarity attributable to distinctive similarity was unusually high in the United States and Canada (85% and 90%). Thus, distinctive self-ideal similarity was stronger among Americans and Canadians than Asians, and across all countries was positively associated with individualism, perhaps because individualistic Westerners were more apt to construe their personal deviations from cultural norms as desirable rather than undesirable.
In sum, there was partial, limited support for the hypothesis that accuracy and actual/assumed agreement would be greater in less individualistic countries: it was confirmed for normative (but not distinctive) agreement and when rating the desirability of personality traits (but not when ranking the importance of other attributes). Thus, the current results support the following—more circumscribed—hypothesis: The less individualistic a society, the more likely it is that members of that society will—across families and generations—share similar beliefs about which personality traits are more desirable in a spouse.
The associations between individualism and distinctive congruence tended to go in the other direction. Specifically, there was some (admittedly fragile) evidence that, compared with youth in less individualistic cultures, youth in more individualistic culture were more apt to share—or assume that they share—their unique parent’s unique preferences. Moreover, in partial support of our initial hypotheses, individualism’s strongest effect was a positive association with distinctive self-ideal similarity—that is, wanting a partner whose personality quirks matches one’s own personality quirks.
Taken together, our results suggest that in relatively collectivistic cultures (that discourage standing out), people may prefer a partner whose personality aligns with consensually shared injunctive norms. Conversely, in relatively individualistic cultures (that encourage standing out), people may prefer a partner who fits their own or their family’s unique identity, thereby highlighting and amplifying how “we” differ from most couples or most families. These conclusions align with Locke et al.’s (2014) finding that members of friendship groups in relatively collectivistic southern China tended to describe each other as having similar personalities, whereas members of friendship groups in the relatively individualistic northwestern United States tended to describe each other as having distinct personalities.
Limitations
The multilevel analyses of nation-level individualism (summarized in the preceding section) should be interpreted with caution as we only compared eight countries and the observed differences between countries were only partly explained by the particular one-dimensional measure of cultural individualism used in the current study. Furthermore, the individualism index we used was based on earlier research in organizational settings and may only imperfectly mirror the levels of cultural individualism characterizing the current sample. Relatedly, although we recruited a large and linguistically, geographically, and culturally diverse sample, many regions of the globe were not sampled, and even within the countries, we studied our participants may not be representative of young adults who do not attend college.
Like most partner preference studies, the current study relied on self-reports, which are vulnerable to response biases. Indeed, there is debate over how well self-reported preferences predict with whom people actually form partnerships (Campbell & Stanton, 2014), though research has shown self-reported partner preferences to be moderately stable and to prospectively predict the characteristics of future partners (Bredow & Hames, 2019; Gerlach et al., 2019). Moreover, our attribute ranking and trait rating measures sometimes yielded different results, which suggests that congruence estimates will partly depend on which partner attributes are assessed or how they are assessed. For example, our rating measure only included traits relatively neutral in desirability; measures including traits that almost everybody considers desirable (e.g., honest) or undesirable (e.g., cruel) may generate higher levels of normative congruence.
Conclusion
The current study analyzed personal, familial, and cultural sources of beliefs about what qualities are preferable in a long-term partner. The study complemented previous studies of partner and in-law preferences (e.g., Apostolou, 2015; Guo et al., 2017; Perilloux et al., 2011) by (a) surveying and comparing multiple countries, (b) broadening the focus from particular preferences to general patterns of preferences, and (c) separating those preference patterns into normative patterns (shared across families and generations) and distinctive patterns (that characterized particular families or individuals).
Youth everywhere wanted partners who aligned with both their own dispositions and their parents’ preferences, and these alignments reflected both preferences unique to specific individuals or families and culturally normative preferences shared across families and generations. Youth demonstrated a reasonably accurate appreciation of which qualities parents typically prefer in their children’s partners, but were overly optimistic about how much their own parents would share their unique preferences for qualities that diverged from culturally normative ideals. In general, culturally normative patterns exerted a stronger influence in the relatively collectivistic Philippines and Malaysia than in the relatively individualistic United States and Canada (with India, Italy, Japan, and Mexico falling in between). Conversely, distinctive preferences for partners who shared one’s personal dispositions were stronger among Western than Asian youth. Thus, a potential partner who does not conform to cultural or parental ideals but who does affirm one’s distinctive personal identity may be more appealing to youth in more individualistic and less collectivistic cultures. We hope that these intriguing findings advance our understanding of the personal, familial, and cultural sources of partner preferences, and that the methodology we introduced to disentangle normative and distinctive patterns can help advance cross-cultural research on other topics as well.
Supplemental Material
LockeEtAl-Supplement – Supplemental material for Culture Moderates the Normative and Distinctive Impact of Parents and Similarity on Young Adults’ Partner Preferences
Supplemental material, LockeEtAl-Supplement for Culture Moderates the Normative and Distinctive Impact of Parents and Similarity on Young Adults’ Partner Preferences by Kenneth D. Locke, Daniela Barni, Hiroaki Morio, Geoff MacDonald, Khairul A. Mastor, José de Jesús Vargas-Flores, Joselina Ibáñez-Reyes, Jose Alberto S. Reyes, Shanmukh Kamble and Fernando A. Ortiz in Cross-Cultural Research
Footnotes
Acknowledgements
We thank Xiu Hui Pook, Kurt Queller, and Azucena Dominguez Urruzola for translation assistance.
Declaration of Conflicting Interests
The author(s) declared no potential conflicts of interest with respect to the research, authorship, and/or publication of this article.
Funding
The author(s) received no financial support for the research, authorship, and/or publication of this article.
Supplemental Material
Supplemental material for this article is available online.
Notes
Author Biographies
References
Supplementary Material
Please find the following supplemental material available below.
For Open Access articles published under a Creative Commons License, all supplemental material carries the same license as the article it is associated with.
For non-Open Access articles published, all supplemental material carries a non-exclusive license, and permission requests for re-use of supplemental material or any part of supplemental material shall be sent directly to the copyright owner as specified in the copyright notice associated with the article.
