




Abstract
The Commitment to Development Index has been developed to assess seven policy areas of rich countries that affect the development of poor countries and to rank the rich countries from this perspective. This article aims to analyze the environmental component of this index. The environmental dimension is a legitimate part of the concept behind the index because preserving global environmental resources is essential for the future development prospects of poorer countries. The operationalization of the dimension, however, gives rise to several issues, such as the combination of policy and practice indicators, data availability and credibility, and other specific aspects that affect the information value of individual indicators and the component as a whole. Acknowledging the difficulty of constructing such a component, we suggest several options for its modification.
Keywords
Rich countries affect the development of poor countries through many policies, including trade, migration, and security. These policies have often been narrowed down to development aid in public discourse and the most frequently presented indicator of policy toward developing countries has thus become the volume of aid. This one-sided view has been broadened by the Commitment to Development Index (CDI) that assesses seven policy areas in which developed countries influence developing ones. One of these areas is the environment, which forms one of the components of the index. By assessing how rich countries exploit global environmental resources and the policies they employ to regulate that exploitation, the environmental component points out the importance of these resources for the development of poor countries.
The CDI fits well into the new post-2015 global agenda. While the Millennium Development Goals end in 2015, a wider agenda integrating the economic, social, and environmental aspects of sustainable development is evolving (see Clémençon, 2012) and will culminate in new Sustainable Development Goals. The CDI and its environmental component complement these political efforts by measuring rich-country policies toward the sustainable development of poor countries.
This article aims to analyze the environmental component of the CDI (E-CDI) and is divided as follows: The following section briefly describes the methodology of the index and the component and provides an overview of the results of the latter. Then, we analyze the nine indicators of the E-CDI, using results from individual countries for demonstration and as supporting evidence. In the discussion part, we review the results, discuss the trade-offs between current indicators and their alternatives, and suggest options for modifications to the E-CDI.
CDI and Its Environmental Component
The CDI is a composite indicator designed to assess policies of developed countries that support and limit the prospects of development in poor countries. The index was developed under the auspices of the U.S. think tank Center for Global Development (CGD), its main architect was David Roodman. This study refers to the methods and results from the year 2013, when the CDI was calculated for 27 countries, members of the Organisation for Economic Co-operation and Development’s (OECD's) Development Assistance Committee (see CGD, 2013a; Roodman, 2013).
The index includes seven components: aid, trade, finance, migration, environment, security, and technology. For example, the aid component assesses the volume of aid provided and several aspects of aid quality, while the migration component evaluates various policies regulating immigration from developing countries. Every component has their own methodology, which are grounded in theory to varying degrees. Thus, some components are, in terms of their theoretical background, stronger than the index as a whole. This is, however, not the case with the E-CDI, which “examines how rich countries are tackling their disproportionate exploitation of the global commons” (CGD, 2013b, p. 5). As there is no unifying theory for a comprehensive assessment of the exploitation of global environmental resources and the relevant policies, the component is made up of individual indicators representing different areas of the environment. In this respect, the selection is arbitrary, but other composite environmental indicators proceed similarly. 1
The values of all the parts of the CDI (i.e., components and their indicators) are normalized linearly to a set of transformed values with an average of 5 in the base year. Countries that are worse than average in a given indicator/component score less than 5 points, while countries that are better than average score more. Although the scores of most of the indicators and components are within an intuitive range from 0 to 10 points, due to the linear course of normalization, countries may break out of this range (including negative values). At the level of the CDI, normalized values of all the components are averaged—each component is thus assigned the same weight. 2
E-CDI Structure.

Source. Roodman (2013).
Note. GHG = greenhouse gas; USD = U.S. dollar; CO2 = carbon dioxide; GDP = gross domestic product; PPP = purchasing power parity; ODS = ozone-depleting substances;
Figure 1 shows the E-CDI results in 2013. Three main conclusions are drawn based on the results. First, four Central European countries—Slovakia, Hungary, Poland, and the Czech Republic—score very high. Their average (7.9) is higher than the 90th percentile of all countries (7.8), and each of the four countries has a higher score than the 75th percentile (7.4).
3
These countries also do not seem to have any weak points because in all nine E-CDI indicators they score on average higher than the average of all 27 CDI countries. Second, the 19 European Union (EU) countries have significantly better results than the remaining eight countries outside the EU (average 7.2 vs. 4.2). Only one of the 19 EU countries (Luxembourg) is below the 25th percentile (5.8), while six of the eight non-EU countries are below that percentile. Third, the results from the EU countries do not significantly vary (all score within a range of 2.8 points). The question arises as to what extent are these results a credible reflection of reality.
E-CDI country scores (2013).
Analysis of the E-CDI
This analysis focuses on the composition of the E-CDI and covers three areas and nine indicators. Each area is briefly described, followed by an analysis of the individual indicator as for their relevance and limitations. The analysis is supported by results from various countries, in particular the four Central European countries—the Czech Republic, Slovakia, Poland, and Hungary—the so-called Visegrad countries or the Visegrad Four (V4). This is a group of similar countries that rank very highly in the E-CDI but not in the overall index. Neither are they generally considered as countries with progressive environmental policies. Thus, this selection was driven by unexpected findings in the E-CDI scores. Though we consistently show the results from the V4 in tables, we use results from other countries where appropriate in the text. The ultimate aim is not to analyze countries’ policies per se—the results are only the means to an end, that is, analysis of the E-CDI.
Global Climate
Global problems associated with the atmosphere can be divided into two areas—climate change and ozone depletion. Climate change is considered one of the most important global challenges (see, e.g., Glenn, Gordon, & Florescu, 2014; Intergovernmental Panel on Climate Change [IPCC], 2014). The impact of climate change on the global socioeconomic system is likely to be uneven. Developing countries will be affected more, primarily because they are more exposed to climate change (geographic location and economic structure) and have less capacity to adapt to the change (World Bank, 2010). At the same time, developed countries have contributed disproportionately to the increase in the total concentration of greenhouse gases (GHGs), both in absolute and per capita terms. While economic analyses do not provide a consensus on how immediate and stringent GHG abatement should be given a high degree of uncertainty and arbitrary inputs into models (see, e.g., Pindyck, 2013), it is generally accepted that developed countries should take the lead in emission reductions.
In comparison to climate change, the depletion of the stratospheric ozone layer is no longer considered a long-term threat, thanks to the success of the Montreal Protocol and its amendments that have phased out ozone-depleting substances.
A. GHG emissions plus carbon equivalent of fossil fuel production per capita
Indicators of Greenhouse Gas Emissions.
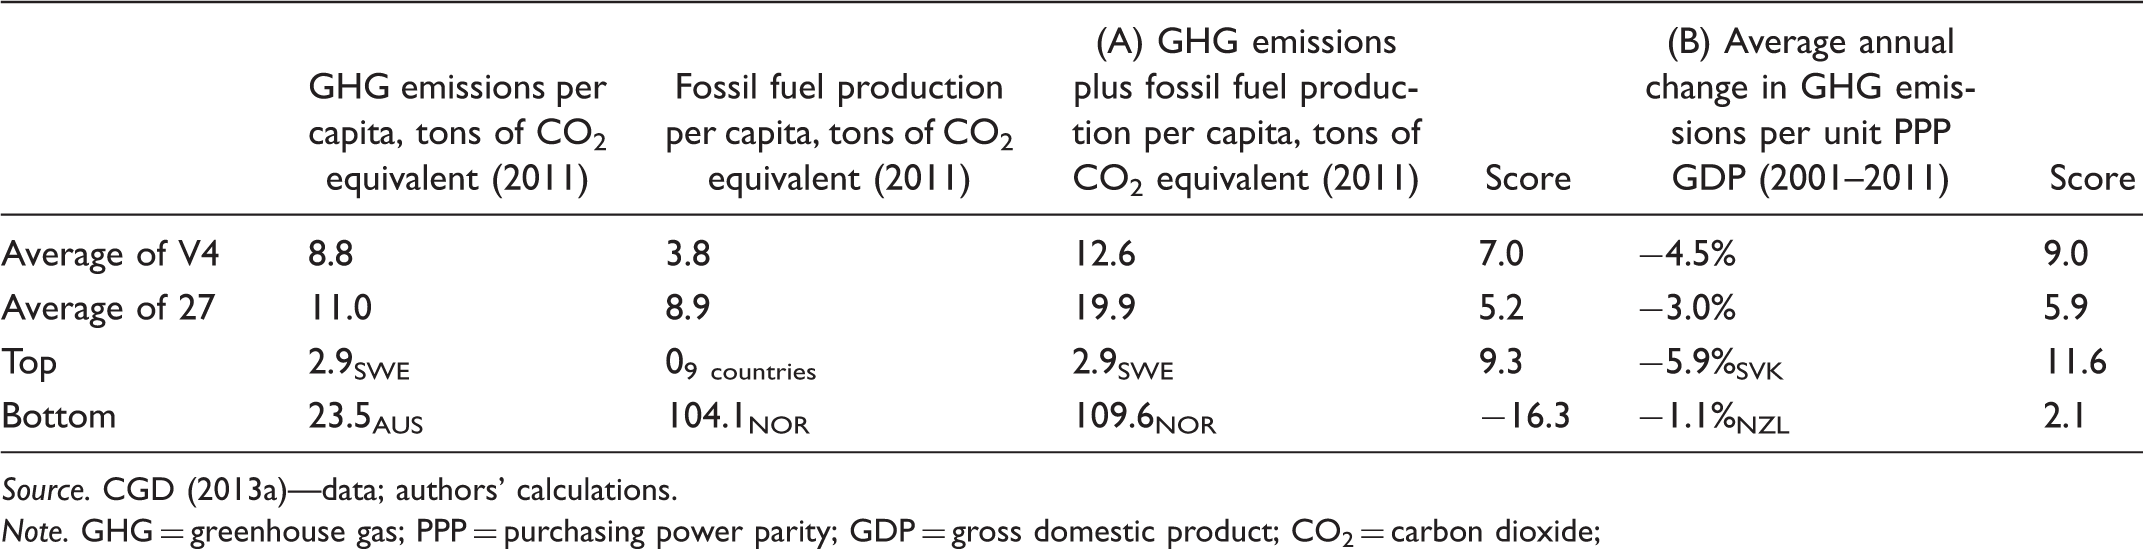
Source. CGD (2013a)—data; authors’ calculations.
Note. GHG = greenhouse gas; PPP = purchasing power parity; GDP = gross domestic product; CO2 = carbon dioxide;
The other issue relates to the responsibility for emissions. If Country A extracts oil and exports it to Country B, which burns it in the manufacture of products that it exports to Country C, who should be responsible for the emissions? The E-CDI attributes the emissions to Countries A and B as “producer and consumer are coresponsible for emissions from fossil fuel burning” (Roodman, 2013, p. 45). In the quotation “producer” should be interpreted as a country extracting oil (primary producer) and “consumer” as a country consuming the imported oil used in production for export (secondary producer). This explains why Norway has the highest emissions in the E-CDI. As Norway extracts large quantities of oil and natural gas, which it then exports, the CDI burdens Norway with responsibility for future emissions from burned oil and gas. While the E-CDI holds Countries A and B responsible, national inventories of GHGs under the Kyoto Protocol (from which the E-CDI collects data for the first part of the indicator) are based on manufacturing emissions, of Country B in this case. But then, does the final consumer bear no responsibility for all the emissions that have been produced? It is clear that all three countries somehow benefit from the exchange; it is less obvious how to fairly divide responsibility between the individual links of the production–consumption chain (for suggestions see, e.g., Bastianoni, Pulselli, & Tiezzi, 2004; Lenzen, Murray, Sack, & Wiedmann, 2007). Whatever the particular methodology, the responsibility of the final consumers should not be ignored.
B. Average annual change in GHG emissions per unit purchasing power parity gross domestic product in the last 10 years
The second indicator provides a complementary approach to the indicator of per capita emissions. It differs in two important ways from the previous indicator—the conversion is per unit of economic activity (rather than per capita) and the indicator measures change in emissions over time (rather than their level in 1 year). The correct interpretation can be demonstrated using the example of two neighboring countries—the Czech Republic and Austria. From 2001 to 2011, the Czech Republic reduced its emissions per gross domestic product (GDP) unit almost 4 times faster than Austria (−4.2% vs. −1.1%), but its emission intensity at the end of the period was double compared with Austria (0.50 vs. 0.26 kg CO2 equivalent per purchasing power parity [PPP] U.S. dollar [USD] of GDP). Although the Czech Republic scores significantly higher than Austria in this indicator (8.3 vs. 2.3 points), the emission intensity in the Czech Republic is not only higher than in Austria but the second highest among all European countries included in the CDI. While all four Visegrad countries have decreased their emission intensities significantly faster than the average, only the Czech Republic and Poland show markedly higher emission intensities.
C. Gasoline taxes
Gasoline Taxes, Ratification of the Kyoto Protocol, and Consumption of Ozone-Depleting Substances.
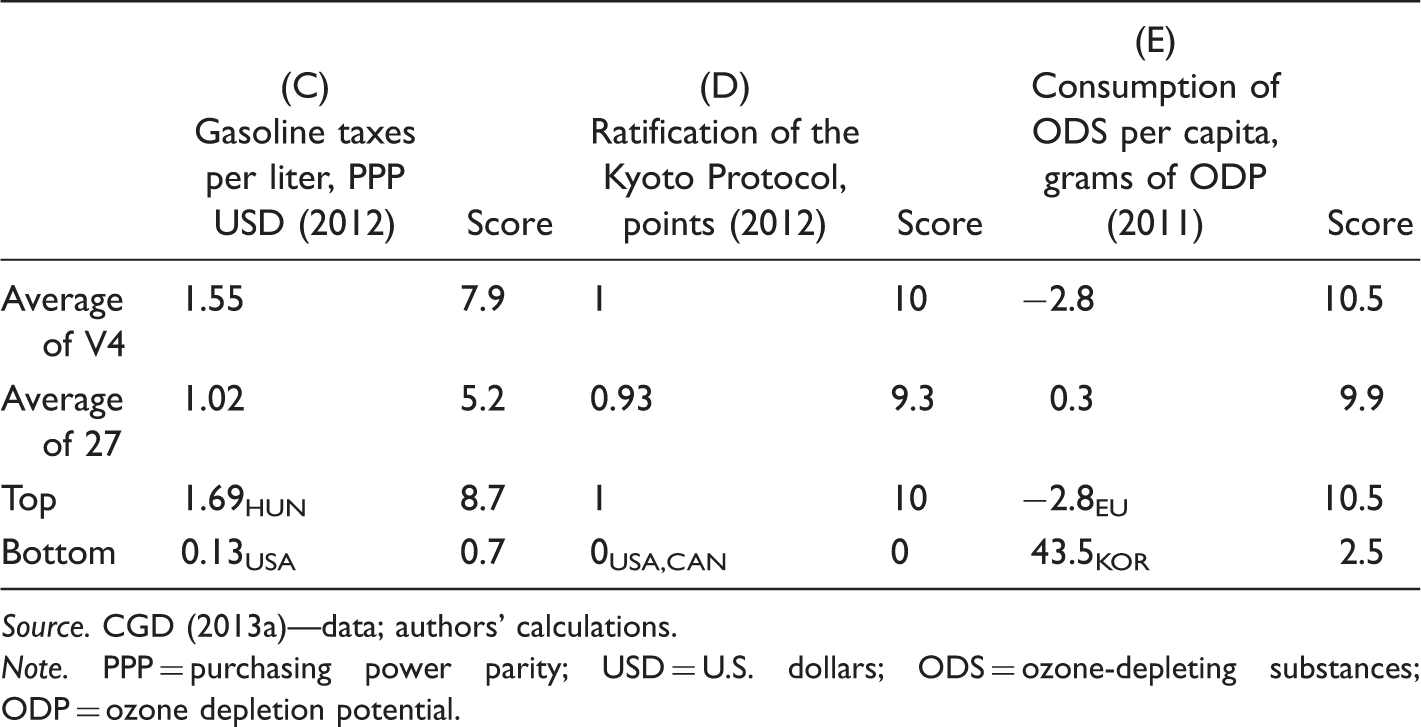
Source. CGD (2013a)—data; authors’ calculations.
Note. PPP = purchasing power parity; USD = U.S. dollars; ODS = ozone-depleting substances; ODP = ozone depletion potential.
To illustrate this issue, we analyze gasoline taxes in Norway and Hungary. While Hungary has a higher tax in PPP than Norway (1.63 PPP USD per liter vs. 0.93), Norway has a higher tax using exchange rates (1.47 USD vs. 0.95). 6 The question arises as to whether Hungary has the highest gasoline tax (and price), which is more than 60% higher than the average of the 27 CDI countries (0.99 PPP USD per liter), as shown by the PPP, or whether the tax (and price) of gasoline is only slightly lower than the average (1.00 USD per liter), as exchange rates indicate.
The conversion through PPP seems appropriate for measuring the significance of the tax in discouraging the purchase of gasoline by domestic citizens. The other advantage of PPP is that it facilitates intertemporal comparisons because it is insensitive to exchange rate movements that would otherwise cause changes in measured performance without any changes in policy. However, relatively less developed countries (such as the Visegrad countries) show higher gasoline taxes in PPP and this systematic pattern seems to owe more to their lower price level and market conditions than their environmental policy. 7 High differences in market prices, especially in EU markets, are difficult to sustain in reality (due to the illegal transportation of untaxed gasoline), so it might not be a realistic option for Austria to increase its tax in terms of PPP by more than 80% to reach the level of Hungary. Also, the higher nominal tax in Austria burdens its manufacturers in absolute terms more than the lower nominal tax does in Hungary, making them less competitive in terms of internationally traded goods.
D. Ratification of the Kyoto Protocol
This is a policy indicator showing whether the country has ratified the Kyoto Protocol. The protocol sets individual commitments for developed countries in the form of the reduction of GHG emissions from the reference year 1990 for the period from 2008 to 2012. Instead of normalizing the countries’ results to a fixed average (5) in the base year, the CDI methodology assigns 0 to nonratifying countries and 10 points to ratifying countries. This approach diverts from the standard normalization method (a disadvantage in itself), and by doing so, it deprives the component as well as the index of the 5-point average in the base year.
The ratification of the Kyoto Protocol fits into the portfolio of climate indicators, as it is the only indicator that monitors climate policies exclusively. While all ratification indicators are binary and so do not have a gradual discrimination scale, the commitments of the Kyoto Protocol vary from a reduction of 8% to a maximum increase of 10% for Iceland and 8% for Australia. The indicator does not reflect the differences in countries’ commitments or the degree of their fulfillment. Some countries score 10 points in this indicator, although such a score does not reflect their political efforts to control emissions. Australia secured a generous target having the highest GHG emissions per capita of all 27 CDI countries, Canada withdrew from the protocol in 2012 just before the end of the first commitment period (to meet its target it would have had to purchase a large amount of emission credits from other countries), and South Korea never had an emission reduction commitment. 8
E. Consumption of ozone-depleting substances per capita
This indicator measures the consumption of ozone-depleting substances (per capita), converting substances to the same scale according to their ozone depletion potential. Unlike the first two climate change indicators, this indicator relates to consumption, as the production of these substances is banned in developed countries (except South Korea). The EU presents the data as a whole, and so these countries are given an identical value for their average consumption per capita. Also, as the EU data are aggregated for its current number of countries, the average consumption of 19 relevant CDI countries is calculated as the average of all the 27 EU member states.
The selection of substances to be included has not been systematic. Of the nine groups of substances registered by the Ozone Secretariat of the United Nations Environment Programme (UNEP), the first CDI methodology aggregated six, which was later revised to include all nine; it then became three, and it is currently eight substances. 9 While the selection of substances in various editions may not be clear, Roodman (2013) explains that only certain groups of substances are included because the consumption of other substances in developed countries is often negative, as these countries export their existing stocks (UNEP defines consumption as domestic production minus exports plus imports), which distorts the results. However, in recent years, the EU and some other countries show negative total consumption even with the 2013 methodology, which places all EU countries above the intuitive maximum value (10) and 26 countries within a narrow range of 9.0 to 10.5 points. Consumption and production of ozone-depleting substances in most developed countries have dropped from high volumes in the late 1980s to practically zero today, and so the indicator has lower relevance. The average consumption is so low that the authors decided to standardize the indicator to a year with high average consumption (2003 rather than 2012 as for other indicators) in order to suppress the extremely negative score for South Korea by more than two orders of magnitude, from −237 to 2.5.
Fisheries
Fishing is a significant source of food, export earnings, and employment in developing countries. The problem of overexploitation of open-access resources was already demonstrated in regard to fisheries by Gordon (1954). Yet, the state of marine life has deteriorated due to the increasing demand for fish, advances in fishing technology, and inadequate or inefficient regulation. From 1974 to 2011, the share of stocks fished at biologically unsustainable levels rose from 10% to 29%, with a peak of almost 33% in 2008 (Food and Agriculture Organization [FAO], 2014).
Developed countries support fishermen through subsidies. The subsidies increase the fishermen’s efforts which lead to the depletion of fish stocks and distort competition in favor of fishermen from developed countries (Milazzo, 1998). This has a negative impact on food security and export opportunities for fishermen in developing countries. Directing fisheries toward sustainability necessitates a reduction in fishing capacity which requires a reduction in subsidies and the establishment of global regulation (Barkin & DeSombre, 2013). Although countries contribute to the exploitation of marine resources through national policies (subsidies), they are more willing to cooperate to protect resources at an international level to limit free riding. Global management is needed most for straddling and highly migratory fish, such as cod and tuna, that can be fished in international waters and tend to be more overfished.
F. Fishing subsidies per capita
Indicators for Fisheries.
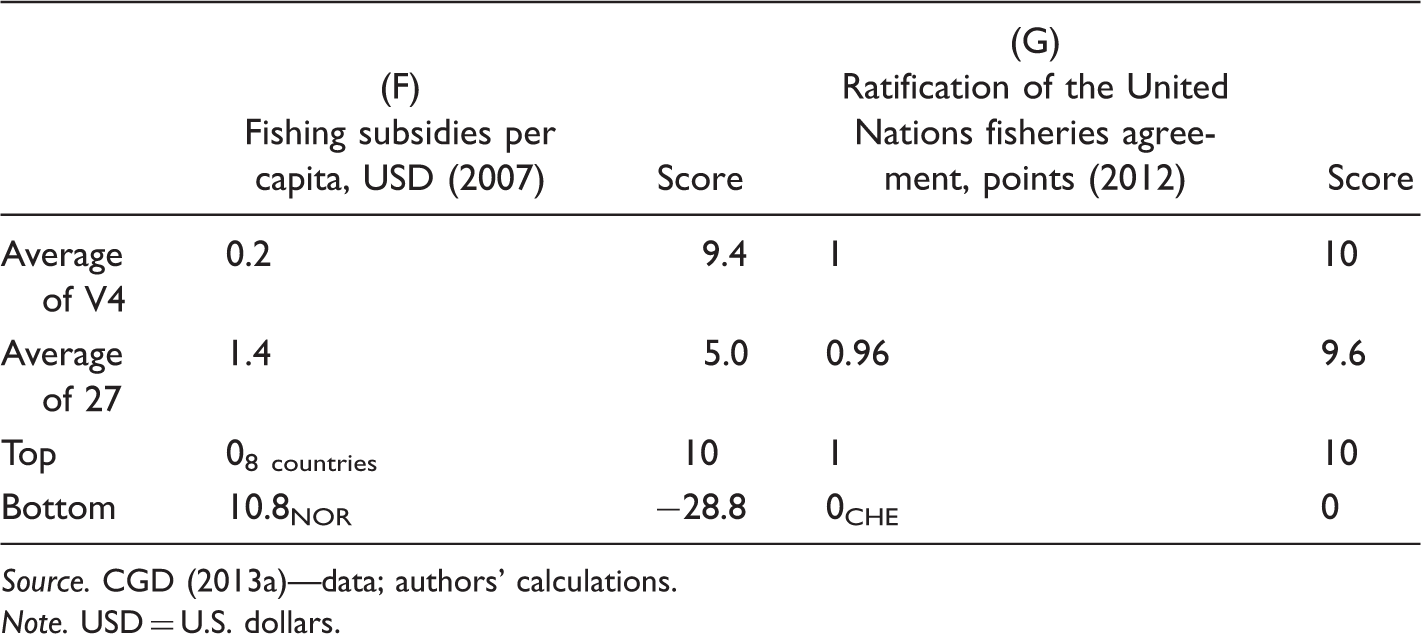
Source. CGD (2013a)—data; authors’ calculations.
Note. USD = U.S. dollars.
Of the V4, only Poland and the Czech Republic provide fishing subsidies, albeit in a relatively small volume (the Czech Republic’s production is based on fishpond farming, which is irrelevant in the context of this indicator). Generally, being landlocked provides countries with an advantage because it does not give them a realistic opportunity to provide subsidies. Zero marine fishing subsidies are then a result of their landlocked status rather than of their environmental policy.
G. Ratification of the UN Agreement on the Implementation of the Provisions of the UN Convention on the Law of the Sea Relating to the Conservation and Management of Straddling Fish Stocks and Highly Migratory Fish Stocks
Adopted in 1995 and effective since 2001, the agreement is based on a precautionary principle, obliging countries to take measures toward securing the sustainability of these fish stocks through regional cooperation. As the agreement has only not been ratified by landlocked Switzerland (other landlocked countries ratified the Agreement within the EU common fisheries policy), it has little value. The irrelevance of this indicator for landlocked countries is even stronger than in the case of fishing subsidies. While Switzerland’s zero fishing subsidies are not attributable to its policy, one can still argue that Switzerland does not contribute to overfishing through subsidies compared with countries that provide them. However, the nonratification of the agreement by a country that does not catch marine fish is hardly a negative policy. As long as the indicator is unable to distinguish between fishing countries, it ceases to be relevant (there is some value in the time perspective, but given that over the last few years all fishing countries have been parties to the Agreement, this value is low). As with the Kyoto Protocol, nonstandard normalization leads to an average value higher than 5.
Biodiversity and Global Ecosystems
This area consists of two indicators related to biodiversity and tropical rain forests. Ecosystem services and biodiversity have a high economic value for humankind (see, e.g., Costanza et al., 2014; Helm & Hepburn, 2014). People make use of biodiversity, for example, through the development of crops, pharmaceutical products, industrial materials, biotechnology, and natural “models” for the development of synthetic products (see Myers, 1997). The estimated rate at which species are dying out is a hundred to a thousand times faster than the rate of extinction over the last half billion years (May, 2010). Countries contribute to biodiversity conservation through measures agreed in international treaties.
Forests contribute substantially to several ecosystem services (e.g., they are a source of timber and absorb carbon) and play a crucial role in biodiversity. This is especially true for tropical rain forests that are estimated to be home to about half of all species (Dirzo & Raven, 2003). The demand in developed countries for wood from tropical rain forests is one of the driving forces behind deforestation.
H. Reporting to multilateral treaties relating to biodiversity
Indicators for Biodiversity and Global Ecosystems.
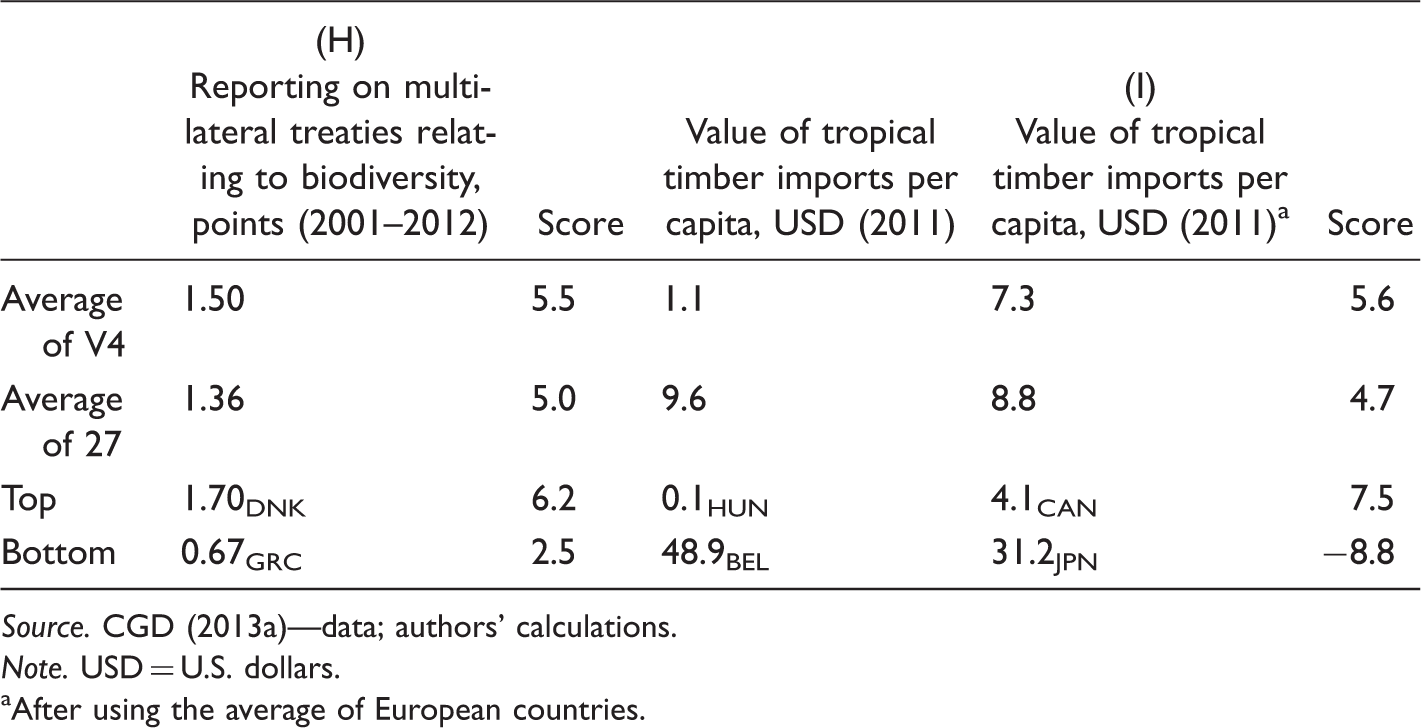
Source. CGD (2013a)—data; authors’ calculations.
Note. USD = U.S. dollars.
After using the average of European countries.
I. Value of tropical timber imports per capita
This indicator focuses on the import of tropical timber (and the finished products) from developing countries. As it is difficult to convert imports into physical units, they are measured in their USD value (per capita). The problem of the indicator is that all European countries show identical imports per capita, calculated as an average of the total European imports. Roodman (2013) justifies this approach by the fact that some small European countries report very high imports per capita, which is probably due to the fact that they are a port of entry for the entire continent. Given that there are 21 European countries in the CDI, over three quarters receive an identical score (here, countries with a lower economic level tend to be negatively affected). Until we are able to identify the actual imports by country, the lack of discrimination between countries significantly limits the value of this indicator.
Discussion
The preceding analysis has shown that most of the E-CDI indicators have certain limitations. By pinpointing the critical aspects of the individual indicators, we have shown that the E-CDI scores cannot be taken at face value. In this section, we review the results and then present several options for the E-CDI modification. We build on the preceding analysis but rather than showing only the problems of the indicators, we demonstrate trade-offs between them and their alternatives. In the final part of this section, we address the normalization of indicators and we also provide some recommendations.
When interpreting the E-CDI scores, we have noted the good scores of the EU countries, particularly of the Visegrad countries. Having analyzed the E-CDI methodology, we can provide an additional insight into the results. The good and low-variable scores of EU countries are partly a reflection of the coordinated environmental policies of this group (their low variation is also a product of the average of two indicators). While the EU is often considered as having progressive environmental policies, both domestically and on the international level, the Visegrad countries are not perceived as leaders within the group. Analyzing the results of the V4, we see that their superior position is partly misleading and mainly based on the influence of three indicators. Two are biased toward landlocked countries (fishing subsidies) and those with low price levels (gasoline taxes). The third indicator is the change in GHG emissions per unit of GDP, where the difference in scores compared with other EU countries is highest. While the faster decrease in emission intensity is a real achievement of the Visegrad countries, it is a product of both environmental policy and economic restructuring since the start of their economic and political transformations. This leads to the obvious question of whether the E-CDI does not adequately capture the performance of a specific group of countries, while at the same time accurately reflecting performance of other countries. Our results do not support a definitive answer. While some aspects of the methodology contribute to the superior position of the Visegrad countries, many other methodological issues are not related specifically to these countries.
There is a more general point related to the operationalization of the E-CDI. Although the primary goal of the CDI is to assess policies, in some cases the policies are hard to measure, while in others the declared policy might not match the actual efforts of the country’s government or can be completely outweighed by real practices. Developed countries affect the developing ones environmentally, not through policies (as is the case with, for example, development aid) but through the use of global environmental resources. Furthermore, the E-CDI is specific, as it is the only component of the CDI to be based on negative externalities of a global nature. GHG emissions are a cost that developed countries burden developing countries with. While the political measures designed to decrease this externality (policies) are positive, the absolute extent of this externality (practices) cannot be ignored. That is why we accept the methodologically impure combination of these two types of indicators.
Reading our analysis of the E-CDI out of context, some readers may easily get a sense that the component is so problematic that the CDI might be improved by eliminating it. But no social indicator is perfect, and for the component to be purposefully excluded from the index, it must be shown to be of low relevance to the index or not to be amenable to operationalization. There is plenty of evidence that global environmental resources play an essential role in the process of development. 12 While we acknowledge that the component is inherently difficult to operationalize, there may be certain scope for improvement.
The rest of this section will discuss options for E-CDI improvement. The suggestions can open discussions about possible modifications by other researchers or authors of the index. It is necessary to bear in mind, though, that the E-CDI is not an independent indicator; rather, it is part of an even more aggregate index. Any major changes need to be incorporated after an analysis of all the other components and in line with the philosophy of the overall index.
Global Climate
Climate change is represented by four indicators with a 50% weight in the E-CDI. Such a high weighting given to one environmental issue may lead to questions about the overall balance of weighting of environmental issues. However, reading the current evidence on climate change and its projected impacts, the weight does not seem overvalued. The character of the second indicator (rate of change) implicitly values high emission intensity (and also therefore poor environmental policies) in the past. If a country has high emissions and its policies do little to reduce them considerably, focusing more on the level of emissions (practice) rather than on a rate of change (proxy for policy) is justified. Taking all four climate change indicators in perspective, it seems to us that the current weights disproportionately favor policies as opposed to real practices (40% vs. 10%). Therefore, for the second indicator, we suggest using a level indicator—emissions per unit of GDP. Alternatively, a more innovative solution would be to measure the projected level of emissions in about 10 years, using the average rate of change from the last 10-year period (which could be applied to both indicators). 13 Such an indicator would measure current dynamics based on current emissions, and if the year selected is not too far in the future (e.g., not more than 15 years), the rate of change would not dominate the indicator.
We praise the E-CDI for going against the tide when assessing responsibility beyond the producer emissions, though we believe that it is more important to include consumer emissions rather than fossil fuel producer emissions. Territorial emissions are internationally standardized and reported on, while consumption-based emissions are derived from territorial emissions by subtracting emissions caused by the production of exported goods and adding emissions caused by the production of imported goods. Methodologies to calculate consumption-based emissions have been developed recently (see e.g., Davis & Caldeira, 2010; Hertwich & Peters, 2009); however, only the most recent data can be called comprehensive in that they are extended into an annual time series and include the majority of world countries. The global carbon budget 2014 (Global Carbon Project, 2014) calculated and approximated consumption-based CO2 emissions from fossil fuel combustion and cement production for 134 countries in the 1990–2012 period. While still less comprehensive than territorial emissions (usually only for CO2 and less accurate), we believe the current state of the data is credible enough to be used for this purpose.
Instead of a sophisticated method of responsibility allocation, we recommend that a first indicator (per capita) gives full responsibility to a consuming country, while the second (per unit of GDP) is fully ascribed to a manufacturing country. It seems logical for consumption emissions to be related to people, while production emissions relate to economic activity. The first indicator should have at least the same weight as the second. We are not sure how to handle the responsibility of the primary producer; should it be included within the two indicators, we suggest that the emissions of two producers are combined in the second indicator.
As for the LULUCF sector, there are good arguments for both inclusion and exclusion. Land-use changes may lead to lower GHG concentrations but may also disguise the real climate change pressure in developed countries (i.e., emissions) that these measures can offset only in the short term. On the whole, we accept the inclusion of the sector in the first indicator; however, as we understand the second indicator as a measure of the emission intensity of economic activity, we see little relevance in its inclusion here.
The gasoline tax indicator leads to a systematic pattern of higher PPP taxes in countries with lower income, which we do not find to be a credible measure of environmental policy. Also, the indicator only measures taxation of gasoline, while ideally it should include other fuel taxes (Lehmann, Davis, Eberle, Pearson, & Velten, 2014), or more generally all GHG sources. While we do not have such a complex indicator, the recent OECD report (2013) provides an indicator of average effective tax rate on CO2 from energy use for OECD countries. Though this only includes CO2 from energy, it is relatively comprehensive. The indicator is calculated for 1 year and expressed in euros per ton CO2 (i.e., exchange rates rather than PPPs are used). This indicator is a better alternative if updated regularly. Currently, as there are data for only 1 year, there is a trade-off between time perspective and comprehensiveness. If the former is valued highly, the percentage of taxes on the price of gasoline is more intuitive than both alternatives (it correlates highly with taxes at exchange rates). We do not propose measuring other types of domestic policies that affect climate change (e.g., energy efficiency standards) as they are hard to compare (see The Economist, 2014).
While the ratification of the Kyoto Protocol may not be reflected in real domestic climate policy, it can be argued that being a party to the Kyoto Protocol is a climate policy in itself because of participation in global environmental politics. We examined the idea of evaluating countries’ commitments (emission control targets and their fulfillment) in order to increase the discriminatory power of the indicator, but these approaches are either not feasible or lead to strange results (e.g., measuring fulfillment would disadvantage countries willingly accepting higher targets). We recommend using a consistent method of normalization.
The ozone depletion indicator has limited relevance today, but it may be retained for pointing out the high consumption of one country and for measuring performance over time. Averaging EU consumption decreases the discriminatory power among EU countries, but if the EU reports on data as a single entity, ascribing each member country an average value properly reflects this.
Fisheries
The UN fisheries agreement does not discriminate between marine fishing countries and the E-CDI would be better off without the indicator. The indicator of fishing subsidies is compromised by less credible data, yet we recommend retaining it in the E-CDI as it still has some value and it is advisable to have at least one indicator for fisheries. Lehmann et al. (2014) argue that there are significant differences between countries when their subsidies are counted in total versus per capita, and they suggest examining this issue. Although we understand that real impact is derived from total subsidies, we are not convinced that total values are appropriate for any E-CDI indicator. The authors also propose the inclusion of marine transport fuel exemptions in the indicator. These implicit subsidies to fisheries were recently reviewed by the OECD (see Martini, 2012), but due to lower quality and availability of data (e.g., data available for only 2008), the inclusion of such subsidies is problematic at this point. As the data improve (the OECD is now working on calculating fuel tax concessions in a systematic way), these subsidies may be included. 14
The indicator has low relevance for a few landlocked countries. One possibility is not to include the indicator in the E-CDI score of countries without a marine fishing fleet (which is equivalent to the imputation of the average weighted score of remaining indicators for a given country). Yet, it may be argued that the irrelevance of this indicator for landlocked countries is relative—their nonpolicy does not contribute to overfishing. Both approaches are legitimate, but we would not recommend the imputation before an analysis of the other components confirms that a clear line can be drawn between relevant and irrelevant indicators for some countries.
An alternative to this indicator is to measure the consumption or import of fish (per capita), and this raises questions of responsibility as with GHG emissions. 15 Although we see the point in measuring consumption as a driving force of fish stock depletion, designing the indicator opens an array of questions (e.g., what types of fish, import or consumption, imports from which countries, etc.). While fishing subsidies is a policy with a clear negative effect on fish stocks and developing countries, the imports of renewable resources from developing countries are harder to judge.
Biodiversity, Global Ecosystems, and Beyond
The reporting indicator is intended as a proxy for the degree of political measures related to biodiversity protection. We acknowledge the intention to increase the discriminatory power of the indicator over the binary nature of ratification, yet we are not convinced that the link between reporting and political measures is stronger than the link between ratification and political measures. The principle of Occam’s razor would favor ratification as less complicated and more intuitive. Then, some treaties would have to be sacrificed because they were ratified by all CDI countries (CITES and the Ramsar Convention), but some might be added beyond the biodiversity protection.
Our candidates to be added are the Nagoya Protocol to the CBD that should ensure a fair share of benefits from the use of genetic resources, and the Basel Convention that regulates the transboundary movements of hazardous wastes and is specifically intended to prevent such a transfer from developed countries to developing countries. Also, while until recently all CDI countries have been a party to the UN Convention to Combat Desertification (UNCCD), Canada has withdrawn from the Convention with effect from March 2014, which makes it another potential candidate. It could be argued that the relevance of these agreements is even higher than for other environmental agreements because they respond to developing countries’ concerns. As the Basel Convention is not directly related to biodiversity, there is scope for a new environmental area to be included in the E-CDI (the UNCCD is mainly related to land, but there are interlinkages with climate change and biodiversity).
As for the indicator of tropical timber imports, we recommend it is not included, because it contains little information for two thirds of countries, whether we count the reported imports or their average. The alternative indicator concerns policies regulating the imports of illegally logged timber, as proposed by Cassara and Prager (2005) and used in the E-CDI for 2 years. This indicator only considers illegally logged timber, while legal logging may even be unsustainable. On the other hand, the current indicator favors zero imports that are not necessarily positive from the environmental perspective (trade restrictions may lead to forest conversion—see Barbier, 2001) and that mean a loss of export revenues for developing countries. The policy indicator was later replaced by an imports indicator due to the difficulties in comparing country policies. However, since that time there have been clear efforts to ban illegally logged timber (since 2008 in the United States, 2012–2014 in Australia, and 2013 in the EU), so this indicator could again be considered. Because these regulations have in effect the same goal and use similar instruments, the qualitative assessment might be less difficult now. 16 It should be noted that imports of timber (even legal) are only one of the drivers of global deforestation on the part of developed countries (see European Commission, 2014), but assessing such diverse consumption drivers such as livestock and textiles, or the policies that regulate them, is currently not feasible.
Normalization
Three recommendations on normalization can be given based on our (nonstatistical) analysis. First, the current normalization method preserves the differences in variation of the individual parts of the index. Indicators (components) with a low variation have a low influence on the overall scores of the component (index), while highly variable indicators (components) have a large influence. In the CDI, the aid component shows the highest variation and so its real impact on the overall scores is higher than for the other components. 17 In the E-CDI, there are significant differences in the variations of individual indicators (coefficient of variation is 15% for ozone-depleting substances and 191% for fishing subsidies) affecting their real weight. It is therefore no surprise that there is a strong correlation (Pearson coefficient .89) between the indicators’ coefficients of variation on one hand and the indicators’ correlation coefficients with the E-CDI score (when all indicators are given an equal nominal weight) on the other hand. It is a legitimate argument that changing the real weight of the indicator with its variation properly reflects the size of differences between country policies, yet the procedure may go against the intuitive understanding of what weight actually means for the users and may obscure the CDI’s intention to point out the diversity of country policies.
The common approach to limit the impact of variation on scores is to use a different method of normalization such as z-scores (that equalize the variations) or the min–max method. The latter offers a fixed range of values but not a fixed average. Z-scores standardize values to a fixed average (0) and standard deviation (1), but they have a less intuitive interpretation (the values are small with decimal points, and they are both positive and negative). Z-scores can be transformed into easily interpreted numbers, such as T-scores with a fixed average of 50 and a standard deviation of 10. Because we find a 0 to 10 framework scale easiest to interpret, we suggest normalizing values to an average of 5 and a standard deviation of 1.67. 18 It should be noted that these methods effectively expand small differences in original values (i.e., differences in a measured policy) into larger differences, but this is inevitably part and parcel of limiting the differences in variations.
Second, the normalization method for the ratification indicators in the E-CDI should be standardized across all indicators. For all normalization methods based on a fixed average, assigning fixed minimum and maximum values for ratification indicators is intuitive for these indicators but leads to a much less intuitive interpretation of the components and the whole index, and so the main advantage of this normalization method is lost (in contrast, in min–max normalization this approach is appropriate). Third, we recommend using the actual current year as the base year in each edition in order to use the advantage of a fixed average.
Conclusion
The CDI provides the first methodology of how to quantify, in a single measure, the diverse policies of developed countries that affect developing countries. The nine indicators of the E-CDI are intended to provide a comprehensive assessment of different countries’ approaches to the global environment. From a conceptual point of view, this component has a place in indices such as the CDI because preserving global environmental resources is essential for the future development prospects of poorer countries. However, the operationalization of the component suffers from several problems that affect the information value of individual indicators and the component as a whole. We still see some value in the final scores of the E-CDI (and in the whole exercise), but it is compromised. We acknowledge, however, that the task of constructing the E-CDI is not easy. The developers must address several types of issues, such as the weights of environmental problems, the combination of policy and practice indicators, the conversion to the relevant units (usually capita vs. GDP), the lower relevance of indicators for some countries, and the sharing of responsibility for the use of environmental resources between consumers and producers. These are conceptual questions to which theory mostly does not provide clear answers and thus need to be solved on a case-by-case basis.
In the final part of the article, we have presented several options for the modification of the E-CDI. We suggest including emissions of both producer and consumer countries and not to overweight the dynamics (rate of change) of emissions or policy more generally. Two indicators (ratification of the fisheries agreement and tropical timber imports) seem not to have enough information value and we recommend eliminating them from the E-CDI. The alternative for the latter is an indicator of policy regulating the imports of illegally logged timber. The gasoline tax indicator could be replaced by a more comprehensive energy tax indicator, while we acknowledge that currently data are only available for 1 year. As for the international treaties, we suggest expanding them to include three additions; one of them, the Basel Convention, would bring a new environmental area to the E-CDI. Regarding the technical aspects of the index construction, the current normalization method does not utilize its main strength (fixed average) due to the inconsistent normalization of some of the indicators but allows indicators and components with high variation to have a higher impact on the scores. We recommend using a consistent normalization method and limiting the variations and suggest an alternative normalization method.
Footnotes
Acknowledgments
We would like to thank three anonymous reviewers and the editor of the journal, Raymond Clémençon, for their valuable comments.
Declaration of Conflicting Interests
The author(s) declared no potential conflicts of interest with respect to the research, authorship, and/or publication of this article.
Funding
The author(s) received no financial support for the research, authorship, and/or publication of this article.