
Abstract
The adoption of good practices for the economic valuation of environmental services (ES) has strong implications in the evaluation and design of a Payment for Environmental Services program. People’s willingness to pay for an ES is useful to evaluate whether money collected from users will be enough to cover both the providers’ opportunity costs and other costs generated by the institutional arrangements required for implementation. In this article, we use a numerical certainty scale to adjust answers to a valuation question aiming to correct for hypothetical bias associated with stated preference methods. Following this approach, the mean willingness to pay decreases by approximately 70%. Values that are more conservative could assure greater political and social support for the program because more ES users would want to participate in the program; simultaneously, however, it might suggest that the project is not completely funded.
Keywords
A lack of social and political recognition of the economic value of environmental services (ES) has contributed to the degradation of ecosystems (The Economics of Ecosystems and Biodiversity [TEEB], 2010); in certain contexts, the establishment of a Payment for Environmental Services (PES) program represents a promising market solution to environmental degradation. A PES program is a voluntary transaction in which users of a well-defined ES buy from a provider of the ES, and the transaction occurs only if the provider can assure the provision of the service (Engel, Pagiola, & Wunder, 2008). In other words, in a PES program, ES beneficiaries contribute monetarily to make the necessary investments for a conservation program. This money is used to compensate for the pecuniary losses of individuals who must abandon certain economic activities or change their production processes to protect the environment (Pagiola, 2008; Sierra & Russman, 2006; Van Hecken, Bastiaensen, & Vásquez, 2012; Wunder, Engel, & Pagiola, 2008; Wünscher, Engel, & Wunder, 2008).
Accordingly, a demand analysis for these ES is important for evaluating the feasibility of a PES program (Ortega-Pacheco, Lupi, & Kaplowitz, 2009; Southgate & Wunder, 2007) because it allows us to estimate people’s willingness to pay (WTP) for the ES. Because it is impossible to observe market behavior for the ES (they are public goods, meaning that there is no rivalry or exclusion in the consumption of these services), researchers rely on nonmarket valuation techniques to estimate WTP.
In recent decades, various economic valuation methods have contributed to making ecosystem services more visible from an economic perspective. These techniques include both revealed preference methods (production function, travel cost, hedonic prices) and stated preference methods (contingent valuation, CV, and choice experiments; Champ, Boyle, & Brown, 2003). These methods are based on the theoretical principles of welfare economics and measure changes in people’s well-being by estimating their WTP for changes in the quantity or quality of a particular service (Secretariat of the Convention on Biological Diversity, 2009).
In this article, we conduct a CV study to evaluate the feasibility of a PES scheme in the Bolivian Sub-Andean Humid Forest. We believe that PES proponents must properly address the long-standing problem of hypothetical bias (Hausman, 2012) presented in CV studies in which the estimation of WTP using a hypothetical market is significantly greater than the WTP using either a real market or a simulated market (Bishop & Heberlein, 1979; Loomis, Brown, Lucero, & Peterson, 1996).
Hypothetical bias has been identified in several studies comparing hypothetical and real markets, and researchers conclude that applications of CV need to adopt a method to reduce this bias (Carson & Groves, 2007; List, 2001; List & Gallet, 2001; Little & Berrens, 2004). Therefore, unlike previous studies that use CV in a PES context, we use a numerical certainty scale (NCS) to correct for the hypothetical bias associated with stated preference methods. Our results show that using a NCS to calibrate people’s responses to a WTP question, combined with the careful design and implementation of a CV study using focus groups, pilot surveys, and sequential evaluation of results, significantly reduces the estimated WTP.
Following good practices for economic valuation could improve the performance of many PES programs that fail to correctly identify people’s WTP for ES. An evaluation of PES feasibility implies an evaluation of whether money collected from users will be enough to compensate for both the providers’ opportunity costs and other costs generated by the institutional arrangements required for implementation. Values that are more conservative could assure greater political and social support for the program, because although more users of the ES would want to participate in the program, such values might simultaneously suggest that the project is not completely funded.
These values will also provide information about the future performance of the PES program. We face a disjunctive: On one hand, we would like to estimate high WTP values for ES, thus leading us to implement the project. On the other hand, in reality, real values might be lower than we expected, leading us to pay low compensation to landowners. Low compensation implies that fewer people would be interested in adding land to the program and, even worse, that land that is at no risk of being developed will be included in the program. In other words, the performance of the program in terms of conservation will be modest.
Reviews of PES performance show mixed results regarding the program’s success in fostering conservation. There could be two primary reasons for the poor performance of some PES programs: low monetary compensation offered to ES suppliers and the weak scientific basis in which most PES programs are rooted (Naeem et al., 2015; Pattanayak, Wunder, & Ferraro, 2010). With respect to monetary compensation, Martin-Ortega, Ojea, and Roux (2013) conducted a literature review related to payment for hydrological services programs in Latin America, finding that ES providers receive only weak incentives to change their practices to protect the environment. Surprisingly, our literature review of current PES program design shows that the estimation of WTP values using nonmarket valuation methods has had a modest influence on the design of PES programs. For instance, in Costa Rica, compensation values were estimated using the opportunity cost of land (Anna & Nogueira, 2012; Pagiola, 2008; Pattanayak et al., 2010), whereas in Mexico, the final compensation value was defined using the growth rate of agricultural activities (maize production and livestock; Muñoz-Piña, Guevara, Torres, & Braña, 2008; Pattanayak et al., 2010). In both cases, the program estimates the compensation needed by suppliers without any attempt to evaluate the WTP of ES users. Although estimating WTP is not a requisite to develop a PES scheme, it provides useful information to evaluate whether the project is socially desirable from an economic perspective and whether there is room for a negotiation among users and providers or not.
Whittington and Pagiola (2012) review 25 CV exercises used to evaluate PES program around the world, finding that most CV applications were poorly crafted, had marginal policy relevance, and did not follow most of the good practices suggested in the literature. For those cases in which the PES was implemented, the estimated WTP have not been not used for policy design (Kosoy, Martinez-Tuna, Muradian, & Martinez-Alier, 2007; Whittington & Pagiola, 2012), and the final values charged to users are significantly lower than the WTP estimates. It seems that CV studies tend to be very optimistic (overestimate) about the population’s true WTP.
The following section briefly describes the PES proposal, including areas of study, feasibility analysis, and identification of ES. The CV method section explains the main characteristics of the CV method, including hypothetical bias and econometric approaches to estimate the mean WTP. Survey design and implementation section describes our application of the CV Method and WTP Results sections describes the main results of the study. Finally, Conclusion and Discussion section discusses the relevance of the CV results and presents conclusions.
PES Proposal Description
Area Description
The sub-Andean forests of Bolivia are crucial for the integrity of Bolivia’s ecosystems. This region constitutes a large zone of infiltration for the lowland’s groundwater (Ibisch, Araujo, & Nowicki, 2007), playing an important role in generating a safe water source for the city of Santa Cruz and hundreds of nearby villages. The area comprises 236,000 ha in the west of the Department of Santa Cruz; the landowners are typically poor farmers and indigenous people, whereas the potential ES demand corresponds to the city of Santa Cruz (250,000 inhabitants).
The PES program proposal aims to conserve the hydrological ecosystem services (HES) provided by the forest of the upper and middle Piraí River basin, which includes part of Amboró National Park. Currently, these forests are experiencing significant human pressure because of new settlements and the resulting economic activities that convert land forest into cropland and pasture. The land-use change together with inappropriate agricultural practices have diminished biodiversity in this area, reduced its primary productivity, and weakened the ecosystem’s regulatory capacities. The city of Santa Cruz offers favorable conditions for the introduction of a PES scheme because of its location along the lower courses of the Piraí River and because it has a prosperous population compared with other Bolivian cities. The water quality and the level of the aquifers providing water to the city depend on the land use in the buffer zone of the park.
PES Feasibility Analysis
The evaluation of the technical and economic feasibility of the PES scheme included five components. First, a hydrological and climate modeling study was conducted to assess the forest’s role in the provision of HES. Using the SWAT model (Arnold, Srinivasan, Muttiah, & Williams, 1998), we quantified the water generation and the speed of aquifer recharging in the Piraí River Basin and then simulated the variations in the hydrological ES given various deforestation scenarios, taking into account flows, sedimentation, and climatic change scenarios. Second, an opportunity cost analysis was conducted to assess the income foregone by residents of the upper and middle Piraí River basin. Third, a legal and institutional framework was created that aimed to define the various institutions or regulations affecting the proposed PES, including which institutions could manage the PES and the main financial aspects of the program. Fourth, a communication strategy intended to increase both the communities’ environmental awareness, and the knowledge of the PES program was developed. Finally, the project included a CV study to evaluate the demand for ES.
We identify and prioritize ES using the hydrological and climate modeling analysis under different scenarios of land use change (Ovando, 2009; Seiler, 2009) based on its relevance to the beneficiaries. On the basis of De Groot, Wilson, and Boumans (2002) and the Millennium Ecosystem Assessment (MEA; 2005), we identified Provision and Regulation as the ES. Provision (water supply) involves the filtering, retention, and storage of water in aquifers that provide water to the city of Santa Cruz. Regulation describes the influence of the ecosystem on the regulation of hydrological flows such as flooding prevention, water purification, and climatic stability (maintenance of a favorable climate).
The proposed PES program fits the definition given by Engel et al. (2008). It is a voluntary transaction among several ES providers (farmers) of a well-defined ES (water provision and regulation of flood) in which land use will be secure to provide these services, which are “bought” by several beneficiaries and in which the transaction is conditional on the provision of the service.
The CV Method
CV uses questionnaires to elicit people’s WTP for a good or service, creating a hypothetical market in which people can declare their preferences for the good. CV is especially useful for public goods or ES for which there is no market where they can be exchanged. There have been thousands of CV applications in diverse areas of economics; the main results have been summarized in numerous books on theoretical and empirical issues (Bateman, Willis, & Arrow, 2001; Carson et al., 2003; Mitchell & Carson, 1989). Some applications to ecosystem services include Zhongmin, Guodong, Zhiqiang, Zhiyong, and Loomis (2003); Jin, Wang, and Liu (2008); and Loureiro and Ojea (2008). More specifically, applications to PES include Ballestero and Rodríguez (2008); Ortega-Pacheco et al. (2009); and Moreno-Sanchez, Maldonado, Wunder, and Borda-Almanza (2012).
The main element of a CV survey is the creation of a hypothetical market. The created market must be seen as a real possibility by individuals, who need to believe that answering positively to the WTP question implies a real commitment to pay for the good (Hanemann, 1994). The survey should describe an economic and environmental problem that is relevant and meaningful to individuals. An acceptable description of the good being valued might require the presentation of technical information, and therefore, it is important to present this information in a simple, meaningful manner to respondents. It is desirable both to use visual aids and to make respondents participate in the process by questioning them about their understanding of the scenario (Carson et al., 2003). However, researchers should avoid encouraging respondents to think about the problem in a specific way. In other words, the language, visual aids, and interviewers must be neutral.
Together with the description of the status quo (current situation) of the environmental good under analysis, the hypothetical market must describe the project that will provide improved environmental conditions. This new situation must be credible and represent a change in the state of nature that is feasible and that does not change the current situation dramatically, either in an unrealistic period or in an unrealistic scope.
Despite the pervasive presence of CV studies in several areas of economics, its application has not been exempt from a high level of controversy. In the 1990s and especially after the Exxon Valdez oil spill in Alaska (Carson et al., 2003), there has been a wide discussion among researchers about the reliability of the CV method (Arrow & Solow, 1993; Diamond, Hausman, Leonard, & Denning, 1993). Opponents of the method claim that responses to a CV study do not satisfy the properties required by economic theory, and therefore, the value obtained in its applications cannot be considered a genuine assessment of economic value. Kahneman and Knetsch (1992) present a series of CV applications in which people react in an unexpected manner, from an economic perspective, to the scope of the good under valuation (scope effect), to the order of presentation of goods in a sequence (order effect), or to the nesting structure of a set of goods. Similar finding are presented in Desvousges et al. (1993), Diamond et al. (1993), Kahneman and Knetsch (1992), and Payne, Schkade, Desvousges, and Aultman (2000). Conversely, Smith (1992) claims that these anomalies are explained by a poor description of the good under valuation, along with an improper selection and design of the survey instrument and analysis of the results. Other authors have shown that all three effects described earlier can be explained by conventional utility theory (Carson, Flores, & Hanemann, 1998; Carson & Mitchell, 1995; Randall & Hoehn, 1996). Although further discussion of these controversies is beyond the scope of this article, a good starting point for the interested reader is the symposium in the Journal of Economic Perspective’s CV symposium (Carson, 2012; Hausman, 2012) and Applied Economics Perspective and Policy (Desvousges, Mathews, & Train, 2016; Haab, Interis, Petrolia, & Whitehead, 2013, 2016).
Arrow and Solow (1993), under petition of the NOAA Panel, suggest a series of technical recommendations to assure a minimum level of quality in the application of a CV study. They suggest a clear and appropriate description of the good under valuation, the program providing it and its consequences, using visual aids when possible to retain people’s attention to the survey, using a credible payment vehicle, reminding people about their budget constraints and related goods, including follow-up questions to identify protests to the hypothetical market, using pretests, focus groups, and pilot surveys to improve the final version of the survey, and using personal interviews. Specifically, they suggest using the closed-ended format (referendum) for the WTP question. In this format, respondents consider an amount of money $A as the price of the ES and they decide whether they are willing to pay that amount. The values of $A, known as the bid vector, are predefined and vary randomly among individuals.
In conclusion, the application of CV involves much more than a mere question of WTP, and there are several steps that must be fulfilled before researchers obtain a suitable final version of the survey.
Hypothetical Bias, Certainty Scale, and Cheap Talk Scripts
One of the main concerns about CV is that the estimated WTP is overestimated because of the hypothetical nature of the method (Brown, Ajzen, & Hrubes, 2003; Hausman, 2012; Loomis et al., 1996; Seip & Strand, 1992). This bias has been defined as a systematic difference between the WTP stated in a hypothetical market and the WTP observed in a real market (Bishop & Heberlein, 1979). Several explanations contribute to understanding the phenomena; for instance, the respondent might not be able to visualize the described scenario situation, it might not seem realistic enough to spend time thinking about it thoroughly or respondents also might not believe that their answers will have any effect on the policy (Nunes, 2002). If people believe either that their responses will not have consequences for their daily lives or that they will not have to pay for the good, an incentive to answer the CV question positively will be created because the respondents will receive a benefit at a very low cost.
The literature has identified two approaches to reduce hypothetical bias: a cheap-talk script and the use of a NCS. The cheap-talk script implies a direct discussion of hypothetical bias problem with the interviewees. It is expected that the “cheap-talk script” will induce people to think more carefully about their own responses and avoid this bias (Aadland & Caplan, 2004; Champ, Moore, & Bishop, 2004; Cummings & Taylor, 1999; Desvousges et al., 2016; Haab et al., 2016; List, 2001; Lusk, 2003; Whitehead, 2013).
A NCS, which consists of a follow-up question (after the yes or no answers to the WTP question) to assess people’s level of certainty (on a Likert scale) about their responses (Champ & Bishop, 2001; Champ, Bishop, Brown, & McCollum, 1997; Ethier, Poe, Schulze, & Clark, 2000; among others). This question is used to recode (from yes to no) people’s answers according to some threshold of certainty. In that sense our treatment is an asymmetric uncertainty model because it does not alter any No answer responses (Akter, Bennett, & Akhter, 2008).
Previous studies using the certainty scale to manage hypothetical bias show that the estimated WTP decreases significantly (Blomquist, Blumenschein, & Johannesson, 2009; Blumenschein, Blomquist, Johannesson, Horn, & Freeman, 2008; Champ & Bishop, 2001; Little & Berrens, 2004; Poe, Clark, Rondeau, & Schulze, 2002). None of these papers are related to PES.
WTP Estimation
Estimation of WTP involves a significant amount of technical details that can be found in Champ et al. (2003), Haab and McConnell (2002), and Hanemann and Kanninen (1999). We used both parametric and nonparametric econometric approaches to estimate WTP (following Jin et al., 2008). Any parametric estimation requires assumptions about the functional form of the utility function and the distributions of the error terms. Because selection of these components affect the WTP estimates, it is convenient to compare estimates from parametric and nonparametric models that do not require any of these assumptions. We present only the parametric results in this article because the nonparametric results were qualitatively identical (results are available upon request).
A parametric model explains people’s WTP as a function of a set of explanatory variables using a functional form for the utility function. The linear utility function is the most popular functional form used in CV and choice experiments because of the simplicity of the estimation of both the model and WTP (Louviere, Hensher, & Swait, 2000). Because our dependent variable is discrete, we denote a positive answer of individual i as yi = 1 and a negative answer as yi = 0. From this information, we do not directly observe the individual’s WTP. Thus, we need to find a relationship between the dichotomic responses and the underlying WTP. The basic model that economists have been using for this purpose is the random utility model described in Haab and McConnell (2002). This model assumes that the satisfaction that a consumer perceives in each state of nature can be represented by a utility function denoted by uj, which has a deterministic component, vj(p, y, qj) and some random component ɛj. In other words, uj = vj(p, y, qj) + ɛj, in which j = 0 in the initial situation, j = 1 in the new situation, p is a vector of current prices, y is income, and qj represents the environmental quality associated with each state of nature.
A respondent will be willing to pay the amount At only if the utility (satisfaction) of paying for this project is higher than the utility of the status quo in which the respondent does not pay for the project (u1 > u0). Recall that the values At are randomly assigned to each individual in the survey. Therefore, the probability of a positive answer is

Survey Design and Implementation
The application of the CV survey involves determining the target population and the sample, designing the questionnaire, validating the survey, selecting and training interviewers, and applying the final version of the survey.
Sampling, Payment Vehicle, and Bid Vector
The relevant population contains the 252,136 households of the urban area of the city of Santa Cruz (Instituto Nacional de Estadística, 2001) that constitute the potential demand for the PES scheme. The sample size contains 500 observations, which is representative of the population with a level of confidence of 95% and an error rate of 4.4%. We used a probabilistic polietapic sampling, randomly selecting the neighborhood and blocks. Next, we systematically select the household to be interviewed. This means that we select one household in each block starting in the northern corner, and if we do not obtain an answer from that house, we skip the next four houses and knock on the door of the next house.
Regarding the choice of a payment vehicle, considering that we need a credible mechanism that reaches all of the beneficiaries independent of their socioeconomic characteristics, we discarded the possibility of using voluntary contributions or higher income and fuel taxes. Voluntary contributions do not have the consequentiality characteristic needed in the CV application (Loomis et al., 1996). Taxes are discarded because they exclude a significant amount of people that either do not own a car or do not pay income taxes. From the focus group, we identified two options: water bills and electricity bills. These two services are provided by cooperatives that have reasonable institutional credibility among the people of Santa Cruz. Furthermore, these two utility bills are distributed monthly to each household in the city. The water bill was selected because it is directly related to the HES.
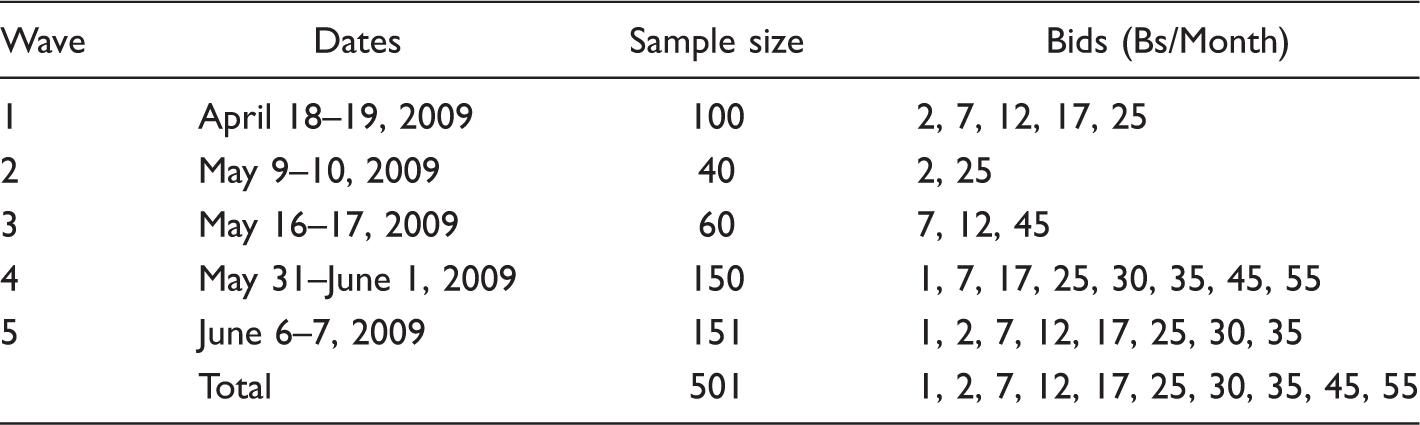
The use of dichotomic questions requires the design of a bid vector, which we define by following a sequential procedure. This procedure combines the minimization of the variance of the mean WTP with an observation of the empirical distribution of the WTP after a portion of the sample has been collected. From pilot surveys (100 observations), we obtained values for the WTP using an open-ended question. This information was used to define the bid vector and the size of the subsamples for each bid minimization of the variance of the mean WTP (Cooper, 1993). These values were applied to a subsample of the population; using this partial data, we identified areas of the WTP distribution that needed additional observations. 1
Survey Application
The design of the final survey followed three steps. First, we convened three focus groups both to explore how people reacted to specific aspects of the hypothetical scenario and to identify wording problems or misleading sections in the survey. Second, we applied two pilot surveys to fieldtest the design of the instrument. Third, we applied the final version of the survey. The fieldwork was implemented with the support of a specialized marketing and public opinion research company, which provided surveyors.
Focus Groups
Three focus groups were conducted during November and December 2008. Each group was composed of eight men and women aged 30 to 50 who were heads of households. Focus groups included people of both low and medium socioeconomic status, who constitute the majority of the population. Each focus group discussion lasted approximately 90 minutes and was guided by a professional moderator following a semistructured discussion plan.
The first group discussed people’s level of awareness of ES in and their perceptions of the benefits that they receive from the forests of the upper and middle Piraí River basin. We also captured their reactions to the environmental problem described in the survey and the possible solutions that they would recommend to solve this problem. The other two groups evaluated the entire CV scenario, including both the payment vehicle and the visual aids.
Results showed that the participants had a good understanding of ES, primarily related to climate regulation, recreation, and the provision of natural resources. However, water supply was not identified as a forest-related service, and therefore, the explanation of how water was collected for the city of Santa Cruz was very helpful for the interviewers. People were aware of the seriousness of the threats to forests and stressed the urgency of confronting this situation.
The PES proposal had a good level of acceptance among participants, all of whom were willing to contribute to the program. WTP was between 1 Bs (US$0.14 given that US$1 = 7 Bs) and 20 Bs (US$2.85), with a mean of 5 Bs (US$0.71) per month. However, participants insisted on the transparency and probity of funds management.
Several fairness issues arose in the discussion. Some people argued that the richest should pay more, whereas others preferred a fixed amount that would not vary according to water consumption.
The primary lesson is that researchers might have a different perception of the ES than the target population (water supply was not directly identified by participants) and the importance of the focus groups in developing the survey.
Pilot Surveys
We applied two pilot surveys of 50 observations each between January and March 2009. These two pilots were used to validate the questionnaire design and to find information about people WTP using an open-ended format. We followed Whittington (2002) suggestions to train our interviewers. We explained the main issues of the CV methodology, the objective of the survey, the need for the survey to be neutral, the scenario, and so forth. Interviewers performed role-playing interviews with team members; those interviews were closely supervised by our researchers. After each pilot survey, we held working meetings with all of the interviewers to identify the problems and biases in the survey.
After the first pilot, we adjusted the survey with the purpose of reducing the remaining hypothetical aspects of the survey, focusing on explaining the consequences of individuals’ decisions both for the future provision of the ES and for their budgets. We also added a majority-decision rule and a reconsideration question in which individuals have the opportunity to change their WTP answers. The main result is that the mean WTP changed from 10.04 Bs (US$1.43) to 9.34 Bs (US$1.33). In addition, with these modifications, the responses I don’t know/No answer decreased from eight to three observations. We also asked people about which aspects of the survey were useful in understanding the scenario. The written explanation was extremely important or very important for 80% of the sample (72% in the first pilot and 90% in the second pilot), showing that the survey’s adjustments improved the quality of the written description. Furthermore, 96% of the sample said that the maps, pictures, and diagrams were extremely important.
Taking all of these results into consideration, we thought that it was adequate to apply the final survey (applied from April–June 2009).
Final Surveys
The survey included three sections (see Appendix A). Section A was a warming-up section in which we asked respondents questions of general interest, including their views about the country’s main problems and the relevance of environmental issues to their daily lives. Section B presented the study area and explained the water cycle, the relationship between the basin and the aquifer, and the stressors affecting the basin. We included pictures of logging and other activities that were taking place in the area. Additionally, we discussed the main ES provided by the basin, including water provision and water flow regulation and its relationship with floods, droughts, and climate. Section C provided an explanation of the PES scheme, including information about the contract between landowners and the PES agency, the monitoring system to verify that the landowners fulfill their commitments, monetary compensation, and program funding. This funding would be collected from the population of the city of Santa Cruz. Finally, we provided information about institutional arrangements. The elicitation question was the following: Given the information above, are you willing to pay monthly $A Bolivians to support this project, thus preserving the forest in the upper and middle basin of the Piraí River and assuring the provision of environmental services, including water provision, avoiding floods and droughts and maintaining favorable weather?
Our cheap-talk script was as follows: Before you answer, let me talk about a common problem in this type of studies. It is common that people answer this question by agreeing to pay an amount of money that is higher that their true WTP (the WTP that they will pay if the project took place immediately). It is likely that people do not consider the impact of this new charge in their household budget. Remember that this money will not be available for buying other goods and services. I would like to ask you that you keep in mind your budget constraints, your current expenses and the fact that this new change could become a real fee in the near future. What is your answer: yes no.
Survey Distribution and Bid Vectors.
WTP Results
Parametric Estimation.

Note. Standard errors in parentheses. WTP = willingness to pay; NSE = Socio-economic level.
*p < .05. **p < .01. ***p < .001.
Although income is not explicitly included in the model, it is implicitly included through the coefficient associated with BID, which is the marginal utility of income, assuring consistency with the economic theory underlying the model (see details in Champ et al., 2003). All of the coefficients associated with the BID are negative and significant, telling us that an increase in the bid reduces the probability of a positive answer. Effectiveness is also significant and positive if an individual’s belief in the effectiveness of the project will have a higher probability of a positive response. People from higher socioeconomic levels have also a higher probability of accepting the payment.
We also provide the mean WTP estimates for each model and its 95% confidence interval. The stricter the cutoff point, the lower the WTP. In Model 1, the mean (and the median) WTP is 20.27 Bs/m (US$2.89), representing 15% of the current average water bill 0.69% of the mean monthly income, whereas it decreases to 11.05 (US$1.58, 8% of average water bill) in Model 2. For the other three models, the WTP is not statistically significant, which reaffirms our point that the project will not pass a cost–benefit analysis if we use that level of uncertainty. We tested the significance difference between Models 1 and 2, finding that the WTPs are statistically different. Using the estimated mean values to extrapolate our results to the entire population, we estimated that the program could collect between US$4.7 and US$8.7 million each year, respectively, depending on whether we adjust for uncertainty considering only Models 1 and 2.
Conclusion and Discussion
In this study, we showed the implications of the WTP study in the evaluation and design of a PES program in Bolivia. We corrected the estimated WTP for hypothetical bias associated with the CV method by using a NCS. According to our results, the adjustment of the mean WTP reduces the values by 45% in the best cases and more than 70% in the worst cases. Moreover, the estimated WTP becomes statistically insignificant at stricter cutoff points, meaning that under this scenario the project will not pass a cost–benefit analysis. The opportunity cost analysis suggested the project requires US$1.135 million annually to compensate the prioritized areas (which include approximately 4,000 ha). This value does not include other costs associated with administrative costs and social awareness campaigns. The project is fully funded only if we are not strict with the cutoff point (NCS = 1); however, for any of the other values, the project will have a significant deficit. This deficit will be even higher if in the design of the PES we established a differentiated, fixed fee according to water-consumption level. 2
A policy maker should take these results as relevant inputs in the process of evaluating a PES scheme. Of course, the estimated WTP does not automatically define the amount that should be charged within the implementation of the PES scheme, but our sensibility analysis for the cutoff points provides useful information about PES feasibility. The final value likely will be the result of political negotiations among suppliers and beneficiaries, but we need to show in advance that some room for negotiation exists.
The conservative WTP values estimated by correcting the WTP for hypothetical bias allow us to anticipate the common problem of the several PES programs in which the final ES fee is significantly lower than the estimated WTP. This problem might be driven by the weak foundations of the CV studies regarding the hypothetical bias, among other issues (Berggren & Sthal, 2003; Whittington & Pagiola, 2012). In a recent payment for hydrological services literature review, the authors found that on average, ES buyers paid only USD 0.007 per m3 to ES providers (Martin-Ortega et al., 2013), which would be close to 0.14 dollars in our study (evaluate at the average of BS$136≈US$20), closer to using the stricter cutoff point of our NCS and clearly making the PES unfeasible. For places for which we could find data, we know that in Honduras, the final payment was 3.6% of the mean WTP (in our case, that would be BS$0.72≈US$.10), whereas in Costa Rica, the final payment was USD 0.008 per m3 (approximately 6% of the average water bill, in our case BS$7.616≈US$1.088; Berggren & Sthal, 2003; Whittington & Pagiola, 2012). It is difficult to think that any of these projects are feasible from a financial perspective.
As mentioned, the CV study is part of a larger effort aiming to evaluate the feasibility of the PES program in the Piraí River Basin. In a wider context, the analysis of five components studied in the project (hydrological, CV study, opportunity cost estimation, legal and institutional framework, and the communication strategy) suggested that the implementation of the proposed PES program is feasible only if we accepted a lower level of certainty in the responses.
Our study’s implications are relevant to the Bolivian case in particular and to every other PES program in general. By following good CV modeling practices, an ex ante PES program cost–benefit analysis will terminate some initiatives that are not socially efficient, thus saving time, money, and institutional efforts.
In this article, we focused on the WTP study needed to define whether the PES program could collect enough money to be implemented. However, there are other topics of interest that should be addressed during the PES design phase (see Engel, 2015). Those topics include property rights, institutional framework, conditionality, additionality, monitoring, leakage, and the emergence of perverse incentives, among others. For developing countries in general and for the Bolivian case in particular, those topics will define the success or failure of the proposed PES program. For instance, in a context in which the institutional framework is weak, efforts to enforce the property rights, assure conditionality, or to prevent leakage could drain most of the resources allocated to conservation activities, threatening the performance of the PES program (Engel, 2015; Wunder, 2013, 2015). At the political level, PES implementation should consider not only the level of acceptance of this market solution but also the potential cultural disruption that a program as the one mentioned could impose upon poor communities (Kosoy & Corbera, 2010; Milne & Adams, 2012).
Water cycle. Water supply for Santa Cruz. Pictures of current activities in the basin.

Footnotes
Appendix A. Description of Survey
Acknowledgments
The authors would like to thanks Stephan von Borries, coordinator of the Program, Natalia Calderón, Head of Climate Change and Environmental Services Department and Jorge Seifert-Granzin, Senior Advisor of FAN-Bolivia, for their support and helpful reviews throughout the course of the study.
Declaration of Conflicting Interests
The authors declared no potential conflicts of interest with respect to the research, authorship, and/or publication of this article.
Funding
The authors disclosed receipt of the following financial support for the research, authorship, and/or publication of this article: The authors gratefully acknowledge support from the project Fondecyt 11090005 and also from the Scientific Millennium Initiative of the Chilean Ministry of Economics, Promotion and Tourism under Project RS 130001. The PES project was supported by Nature Conservancy (TNC), Cooperation Andina de Fomento (CAF), The Royal Netherlands Embassy in Bolivia, and the Fundación Amigos de la Naturaleza (FAN-Bolivia).