



Abstract
Local natural resource management in its diverse manifestations holds core to its principles that the marginal and vulnerable households are empowered to manage valuable natural resources to improve social and economic equality and conserve biodiversity. Yet studies aiming to identify the impacts often show inconsistent results. Through constructing an integrated Environmental and Social Accounting Matrix (ESAM), we aim to assess how natural resources are used in different sectors and by different livelihoods, thus delivering different direct and indirect benefits to the community. The study was conducted in Namibia’s Sikunga Conservancy, which manages wildlife and fish resources in the Zambezi region. Our village-level ESAM shows an economic structure that strongly disadvantages remote households and identifies a small sector of the economy that benefits significantly from the use of natural resources. The ESAM approach is able to isolate undesirable socioeconomic developments such as unequal benefit sharing, which hinders community development.
Keywords
Local natural resource management (NRM) concepts, namely, community-based natural resource management (CBNRM) and comparable programs such as fisheries comanagement and community-based fisheries management continue to gather momentum as national decentralization and democratization programs sweep across sub-Saharan Africa (Blaikie, 2006; Dressler et al., 2010; Fabricius et al., 2013; Sowman & Wynberg, 2014). By transferring property rights for natural resources, CBNRM aims to provide communities with an increased incentive to sustainably manage the natural resources they depend upon and at the same time deliver equitable economic growth (Berkes, 2004; Jones & Weaver, 2008). 1
Despite the popularity of the philosophy, the overall impact of CBNRM remains unclear (Lewins et al., 2014; Riehl, Zerriffi, & Naidoo, 2015; Silva & Mosimane, 2012). Impacts can be measured at multiple scales; at the national level, CBNRM programs appear to be having a positive impact throughout sub-Saharan Africa. Increases in wildlife headcounts (Roe, Nelson, & Sandbrook, 2009) and income (Frost & Bond, 2008; Naidoo et al., 2016) have been recorded in sub-Saharan countries with CBNRM. CBNRM programs have also been found to boost economic activity in other sectors (Muchapondwa & Stage, 2013). Social Accounting Matrices (SAMs) have been applied in Namibia to analyze the impact of hunting tourism (Samuelsson & Stage, 2007) and angling tourism (Kirchner & Stage, 2005), as well as the value of Namibia’s protected areas (Turpie, Barnes, Lange, & Martin, 2010), with all studies showing CBNRM helps stimulate growth in other sectors within the Namibian economy. However, benefits at national and community level may not necessarily trickle down to individual households (Leisher et al., 2016; Nunan, 2006; Riehl et al., 2015).
Using various quasi-experimental methods, recent studies reveal inconclusive results. The impact of CBNRM on income has been statistically insignificant for the average household (Pailler, Naidoo, Burgess, Freeman, & Fisher, 2015; Riehl, 2014; Suich, 2013), whereas improvements in health (Naidoo & Johnson, 2013; Riehl, 2014) and food security (Pailler et al., 2015) have been identified. The question therefore remains: Why are the impacts of CBNRM inconsistent?
One possible reason is that particular livelihoods benefit more than others from CBNRM (Collomb et al., 2008; Scanlon & Kull, 2009; Suich, 2013). Looking primarily at the direct income and financial aspects while neglecting the indirect benefits from conservation may present another reason why impacts of NRM are conflicting (TEEB, 2012; WAVES, 2016). It is well established that the value of natural resources within CBNRM areas far exceeds the economic output from production and tourism (Turpie et al., 2010). Despite the economic value of natural resources, Humavindu and Stage (2015) identified the risk of long-term environmental sustainability due to unsustainable financing of conservancies, particularly younger conservancies, which may fail to generate revenue to cover operating expenditure of their conservation activities. In addition to waning donor funding, the challenge of sustainable financing may partly be explained by the fact that management committees use funds differently. As Mulonga and Murphy (2003) highlighted, the increased cash flows from CBNRM activities can be used for multiple purposes, shared directly across households, or invested in community funds or infrastructure. In turn, we have seen that some sectors within CBNRM are complementary, for instance, hunting and tourism (Naidoo et al., 2016), while others namely livestock and agriculture are often the source of conflict with wildlife-focused sectors (Hoare, 2015; Kahler & Gore, 2015; Mosimane, McCool, Brown, & Ingrebretson, 2014).
As a way to enhance the discussion by analyzing how economic, financial, and natural resources are distributed within a nature-dependent economy, we constructed an integrated, Environmental and Social Accounting Matrix (ESAM). The ESAM integrates economic, financial, and natural resources into a single matrix. By incorporating the different sectors, we can observe the linkages between single activities and derive the context-specific, direct, and indirect income effects of CBNRM in our study region. Analyzing the flow of resources between actors and sectors is essentially answering “who does what with whom, in exchange for what, by what means, for what purpose, with what change in the stock” (United Nations, 2009, p. 16) and is key to understanding how the economy causes different outcomes for different social groups.
By showing the linkages between resources and household, we answer the following questions:
What is the economic contribution of environment- and non-environment-based activities to the village economy? What are the structural linkages between environmental and non-environment activities in the village economy? How is environmental income distributed across livelihoods and regions within the village economy?
We aim to demonstrate the potential of using an ESAM to show the distribution of natural resources and their benefits within a CBNRM environment. More generally, we have constructed a multisectoral SAM at the village level, including additional environmental accounts for selected natural resources. The ESAM provides a consistent data framework that can flexibly be extended and used as a point of reference for economic modeling. Our ESAM complements the few in existence from Faße, Winter, and Grote (2014); Shiferaw and Holden (2000); and San Martin and Holden (2004). We, however, go further and integrate multiple environmental resources within the single ESAM. The rest of the article is set out with a brief overview of the data for the ESAM, a detailed description of the model, and, last, the results, discussion, and conclusion.
Study Area and Data
Study Area
To demonstrate the usefulness of an ESAM in explaining the impacts of NRM, we selected a conservancy in the Zambezi region of Namibia. The study was part of the Southern African Science Service Centre for Climate Change and Adaptive Land Management (SASSCAL; see, www.sasscal.org) research portfolio on climate change and adaptive land use and took place in Sikunga Conservancy, a developing conservancy gazetted in 2009 and hosting wildlife as well as valuable freshwater fish resources. The Zambezi region has a high GINI coefficient and high levels of poverty (National Statistics Agency, 2012). Although rich in biodiversity, regional environmental issues such as overfishing, deforestation, slash-and-burn farming, and poaching continue to grow (Mendelsohn, 2006; Tweddle, Cowx, Peel, & Weyl, 2015). The region is also home to the Kavango-Zambezi (KAZA) Transfrontier Conservation Area (TFCA) and supports a number of vulnerable wildlife but also causes serious human–wildlife conflicts (Metcalfe & Kepe, 2008). Fish stocks, located yearlong in the Zambezi river and across the floodplains during the flood season, are suffering from overfishing and a lack of coordinated management with cross-border Zambia (Abbott et al., 2007; Tweddle et al., 2015). Grazing plains in the Zambezi region, which support large numbers of livestock, are slowly being eroded. Deforestation, increasing livestock headcounts, and slash-and-burn farming have contributed to the erosion and degradation of floodplains in the region (Purvis, 2002). Agriculture practices are rudimentary and are based on low-input or low-output farming, placing greater pressure on denuded land (Pricope, Gaughan, All, Binford, & Rutina, 2015). Forest resources in the area are generally undervalued and undermanaged, with few controls placed on timber and firewood collection. Other natural resources such as thatching grass and river reeds are controlled by fixed-period licenses (Barnes, MacGregor, Nhuleipo, & Muteyauli, 2010).
Economically, off-farm job opportunities in the area are limited, and the majority of households tend to eke out maize-based subsistence existences supported by natural resource extraction (Kanapaux & Child, 2011). Cash income in the region is mostly earned through a handful of high-paying tourism or government jobs in the regional capital, Katima Mulilo, with a high number of households also depending on social welfare payments such as pensions and orphan payments (Suich, 2010).
Sikunga is rich in natural resources with grassland floodplains and Mopane woodlands covering the 287 km2 area (Mendelsohn, 2010). The conservancy consists of six main villages clustered in three locations. As can be seen in Figure 1, three villages are located close to the main road into Sikunga. Sandwiched between the only road in and out of the conservancy and the Zambezi River, Kalimbeza, Kena, and Nasisangani have the greatest access to transport to the regional capital. Sifuha, the largest of all villages, and Kalundu are a 5-km walk across the floodplains to the main road. The third region consists of Malindi, an isolated village that can only be reached via an 18-km journey by foot or by bike across the sandy plains. The three subareas (main road, semi-isolated, and isolated) are able to access different natural resources to varying extents.
Map of Sikunga, its infrastructure, and villages.
Like many conservancies, Sikunga earns the majority of its income from the sale of hunting licenses; however, there are also two lodges within the area which support the highly lucrative angling tourism sector. The lodges have formal benefit sharing arrangements with the conservancy, and in this way, Sikunga is unique as it earns income from hunting as well as angling. As tourism in the conservancy is heavily focused on the unique angling in the area, the dwindling fish stocks (Tweddle et al., 2015) are putting the lucrative tourism income, as well as the livelihoods of the poorest and most vulnerable, at risk. In 2012, Sikunga established a pilot fish protected area and a fishery management plan, which, if successful, may prove a model for future freshwater fish protected areas (Tweddle, 2012).
Data
The ESAM is primarily built from household survey data collected from within the conservancy. There were approximately 440 households in Sikunga in 2012, and we sampled 200 (45%). The sample was random, based on household lists provided by the conservancy. As the sampling was nonstratified, results reflect the full population of Sikunga. Targeting the household head, the survey covered all economic activities, including the collection, consumption, and trade of all natural resources. Agricultural inputs and outputs were also recorded. For all transactions, the agent, origin, and destination of goods produced or traded were recorded. For all fish and timber data, species were recorded so as to better develop growth functions and measure changes in natural capital. Secondary data sources were used to complete information gaps from the primary data. This information was used to calculate environmental stocks and growth rates. 2
Method
The SAM method was originally envisaged to observe national accounts in an input–output table to better inform policy development (Taylor & Adelman, 1996). Acknowledging both the impact and dependence on natural resources, the accounting framework was expanded to include the physical or financial values of natural resources (United Nations, 2003).
The ESAM is a specification of the System of Environmental and Economic Accounting (SEEA), continuously advanced to include better coverage of Ecosystem Accounting (UNSTAT, 2016). It plays an important role in policy planning and is critically needed as a monitoring and planning tool at the regional and the village level (Angelsen et al., 2014; De Anguita & Wagner, 2010; Shiferaw, Freeman, & Swinton, 2005).
The Environmentally Extended Sikunga Village Sam
Overview of ESAM Framework.

Source. Adapted from De Anguita and Wagner (2010) and Adelman, Taylor, and Vogel (1988).
Prices have been based on market prices where possible (United Nations, 2014). In the case of forests and fish stocks, the value of the resources produced during 2012 is based on 2012 market prices. The value of future income generated from growth and regeneration, recreational, and nonconsumptive use is excluded. The prices of natural resources used in the production of other goods, for instance, trees used for the production of firewood, are based on a partitioning of the cost of labor and the end price of the produced good. This approach is similar to the partitioning of operating surpluses between natural and produced assets as outlined in the SEEA 2003 3 (UN, IMF, European Commission, OECD, & World Bank, 2003). All values in the table are reported in Namibian Dollars (NAD$) where NAD$1.00 is roughly PPP$0.60.
Activities
We separate the activities into four groups: agriculture, off-farm, natural resource growth, and natural resource extraction activities. Agriculture activities focus mainly on maize and livestock and commercial rice farming. Off-farm activities consist mainly of government and tourism services. Natural resource growth and extraction activities are included for each individual resource. Ecosystem services such as cultural services have been excluded from the current version of the ESAM. Only natural resources that are economically or environmentally significant to the economy have been included (UN et al., 2003). Our approach to the recording of environmental transactions is based on the SEEA 2012 framework and on the representation of livestock developed by Gelan, Engida, Caria, and Karugia (2012) for their Ethiopia SAM. The growth of timber and increases in fish biomass creates the commodities timber and wild fish, which are recorded in the submatrix A4/6. The commodities can then be used as inputs for other production activities such as firewood harvesting or fishing. Commodities can also be taken from or contribute to existing stock levels. This is discussed further in the following sections.
Natural resource extraction activities represent the production of goods based on the extraction of natural resources, such as fishing, firewood harvesting, and so forth. Goods produced from natural resources which are sold are included in submatrix A3/5 and those which are consumed directly by the household are recorded in A3/9. Slash-and-burn farming produces agricultural assets, in the form of farming and grazing land, and is initially recorded as a production of the commodity farm land in A3/5, before being recorded as an increase in investment recorded in A5/10. However, this practice comes at a large environmental cost, which is initially recorded in the value of trees lost in A3/5 and is eventually absorbed by the conservancy in A5/9.
As with natural resource extraction, agricultural and nonagricultural goods produced and sold by households in Sikunga are recorded in A1/5, while the goods they produced and consumed at home are recorded in A1/9. Cell A1/5 includes the output from the commercial rice farm run by a government-owned business within the conservancy.
Commodities
Similar to the structure of activities, commodities are separated into agricultural and nonagricultural goods and services, and natural resource commodities. Commodities used as inputs for other production activities are recorded in A5/1 and A5/2, with environmental commodities, such as trees and wild fish, recorded in A6/3. Commodities purchased by households, regardless if they were produced inside or outside Sikunga, are recorded in A5/9. Where commodities were reported as being sold within Sikunga yet were not able to be assigned to a particular institution, these values were recorded in a rest of village account in submatrix X5/13. Submatrix X5/14 also records the value of commodities exported to Namibia and the rest of the world.
Where the value of natural commodities used as inputs is less than the value of the sustainable yield, an increase in natural capital is recorded in A6/11. Similarly, increases in storages of crops or livestock headcounts are recorded in A5/10 as an increase in agricultural capital. Thus the ESAM is able to directly report the sustainable use of different natural resources in different activities.
Factors
The Value Added matrix consists of cells A7/1, A7/2, A7/3 and A7/4, for labour and agricultural factors, and A8/3 and A8/4 for natural resource factors. Where residents of the community were employed outside the boundary of the village, this is reported in A7/14. The value for labour, where possible, was based on income reported for different activities. For on-farm activities, labour values were calculated based on reported time-use.
The distribution of payments to multiple factors for single activities is driven by payments for labor. This approach is consistent with the SEEA Central Framework 2012. 4 Capital rents are recorded for livestock and land in cells A7/1, A7/2, and A7/3 along with labor. Capital rents for environmental assets are recorded in A8/3 and A8/4. As with physical capital, capital rents on environmental resources can only be calculated when there is no consumption of existing capital (i.e., the use of natural resources is sustainable; United Nations, 2014).
Institutions
Institutions consist of the government, conservancy management, tourism operators, and households. Factor payments made to households from agricultural capital and labor are recorded in A9/7, with factor income from natural resources recorded in A9/8. This includes the net income from environmental rents for the conservancy, as the conservancy controls the environmental resources of Sikunga. Income from government pensions or other welfare is recorded in X9/12.
Where net savings are reported by households and other institutions, these are recorded in A10/9. However, where net losses for agricultural and financial capital are noted by households, these are put in A9/10. Households within Sikunga also sent money to households outside of the conservancy and these transactions are recorded in X9/13 and X9/14. Transfers flowing in the opposite direction are put in L13/9 and L14/9.
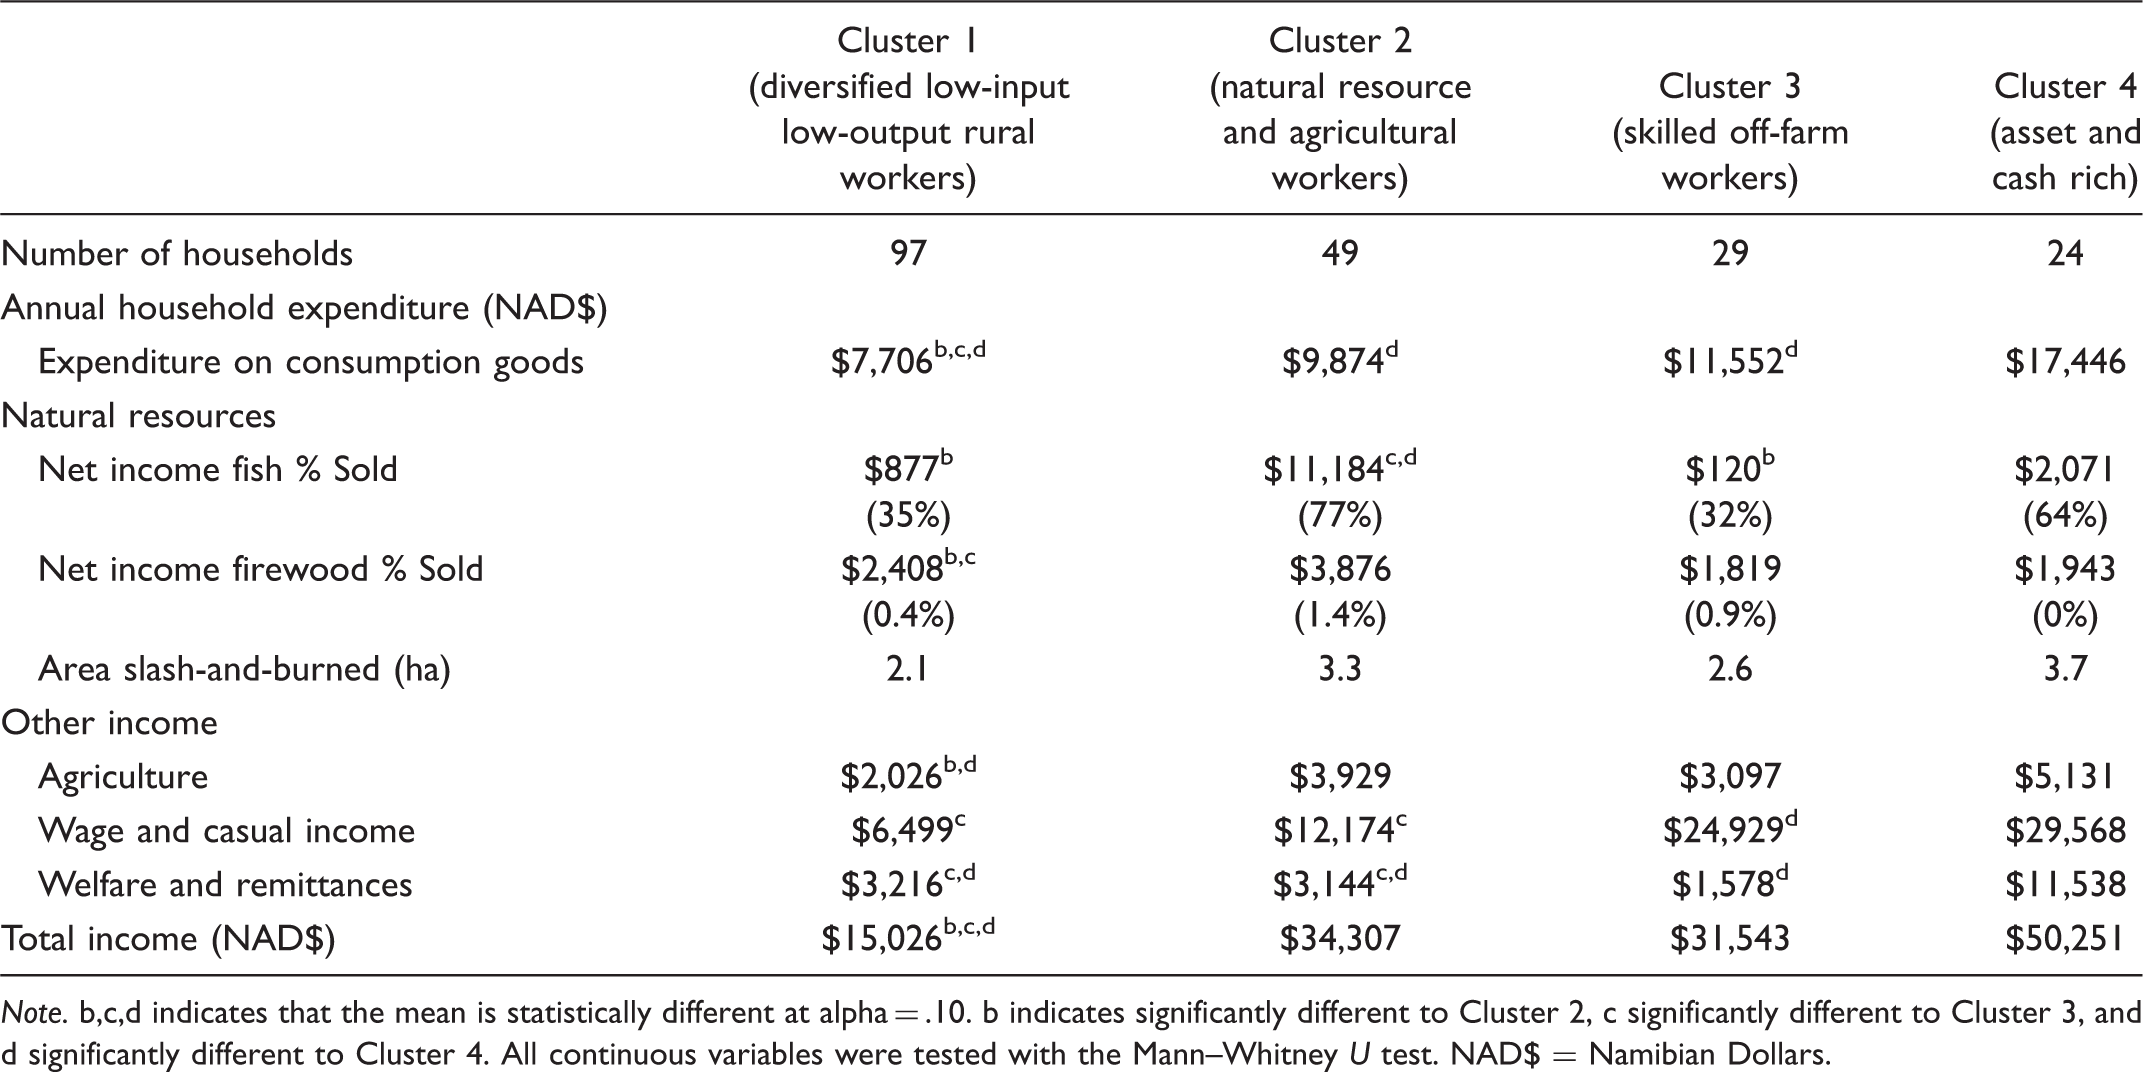
Income Sources for the Livelihood Strategies in Sikunga.
Note. b,c,d indicates that the mean is statistically different at alpha = .10. b indicates significantly different to Cluster 2, c significantly different to Cluster 3, and d significantly different to Cluster 4. All continuous variables were tested with the Mann–Whitney U test. NAD$ = Namibian Dollars.
Cluster 1 households, the largest of the four groups in terms of total households (48%), have the lowest annual income ($15,026), of which forestry resources make up 16% of their total income. This group consumes more than 3,100 kg of firewood per household per year; however, it tends not to exploit fish resources.
Cluster 2 households consist of 49 households (25% of the sample) and generate most of its income from natural resources as well as unskilled employment in agriculture sector. Households in this group catch on average around 860 kg of fish per household per year, which accounts for more than 30% of the household’s income. They also extract the highest amounts of firewood of all livelihood strategies.
Cluster 3 households have the second highest level of expenditure in the conservancy. Their higher expenditure is fuelled by comparatively high wage incomes from stable government jobs, mostly in military, police, or government departments in Katima Mulilo. This cluster represents around 15% of households in the community.
Cluster 4 households consist of 24 households, around 12% of the conservancy, and achieve the highest levels of expenditure through high-paying, private pensions as well as salaries from younger family members still residing in the household. Despite their wealth, households in this group are the second highest users of fish resources and cleared the second highest amounts of land through slash-and-burn farming.
Capital
The capital accounts are used to record changes in natural, physical, and financial resources. Where the consumption of commodities is greater than those produced and imported, there must be a decrease in stocks. This decrease in stock, referred to as consumption of existing capital, is recorded as an input to the production activity (United Nations, 2014). In cell A11/1, we report the consumption of existing natural capital. This occurs when consumption levels of wild fish are above sustainable yield levels. Increases in agricultural capital are distributed among the households in A10/9. Increases in natural capital are also assigned to the conservancy in A11/9, while increases in land from slash-and-burn farming are recorded for households in A10/9. The financial capital account contained in A10/9 and X10/12 is used as a balancing account and reports the net difference between incomes and expenditures for institutions, government, and the conservancy (Round, 2003; United Nations, 2014).
Government and conservancy
As the government and conservancy institutions have been considered exogenous for the multiplier analysis, they must be separated from the other institutions. However, the accounts are similar to other institutional accounts, such as earning factor income from land via the rice farm in L12/7 or environmental rents in L12/8.
Rest of the village, rest of Namibia, rest of the world
The rest of the village account is used to account for the flow of goods, services, and capital which are traded without a clearly defined producer or consumer. For example, a household may have reported that it produced 100 kg of maize and sold it within Sikunga; however, we are unable to determine which family or to which household cluster they sold it to. To include these transactions, we therefore include it in X5/12. Other imports from outside Sikunga are recorded in L14/5. There is a relatively small amount of hired labor in Sikunga, with the majority of labor for livestock herding imported from across the border in Zambia. Factor costs for imported labor are recorded in L13/7 and L14/7.
Multiplier Analysis
The economic linkages between environmental resources and their users have been analyzed by using constrained multiplier analysis, although most published SAMs apply unconstrained multipliers. Unconstrained multipliers are generally more simplified, assuming that factors and capital are unlimited and accessible at constant costs (Breisinger, Thomas, & Thurlow, 2010). In the context of an ESAM, this is rather idealistic and too removed from reality. For example, in our study area, fish resources are being used unsustainably, and fish reproduction rates cannot be ramped up or down depending on short-term demand.
To better account for this, we conduct a series of constrained multiplier analysis and place a limit on different environment sectors and resources. These constraints are also important in more accurately measuring the multiplier effects as unconstrained multipliers can often overestimate demand linkages (Breisinger et al., 2010; Round, 2003). For a more detailed description of how the constrained multiplier is derived, see Lewis and Thorbecke (1992).
Results
The Economic Contribution of Environment- and Nonenvironment-Based Activities to the Village Economy
Aggregate Village Extended Environmental Social Accounting Matrix of Sikunga.

The village economy is relatively closed with few leakages. The production value of NAD$4,197,000, excluding environmental accounts, means that GDP is approximately 93% of total production. Despite 75% of households producing maize, Sikunga remains a net importer. Of the roughly 84,000 kg of maize consumed annually in Sikunga, 83% is imported from the regional capital. Livestock still holds a prominent place in the culture and economy of Sikunga and accounts for around 14% (NAD$585,000—A1/6) of nonenvironmental production. However, expanding livestock and maize farming is responsible for the destructive consumption of forest resources; slash-and-burn farming and land clearing currently destroys about a third of the value of annual growth in forest stocks. The analysis revealed that fish resources were harvested at unsustainable rates. As can be seen in Table 3, the natural capital consumed, here the value of unsustainable fish extraction (NAD$66,928—A23/3), is around 17% of the total valued growth in fish stocks (NAD$375,546—A3/7).
The ESAM shows that the contribution of environment-based activities is central to the village economy, more specifically, that the output of natural resource extraction and harvesting is almost double that of both agriculture and off-farm activities. Yet the distribution and utilization of natural resources appear geared toward particular institutions and groups. This can be seen across agriculture, off-farm, and natural resource extraction activities.
Structural Linkages Between Environmental- and Nonenvironment-Based Activities
Constrained Multiplier Analysis—Livestock, Slash-and-Burn, and Fish and Timber Sectors Constrained.

Livestock is one of the traditional livelihoods indicating a positive impact on GDP and total income. An increase in exogenous demand for one unit of livestock would increase GDP by 1.02 units and income by 0.77 units. However, for each increase in livestock demand, there is an expansion in 0.22 units of land use through enhanced factor demand (Table 4).
The GDP and income multiplier for fish is low, as the sector is constrained and any increase in exogenous demand must be supplied via an increase in imports. The fishery sector has a doubly important role to play in the economy, contributing as much to GDP directly through catching and processing, as it does indirectly by attracting tourists for the tourism sector (Table 4).
In looking at the services industry within Sikunga, analysis revealed that tourism and conservation services have the largest impact on GDP. An increase in exogenous demand for tourism and conservation would result in increases in GDP by 1.25 and 1.23 units, respectively. As production for these two sectors occurs largely within the conservancy, the model concludes that growth in GDP translates into corresponding aggregate income growth. Another positive sign for the potential of tourism and conservation services is that the two sectors have very weak links with natural resource extraction. This is highlighted by increases in output of 1.48 and 1.40 units, with only 9% of the growth is due to enhanced natural resource extraction.
The Distribution of Environmental Income Across Livelihoods and Regions
Normalized Income Constrained Multipliers.
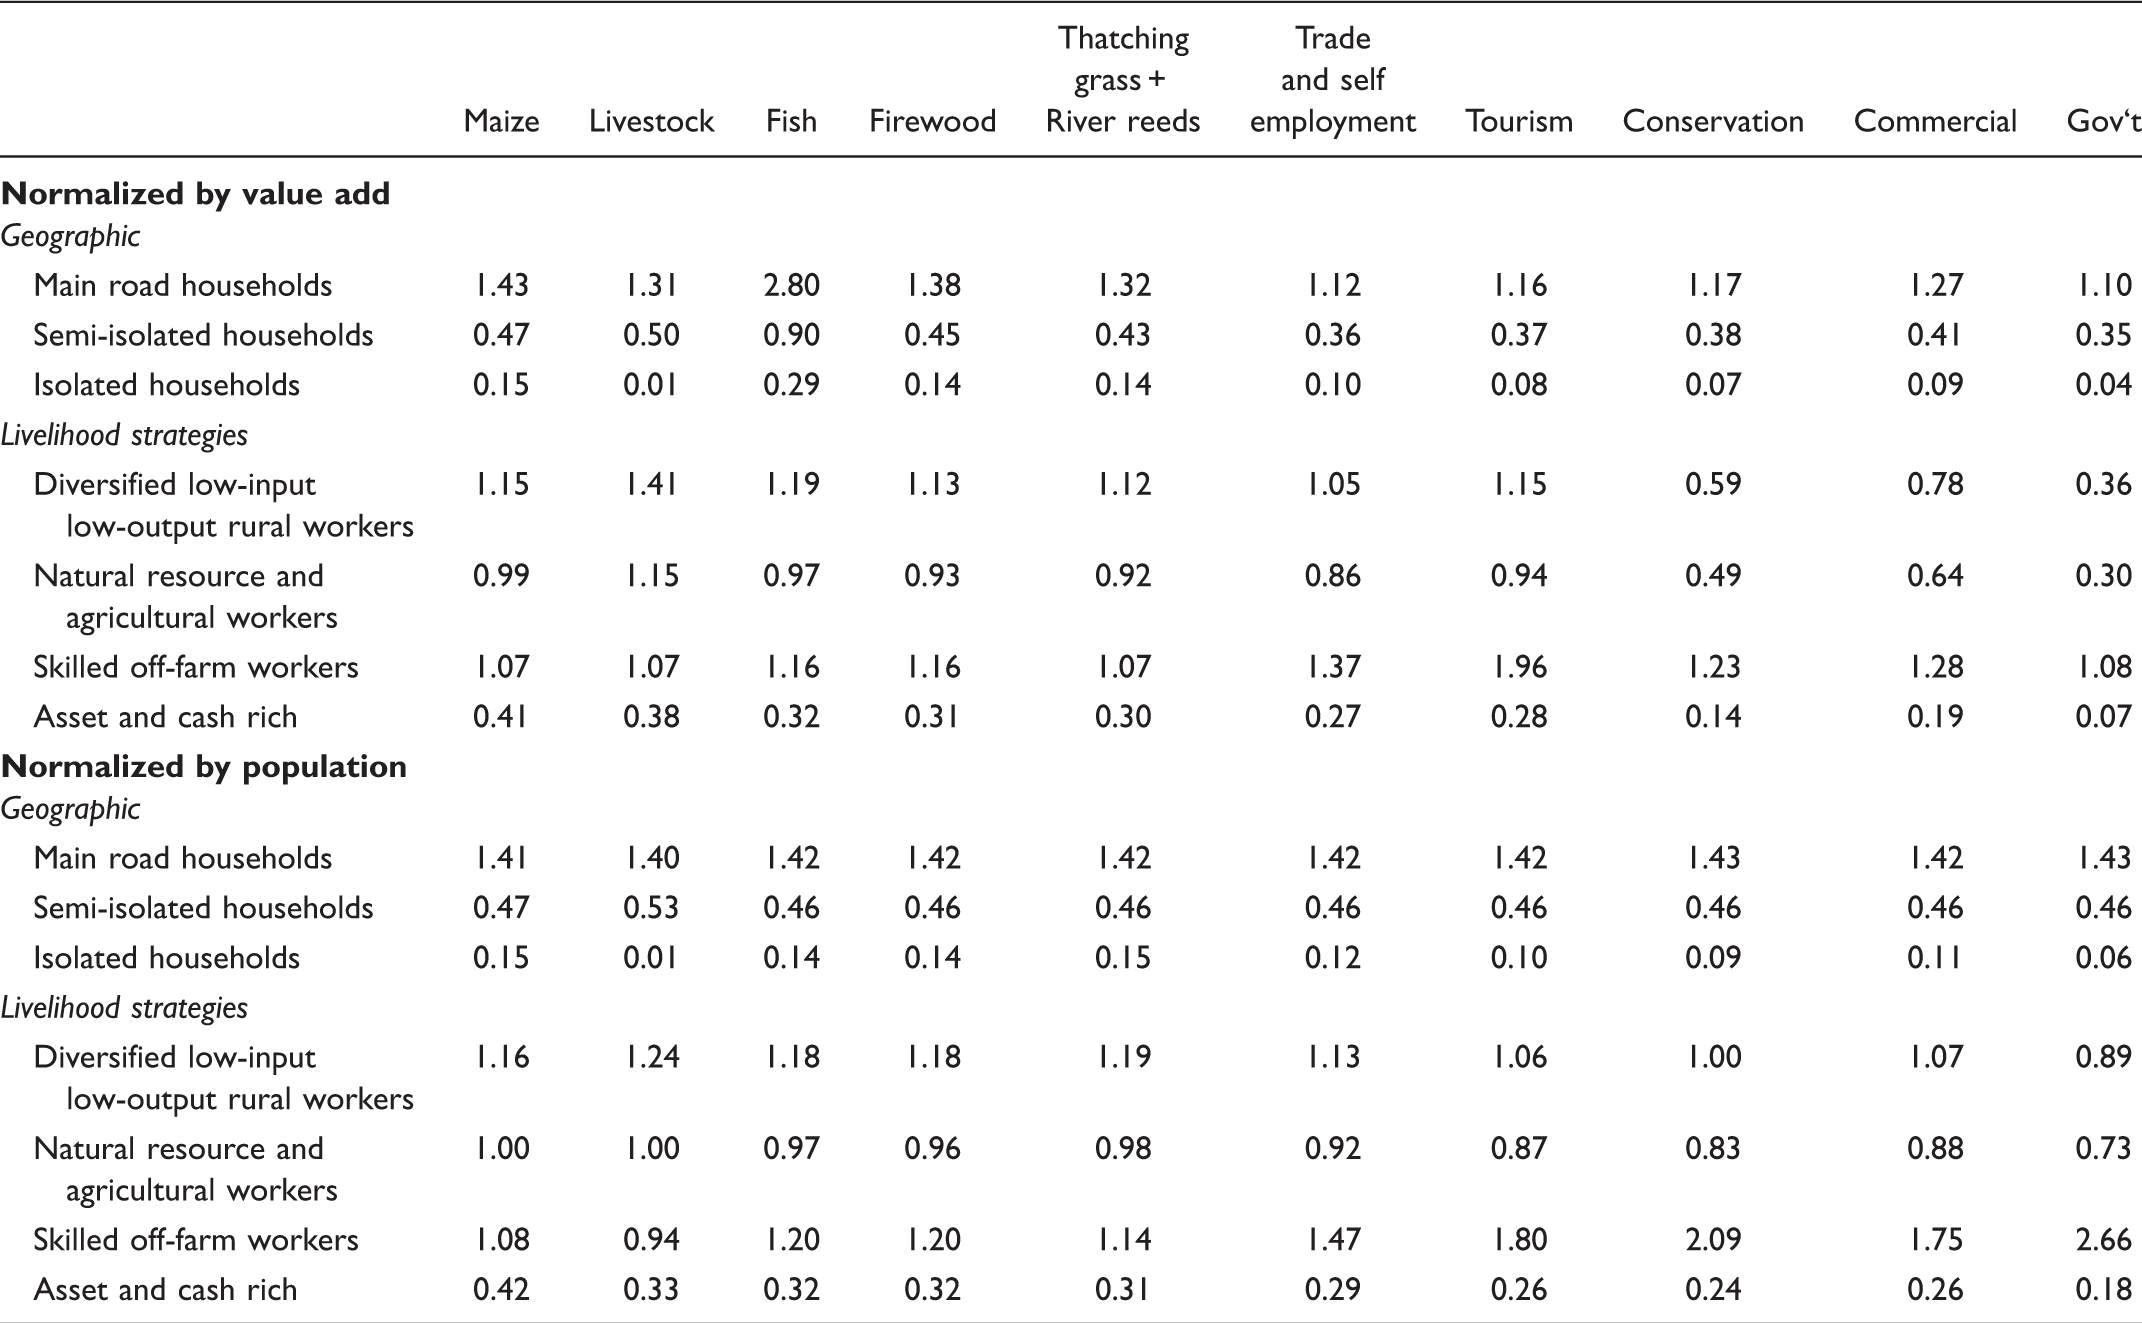
The normalized multipliers show that main road households tend to gain between 1.3 and 1.4 times the weighted average-induced income. Households in this region gain well above the weighted average for all activities, indicating the structural imbalance in the economy. Conversely, the isolated region with its lack of infrastructure and limited access to markets suffer significantly when gaining from any induced income development.
The normalized multipliers for the fish and firewood sectors provide conflicting impressions, as the sectors appear to support households that are either extremely poor or extremely well-off. We find that fish resources provide households from the poorest livelihood strategy (diversified low-input low-output rural workers) with 1.19 times the weighted average (value added) for fish, while skilled off-farm workers gain double that average income. Results are similar for fish and firewood using the population weighted average. Reflecting the main road households’ access to the river and floodplains, these households benefit 2.8 times more from fish-generated income than the weighted average (value added), indicating the highest income disparity across all normalized measures and all sectors.
The story is slightly more positive when looking at the normalized indicators for the different livelihoods strategies. Initially, asset and cash rich households appear to suffer a disadvantage within the village economy; however, the low normalized multipliers are slightly misleading. The majority of income for this cluster is generated by income from outside the conservancy, either from high-return pensions or salaries outside Sikunga. In consequence, any increase in induced demand within the village economy is unlikely to have any impact on their production and thus income-generating activities.
The poorest group of households, diversified low-input low-output rural workers, benefit from induced demand for commodities produced from unskilled activities such as maize and livestock farming as well as natural resource extraction. This partly reflects that their production and consumption activities are driven within the village. On the other hand, households in this cluster gain little from conservation and tourism activities. Increases from conservation employment or tourism are likely to flow through to the wealthy and well-educated skilled off-farm workers.
Discussion
CBNRM is a local governance institution that aims to deliver locally adapted sustainable and equitable rural development (Dressler et al., 2010; Fabricius et al., 2013; Sowman & Wyberg, 2014). Our ESAM analysis shows that benefit-sharing matters. This is in line with recent research done by Mosimane and Silva (2015), who found that local governance institutions in Namibian conservancies have not yet developed fair, transparent, and accountable benefit-sharing systems facilitating participation. In a behavioral field experiment related to our ESAM analysis, Roettgers (2016) revealed the significance of institutions favoring cooperation, specifically prosocial norms, leadership, and communication.
The structural linkages between environmental and nonenvironmental activities identified in our study area indicate that the natural resource-based sectors within the CBNRM economy are strongly interconnected, while nonnatural resource-based sectors appear to be growing separately and somewhat disconnected. The ESAM analysis shows that the current structure of Sikunga’s economy is neither sustainable nor equitable. Natural capital is being consumed at unsustainable rates with minimal consideration over the long-term economic and ecological consequences and may lead to regime shifts with damaging economic and environmental impacts.
However, Sikunga is an emerging conservancy with high potential for diversifying the nature-based tourism sector due to its rich aquatic and terrestrial biodiversity. Being part of a broader network that includes also transboundary natural resource management approaches (Abbott et al., 2007), the process of community development depends on external factors, local management strategies (Fabricius et al., 2013, p. 273), and the collaboration between traditional leadership, government, and external stakeholders (Mawere, Mabeza, & Shava, 2014). As pointed out by Barendse, Roux, Currie, Wilson, and Fabricius (2016), one limiting external factor is the government’s inadequate implementation capacity so that local governance institutions have narrow capacity to develop natural resource stewardship. This holds for wildlife as well as for fishery management (Cox, Wilson, & Pavlovich, 2016; Lewins et al., 2014; Ngwira, Kolawole, & Mbaiwa, 2013; Nkhata, Breen, & Abacar, 2009; Nunan, 2006; Sutton & Rudd, 2014).
The ESAM tool has highlighted negative developments, associated with investments by the Sikunga Conservancy Management, that appear to advantage established elites and wealthy households and those located near the main infrastructure. In particular, the isolated village of Malindi has no clear economic development opportunities based on the current structure of Sikunga’s economy. More concerning, however, is that income multipliers indicate conservancy-based economic activities such as tourism and conservation jobs are skewed to be prorich rather than propoor, findings similar to that of Elliot and Sumba (2011), who recommended the launch of transparent benefit-sharing agreements.
Geographical clustering shows the opportunity to reconsider land management and zooning in favor of remote villages. We also show that biased income allocation in favor of asset-rich households causes an unsustainable increase in demand for cattle and grazing land, explained by the cultural high value local people still attribute to owning cattle. As the Zambezi region is already at maximum carrying capacity (Mendelsohn, 2006, 2010; Pricope et al., 2015), any increase in farming land will be due to land-use change. As deforestation intensifies, the growth rate of forest stocks will decrease, which in turn may escalate pressure on households due to loss of fuel sources, shade, protection from desertification, and other ecosystem services.
Value-added sectors such as community-based tourism may increase capital rents on the natural resources without putting at risk natural capital stock levels (Van der Duim, Lamers, & van Wijk, 2015). Conservation tourism as promoted by the African Wildlife Foundation is one promising example for market-based conservation that might be an option for Sikunga (Van Wijk, van der Duim, Lamers, & Sumba, 2014).
Conclusion
This article contributes to existing research in several ways. It is an addition to the limited number of village-level SAM and ESAMs and provides a valuable insight into the economic and environmental linkages within a CBNRM context. By including subvillages within the ESAM, our model highlights the importance of geographic capital, particularly in the context of a region undergoing rural–urban change. Finally, the model also challenges the cultural importance of particular livelihood activities, and their future role in the livelihood strategies of rural households in northeastern Namibia.
The result indicates that the CBNRM program in Sikunga so far has done little to enhance sustainable and equitable development; rather, the transfer of property rights to the conservancy has allowed the elite and wealthy households to extract greater rents on the natural resources and put at risk the natural capital. The lack of incentives for the vulnerable isolated households to protect the wildlife plains that surround them could eventually jeopardize the wildlife and the hunting-based income that the governing committee members have grown to depend on.
To enhance economic development, the Conservancy Management Committee may consider prioritizing conservancy employment opportunities for disadvantaged households such as stewards for the wildlife plains or other similar activities.
Methodologically, the assumptions behind the multiplier analysis place some limitations on our conclusions and suggest that future research considers not only the greater use of village-level ESAMs across a wider number of study areas but their use as an input into more village-level computable equilibrium and agent-based models as well. Furthermore, ESAMs are only able to incorporate the flows and changes in stocks of natural resources and services. While concentrated flows of goods and services may indicate particular power balances within a community, they are insufficient to explain why different groups may be marginalized and the broader political ecology. Second, the quantification of both the volume and the value of ecosystem services is a key input into ESAMs, and there are many natural resources and ecosystem services, particularly cultural services, which though difficult are worth quantifying and valuing in this context.
The Sikunga Conservancy is unique in many ways. First, while the majority of the income for the conservancy management committee is obtained from the sale of hunting licenses, like most conservancies, however, its current tourism income is fishing and not based on wildlife. Second, it is also a comparatively young conservancy, which means that historical and cultural factors may influence the results reported within the CBNRM context.
Our results make a valuable contribution to the debate methodologically and, with a wider application, may enhance the distribution of direct and indirect benefits within the CBNRM context.
Footnotes
Declaration of Conflicting Interests
The authors declared no potential conflicts of interest with respect to the research, authorship, and/or publication of this article.
Funding
The authors disclosed receipt of the following financial support for the research, authorship, and/or publication of this article: This research was funded as part of the German Federal Ministry of Education and Research program “Southern African Science Service Centre for Climate Change and Adaptive Land Management (SASSCAL)”: Task 230—Food Security and Biodiversity: The Socio-Economic and Environmental Value of Natural Resources for Rural Livelihoods.