
Abstract
Using a multiple regression approach with a large developmental sample (N = 460) of Rorschach protocols from psychiatric, forensic, and nonclinical control groups, the authors created continuous multivariable Composite scores corresponding to the Comprehensive System (CS) Perceptual-Thinking Index, Hypervigilance Index, and Suicide Constellation. Within a validation sample (N = 230), these three new scores, called the Thought and Perception Composite, Vigilance Composite, and Suicide Concern Composite were strongly associated with the three original CS Indices. Additional analyses suggest that the new Composite scores were more reliable than and at least as valid as the original Indices. Interpretive guidelines are offered.
To date, Rorschach systems have not taken full advantage of computers to perform complex calculations. In the Rorschach Comprehensive System (CS; Exner, 2003), for example, clinical Indices are derived from a series of dichotomous cut-off items that then lead to a step-based integer scale rather than a fully dimensional scale. Although these Indices can be calculated by hand, such integer-based scales, relative to dimensional, continuous scales, suffer from distributional and reliability problems because they assume only a limited number of values and fail to use all the available variance. For example, the Perceptual Thinking Index (PTI) is calculated with five individual algebraic statements or “steps” based on cut-off scores, each generating a value of 0 or 1, which are summed to create the total PTI score. One of the underlying steps is M− > 1 or X−% > .40; if either is true, one point is added to the PTI value. Thus, the index can only assume integer values from zero to five. Decimal or intermediate values, such as 3.5 are not possible. One might describe this integer-based, discontinuous structure as having “cliffs.” These cliffs limit the reliability of the index in that small changes in a few responses could have a large impact on the index. As an extreme example, miscoding a single human movement form quality minus response (M−) might add as much as three points to the PTI total by changing the outcomes for three steps that relate to form quality (i.e., using XA% and WDA% in Step 1, X−% in Step 2, and X−% or M− in Step 3). Theoretically, one might expect limitations in the validity of the scale because cliffs cause it to be less highly correlated with the latent construct that it measures, thought and perceptual disturbance, which would be a demonstration of how reliability can limit validity. Support for this hypothesis also comes from a recent review indicating that continuous measures of psychopathology are more valid and reliable than discrete measures (Markon, Chmielewski, & Miller, 2011). Thus, a fully dimensional PTI could improve reliability and validity and thus also improve interpretive accuracy in applied work.
The current study attempts to develop continuous variables corresponding to three of the CS clinical Indices and to demonstrate basic reliability and validity for using these variables. Based on available research findings (Meyer & Archer, 2001; Meyer, Hsiao, Viglione, Mihura, & Abraham, 2012; Mihura, Meyer, Dumitrascu, & Bombel, 2012; Viglione, 1999; Viglione & Hilsenroth, 2001; Viglione & Meyer, 2008), we chose two Indices with the most empirical support—the PTI and Suicide Constellation (S-CON)—and one index that has some support and a reasonable inference base related to coded behaviors that transparently generalize to extratest behaviors—the Hypervigilance Index (HVI). By convention within the CS, the S-CON is interpreted dichotomously as an indicator of suicide risk. The HVI is likewise dichotomously interpreted as a focused, effortful, detail oriented, and vigilant cognitive style. However, research (Lindgren & Carlsson, 2002; Meyer, 1997, 1999) has supported using the S-CON integer score as a dimensional indicator of distress and the HVI integer score for wariness and paranoid states. Thus, there is support for using them dimensionally as we do in this study rather than only as a dichotomous indicator. Indeed, the latent constructs of thought and perceptual disturbance, vigilance, and intensity of suicidal risk are dimensional in nature and thus are appropriately measured on a continuous scale. To develop continuous variables corresponding to the PTI, HVI, and S-CON, we substitute their dichotomous cut-scores and integer results with a regression-based model that produces continuous scores. To distinguish from the CS Indices, we call these new scores “Composites,” that is, the Thought and Perception Composite (TP-Comp), Vigilance Composite (V-Comp), and Suicide Concern Composite (SC-Comp).
Method
To produce the new Composites, the individuals variables included in the steps of the original CS Indices were used as predictors in multiple regression with the applicable CS clinical Index as the criterion. For example, we used all the variables found in the original five PTI steps, X−%, M−, and so on, as individual predictors with the PTI total score as the criterion variable. The raw score (b weight) prediction equations were then used to calculate the Composites, which were then tested for generalizability with an independent validation sample. The goal was to maximize the association between the original CS Index and its corresponding dimensional Composite score in the validation sample.
Variable Selection
Several modifications to the predictor variables from the original Indices were necessary. Some of the original CS steps use a deviation score rather than a simple frequency. For instance, S-CON Step 3 is positive if the Egocentricity Index is less than .31 or greater than .44. To create a dimensional variant of this variable in the model, we used the absolute value of the deviation from the mean of these two cut-points (i.e., |X − .375|). Similarly, for the S-CON criterion of P < 3 or P > 8, we used the absolute value of the deviation from the mean of these two cut-points (i.e., |X − 5.5|). The Zd score has such limited empirical support (Meyer, Viglione, Mihura, Erard, & Erdberg, 2011; Mihura et al., 2012) that its use is not advised. Given that it is likely not to be used consistently in the future, we replaced with a logical proxy based on the relative degree of complexity evident in selecting and synthetically linking inkblot locations. More specifically, we used the Location-Developmental Quality Complexity/R Index (Loc-DQ/R). Loc-DQ are the central variables in producing Zd, so that a low Zd score would correspond to a low Loc-DQ/R score. The fifth S-CON criterion contains a deviation algorithm, Zd < −3.5 or Zd > 3.5; consequently, the absolute value of the difference between Loc-DQ/R and its mean value in our developmental sample was used (|LQ-compl/R − 1.373|).
In addition, some predictor variables were transformed to reduce their skew and kurtosis. For example, distributions of FAB2, SumT, and MOR substantially diverged from a normal distribution so transformations were applied to prevent the final formulae of the Composites from being affected by nonnormality, excessive variability, and extreme outliers in any of the individual variables. Said differently, we wanted to avoid allowing a single extreme value in any of the individual variables to have an excessively large impact on the final score. In fact, ultimately, we found that the congruence between the integer Indices and continuous Composites at the interpretively important higher values was greatest when we took a very conservative approach of transforming variables with skew values greater than one. In all but two cases the square root transformation reduced the predictor variable skew sufficiently, but two variables required an inverse reciprocal to the second power transformation (−1/(x + 1)2; see Behrens, 1997). Eventually, all variables included in the analysis had absolute skew values ≤1 and absolute kurtosis values ≤1.5, except for the transformed FAB2 variable (skew = 2.17, kurtosis = 2.83).
Sample
We compiled a large sample of computerized Rorschach protocols from our available records. To fit with contemporary recommendations and data concerning administration to optimize the range of responses obtained (Dean, Viglione, Perry, & Meyer, 2007; Meyer et al., 2011), we used the same procedures as those used to generate the R-PAS norms to statistically model the number and distribution of responses in these protocols so they would closely approximate the distribution of responses observed on each of the 10 cards when using the R-Optimized (R-Opt) administration method. 1 This method encourages examinees to give two or three responses per card, prompts for another response if only one is given to any card, and stops collecting responses after the fourth to any card (see Meyer et al., 2011). Applying these R-Opt modeling procedures to our pool of protocols left 1,350 records. This sample included a substantial proportion of records from nonclinical controls and nonpatients or children. However, we wished to maximize predictions for adults and clinical patients, given that the three Indices address clinical issues and the S-CON is only calculated for adults. Consequently, all child records and most of the control and nonpatient records were removed. The final sample included 690 records, 100 of which were randomly selected from our pool of nonclinical controls or nonpatients. As expected, the distribution for R in this sample (M = 24.1, SD = 4.6) closely approximated the normative distribution for R (M = 24.2, SD = 4.7; Meyer et al., 2011).
Formulae for the Composites were developed within a randomly selected developmental sample (N = 460) and tested with a validation sample (N = 230). These 690 adult Rorschach records came from eight nonoverlapping subgroups, identified by patient status, evaluation context, diagnosis, or presenting problem. A total of 30.0% were from a mixed sample of inpatients and outpatients evaluated for psychiatric reasons, 28.7% were from offenders, 14.5% from control or nonpatients, 9.1% from trauma patients, 4.1% from patients with schizophrenia or other psychotic disorders, 3.5% from patients with depression or substance abuse, 1.9% from forensic psychiatric patients, and 8.3% from patients with other conditions. The same proportions of these subgroups were retained in the developmental and validation samples.
Men comprise 56.6% of the sample and the mean age is 35.04 years (SD = 11.54). 2 More than 50 examiners contributed protocols to the sample. Ethnicity is not well documented in some of these archival, computerized files. However, in the largest subsample of mixed inpatients and outpatients, almost one third of these individuals are African American.
Results
We used the same strategy and method for calculating the three Composites. At first, multiple regression equations were established within the developmental sample using the original CS target index as the dependent variable and fully dimensional versions of its component scores as predictors. Nonsignificant predictors were removed and a new model was tested. The prediction equation derived from the raw score b values produces a fully dimensional total score to replace the original CS integer score. Each prediction equation was then used to calculate this new dimensional scale in the derivation sample and subsequently in the independent validation sample.
Descriptive data in Table 1 reveal that the distributions of the Composites closely resemble the original Indices. Standard deviations are smaller for the all three Composites as a result of regression to the mean. However, this reduction in variability also may be related to less error in the Composites from replacing the individual integer steps with dimensional scores. Because of the smaller SDs interpretive ranges to designate high, clinically relevant values will be slightly lower for the Composite variables in contrast to the original CS Indices.
Descriptive Data for Responses, Original Comprehensive System Indices, and New Dimensional Composites.
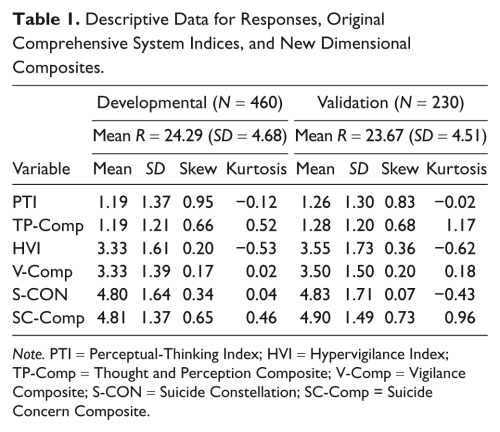
Note. PTI = Perceptual-Thinking Index; HVI = Hypervigilance Index; TP-Comp = Thought and Perception Composite; V-Comp = Vigilance Composite; S-CON = Suicide Constellation; SC-Comp = Suicide Concern Composite.
TP-Comp
Table 2 provides information on the original Indices and their regression-based dimensional alternatives. When predicting the PTI, the transformed variable for Level 2 Special Scores (Lvl2), (−1/(Lvl2 + 1)2), was not a significant contributor and it was removed from the analysis. All other variables were significant. Within the developmental sample, the overall model was significant, F(6, 453) = 250.808, p < .001, with a multiple R = .88. In the independent validation sample, the correlation between the TP-Comp and the observed PTI was .87. Distribution data in Table 1 reveal that the original PTI and new TP-Comp are highly similar. A supplemental table available from the first author provides the mean, SD, and confidence interval for the Composite scores at each value of the original CS Index for both the developmental and the validation samples. These results illustrate the regression to the mean noted before. For instance, PTI values of 2, 3, 4, and 5 equate to lower TP-Comp values, with corresponding means of about 1.8, 2.5, 3.5, and 4.5.
Individual Variables Used in the Original CS Indices and in the Multiple Regression Equations to Create Dimensional Composite Alternatives.

Note. CS = Comprehensive System; PTI = Perceptual-Thinking Index; HVI = Hypervigilance Index; S-CON = Suicide Constellation. The final regression equations are derived by multiplying each variable by its raw b value, summing the results, and adding the constant. For instance, the TP-Comp score is obtained from the following equation: TP-Comp = 1.939 − 2.478 * (WDA%) + 5.396 * (X−%) + .586 * (−1/(FAB2 + 1)2) − .016 * (R) + .186 * (√WSum6) + .335 * (√MQ−).
−1/(Lvl2 + 1)2 was not significant and it was removed from the analysis; XA% was excluded because it is essentially the complement of X−%. In the developmental sample it was correlated with X−% at −.960 (p < .001).
R was not significant and it was removed from the analysis.
V-Comp
All V-Comp predictor variables were significant and the model was significant, F(8, 451) = 171.372, p < .001, with a multiple R = .87 in the developmental sample. The correlation between the V-Comp and the observed HVI within the validation sample was .86. As with TP-Comp, a close correspondence between the Index and Composite at all points of the original scale was achieved. Again, at the more extreme high HVI values, the corresponding V-Comp mean values are less, again demonstrating regression to the mean. HVI values of 5, 6, 7, and 8 have corresponding V-Comp means of approximately 4.5, 5.5, 6.0, and 7.0.
SC-Comp
R was not significant and was excluded from the regression analysis. Within the developmental sample, the model was significant, F(11, 448) = 94.054, p < .001, with a multiple R of .84. The correlation with the observed S-CON in the validation sample was .79. Descriptive data for the validation sample in Table 1 reveal nearly identical means. Because of regression to the mean, S-CON values of 6, 7, 8, and 9 have corresponding SC-Comp means of roughly 5.7, 6.5, 7.0, and 8.0.
Interrater Reliability
Initial interrater reliability data for the Composites was recently investigated in a sample of 50 Rorschach records collected with R-Opt administration (Viglione, Blume-Marcovici, Miller, Giromini, & Meyer, in press). This sample was diverse in terms of age, sex, ethnicity, educational background, and patient status, and 16 examiners were involved. The exact agreement intraclass correlations for a single rater (ICCs) for the Composites and Indices are shown in Table 3 (upper part). To determine whether the interrater reliability for the new Composites exceeded that of the corresponding original Indices we used procedures to compare coefficients derived from the same sample that do not share overlapping variables (Raghunathan, Rosenthal, & Rubin, 1996). The statistical test compares coefficients using the Pearson-Filon statistic after they are transformed to Fisher’s Zr (ZPF). To obtain an effect size associated with these comparisons, the difference in the Zr coefficients was converted back from the Zr metric to the r metric. The resulting ZPF and r difference (r Diff) values shown in Table 3 indicate that the reliability of the TP-Comp and V-Comp is superior than the reliability of the original Indices (Table 3, upper part).
Intraclass Correlation Coefficients for Interrater Reliability of the Dimensional Composites and Original Indices.

Note. PTI = Perceptual-Thinking Index; HVI = Hypervigilance Index; TP-Comp = Thought and Perception Composite; V-Comp = Vigilance Composite; S-CON = Suicide Constellation; SSC-Comp = Suicide Concern Composite; ICC = intraclass correlations for a single rater; ZPF = Fisher’s Zr; r Diff = r difference; R-Opt = R-Optimized. All individual ICCs are significant at p < .001.
ICCs for Composites were initially reported in Viglione et al. (2012).
ICCs for Indices were initially reported in Viglione and Taylor (2003).
ICCs for Indices were initially reported in Meyer et al. (2002).
To test further the expected reliability gains with the Composites over the Indices, we also reanalyzed two previously published data sets. In 2003, Viglione and Taylor reported strong interrater reliabilities for CS variables in a mixed clinical and nonpatient sample of 84 individuals. According to our new analyses, the interrater reliability for each of the Composite scores falls in the excellent range and is significantly greater than the corresponding Index reliability (Table 3, middle part). In 2002, Meyer et al. described interrater reliability for CS variables in several samples collected by students (N = 66) and clinicians (N = 153). Given that the entire Meyer et al.’s sample size was large enough to select a subset of records with the R-Opt modeling procedure, we computed the analyses both within the original and within the R-Opt modeled samples (Table 3, lower part). Compared with the CS Indices, the Composites demonstrated higher ICCs in all 18 comparisons, with significant differences (p < .05) in 13. Taken together, these results indicate interrater reliability will be higher using the dimensional Composites rather than the original CS Indices.
Validation
To investigate validity, we calculated the Indices and new Composites in previously published studies. Dean et al. (2007) investigated the PTI among 61 residential care respondents, 31 of whom had psychotic disorders. These individuals were randomly assigned to either a CS Rorschach administration or an alternative administration designed to control the number of responses, similar to the R-Opt procedure. In the original study, the PTI correlated at .381 (p < .01) with a synthetic measure of thought disorder based on semistructured interview, speech sample, and self-report. The correlation between the thought disorder measure and the new TP-Comp was .434 (p < .01). The difference between the two correlations was tested using procedures for comparing correlations obtained from the same sample that share a common variable (Meng, Rosenthal, & Rubin, 1992). This comparison was not statistically significant, Z = .866, p = .386, but was in the expected direction. In addition, when only the R-Opt like alternative administration records (n = 31) were selected and the validity correlations recalculated, the TP-Comp seemed to be more valid than the PTI. Indeed, the PTI correlated .435 (p < .05), whereas the TP-Comp correlated .615 (p < .001); the difference between the two correlations is statistically significant, Z = 2.360, p = .018, and of medium size, r difference = .246. In contrast, when only the standard CS administered records (n = 30) were selected, neither the PTI (r = .33, p > .05) nor the TP-Comp (r = .28, p > .05) significantly correlated with the measure of thought disorder. These results suggest that response distributions consistent with R-Opt administration increases validity over standard CS administration, and within that context TP-Comp has better validity than the PTI.
Another set of analyses for the PTI and TP-Comp was derived from a sample of 432 consecutive evaluations in a hospital-based assessment service in Chicago (Meyer, 2002). Data have previously been reported on two proxy measures of psychotic functioning using diagnostic information obtained from billing records before the psychological testing was initiated: (a) diagnosis of a psychotic disorder and (b) severity of disturbance based on 5-point continuum derived from the most severe diagnosis assigned (see Dawes, 1999; Meyer, 2002; Meyer & Resnick, 1996; Viglione & Hilsenroth, 2001). Table 4 contains the correlations with these two proxy criterion measures and shows both the correlations within the whole sample and within the subset of R-Opt modeled records. In one of the four validity coefficient comparisons, the TP-Comp was superior to the PTI, though with a small effect size.
Composite Correlations With Psychosis and Diagnostic Severity in the Chicago Sample.
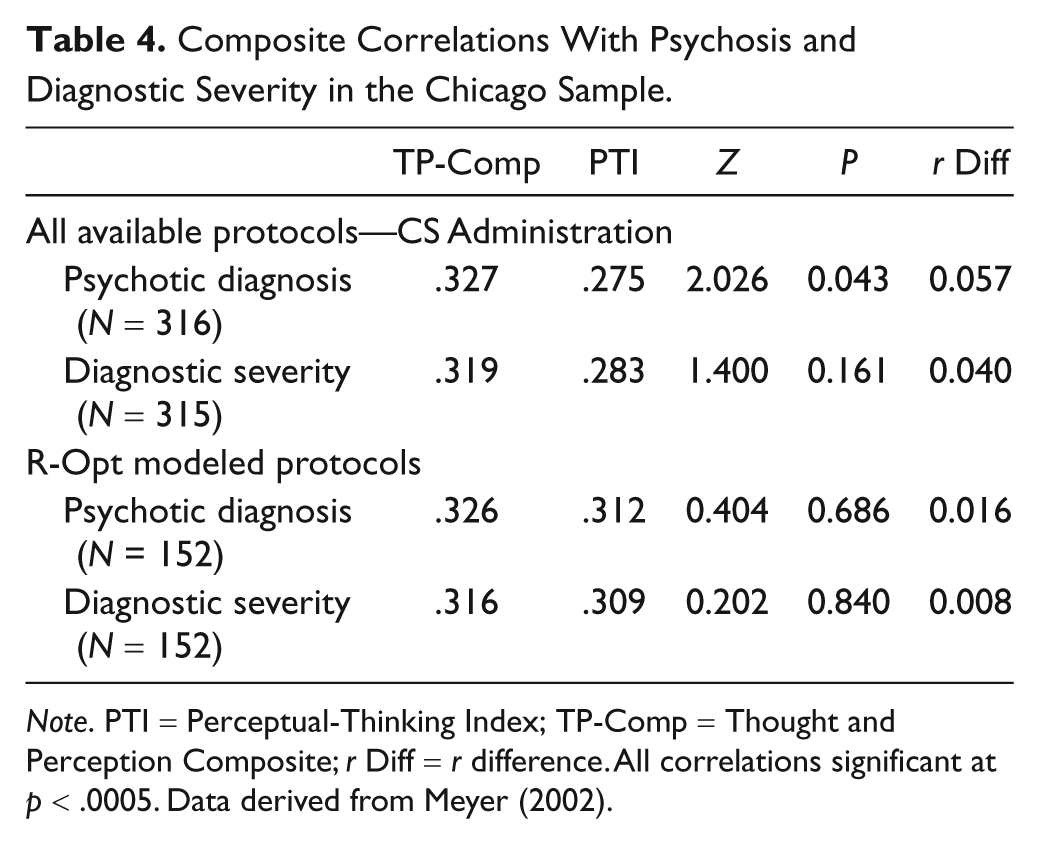
Note. PTI = Perceptual-Thinking Index; TP-Comp = Thought and Perception Composite; r Diff = r difference. All correlations significant at p < .0005. Data derived from Meyer (2002).
Meyer (1997, 1999; Meyer, Riethmiller, Brooks, Benoit, & Handler, 2000) reported on 87 clients selected from this same sample on the basis of concordant response style on the Rorschach and the Minnesota Multiphasic Personality Inventory–2 (MMPI-2). When test-taking response styles on the two tests were similar, as measured by markers of each test’s first factor, the CS Indices were substantially correlated with corresponding MMPI-2 Indices. When response styles differed between the two tests, correlations were either not significant or negative. Using patients with concordant test-taking styles, Table 5 provides the correlation of the CS Indices with their corresponding MMPI-2 criteria reported in Meyer (1999), as well as correlations for the corresponding Composites from the current study, along with significance tests contrasting the two correlations. 3 Overall, these correlations suggest equal validity for the clinical Indices and Composites. As explained in the original articles, readers should keep in mind that these are artificially inflated coefficients using just a subset of the original data after aligning method variance.
Composite Correlations With Corresponding MMPI-2 Scales, N = 85.
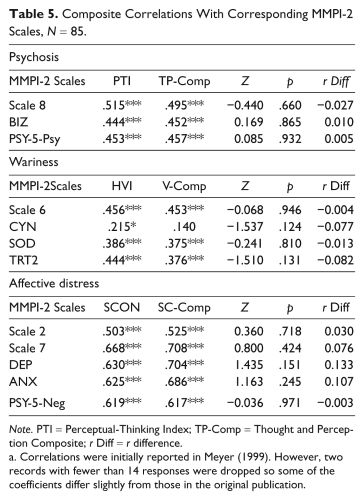
Note. PTI = Perceptual-Thinking Index; TP-Comp = Thought and Perception Composite; r Diff = r difference.
Correlations were initially reported in Meyer (1999). However, two records with fewer than 14 responses were dropped so some of the coefficients differ slightly from those in the original publication.
Discussion
Our aim was to develop continuous versions of the PTI, HVI, and S-CON in order to gain reliability and precision over the cut-off-based integers used by the CS Indices. We used dimensional versions of all the individual variables contained in the Indices and multiple regression to create the continuous Composite variables. Using a relatively large developmental sample (N = 460), we created the TP-Comp, V-Comp, and SC-Comp from the raw regression coefficients applied to the individual predictor variables. These three continuous Composites were tested in a validation sample (N = 230), where the correlation between the original and new score and the overall distribution parameters revealed a high degree of similarity. According to these results, TP-Comp, V-Comp, and SC-Comp are sufficiently identical to the three original CS Indices that they can be substituted for them. Overall, our results suggest that the three Composites have superior interrater reliability and are at least as valid as the original Indices. At the same time, however, it should be pointed out that these new Composites are statistically complex and cannot be calculated by hand, 4 whereas their CS predecessors were not so limited.
As would be expected with regression toward the mean, extreme low values in the original CS Indices correspond to slightly higher new Composite values, and extreme high values in the original CS Indices correspond to slightly lower new Composite values. In terms of clinical interpretations, however, this should not pose a problem as the results presented here show that one should merely adjust the interpretive ranges from the original Indices to fit the new, slightly narrower Composite distributions. Drawing on data from both the development and validation samples to stabilize results coming from the tail ends of the distributions where observations are not numerous, we can offer interpretive guidelines for the new Composites by linking them to their equivalent scores on the original Index. In all instances, we would expect Composite scores to be lower than Index scores. For instance, PTI values of 3, 4, and 5 roughly correspond to TP-Comp values of 2.5, 3.5, and 4. Thus, a TP-Comp score of 3.5 suggests considerable concern about disturbed thinking and distorted perceptions of reality. Previously, a PTI score of 3 has been interpreted as evidence of unusual thinking and perception. TP-Comp scores approaching values of 2.5 should be interpreted in a similar fashion.
As noted earlier, the HVI in the CS is traditionally interpreted as dichotomous variable, though Meyer (1999) and Lindgren and Carlsson (2002) found support for its use as a dimensional variable. Moreover, it measures a focused, effortful, detail oriented, and vigilant cognitive style. It thus requires some cognitive sophistication and psychological differentiation. HVI values of 5, 6, 7, and 8 have corresponding V-Comp means of about 4.5, 5.5, 6.0, and 7.0. From Table 1 it can be seen that a V-Comp score of 4.5 is almost one standard deviation above the mean. Taking these data together, a V-Comp score exceeding 4.5 suggests a modest degree of a focused, effortful, detail-oriented, and vigilant cognitive processing. A score of 5.5 suggests a more extreme, inflexible, and vigilant cognitive style.
For the SC-Comp, a similar approach to anchoring interpretation is recommended. From the literature an S-CON score of 7 suggests possible Suicide Concern that might or might not be evident in self-report and a score of 8 indicates probable Suicide Concern (Fowler et al., 2001; Viglione & Hilsenroth, 2001). S-CON values of 6, 7, 8, and 9 have corresponding SC-Comp means of roughly 5.7, 6.5, 7.0, and 8.0. Thus, an SC-Comp score of 6.5 or above serves as a suitable replacement for the S-CON score of 7, and would, therefore, suggest possible suicide risk. We also recommend that an SC-Comp score of 7 be interpreted as suggesting a possible Suicide Concern that is worthy of being evaluated, though with recognition of the risk for false positive scores. An SC-Comp score of 8 should be interpreted as indicating a more worrisome risk suicide.
The high similarity between the Indices and Composites indicates they are nearly identical and should have the same network of relationships with important criteria. Nevertheless, the validity findings reported here suggest the new TP-Comp is more valid than the PTI, suggesting the continuous, dimensional distribution of the TP-Comp offers an advantage in capturing more variance. The validity data for the V-Comp and SC-Comp relied on more limited criteria and produced less conclusive results, suggesting that the validity of these Composites approximates that of the original Indices. All three Composites clearly have superior interrater reliability. Because of this better reliability, which comes from being continuous rather than integer based, these Composites will likely be less affected by scoring errors when used in the field, thus improving assessment accuracy in clinical and forensic evaluations.
A limitation of this research is that the great majority of the records used across the analyses were administered by CS methods and statistically modeled to approximate R-Opt administration. However, our reliability sample obtained using R-Opt procedures performed just like the modeled samples, suggesting that the findings should generalize across modes of administration. This point is reinforced by seeing how similar the validity results are in Table 4 for the original Chicago protocols and for the protocols that remained after R-Opt modeling. Finally, the strong validity support for the early R-Opt administration method used in the Dean et al. (2007) data suggests that the TP-Comp findings should generalize to the R-Opt administration procedure in R-PAS. 5 Another limitation of this study concerns the type of psychopathology and the patient status represented in these records, such that some populations may be overrepresented (e.g., forensic) and others underrepresented (e.g., trauma). Accordingly, future studies should test the validity of these scales with the R-Opt administration method, specific clinical populations, and appropriate criteria. Also, in future research it would be worthwhile to explore how simple z-score sums of variables might perform instead of using regression weighted variables when creating new versions of these Indices.
Another avenue is opened by placing the V-Comp and SC-Comp on continuous scales so that research can address the validity of these two Composites with dimensional criteria. For the V-Comp, one can identify potential correlates associated with vigilance, paranoid processing, and other cognitive and interpersonal phenomena. For the SC-Comp one could address psychological issues such as suicide intentionality or despair. Also, determining whether there are correlates to low scores on all three scales would be useful.
Footnotes
Declaration of Conflicting Interests
The authors declared no potential conflicts of interest with respect to the research, authorship, and/or publication of this article.
Funding
The authors received no financial support for the research, authorship, and/or publication of this article.