
Abstract
Trait Negative Affect (NA) and Positive Affect (PA) are strongly associated with Neuroticism and Extraversion, respectively. Nevertheless, measures of the former tend to show substantially weaker self–other agreement—and stronger assumed similarity correlations—than scales assessing the latter. The current study separated the effects of item content versus format on agreement and assumed similarity using two different sets of Neuroticism and Extraversion measures and two different indicators of NA and PA (N = 381 newlyweds). Neuroticism and Extraversion consistently showed stronger agreement than NA and PA; in addition, however, scales with more elaborated items yielded significantly higher agreement correlations than those based on single adjectives. Conversely, the trait affect scales yielded stronger assumed similarity correlations than the personality scales; these coefficients were strongest for the adjectival measures of trait affect. Thus, our data establish a significant role for both content and format in assumed similarity and self–other agreement.
Personality and affective structure both are defined by two common core constructs (Watson, Wiese, Vaidya, & Tellegen, 1999). One involves active engagement with the environment, reward pursuit, and sensitivity to signals of reward. This dimension is commonly referred to as Extraversion (McCrae & Costa, 1987), Positive Emotionality (PE), or Positive Affect (PA; Watson, Clark, & Tellegen, 1988; Watson et al., 1999). The other primary dimension is defined by avoidance, sensitivity to cues of punishment, and tendencies toward emotional lability and frequent negative emotional states. This general dimension is typically referred to as Neuroticism (McCrae & Costa, 1987), Negative Emotionality (NE), or Negative Affect (NA; Watson et al., 1988; Watson et al., 1999).
The alternate labels represent theoretically meaningful differences in the hypothesized constructs underlying these dimensions. Nevertheless, specific measures of these alternative constructs tend to be highly correlated with one another. Within raters, Extraversion scales show consistently strong relations with measures of PA and PE (Watson, 2000; Watson & Clark, 1997; Watson et al., 1999), and measures of Neuroticism show consistently strong relations with indicators of NA and NE (Watson, 2000; Watson et al., 1999). These patterns of convergence do not hold in all circumstances, however. Specifically, self–other agreement for Neuroticism and Extraversion tends to be stronger than self–other agreement for NA and PA, respectively, despite these strong within-rater correlations (Watson & Humrichouse, 2006).
Review of Prior Evidence
Description of Samples
These effects are robust. To demonstrate the consistency of these differences, we examined six samples of well-acquainted individuals who completed both self- and other-ratings of Neuroticism, Extraversion, NA, and PA. The Neuroticism and Extraversion data were collected using either the Big Five Inventory (BFI; John & Srivastava, 1999) or the NEO Five-Factor Inventory (NEO-FFI; Costa & McCrae, 1992). The NA and PA ratings all are based on the general, trait version of the Positive and Negative Affect Schedule (PANAS; Watson et al., 1988).
The friendship sample consisted of 279 dyads from the Iowa City area (for more details, see Watson, Hubbard, & Wiese, 2000b). The participants had known each other for an average of 33.6 months. The first dating sample (N = 272) is described in greater detail in Watson et al. (2000b). It consisted of 136 heterosexual couples from the Iowa City area who had known each other for an average of 36.0 months and had been dating for an average of 18.2 months. The second dating sample (N = 178) consisted of 89 heterosexual couples from the Iowa City area who had known each other for an average of 36.1 months and had been dating for an average of 22.8 months. The newlywed sample consisted of participants in the longitudinal Iowa Marital Assessment Project (IMAP; see Watson et al., 2004; Watson & Humrichouse, 2006). We analyzed self- and spouse-ratings from 572 participants at the Time 1 IMAP assessment, when they had been married approximately 5 months on average (Watson et al., 2004). The first married sample (N = 148) is described in Watson et al. (2000b); it consisted of 74 couples from the St. Louis area who had been married an average of approximately 17 years. The second married sample (N = 124) consisted of 62 couples from the Iowa City area who had been married, on average, slightly more than 8.5 years.
Convergence Between Neuroticism/NA and Extraversion/PA
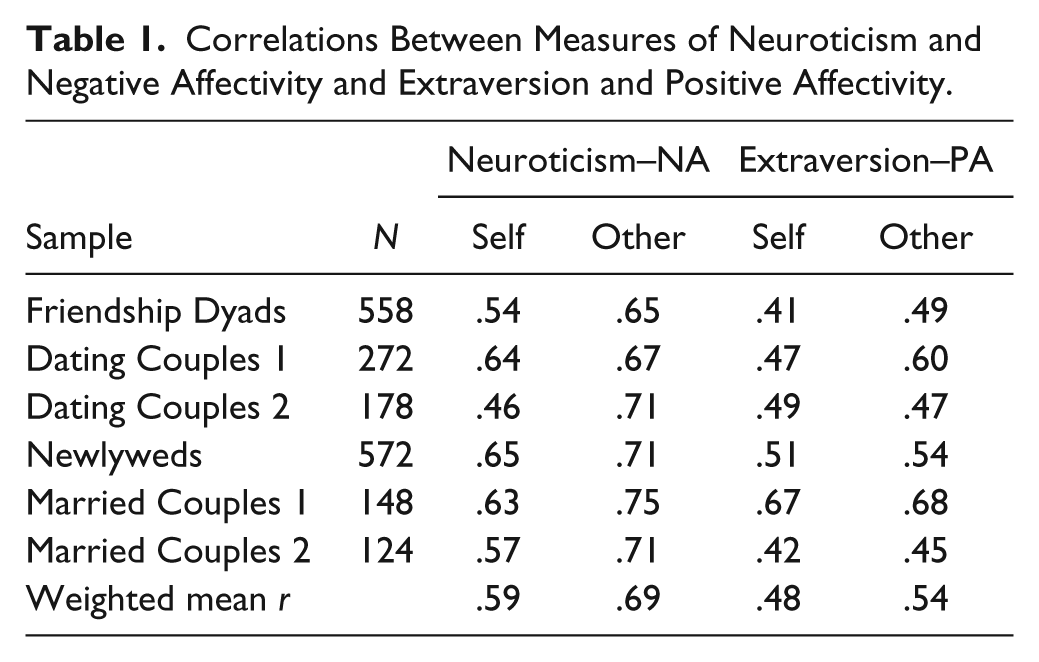
Table 1 establishes the level of convergence between (a) Neuroticism and NA and (b) Extraversion and PA within both self- and other-ratings across all six samples. First and foremost, these relations are uniformly strong, with weighted mean correlations ranging from .48 (Extraversion vs. PA in the self-ratings) to .69 (Neuroticism vs. NA in the other-ratings). In addition, it is worth noting that Neuroticism–NA correlations (overall weighted mean r = .64) tend to be stronger than Extraversion–PA correlations (mean r = .51), irrespective of rater.
Correlations Between Measures of Neuroticism and Negative Affectivity and Extraversion and Positive Affectivity.
Self–Other Agreement
One generally would expect that measures that correlate highly with one another would display very similar properties. This clearly is not the case with regard to self–other agreement, however. Table 2 presents the self–other agreement correlations for each of these measures in the same six samples, and the differences are striking: Agreement is significantly—and substantially—stronger for Neuroticism (weighted mean r =. 51) than for NA (mean r = .28; z = 9.28, p < .01), and is much stronger for Extraversion (mean r = .54) than for PA (mean r = .31; z = 9.14, p < .01); moreover, these differences are highly robust and consistently are in the same direction across samples. Thus, despite the strong within-rater convergence between NA and Neuroticism and between PA and Extraversion, trait affect clearly shows much weaker agreement across raters.
Agreement, Assumed Similarity, and Similarity Correlations Across Samples.
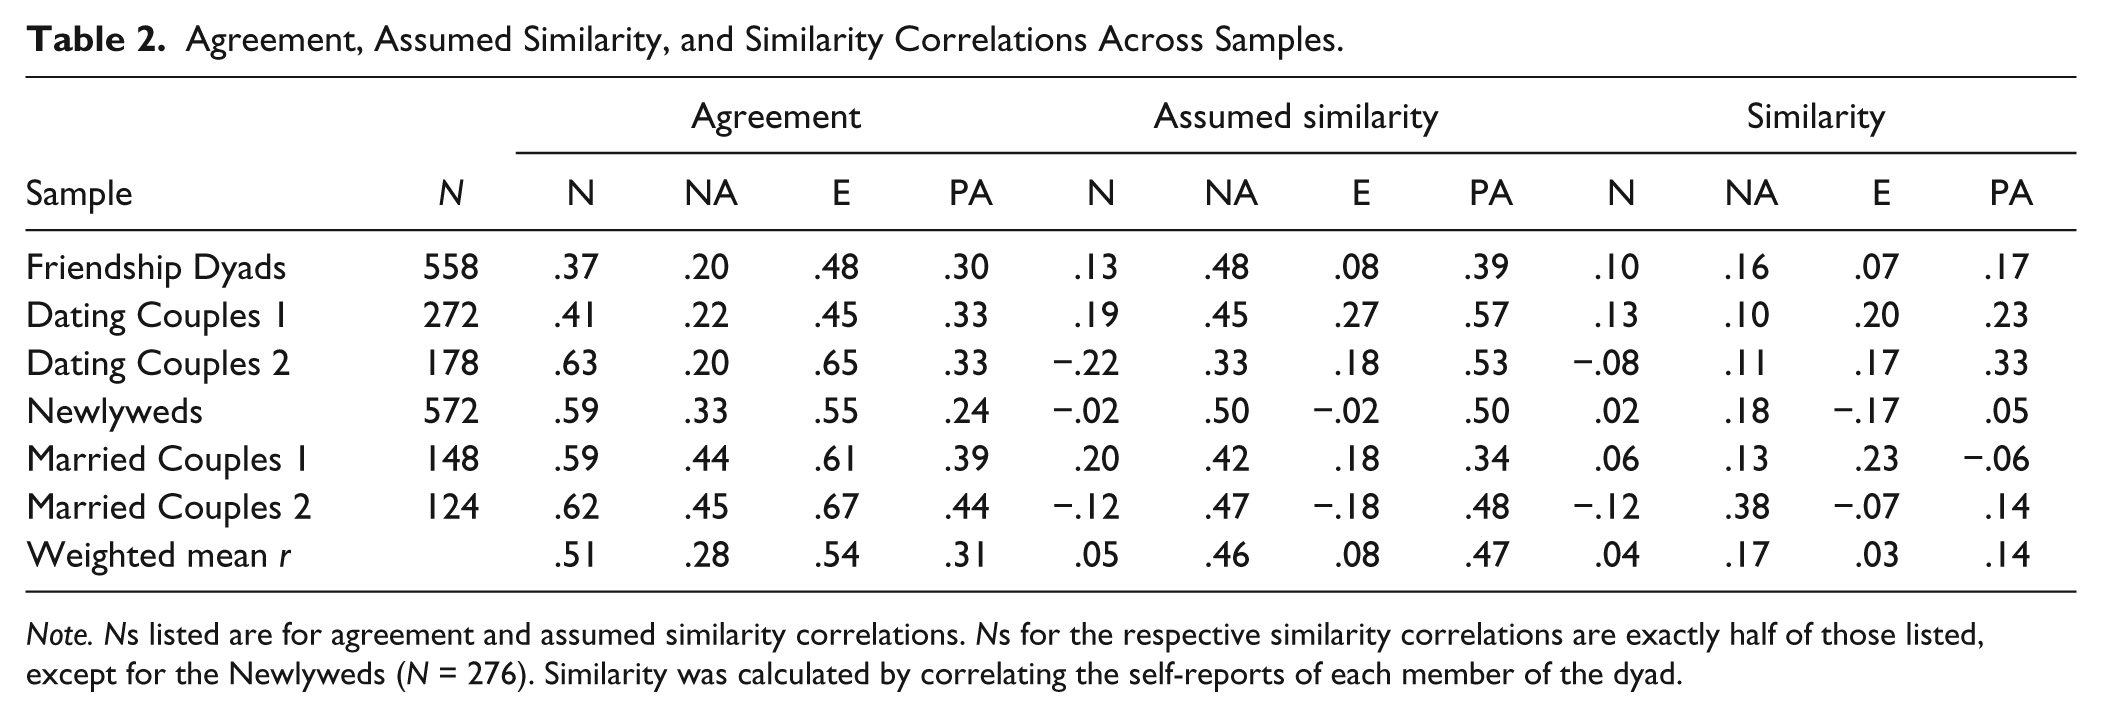
Note. Ns listed are for agreement and assumed similarity correlations. Ns for the respective similarity correlations are exactly half of those listed, except for the Newlyweds (N = 276). Similarity was calculated by correlating the self-reports of each member of the dyad.
Assumed Similarity
Another way to consider this asymmetry is in projective effects. The center columns of Table 2 present the assumed similarity correlations (i.e., correlations between an individual’s self-rating and his or her rating of another) for each trait across these samples. Again, the differences are striking. Assumed similarity consistently is significantly—and substantially—stronger for NA (weighted mean r = .46) than for Neuroticism (mean r = .05; z = 16.37, p < .01) and is much higher for PA (mean r = .47) than for Extraversion (mean r = .08; z = 14.41, p < .01). It also is noteworthy that the mean assumed similarity correlations for NA and PA (rs = .46 and .47, respectively) are higher than their average agreement coefficients (rs = .28 and .31, respectively; see Table 2). In other words, trait affect ratings of well-acquainted others actually provide more information about the judge providing the rating than they do about the purported target of that rating.
This is particularly remarkable given that the actual similarity correlations (i.e., the correspondence between self-ratings from each member of the dyad, presented on the far right in Table 2) ranged from only .03 (Extraversion) to .17 (NA) across the samples described above, following the general trend that actual similarity is relatively low for personality/affectivity in naturally occurring relationship dyads (Eysenck, 1990; Watson et al., 2000b; Watson et al., 2004). In light of this, assumed similarity can be considered to be an error in judgment; more specifically, it has been suggested that individuals may rely on their own standing on a trait as a heuristic when making judgments of others in the absence of adequate trait-relevant information (Ready, Clark, Watson, & Westerhouse, 2000; Watson et al., 2000b). This notion is supported by the fact that assumed similarity estimates in variable-centered analyses are stronger for traits that show lower self–other agreement (Watson et al., 2000b) and that stranger ratings generate stronger assumed similarity correlations for more evaluative and less visible traits (Beer & Watson, 2008). Thus, it is a matter of some concern that trait affect scales show much stronger evidence of assumed similarity than do measures of Neuroticism and Extraversion.
Data From Other Samples
To our knowledge, the data reviewed in Tables 1 and 2 represent the only published attempts to evaluate convergence, agreement, and assumed similarity among Neuroticism and Extraversion and NA and PA in the same sample. However, other published research supports some of these specific findings. As mentioned previously, within-rater relations among Extraversion and PA (Lucas, Diener, Grob, Suh, & Shao, 2000; Watson & Clark, 1997) and Neuroticism and NA (e.g., Watson et al., 1999) are well established. In terms of agreement, a recent meta-analysis revealed moderate to strong agreement for both Neuroticism (mean self–spouse r = .43, mean self–friend r = .33) and Extraversion (mean self–spouse r = .50, mean self–friend r = .40; Connelly & Ones, 2010). In contrast, in the first systematic attempt to evaluate self-peer convergence in trait affectivity, Watson and Clark (1991) reported lower agreement correlations, with estimates ranging from .15 to .35 for specific negative affect scales and an agreement correlation of .19 for general positive affect for ratings made by best-acquainted peers; these effect sizes were roughly in line with those available in the extant literature at that time. Subsequently, Diener, Smith, and Fujita (1995) reported self-informant (family and/or friends) correlations of .54 for Love, .45 for Joy, and between .24 and .44 for specific negative emotions (fear, shame, anger, and sadness). In addition, McCrae (1982) reported a weaker self–spouse agreement correlation for an affective facet of the NEO Extraversion domain (Positive Emotions, r = .36) relative to the other Extraversion facets (rs ranged from .47 to .56). Taken together, these findings suggest that the six-study quantitative review presented earlier is generally representative of the extant research.
Understanding These Differences
Significance of These Differences
It is important to understand the mechanisms underlying these striking differences for several reasons. In particular, interjudge agreement long has played a crucial role in establishing the validity of trait scales and, more fundamentally, in confirming the existence of the underlying traits themselves. Indeed, Kenrick and Funder (1988) used the existence of significant interobserver agreement to refute the argument that traits have no real existence and simply reflect implicit personality theories that exist “in the eye of the beholder” (table 1, p. 24; see also Watson et al., 2000b). Clearly, the dramatic differences displayed in Table 2 (with mean agreement correlations ranging from .28 to .54 across traits) yield rather different conclusions regarding both the convergent validity of the scales and the extent to which they tap real, consensually shared dimensions of individual differences.
In addition, understanding these differences potentially has important implications for the conduct of trait research. More specifically, understanding these data can help us define and interpret multimethod structural models, as poor convergence between indicators of a putative latent construct because of a measurement artifact could obscure the nature of the underlying trait (see DeYoung, 2006). Put differently, it is much more challenging to define a latent trait variable when the putative indicators of that construct do not converge well (as in the case of measures of trait affect). Consequently, it is important to understand the processes that influence the level of convergence between different indicators of a trait.
Finally, understanding these differences can provide crucial insight into the nature of trait ratings and shed light on the processes involved in person perception. For example, as we discuss in greater detail subsequently, if certain types of formats produce better agreement irrespective of core scale content, this effect may occur via the employment of a different kind of information processing strategy that is used when the information is presented in a certain form.
Explanations for These Differences
There are two primary possible explanations for the PANAS scales’ relatively poor cross-rater agreement. First, affective constructs are generally considered to be subcomponents of personality traits, which also encompass related behaviors and cognitive and motivational processes, such that the strong within-rater relations between them stem from affective content that is shared across measures. However, affective traits are considered to be less “visible” than global personality traits due to their more internal, subjective nature—affective states do not always manifest themselves in observable behavior. Thus, this explanation emphasizes systematic differences in item content. For example, an examination of the range and type of content (see Table 3) in the BFI Extraversion and PANAS PA scales (Watson et al., 1988) reveals some clear distinctions. Most notably, there are no PANAS analogs to BFI items tapping social engagement (e.g., “I see myself as someone who is talkative”), which comprise the bulk of the scale. In fact, only two BFI Extraversion items map cleanly onto PANAS PA items: “I see myself as someone who is energetic” (PANAS: “active”) and “I see myself as someone who generates a lot of enthusiasm” (PANAS: “enthusiastic”).
Item Content Comparison.
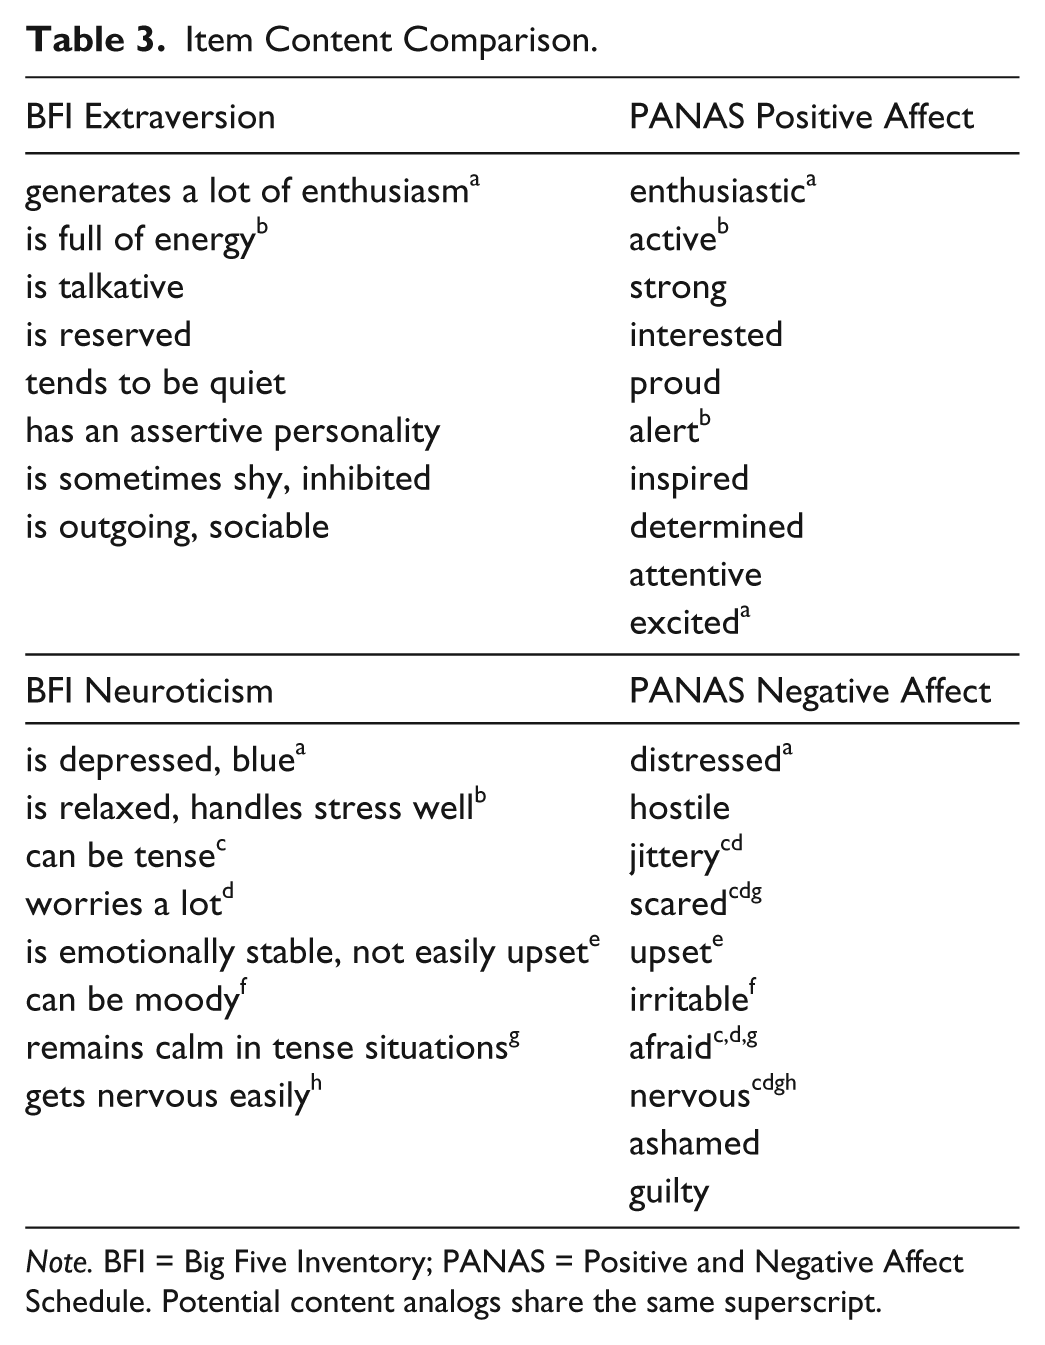
Note. BFI = Big Five Inventory; PANAS = Positive and Negative Affect Schedule. Potential content analogs share the same superscript.
Thus, it is plausible that differences in self–other agreement for PA and Extraversion are inherent in the nature of the constructs: PA taps the frequency with which one feels positive emotions, whereas Extraversion taps a broader range of experience, including, for example, consistent engagement in—and preference for—social endeavors. The internal quality of feelings such as “strong,” “proud,” and “inspired” may render them more difficult for even close others to identify accurately. Put differently, these differences could reflect the well-established trait visibility effect—that is, easily observable personality traits (i.e., those with clear, frequent behavioral manifestations) might yield better interjudge agreement and higher self–other correlations than do more internal, subjective traits (Funder, 1995; Watson et al., 2000b).
However, a content-based argument is much more difficult to make in explaining differences between Neuroticism and NA. As Table 3 demonstrates, only “guilty,” “ashamed,” and “hostile” on the PANAS fail to correspond to some degree with item content represented on the BFI Neuroticism scale. In this regard, it is noteworthy that Pytlik Zillig, Hemenover, and Dienstbier (2002) did an extensive analysis of the BFI items, dividing their content into behavioral, cognitive, and affective components. As would be expected based on an inspection of Table 3, their analyses revealed that only 22.7% of the content in the BFI Extraversion scale was affective in nature. In sharp contrast, however, the content of the BFI Neuroticism scale was overwhelmingly affective in nature; in fact, Pytlik Zillig et al. (2002) classified 75.3% of its content as affective. Consequently, these NA and Neuroticism scales are roughly equivalent in terms of internality, rendering a pure content-based explanation for differences in self–other agreement rather implausible.
A second possible explanation lies in format differences. One important difference is that affect measures—including the PANAS—tend to employ single adjectives (e.g., “nervous”) or short phrases (e.g., “at ease”) as items, whereas most measures of global personality typically use more elaborated items, such as sentences or longer phrases. Some previous research has suggested that the use of single adjectives leads to lower self–other agreement (DeYoung, 2006). Additionally, the PANAS asks respondents to use a 5-point response scale (1 = very slightly or not at all, 5 = extremely) assessing the extent to which they (or a rated target) feel a certain way in general, whereas standard personality inventories employ different response formats (e.g., a 5-point agree/disagree scale in which respondents evaluate the extent to which a sentence describes them). Perhaps there is something psychologically distinct about evaluating oneself or others in terms of extremity of adjectives versus accuracy of sentences.
One possible mechanism through which this format difference could influence agreement and/or assumed similarity is by influencing the level of information processing (Craik & Lockhart, 1972) occurring during the rating task. To understand a sentence, constituent word meanings must be elaborated, which leads to better recall for these words (Craik & Tulving, 1975) and may well have implications for the memory search process that raters use when considering the item. It has also been suggested that processing two words in a sentence may conjointly activate their compatible semantic relations (Prior & Bentin, 2003). Thus, “I lead a full and active life” may bring to mind specific associations between one’s self-concept and his or her level of activity, and “She/he leads a full and active life” may bring to mind specific associations between one’s concept of the target and his or her level of activity. It may be that this type of synergistic elaboration does not occur when terms are presented without sentential context, such that this shallower processing in both self and target evaluations attenuates the convergent validity estimates and increases the likelihood that perceivers rely on heuristic cues to make these assessments.
The Current Study
Is it possible that something as simple as format could lead to these dramatic differences between closely related constructs? To test this hypothesis, we asked newlywed couples to rate both themselves and their spouses on (a) two different measures of Neuroticism and Extraversion and (b) two alternate versions of NA and PA. In terms of the former, participants’ trait characteristics were assessed using the BFI and adjective scales selected from Goldberg’s (1992) list of Big Five factor markers (see Chmielewski & Watson, 2009). In terms of the latter, we collected trait affect ratings using both the PANAS and the Temperament and Emotion Questionnaire (TEQ; Watson, 2004; see also Chmielewski & Watson, 2009). As is described in more detail in the Method section, the TEQ was created by embedding descriptors from the Expanded Form of the PANAS (PANAS-X; Watson & Clark, 1999) into complete sentences (Watson, 2004); the items are rated using a 5-point agree/disagree format.
Consequently, our study included measures of personality and trait affectivity based on both single adjectives (Goldberg, PANAS) and more elaborated items (BFI, TEQ). This unique 2 × 2 design allows us to separate the effects on content versus format on agreement and assumed similarity. The resulting patterns of correlations among the scale scores can determine the extent to which each is responsible for differences in agreement and assumed similarity between measures of trait affect and indicators of Neuroticism and Extraversion.
Method
Participants
We obtained the names and addresses of 2,094 newlywed couples from county court records of recent marriage licenses. Letters with postage-paid postcards were sent to these couples inviting their participation in a study of attitudes and behaviors relevant to marriages; 202 couples completed the study (9.6% participation). We report results here on 381 participants (189 men, 192 women) with complete self-report and spouse-rating data; this represents 187 couples and 7 single individuals.
Spouses ranged in age from 20 to 80, with an average age of 32. The majority of participants were Caucasian (79%). The largest percentage of participants had a 4-year college degree (36.1%), followed by 1 to 3 years of college (25.2%), master’s degree or comparable (11.6%), high school degree (11.4%), PhD or comparable (2.7%), postdoctorate education or certification (0.2%), and grade school (0.2%). Most participants were employed at least part-time (83%), and 7.7% reported being unemployed. The majority of participants reported a current religious affiliation of Christian (61.4%), followed by Agnostic or Atheist (13.1%), Jewish (1%), Islam (0.2%), and “other” (14.6%; missing data resulted in percentages totaling less than 100).
Spouses reported knowing one another an average of 6.1 years (range 0.75-42.25 years) and having dated an average of 4.1 years (range 0.25-19 years). Spouses had been married 9 months on average at the time of participation. Most (66.3%) participants had not been previously married. The majority (72.3%) of spouses had lived together prior to marrying. Most spouses did not have children (63.8%) at the time of the study. Each participant received $55.00 in exchange for his or her participation.
Measures
As noted earlier, we assessed Neuroticism and Extraversion using two different measures. First, we used the BFI (John & Srivastava, 1999). The 44-item version of the BFI contains 8-item scales assessing Neuroticism and Extraversion, a 10-item Openness scale, and 9-item measures of Agreeableness and Conscientiousness. The instructions for the self-ratings read: “Here are a number of characteristics that may or may not apply to you. For example, do you agree that you are someone who likes to spend time with others? Please choose a number for each statement to indicate the extent to which you agree or disagree with that statement.” The participants rated themselves using a 5-point scale (1 = disagree strongly, 5 = strongly agree) in response to a series of phrases following a stem statement (“I see myself as someone who . . .”). The spouse-rating form featured a modified set of instructions (“Here are a number of characteristics that may or may not apply to your spouse. For example, do you agree that your spouse is someone who likes to spend time with others? Please choose a number for each statement to indicate the extent to which you agree or disagree with that statement.”) and initial stem (“I see my spouse as someone who . . .”).
To assess Neuroticism and Extraversion in an alternate format, we used two 9-item scales that consisted of trait adjectives (e.g., anxious, moody, assertive, bold) selected from Goldberg’s (1992) list of Big Five factor markers (see also Chmielewski & Watson, 2009); participants responded using a 5-point scale (1 = very inaccurate, 5 = very accurate). For the self-ratings, participants were instructed: “Describe yourself as you see yourself at the present time, not as you wish to be in the future. Describe yourself as you are generally or typically, as compared with other persons you know of the same sex and roughly your same age.” For the spouse-ratings, participants were instructed: “Describe your spouse at the present time as he/she is generally or typically, as compared with other persons you know of the same sex and roughly the same age.”
We also assessed trait NA and PA in two distinct ways. First, we used the PANAS (Watson et al., 1988). The PANAS contains two 10-item scales that consist of adjectives describing emotional states relevant to either general PA or NA. In the self-rating version, participants were asked to indicate “to what extent you generally feel this way, that is, how you feel on average” using a 5-point scale (1 = very slightly or not at all, 5 = extremely). In the spouse-rating version, participants were asked to rate “to what extent your spouse generally feels or acts this way, that is, how your spouse feels or acts on the average,” using the same 5-point scale.
Finally, to assess PA and NA in an alternate form, we used the TEQ (Watson, 2004; see also Chmielewski & Watson, 2009). As noted previously, the TEQ was created by transforming the PANAS-X descriptors into full sentences that maintained the central content of each item. For example, in the self-ratings, the parallel form of the adjective “jittery” was “At times, I feel jittery and ‘on edge’”; similarly, the parallel form of “strong” was “I generally feel forceful and strong.” In the self-ratings, participants were instructed to “read each statement carefully and then mark the appropriate answer in the space next to it.” In the spouse-ratings, the instructions were modified to state: “Read each statement carefully and think about how it applies to the thoughts, feelings, and behaviors of your husband [wife]; then mark the appropriate answer in the space next to it.” In addition, the items themselves were changed in the spouse-rating version from the first person to the third person. For example, the item “I generally feel forceful and strong” became “She generally feels forceful and strong” in the form given to husbands and “He generally feels forceful and strong” in the version given to wives. In all versions, participants responded using a 5-point scale (1 = strongly disagree, this statement is definitely false, 5 = strongly agree, this statement is definitely true).
Previous studies have established a strong level of convergence between parallel scales on the PANAS-X and the TEQ; however, the TEQ NA scales tend to show better short-term dependability than their PANAS-X counterparts (see Chmielewski & Watson, 2009; Watson, 2004). This is the first study to compare self–other agreement across the two instruments.
Procedure
Couples who responded to the mailing used a postcard that indicated scheduling preference; they were contacted on receipt of the postcard and scheduled via phone or email. Sessions were conducted on weeknights and weekends; they consisted of 1 to 4 couples at a time and lasted for approximately 2 hours. Participants completed several questionnaires about themselves, their spouses, and their ideal romantic partners (see Watson, Beer, & McDade-Montez, in press); participated in an interactive task as a couple; and took part in a computer rating task. Couples were seated together in a room for the questionnaire portions of the study but were physically separated from one another to ensure that responses were made independently.
Measures were completed in a standard order. Participants first rated themselves using the BFI, then the PANAS, then the Goldberg adjectives, and finally the TEQ. They then completed spouse-ratings on these measures in the same order. The BFI and the PANAS appeared consecutively in both self- and spouse-ratings, but at least one measure was interspersed between these scales in all other cases.
Analytic Strategy and Hypotheses
To determine the influence of form and content on the validity of the scales in question, we conducted similar analyses to those presented in the introduction by comparing agreement and assumed similarity correlation coefficients. Specifically, we expected lower self–spouse agreement and greater assumed similarity for the adjective formats, with a particularly pronounced effect for measures of N/NA. To further explicate these issues, we examine the multitrait–multimethod matrix for the N/NA scales. Consistent with the data presented in Table 1, we predicted that these scales would converge strongly within raters; at the same time, however, we expected that measures employing more elaborated items (i.e., the BFI and TEQ) would produce clearer patterns of convergent and discriminant relations. Finally, we conducted multiple regression analyses for each general domain that allow us to determine the extent to which spousal judgments of these dimensions reflect (a) the target’s self-reported standing on the scale versus (b) the judge’s self-reported standing on the trait. We expected that measures with more elaborated scale items would show greater evidence of the contribution of target variance in spousal judgments for both personality and trait affect.
Thus, we evaluated the effect of format (measures of adjectives vs. sentences/phrases) via comparing patterns of correlation coefficients among the two types of measures and examining the multitrait–multimethod matrix patterns of convergent and discriminant relations. To examine the effect of content, we compared correlation coefficients across personality versus affective traits.
Results
Preliminary Analyses
Descriptive statistics for the personality and affectivity scales are presented in Table 4. Comparisons of the self- and spouse-ratings yielded a few small but significant effects. Spouses rated their partners as significantly more extraverted (on both the BFI and Goldberg scales), more agreeable, and as higher in positive affectivity (on the PANAS only) than they rated themselves. Thus, replicating the findings of Watson and Humrichouse (2006), we see some evidence of a “honeymoon effect,” with newly married spouses rating their partners more positively than the partners rated themselves.
Scale Descriptive Statistics.
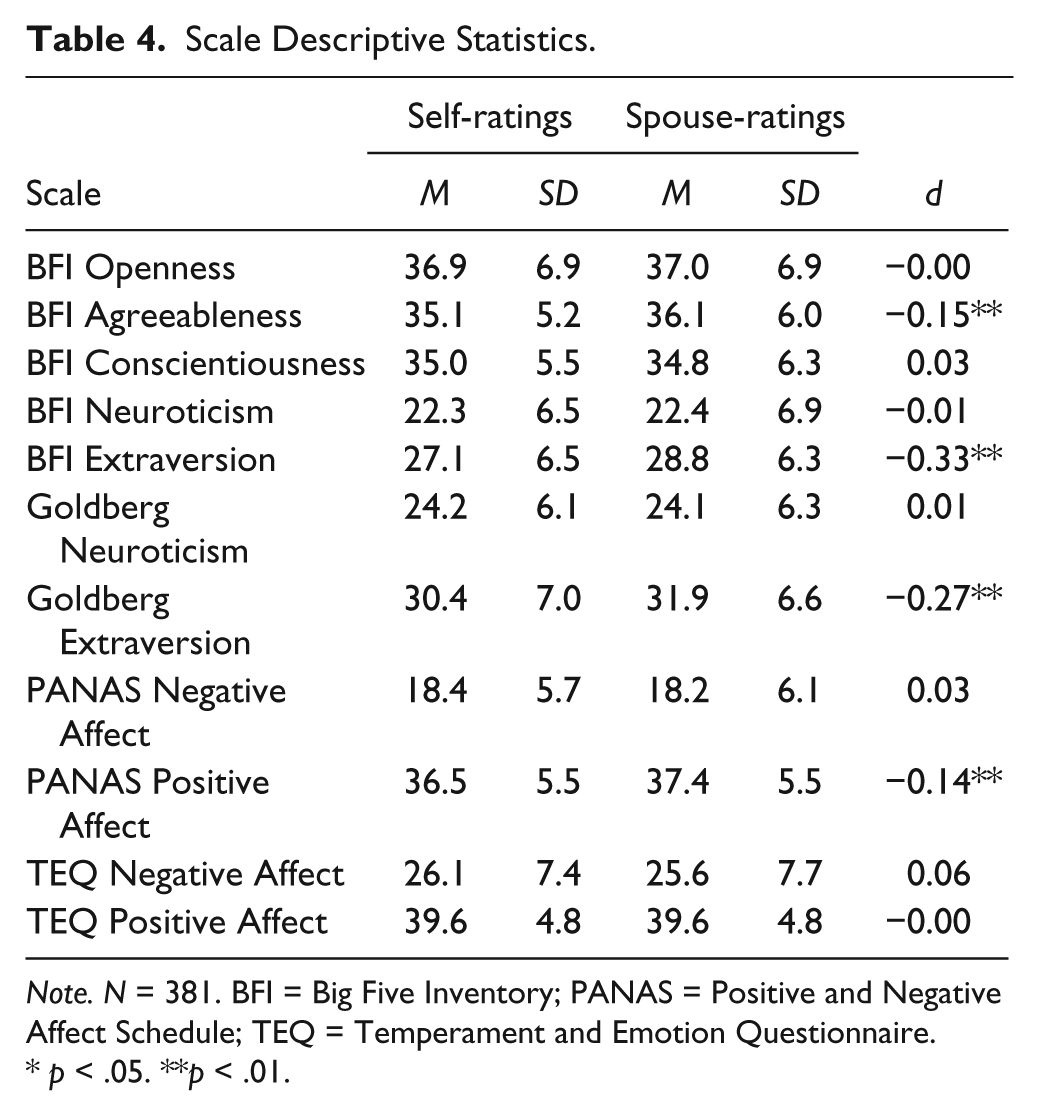
Note. N = 381. BFI = Big Five Inventory; PANAS = Positive and Negative Affect Schedule; TEQ = Temperament and Emotion Questionnaire.
p < .05. **p < .01.
In Table 5, we present coefficient alphas and average interitem correlations for the personality and affectivity scales in both the self- and spouse-ratings. Internal consistency was adequate for all scales, with alpha values of .75 or greater. Of particular interest, there are no systematic differences in internal consistency reliability between measures of Neuroticism (range = .79-.87, mean α = .83) and Negative Affect (range = .85-.88, mean α = .87). Thus, any subsequent differences we report between these measures cannot be attributed to lower levels of internal consistency reliability in the Negative Affect scales.
Internal Consistency Reliabilities and Average Interitem Correlations for the Personality and Affectivity Scales.
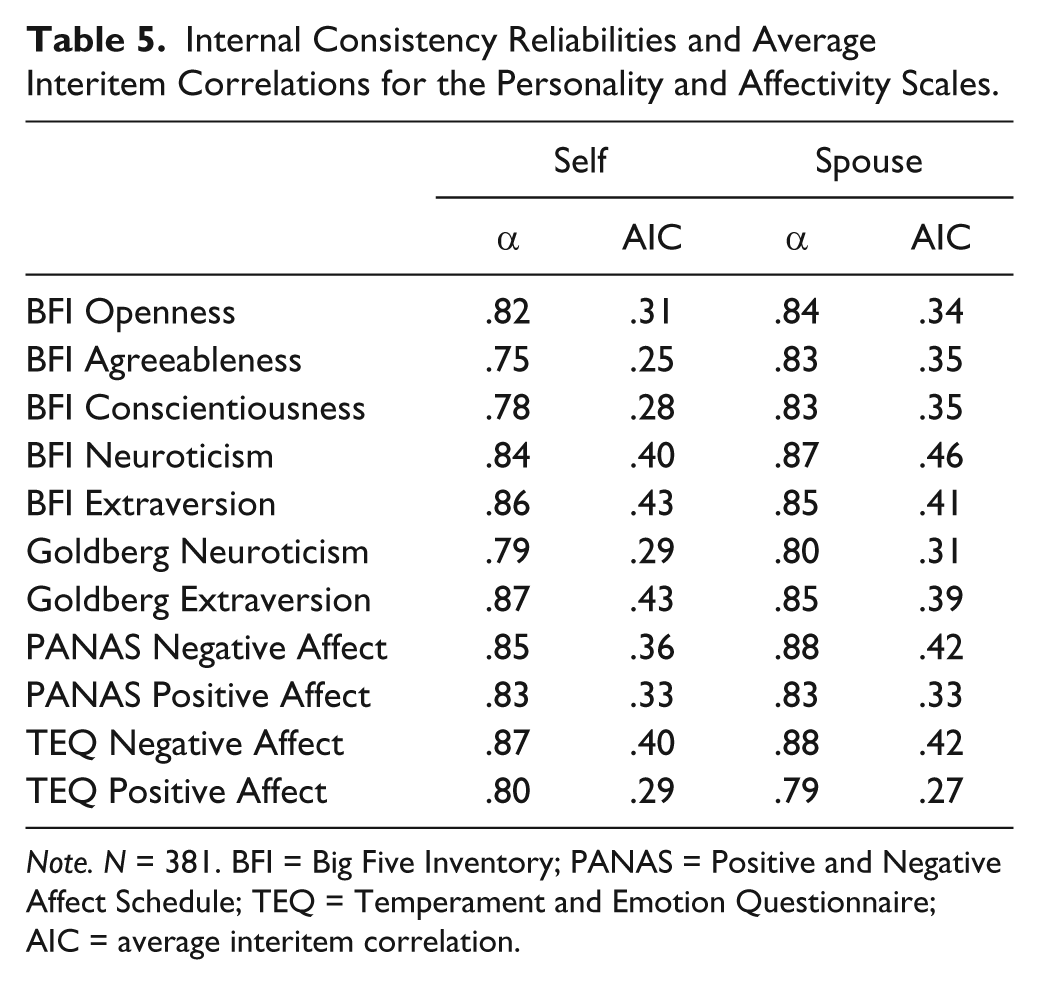
Note. N = 381. BFI = Big Five Inventory; PANAS = Positive and Negative Affect Schedule; TEQ = Temperament and Emotion Questionnaire; AIC = average interitem correlation.
Spousal Similarity
Next, we examine spousal similarity (e.g., the correlation between a wife’s self-rated neuroticism and her husband’s self-rated neuroticism) on the major personality and affective dimensions in the study. These analyses are important for three reasons. First, similarity may be a spurious source of self–other agreement (for a discussion of this issue, see Kenrick & Funder, 1988; Watson et al., 2000b). Second, it is important to know the actual level of spousal similarity in interpreting the assumed similarity results we report subsequently. Finally, similarity within dyads produces statistical nonindependence in data analyzed at the individual level (Kashy & Snyder, 1995; Kenny, 1995). That is, if scores between members of a dyad are systematically interrelated, then the assumption of independent observations is violated and significance tests may be misleading. Kenny (1995) offers specific guidelines, suggesting that if similarity correlations are less than |.30|, then “it is relatively safe to use the person as the unit” of analysis (p. 72).
We calculated similarity correlations, representing the correspondence between both self- and spouse-ratings within each dyad. These are presented in the third and fourth columns, respectively, in Table 6. In accordance with previous findings related to personality (Eysenck, 1990; Watson et al., 2000b; Watson et al., 2004; Watson et al., in press), these correlations tend to be positive, but low. We obtained only one significant negative correlation (r = −.15 for self-ratings on BFI Neuroticism); it should be noted, however, this effect did not replicate in the spouse-ratings (r = −.02). Thus, consistent with the broader literature on spousal similarity, we see little evidence of complementarity (i.e., that “opposites attract”). In contrast, two scales showed significant spousal similarity in both sets of ratings: BFI Openness (r = .25 and .26 in self- and spouse-ratings, respectively) and PANAS PA (r = .17 and .27, respectively). For our purposes, however, the most important aspect of these data is that none of the similarity coefficients exceeded |.30|. These results therefore establish that nonindependence does not represent a substantial problem in these data. Consequently, we conduct our basic analyses of agreement and assumed similarity at the individual—rather than the dyadic—level.
Agreement, Assumed Similarity, and Similarity Correlations.
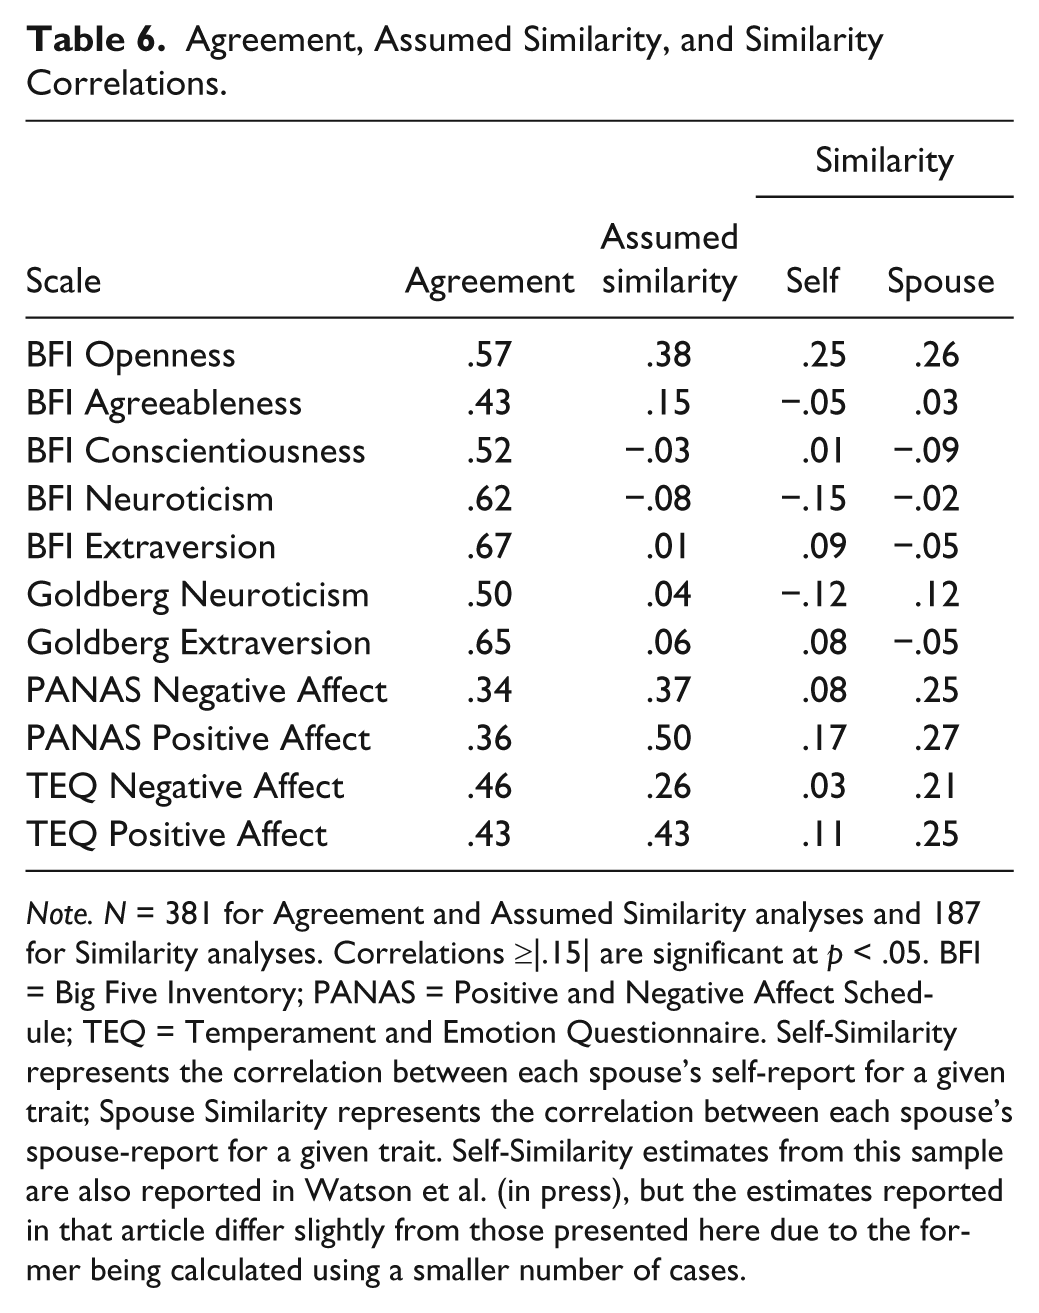
Note. N = 381 for Agreement and Assumed Similarity analyses and 187 for Similarity analyses. Correlations ≥|.15| are significant at p < .05. BFI = Big Five Inventory; PANAS = Positive and Negative Affect Schedule; TEQ = Temperament and Emotion Questionnaire. Self-Similarity represents the correlation between each spouse’s self-report for a given trait; Spouse Similarity represents the correlation between each spouse’s spouse-report for a given trait. Self-Similarity estimates from this sample are also reported in Watson et al. (in press), but the estimates reported in that article differ slightly from those presented here due to the former being calculated using a smaller number of cases.
Assumed Similarity
Having established that the actual level of spousal similarity is relatively low, it is informative to examine the relation between self- and spouse-judgments within each rater. The second column of Table 6 provides the assumed similarity correlations (e.g., the correlation between a wife’s self-rated neuroticism and her rating of her husband’s neuroticism) for the personality and affectivity scales. As previously discussed, given the low spousal similarity correlations, elevated assumed similarity correlations may be interpreted as a reliance on self-judgments when making ratings of others in the absence of valid trait relevant information. The column vector correlation between the self–other agreement correlations and the assumed similarity correlations in Table 6 (r = −.69) also supports this notion. Thus, we would expect to see greater assumed similarity for traits about which the judge presumably has less information.
Consistent with previous findings (see Table 2), the Extraversion and Neuroticism scales consistently produced weak and nonsignificant assumed similarity correlations, with coefficients ranging from only −.08 to .06 (mean r = .01). Given that these results replicated across both Big Five instruments, they clearly are unaffected by the use of single adjectives (Goldberg scales) versus more elaborated items (BFI scales).
In marked contrast, the assumed similarity correlations for the trait affect scales consistently were significant and moderate in magnitude, with coefficients ranging from .26 to .50 (mean r = .39). Moreover, in every individual comparison, the assumed similarity correlations for the PA scales were significantly higher than those for the extraversion scales (zs ranged from 5.99 to 8.20, all ps < .01, two-tailed), and the coefficients for the NA scales were significantly greater than those for the neuroticism scales (zs ranged from 4.93 to 8.60, all ps < .01, two-tailed).
It is noteworthy, however, that the PANAS scales (mean r = .44) yielded stronger evidence of assumed similarity than did their TEQ counterparts (mean r = .35). Follow-up tests indicated that the differences between these correlations were significant for both NA (r = .37 vs. .26; z = 2.21, p < .05, two-tailed) and PA (r = .50 vs. .43; z = 2.66, p < .01, two-tailed). Thus, adopting a full-sentence format in the TEQ served to decrease the participants’ reliance on self-related information in judgments of others.
Self–Other Agreement
Perhaps the most important test of format effects can be found in the examination of the self–spouse agreement correlations, which are displayed in the first column of Table 6. Agreement correlations were strong and positive for all of the Big Five scales, with the lowest correlation observed for BFI Agreeableness (r = .43). The Neuroticism and Extraversion scales consistently produced strong self–other agreement, with coefficients ranging from .50 to .67 (mean r = .62). Consistent with previous findings (see Table 2), the affectivity scales showed more moderate agreement, with correlations ranging from .34 to .46 (mean r = .40).
In terms of more specific comparisons, the two Extraversion scales showed virtually identical levels of self–spouse agreement (r = .67 and .65 for the BFI and Goldberg scales, respectively); in other words, the use of single adjectives in the Goldberg scale did not significantly reduce the level of agreement across raters. Moreover, both Extraversion scales had significantly higher agreement coefficients than the PANAS PA scale (for the BFI, z = 6.31, p < .01, two-tailed; for the Goldberg, z = 5.65, p < .01, two-tailed) and the TEQ PA scale (for the BFI, z = 5.06, p < .01, two-tailed; for the Goldberg, z = 4.44, p < .01, two-tailed). Finally, the agreement correlations for the TEQ PA scale (r = .43) and the PANAS PA scale (r = .36) did not differ significantly from one another (z = 1.33, n.s.). Thus, these results reveal a strong and consistent effect for content: Extraversion scales (mean r = .66) show substantially stronger agreement than PA scales (mean r = .39).
The Neuroticism and NA scales exhibited a somewhat different pattern, showing evidence of both content and format effects. With regard to the former, the Neuroticism scales (mean r = .56) showed stronger agreement than the NA scales (mean r = .40); with regard to the latter, the scales with more elaborated items (the BFI and TEQ; mean r = .55) yielded higher correlations than those based on single adjectives (Goldberg and PANAS; mean r = .43). In terms of specific scales, BFI Neuroticism (r = .62) produced stronger self–spouse agreement than Goldberg Neuroticism (r = .50; z = 2.55, p < .01, two-tailed), TEQ NA (r = .46; z = 3.41, p < .01, two-tailed), and PANAS NA (r = .34; z = 5.49, p < .01, two-tailed.). Goldberg Neuroticism produced stronger agreement than PANAS NA (z = 3.05, p < .01, two-tailed), but not TEQ NA (z = 0.88, n.s.). Finally, it is noteworthy that TEQ NA demonstrated significantly greater self–spouse agreement than did PANAS NA (z = 2.24, p < .05, two-tailed).
Thus, the modified format of the TEQ did produce stronger self–spouse agreement (mean r = .44) than was observed for the PANAS (mean r = .35), but this difference only was significant for NA. Moreover, although the level of agreement on the TEQ was somewhat improved compared with the PANAS, it still did not approach that seen on the BFI Neuroticism and Extraversion scales (mean r = .65).
Multitrait–Multimethod Matrix of the Neuroticism/NA Scales
As we have seen, the agreement data for Extraversion and PA basically revealed a strong general effect for content (i.e., Extraversion scales show better agreement than PA scales), whereas the analyses involving Neuroticism and NA were more complex and also showed evidence of format-based differences. To explicate the latter relations more fully, we present them in the form of a complete multitrait–multimethod matrix (see Table 7). Before discussing these results, we must emphasize that all of these scales were designed to assess very similar constructs. Thus, we would expect them to converge very strongly and would not necessarily predict that they would show discriminant validity in the classic sense (Campbell & Fiske, 1959). Nevertheless, this matrix provides an informative examination of all of the monomethod and heteromethod associations in a single integrated analysis.
Multitrait–Multimethod Matrix of the Neuroticism and Negative Affectivity Scales.
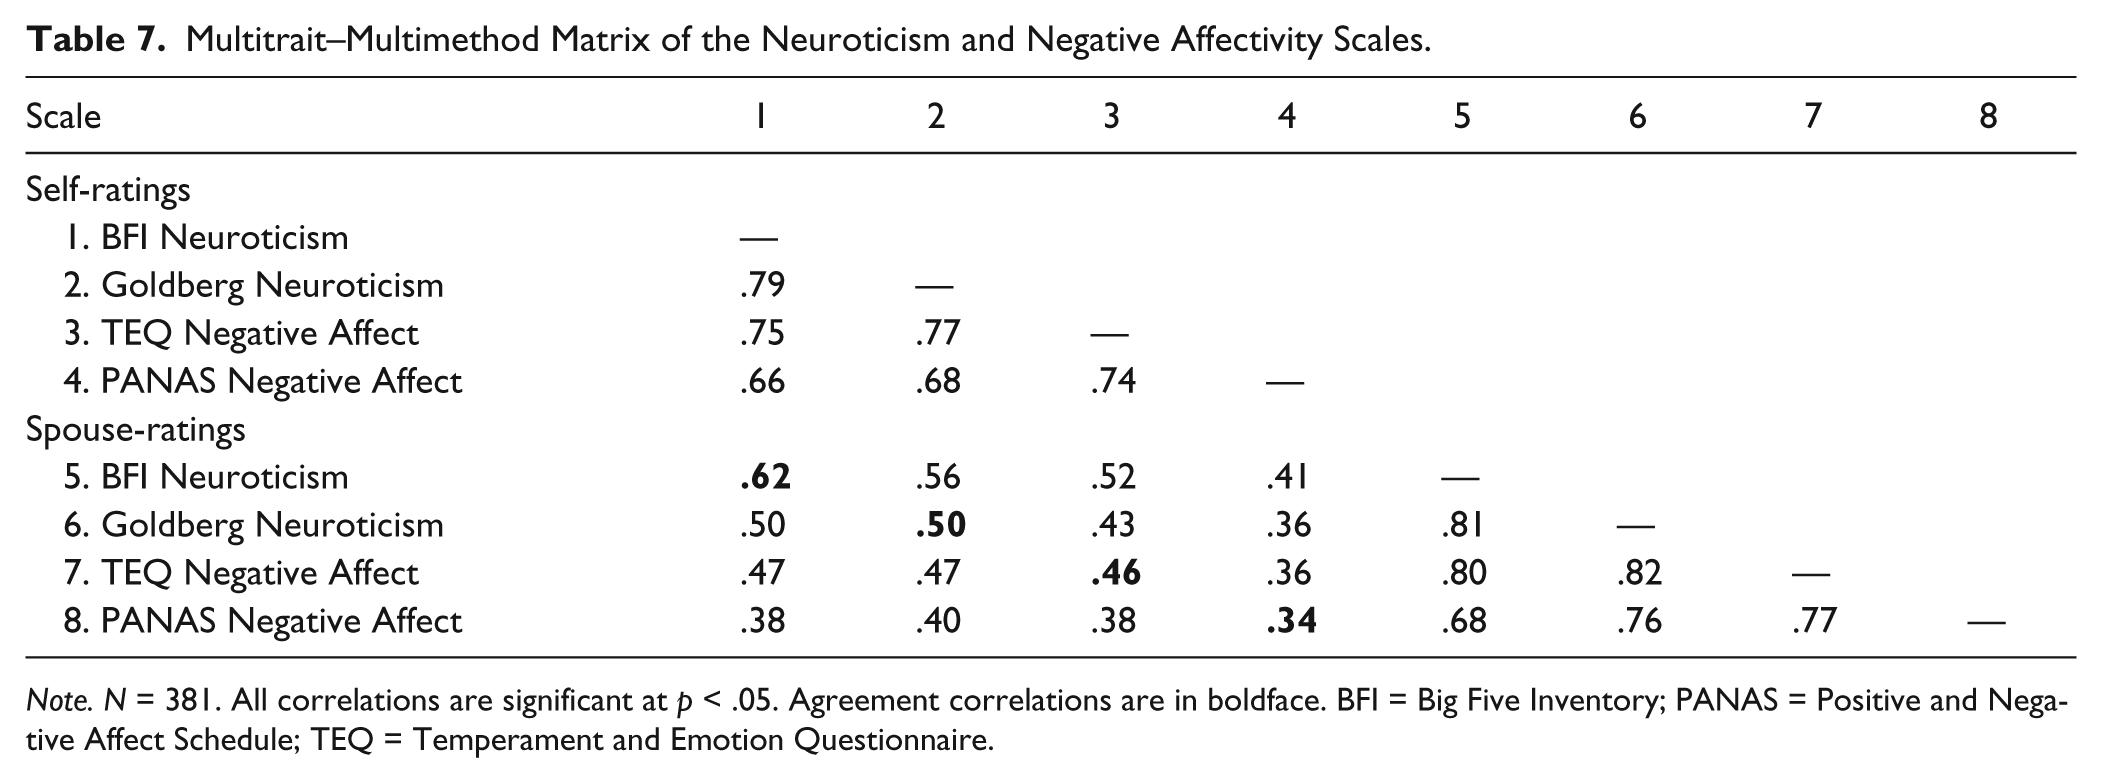
Note. N = 381. All correlations are significant at p < .05. Agreement correlations are in boldface. BFI = Big Five Inventory; PANAS = Positive and Negative Affect Schedule; TEQ = Temperament and Emotion Questionnaire.
As expected, the monomethod correlations establish a strong level of convergence among these scales. In particular, the BFI Neuroticism, Goldberg Neuroticism, and TEQ NA scales all are very strongly related, with correlations ranging from .75 to .79 (mean r = .77) in the self-ratings and from .80 to .82 (mean r = .81) in the spouse-ratings. The correlations involving the PANAS NA scale are somewhat lower but still quite substantial, ranging from .66 to .74 (mean r = .69) in the self-ratings and from .68 to .77 (mean r = .74) in the spouse-ratings.
These very strong monomethod correlations normally would lead one to expect that these scales show very similar levels of agreement across raters. As we have seen, however, this is not the case: Indeed, the agreement correlations range all the way from .34 (PANAS NA) to .62 (BFI Neuroticism) in these data. Moreover, an inspection of the heteromethod block reveals a curious pattern. A classic test of discriminant validity is that each of the convergent correlations should be higher than any of the other values in its row or column of the heteromethod block (Campbell & Fiske, 1959). Only the data for BFI Neuroticism conform to this pattern; for all other scales, the monotrait–heteromethod correlation is exceeded by at least one heterotrait–heteromethod correlation. In fact, at the other extreme, the agreement correlation for the PANAS NA scale actually is lower than all of the other correlations in its row and column of the heteromethod block. In light of these data, one can conclude that these scales are not assessing distinct, clearly differentiable constructs. Nevertheless, they show very different levels of agreement across raters. More generally, our results demonstrate that even strongly correlated measures of the same basic construct can show substantially different levels of self–other agreement.
Multiple Regression Analyses
Finally, to explicate the relations among self- and spouse-ratings of Neuroticism, Extraversion, NA, and PA, we conducted a series of multiple regression analyses that allow for the simultaneous consideration of judge and target effects on ratings of the partner; these analyses were restricted to the 187 couples with complete self-spouse data. Table 8 presents the results of a series of regression analyses of Extraversion and PA in which the spouse judgment serves as the criterion variable and each spouse’s corresponding self-rating is a predictor. For example, in the first analysis reported in Table 8, the husband’s self-rated Extraversion and the wife’s self-rated Extraversion were used to predict (a) the husband’s rating of his wife’s Extraversion and (b) the wife’s rating of her husband’s Extraversion on the BFI. These standardized beta weights thus quantify the relative contribution of assumed similarity or projective effects versus self–other agreement or target effects, separately by gender. The results for Extraversion are quite clear: These analyses showed strong target effects (mean β = .67) and weak to nonexistent assumed similarity effects (mean β = −.01). The PA results display a very different pattern, with assumed similarity effects (mean β = .42) exceeding target effects (mean β = .33) in three of the four cases, an effect especially pronounced in the PANAS analyses. There was also a slight gender difference, with wives’ ratings of husbands showing stronger target effects than husbands’ ratings of wives.
Multiple Regression Analyses: Predicting Spouse Ratings of Extraversion/Positive Affectivity from Both Partners’ Self-Ratings.
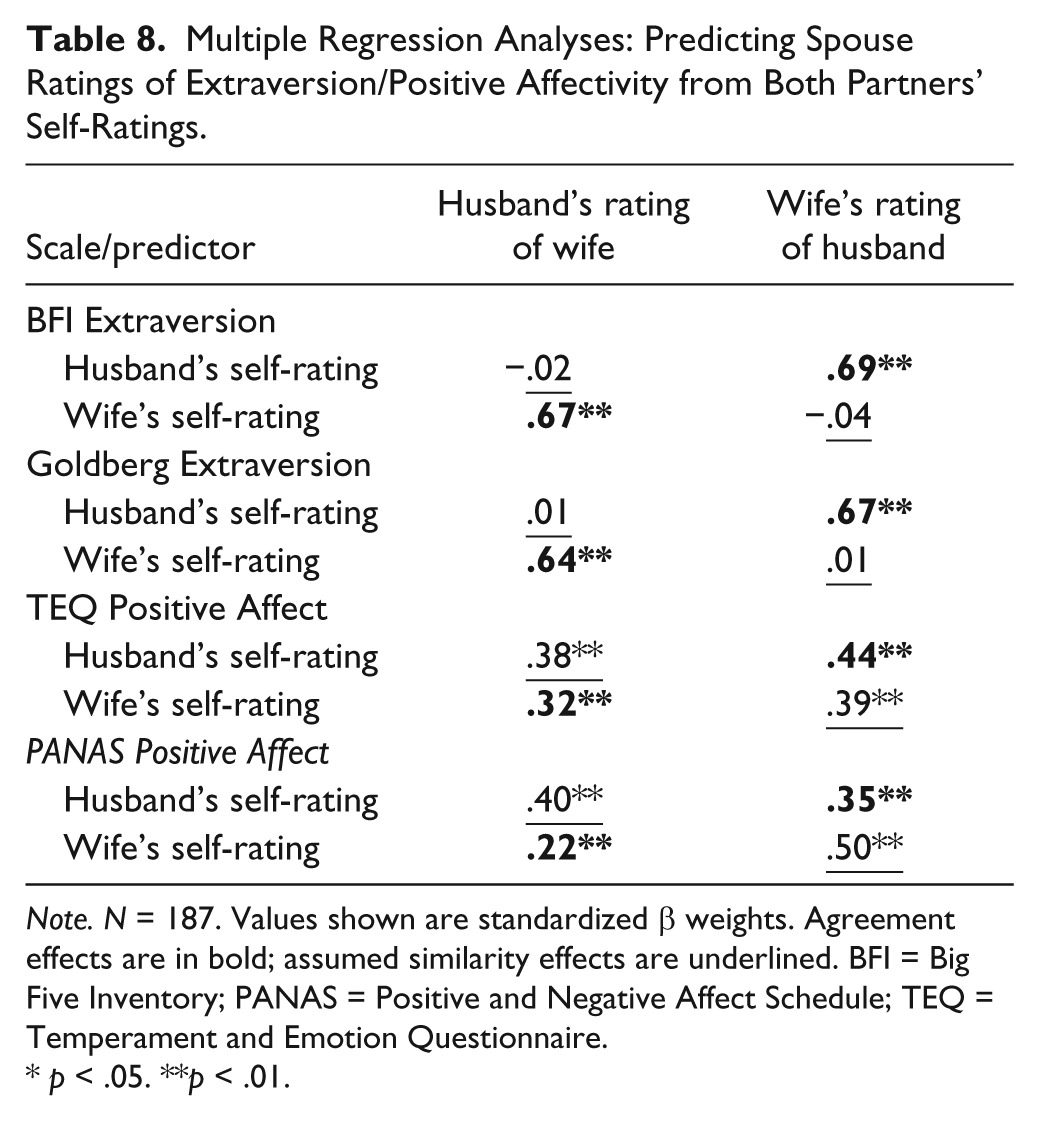
Note. N = 187. Values shown are standardized β weights. Agreement effects are in bold; assumed similarity effects are underlined. BFI = Big Five Inventory; PANAS = Positive and Negative Affect Schedule; TEQ = Temperament and Emotion Questionnaire.
p < .05. **p < .01.
Table 9 provides parallel results for Neuroticism and NA. The results for Neuroticism closely resemble those for Extraversion: Again, we see evidence of strong target effects (mean β = .55) and relatively weak assumed similarity effects (mean β = .13). At the other extreme, ratings on the PANAS NA scale showed stronger assumed similarity (mean β = .39) than target effects (mean β = .32). Findings for the TEQ were somewhere in between; these analyses yielded a moderate assumed similarity effect (mean β = .31) but a somewhat stronger target effect (mean β = .44).
Multiple Regression Analyses: Predicting Spouse Ratings of Neuroticism/Negative Affectivity from Both Partners’ Self-Ratings.
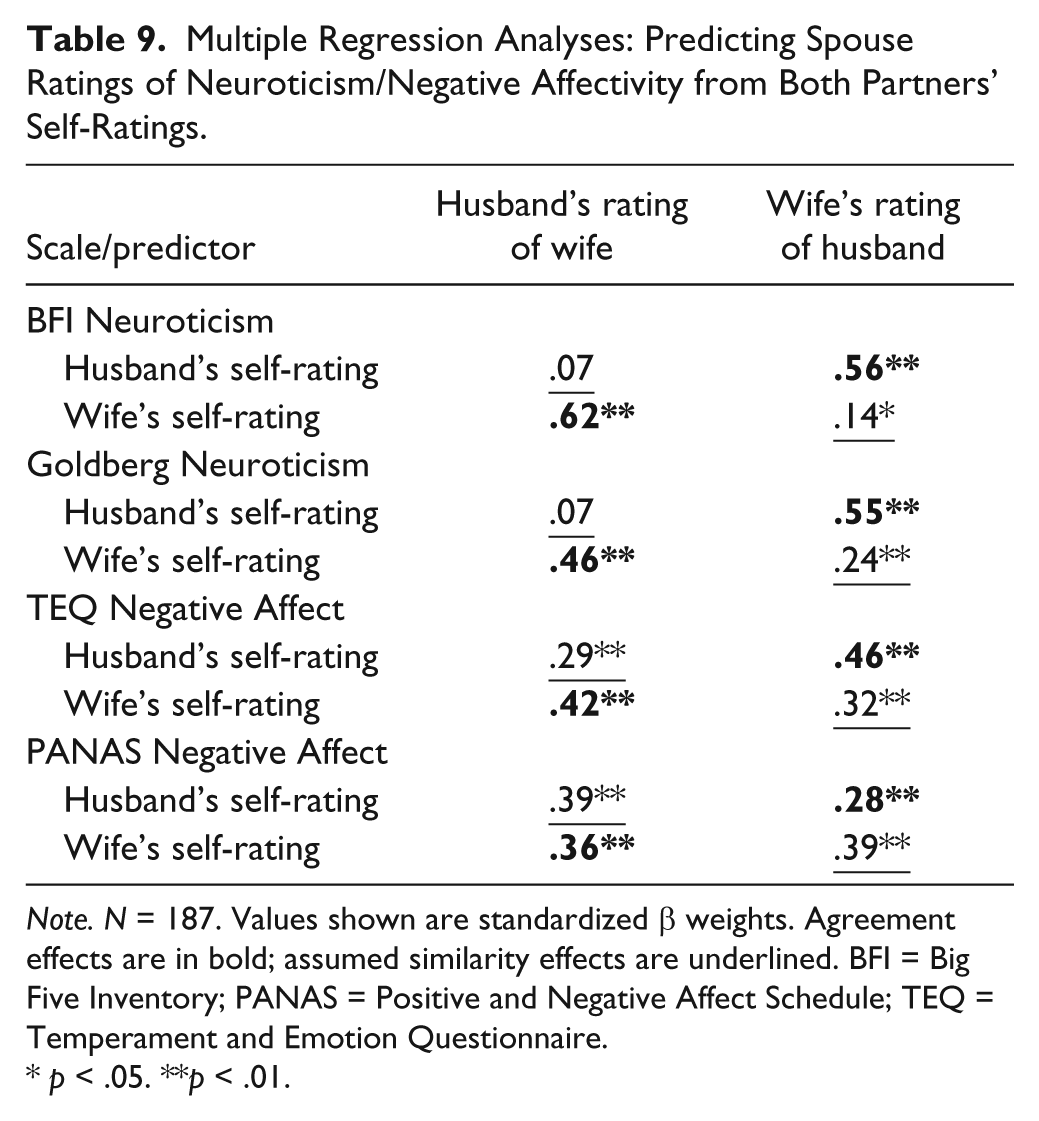
Note. N = 187. Values shown are standardized β weights. Agreement effects are in bold; assumed similarity effects are underlined. BFI = Big Five Inventory; PANAS = Positive and Negative Affect Schedule; TEQ = Temperament and Emotion Questionnaire.
p < .05. **p < .01.
Discussion
Basic Implications of Our Findings
Extraversion and PA
Although core measures of affect and personality show strong conceptual and empirical ties, they do not, in all cases, show the same level of dependability and convergent validity. A simple explanation would be that these are measures of theoretically nested concepts, assessed by instruments with a significant amount of nonoverlapping content. This explanation appears fairly sufficient for the differences between Extraversion and PA, constructs that are distinct in that the former is broader and subsumes the latter, while also incorporating behavioral, cognitive, and motivational elements (Smillie, Cooper, Wilt, & Revelle, 2012; Watson et al., 1999). Positive emotions frequently are the less visible consequence (or antecedent) of the more visible environmental engagement-seeking behavior that also helps define Extraversion. Consequently, our findings regarding self–spouse agreement and assumed similarity simply may reflect the fact that PA is a less visible trait than Extraversion (see also Watson et al., 2000b). Indeed, our results for extraversion and PA demonstrated a strong and consistent effect for content.
Neuroticism and NA
Neuroticism and NA, however, both are largely internal in nature (Pytlik Zillig et al., 2002; see also Table 3), and thus a content-based model for different patterns of convergence—specifically, strong differences in levels of self–other agreement across the two dimensions—is unlikely to provide a complete, satisfactory general explanation. Thus, we examined the possibility that the form of measurement might contribute to these differences in consensus across raters.
We found substantial support for this notion. A measure of NA that employed format features typically used in the assessment of Neuroticism (i.e., sentence descriptions in the TEQ) indeed generated (a) significantly stronger self–spouse agreement, (b) a weaker assumed similarity correlation, and (c) a cleaner convergent/discriminant pattern than a traditional measure of NA (i.e., adjective ratings in the PANAS). Conversely, a measure of Neuroticism that employed format features typically used in the measurement of NA (i.e., Goldberg adjectives) displayed (a) significantly weaker self–spouse agreement and (b) a less satisfactory convergent/discriminant pattern than did a more elaborated measure of Neuroticism (i.e., phrases in the BFI); in contrast to the NA scales, however, the two neuroticism scales both showed weak, nonsignificant levels of assumed similarity (for the Goldberg, r = .04; for the BFI, r = −.08). This asymmetry in our results suggests that the processes that produce convergence between one’s self-rating and his or her rating of another (often considered as a type of bias) are somewhat different than the processes that produce convergence between one’s self-rating and another’s rating of that individual (often considered as a proxy for accuracy), which is consistent with evidence establishing the independent nature of accuracy and bias (e.g., Human & Biesanz, 2012; Luo & Snider, 2009).
Apart from the putative underlying psychological causes, it is worthwhile to consider other possible mechanisms. For example, although adjective-based measures showed similar internal consistency to measures with more elaborated items in our sample (see Table 5), the poorest performing scale in terms of self-spouse convergence (PANAS NA) also was the only scale to show a distribution that departed from normal (skewness > 1). In addition, the TEQ NA scale showed somewhat greater variability (see Table 4) and a mean score closer to the midpoint of the possible scale range when compared with PANAS NA. Wood and Wortman (2012) have previously demonstrated that each of these factors (viz., the magnitude of the standard deviation and extremity of the mean) can influence the temporal stability of a scale—which, in turn, should influence its overall construct validity as a trait measure.
Furthermore, it must be emphasized that these changes in format did not completely erase differences in the external properties of the scales: measures of Neuroticism in general still showed stronger convergence, lower projection, and a more sensible overall pattern of relations with similar constructs than did measures of NA. Still, it is striking that a measure assessing the extent to which one agrees with the statement, “I have days on which I can be rather irritable” (the TEQ) generated better interrater agreement than a measure assessing the extent to which one typically feels “irritable” (the PANAS). Adjectives in isolation may allow for a broader range of construal (Hayes & Dunning, 1997), or perhaps, as suggested previously, raters process information more deeply when it is presented in sentence form. Future work should aim to distinguish between these explanations, as the difference is substantive. If lower agreement is due to differential construal, then the source of disagreement can be attributed to the fact that judges and targets are basing their judgments on somewhat different information. However, if lower agreement is due to shallower processing of information, then judge and target both are accessing lower quality information when rating adjectives. These explanations are not mutually exclusive, however; lower agreement could result from shallower information processing employed in slightly divergent queries. More fundamentally, the fact that the simple manipulation of format altered these relations in such noticeable ways raises important, basic questions about the nature of these constructs and about the measurement of personality and affect in general.
Explaining the Remaining Gap
The fact that our manipulation of format only partially ameliorated the differences between Neuroticism and NA can be interpreted in at least two ways. First, it is possible that there is indeed some important, nonoverlapping content that differentiates the two constructs. For example, one could argue that the NA construct is somewhat broader in that it subsumes specific negative affects (e.g., guilt and shame) that are not assessed in many measures of Neuroticism, which often focus on content related to anxiety and depression (see, e.g., Table 3). In addition, Neuroticism includes cognitive and behavioral content (Pytlik Zillig et al., 2002) absent in measures of trait NA.
Second, it is important to note that we only systematically altered some aspects of format in this study. Accordingly, it is also possible that the remaining gaps in self–other agreement and assumed similarity could be narrowed or closed altogether by altering other formal elements of the measurement process, including aspects of the response scale (e.g., length, extremity vs. extent of descriptiveness, etc.) or even the context in which the items are presented (e.g., as part of an omnibus inventory or among items of exclusively similar content; see Strack & Schwarz, 2007).
Furthermore, Credé, Bashshur, and Niehorster (2010) demonstrated that measures instructing participants to use specific reference groups generally lead to decreased criterion validity of those scales. In our study, the Goldberg adjective measures of Neuroticism and Extraversion were the only measures to employ such an instruction set. We believe that the use of this reference-based instructional set did not play a major role in our findings, given that (a) the reduction in self–other agreement only occurred in the case of Neuroticism and (b) the Goldberg scales showed no evidence of assumed similarity. Still, the impact of factors such as context, instructions, and response format must be explored in future research. On a related note, although there was no clear evidence of order effects in our data—note, for instance, that the scales presented first (viz., the BFI) showed the greatest self–spouse agreement, whereas those administered second (viz., the PANAS) showed the worst self–spouse agreement—the order of test administration could potentially influence scale validity; consequently future studies in this area should counterbalance the order of presentation.
Even taking these various considerations into account, however, the magnitude of these differences remains puzzling and difficult to explain. Consider, for example, our findings for the TEQ versus the BFI. These two instruments employ the same 5-point agree–disagree response format, assess very similar negative emotional content, and use elaborated items to assess this content (phrases in the BFI, full sentences in the TEQ). Nevertheless, the BFI Neuroticism scale demonstrated substantially stronger self–spouse agreement (r = .62) and significantly weaker assumed similarity (r = −.08) than did the TEQ Negative Affect scale (agreement r = .46; assumed similarity r = .26). Similarly, the Goldberg Neuroticism scale and the PANAS Negative Affect scale both use single adjectives to assess very similar negative emotional content; they differ primarily in their instructions and response format. However, the former displayed significantly stronger agreement (r = .50) and weaker assumed similarity (r = .04) than did the latter (agreement r = .34; assumed similarity r = .37). Future studies should aim to isolate specific formal and conceptual elements in an attempt to explicate these striking differences. For instance, it would be informative to explore specific idiosyncrasies in response style that might have more influence on within-rater judgments than between-rater judgments.
More generally, these data suggest that we should consider formal elements more explicitly in our evaluation of the validity of existing scales. For example, our data indicate that the use of single adjectives is associated with reduced levels of convergent validity—at least with regard to measures of neuroticism and NA—using one of the most common forms of external validation in personality measurement: self–other agreement. Does this have more general implications for the overall construct validity of these measures? In this regard, it would be useful to examine whether there exist any relations between scale format and predictive validity in an effort to clarify the extent to which one type of format may be broadly preferable to another. As personality research in general trends toward multiple assessments over periods of time (e.g., Fleeson, 2001) there will likely be a push toward more economical instruments that favor fewer—and briefer—items. Understanding the magnitude and extent of formal influence on the validity of measures of personality will help us to make informed decisions about how to conduct work of this nature more effectively.
Implications for the Assessment of Trait Affect
Several widely used mood inventories—including the PANAS (Watson et al., 1988), the PANAS-X (Watson & Clark, 1999), the Differential Emotions Scale (DES; Izard, Libero, Putnam, & Haynes, 1993), and the Revised Multiple Affect Adjective Checklist (MAACL-R; Zuckerman & Lubin, 1985)—can be adapted to assess trait affect by altering the instructions so that respondents rate their average, general levels of emotionality. A substantial body of evidence supports the convergent and criterion validity of these standard measures of trait affect. For example, trait versions of the PANAS/PANAS-X scales are significantly related to indicators of relationship satisfaction (Watson, Hubbard, & Wiese, 2000a; Watson & Humrichouse, 2006), job satisfaction (Connolly & Viswesvaran, 2000), and life satisfaction (Cloninger & Zohar, 2011). Similarly, Watson, Clark, and Stasik (2011) reported that various trait PANAS-X scales were significantly associated with DSM-IV (Diagnostic and Statistical Manual of Mental Disorders, text revision; American Psychiatric Association, 2000) diagnoses of major depression, generalized anxiety disorder, posttraumatic stress disorder, panic disorder, social phobia, and obsessive-compulsive disorder.
Although the validity of these trait scales is well established, other evidence indicates that some of their basic psychometric properties compare unfavorably with those of other measures. For example, replicating and extending previous results (see Table 2), our data showed that the PANAS NA scale displayed significantly weaker self–other agreement than did highly correlated measures of neuroticism (BFI, Goldberg) and NA (TEQ). In a related vein, Chmielewski and Watson (2009) compared short-term dependability correlations for parallel TEQ and PANAS-X scales across 2-week and 2-month retest intervals. It is noteworthy that the TEQ negative affect scales yielded higher retest coefficients in all 10 comparisons; moreover, 6 of these differences were statistically significant (p < .05). In contrast, the positive affect scales did not show any significant differences across instruments. Overall, the TEQ scales displayed significantly greater dependability in 8 of 21 comparisons (38.1%).
As noted earlier, it currently is unclear whether these significant differences in dependability and convergent validity reflect more fundamental problems in construct validity. Nevertheless, there now is sufficient evidence to raise significant concerns about using traditional mood inventories—such as the PANAS, the PANAS-X, the DES, and MAACL-R—to assess trait affect (or at least trait NA; as we have noted, comparisons of the positive affect scales of the PANAS-X and TEQ have yielded very few differences).
If one simply is interested in assessing general negative emotionality, then our data—taken together with the results reported by Chmielewski and Watson (2009)—suggest that it might be better to avoid traditional trait affect scales and to use instead standard measures of neuroticism, such as the BFI or NEO-FFI. As discussed previously, however, traditional measures of neuroticism—even faceted instruments such as the Revised NEO Personality Inventory (Costa & McCrae, 1992)—do not capture the full range of negative affects assessed by omnibus mood inventories such as the DES and PANAS-X. Although the TEQ provides this type of broader content coverage, it also fares poorly when compared with standard measures of neuroticism (Table 6; see also Chmielewski & Watson, 2009). This suggests the need for a new type of trait affect measure that combines (a) the broad content coverage of traditional mood inventories with (b) the superior psychometric properties of standard personality instruments.
Conclusion
In sum, the current data represent a step toward disentangling the influence of content and form on the measurement of two important classes of individual differences: personality and trait affect. Our results establish a significant role for both content and format in observed levels of assumed similarity and self–other agreement. Future work is needed to clarify the specific mechanisms that produce such striking differences across highly correlated measures. Such exercises can help us explicate the nature of our core constructs in personality psychology and assess them more effectively.
Footnotes
Declaration of Conflicting Interests
The authors declared no potential conflicts of interest with respect to the research, authorship, and/or publication of this article.
Funding
The authors received no financial support for the research, authorship, and/or publication of this article.