



Abstract
The Social Interaction Anxiety Scale and Social Phobia Scale are widely used measures of social anxiety. Using data from individuals with social anxiety disorder (n = 435) and nonanxious controls (n = 86), we assessed the psychometric properties of two independently developed short forms of these scales. Indices of convergent and discriminant validity, diagnostic specificity, sensitivity to treatment, and readability were examined. Comparisons of the two sets of short forms to each other and the original long forms were conducted. Both sets of scales demonstrated adequate internal consistency in the patient sample, showed expected patterns of correlation with measures of related and unrelated constructs, adequately discriminated individuals with social anxiety disorder from those without, and showed decreases in scores over the course of cognitive-behavioral therapy and/or pharmacotherapy. However, some significant differences in scale performance were noted. Implications for the clinical assessment of social anxiety are discussed.
Keywords
Introduction
Social anxiety disorder (SAD), also known as social phobia, refers to a marked fear or anxiety about one or more social situations in which the individual is exposed to possible scrutiny by others (Diagnostic and Statistical Manual of Mental Disorders, 5th edition [DSM-5]; American Psychiatric Association, 2013). SAD is the fourth most common mental disorder, with a lifetime prevalence of 12.1% (Kessler et al., 2005). Most individuals experience social fears at some point in their lives, but for those with SAD, these symptoms can have a detrimental impact on academic, career, and general social functioning (Aderka et al., 2012). For instance, individuals with SAD report fewer friendships and lower friendship quality (Rodebaugh, 2009), poorer academic performance (Van Ameringen, Mancini, & Farvolden, 2003), and greater difficulty in aspects of occupational adjustment (e.g., career choice, career entry, and adaptation to work; Bruch, Fallon, & Heimberg, 2003).
Increased awareness of the negative impact of SAD has spurred interest in social anxiety and its measurement. The Social Interaction Anxiety Scale (SIAS) and Social Phobia Scale (SPS; Mattick & Clarke, 1998) are companion measures designed to assess two distinct aspects of social anxiety: anxiety related to social interaction in dyads or groups (e.g., attending a social gathering, making small talk) and fear of being scrutinized in specific performance situations (e.g., formal speaking, eating, drinking, and writing in the presence of others), respectively. The SIAS and SPS are widely used among social anxiety researchers for these purposes.
Several findings support the reliability, validity, and usefulness of these scales in research and clinical contexts. The SIAS and SPS show high internal consistency and test–retest reliability (Mattick & Clarke, 1998). Additionally, they successfully discriminate between patients with SAD versus other anxiety disorders as well as between patients with SAD and normal comparison samples (E. J. Brown et al., 1997; Mattick & Clarke, 1998; Peters, 2000). Furthermore, these scales reliably track changes in social anxiety symptoms over the course of cognitive behavior therapy (CBT; Ledley et al., 2009; Mattick & Peters, 1988; Mattick, Peters, & Clarke, 1989) and pharmacotherapy (Heimberg et al., 1998).
Although the SIAS and SPS display adequate psychometric properties, with a total of 40 items, 1 they take approximately 15 to 20 minutes to administer. This response burden, which is intensified if the scales are included as part of a larger battery, has proven prohibitive in some settings (Fergus, Valentiner, McGrath, Gier-Lonsway, & Kim, 2012; Peters, Sunderland, Andrews, Rapee, & Mattick, 2012). In response, several abbreviated versions of the scales have been developed (Carleton et al., 2009; Fergus et al., 2012; Kupper & Denollet, 2012; Peters et al., 2012).
The current study evaluates and compares two independently developed six-item versions of the SIAS and SPS (Fergus et al., 2012; Peters et al., 2012). For the purposes of this article, we refer to the scales developed by Peters et al. (2012) as the SIAS-6A and the SPS-6A, and the scales developed by Fergus et al. (2012) as the SIAS-6B and the SPS-6B. Other short forms of the SIAS and SPS have also been developed. For example, Kupper and Denollet (2012) have recently developed an 11-item version of the SPS and a 10-item version of the SIAS, and Carleton et al. (2009) developed the 14-item Social Interaction Phobia Scale. However, we chose not to include these scales in our analyses as our aim was to examine the scales that would most efficiently reduce response burden and administration length.
Peters et al. (2012) used nonparametric item response theory to derive the SIAS-6A and SPS-6A and demonstrated that they had psychometric properties comparable to the long forms in both clinical and student samples. To shorten the SIAS and SPS, items were removed if they failed to adequately discriminate cases along the full range of either social interaction fears (SIAS) or scrutiny fears (SPS). This strategy was intended to allow the scales to be more efficient while retaining the original scales’ desirable psychometric properties. Similar to the long forms, the SIAS-6A and SPS-6A showed significant relationships with measures of related constructs including the Brief Fear of Negative Evaluation Scale (BFNE; Leary, 1983) and the Depression Anxiety Stress Scales (DASS-21; Lovibond & Lovibond, 1995). Additionally, scores on the SIAS-6A and SPS-6A did not differ from scores on the long forms in their ability to measure change over the course of CBT. Furthermore, the SIAS-6A and SPS-6A discriminated between those with a diagnosis of SAD and those without, although receiver operating characteristics analyses revealed that the area under the curves were significantly different between the long forms and the shorts forms of the SIAS and SPS, with the long forms discriminating better between those who meet diagnostic criteria for SAD and those who do not.
Fergus et al. (2012) focused on readability of items to construct the SIAS-6B and SPS-6B. The items selected for the short forms had a significantly higher percentage of monosyllabic words, a significantly lower percentage of polysyllabic words, and a significantly lower number of syllables per word relative to the items not selected. Additionally, each selected item had a lower estimated reading level on all of the readability tools compared with items that were not selected. The SIAS short form has a 5.6 mean composite grade reading level, and the SPS short form has a 4.9 mean composite grade reading level. This set of short forms also demonstrated good psychometric properties in both clinical and student samples. However, despite the high degree of correlation between the new scales and the BFNE in the student sample, these relationships were significantly weaker than those between the BFNE and the original long forms, a notable difference from the findings of Peters et al. (2012). Still, the SIAS-6B and SPS-6B showed good discriminant validity, as correlations between these short forms and the BFNE were significantly higher than those between the short forms and the DASS-21. 2 In the clinical sample, both the SIAS-6B and the SPS-6B were significantly correlated with the Liebowitz Social Anxiety Scale–Self-Report (LSAS-SR; Fresco et al., 2001), although the correlation with the SIAS-6B was significantly smaller than the correlation with the long form of the SIAS. With regard to discriminant validity, both the SIAS-6B and SPS-6B were more highly correlated with the LSAS-SR than with either the Beck Depression Inventory (Beck, Ward, Mendelsohn, Mock, & Erbaugh, 1961) or the Penn State Worry Questionnaire (Meyer, Miller, Metzger, & Borkovec, 1990). Fergus et al. (2012) did not compare the SIAS-6B and SPS-6B scores of patients with SAD with those of nonanxious controls or examine the treatment sensitivity of these short forms.
The current study replicates and extends the findings of Peters et al. (2012) and Fergus et al. (2012). To provide a more comprehensive assessment of the short forms’ psychometric properties, we first expanded the number and breadth of measures used to assess convergent and discriminant validity. Both Peters et al. and Fergus et al. prioritized fears of negative evaluation to assess convergent validity; however, social anxiety is a multifaceted construct that includes cognitive, affective, and behavioral components. Therefore, we utilized a variety of social anxiety measures to assess convergent validity. Furthermore, because it is important to show discriminant validity in reference to a wide array of related but distinct psychological phenomena, we assessed whether the short forms are adequately specific in signaling social anxiety rather than depression, generalized anxiety, or anxiety sensitivity. Finally, we examined whether the SIAS/SPS-6A and the SIAS/SPS-6B successfully discriminate patients with SAD from nonanxious controls and show sensitivity to treatment-related changes. Generally, the analyses we used were aimed at determining the strengths and weaknesses of both sets of short forms, in relation to each other and to the long forms from which they were derived.
Method
Participants
Of the 521 participants in this study, the majority were outpatients with a principal diagnosis of SAD (n = 435), according to DSM-IV criteria (American Psychiatric Association, 1994). The others were nonanxious controls who completed the relevant measures in data collections for previous studies (n = 86). Participants with SAD sought treatment for social, interpersonal, or performance anxiety at the Adult Anxiety Clinic of Temple University (AACT; n = 326), the Anxiety Disorders Clinic of the University of Nebraska-Lincoln (n = 17), or the Anxiety Disorders Clinic of the New York State Psychiatric Institute (n = 92).
Participants with SAD from the AACT and University of Nebraska-Lincoln were assessed using the Anxiety Disorders Interview Schedule for DSM-IV: Lifetime Version (ADIS-IV-L; Di Nardo, Brown, & Barlow, 1994), and participants from the New York State Psychiatric Institute (NYSPI) were assessed using the Structured Clinical Interview for DSM-IV (SCID-IV; First, Spitzer, Gibbon, & Williams, 2002). The nonanxious controls were assessed using the current version of the ADIS-IV (T. A. Brown, Di Nardo, & Barlow, 1994) and were included in the current analyses only if they failed to meet criteria for any diagnosis.
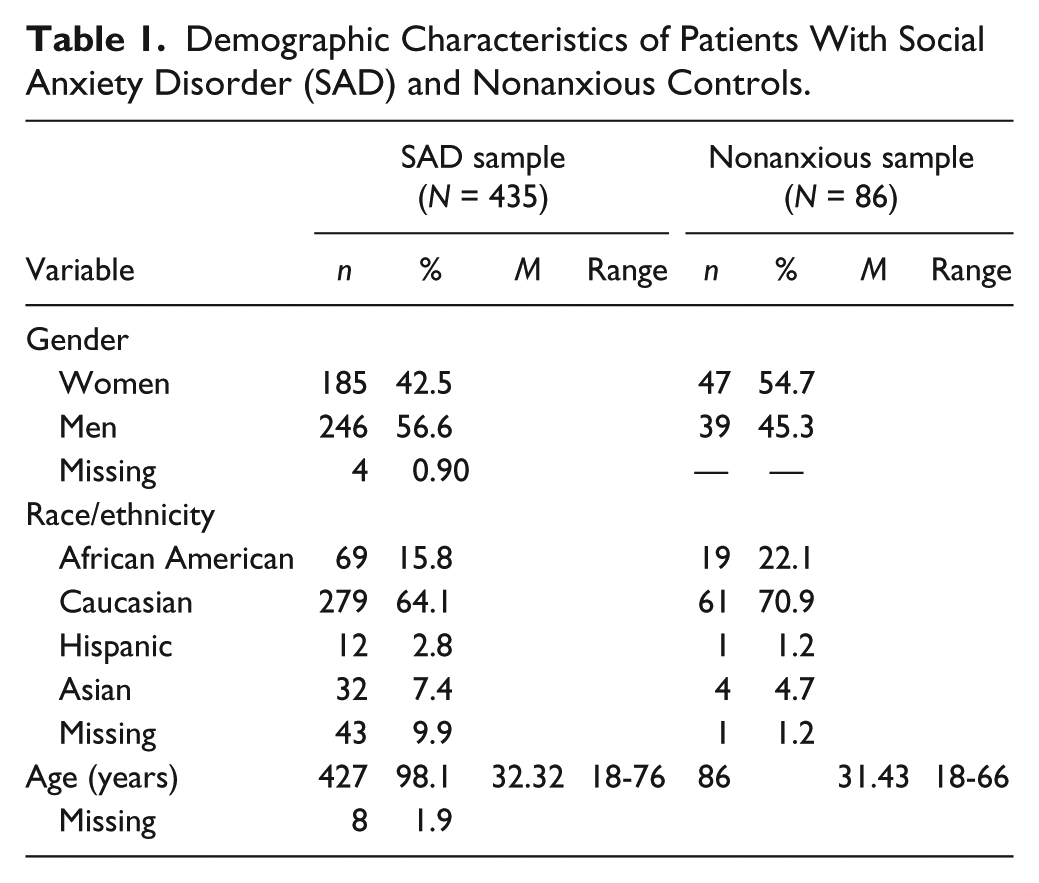
Data for individuals with SAD were collected from several sources, including a study of individual CBT augmentation of the efficacy of paroxetine conducted at the AACT (n = 48) and at the NYSPI (n = 92), a study of the efficacy of phenelzine and group CBT singly and in combination (Blanco et al., 2010) conducted at the AACT (n = 38) and at the NYSPI (because of clerical error, these participants’ data were not included in the current study), and a study of the efficacy of individual CBT compared with a waitlist control (Ledley et al., 2009) conducted at the AACT (n = 21) and the University of Nebraska-Lincoln (n = 17). The remaining participants with SAD received open treatment with individual (n = 113) or group (n = 106) CBT at the AACT. Data from nonanxious controls were collected solely at the AACT, and their demographic characteristics were similar to those of the AACT clinical sample. Demographic characteristics of each sample are presented in Table 1.
Demographic Characteristics of Patients With Social Anxiety Disorder (SAD) and Nonanxious Controls.
Measures
Social Interaction Anxiety Scale (SIAS) and Social Phobia Scale (SPS) (Mattick & Clarke, 1998)
The SIAS and SPS are companion measures that assess two distinct aspects of social anxiety: anxiety related to social interaction in dyads or groups (e.g., attending a social gathering, making small talk) and fear of being scrutinized in specific performance situations (e.g., formal speaking, eating, drinking, and writing in the presence of others). Sample items from the SIAS and SPS are “I feel tense if I am alone with just one person” and “I get nervous that people are staring at me as I walk down the street,” respectively. Each measure consists of 20 items that are scored on a 5-point Likert-type scale ranging from 0 (not at all a characteristic or true of me) to 4 (extremely characteristic or true of me). Both the SIAS and SPS have demonstrated strong internal consistency in clinical and undergraduate samples (αs > .84; Heimberg, Mueller, Holt, Hope, & Liebowitz, 1992; Mattick & Clarke, 1998). Furthermore, the test–retest correlations in a sample of patients with SAD at 4 and 12 weeks were strong (rs > .91; Mattick & Clarke, 1998). Peters (2000) found that both the SIAS and SPS correlated highly with the Social Phobia and Anxiety Inventory (Turner, Beidel, Dancu, & Stanley, 1989). Additionally, both scales reliably tracked changes in social anxiety in CBT (Ledley et al., 2009; Mattick et al., 1989; Mattick & Peters, 1988) and pharmacotherapy (Heimberg et al., 1998).
Rodebaugh, Woods, and Heimberg (2007) suggested using only the 17 straightforward SIAS items to calculate the total score (SIAS-S) since these items appear to be better indicators of social interaction anxiety, whereas the reverse-scored items are more highly related to extraversion. The SIAS-S has demonstrated excellent internal consistency (α = .93) in undergraduate samples. Although the 20-item SIAS was administered in the current study, only the 17-items from the SIAS-S were used to calculate total scores. Neither of the short forms developed by Peters et al. (2012) and Fergus et al. (2012) include the three reverse-scored items.
Short Forms of the SIAS and SPS
The six-item scales created by Peters et al. (2012) were developed using nonparametric item response theory. The SIAS-6A includes Items 2, 4, 6, 8, 10, and 13 from the SIAS-S long form, and the SPS-6A includes Items 4, 7, 8, 15, 16, and 17 from the SPS long form. In contrast, the six-item scales created by Fergus et al. (2012) were developed by focusing on the readability of items using four common readability tools, the Flesch-Kincaid Grade Level Formula (Kincaid, Fishburne, Rogers, & Chissom, 1975), the McLaughlin SMOG Formula (McLaughlin, 1969), the FORCAST Formula (Kern, Sticht, Welty, & Hauke, 1976), and the Dale–Chall reading tool (Chall & Dale, 1995). The percentage of monosyllabic words, the percentage of polysyllabic words, the ratio of syllables to words, and the percentage of difficult words was also considered in ranking each item on each scale. The SIAS-6B includes Items 3, 6, 8, 16, 18, and 19 from the SIAS-S long form, and the SPS-6B includes Items 4, 5, 8, 11, 18, and 19 from the SPS long form. Both sets of short forms are scored on the same 5-point scale as the long forms. Scores for all short forms were derived from the administration of the long forms for this study.
Measures for the Assessment of Convergent Validity
Liebowitz Social Anxiety Scale (LSAS; Liebowitz, 1987)
The LSAS is a 24-item clinician-administered scale that consists of 11 items assessing fear and avoidance in social settings (e.g., going to parties, meeting strangers) and 13 items assessing performance situations (e.g., speaking up at a meeting). All items are rated on 4-point scales of fear and avoidance, ranging from 0 (none and never) to 3 (severe and usually). The LSAS demonstrates good internal consistency (α = .96, Heimberg et al., 1999), and the total score correlates significantly with scores on other measures of social anxiety (Heimberg et al., 1992). The internal consistency of the LSAS in the current sample was excellent (SAD, α = .93; Control, α = .90).
Mini Social Phobia Inventory (Mini-SPIN; Connor, Kobak, Churchill, Katzelnick, & Davidson, 2001)
The Mini-SPIN is a 3-item screening measure for social anxiety. Specifically, the Mini-SPIN includes questions about avoidance and fear of embarrassment. The scale is rated based on the past week, and each item is rated using a 5-point scale, ranging from 0 (not at all) to 4 (extremely). A sample item is “Being embarrassed or looking stupid are among my worst fears.” In a study conducted by Weeks, Spokas, and Heimberg (2007), the Mini-SPIN demonstrated strong internal consistency (α = .85) and correlated significantly and positively with other measures of social anxiety. Furthermore, Osório, Crippa, and Loureiro (2010) reported that the Mini-SPIN displayed variable but adequate internal consistency (αs = .49-.73), correlated positively with other measures of social anxiety, displayed lower correlations with discriminant measures, and discriminated students with SAD from those without. The internal consistency of the Mini-SPIN in the current SAD sample was questionable (SAD, α = .63). No Mini-SPIN data were available for the nonanxious sample.
Brief Fear of Negative Evaluation Scale (BFNE; Leary, 1983)
The BFNE (Leary, 1983) is a 12-item scale designed to assess distress related to perceived negative evaluation by others. However, in response to evidence that the four reverse-scored items are vulnerable to response bias associated with level of education (Rodebaugh et al., 2004; Weeks et al., 2005), we computed BFNE total scores using only the 8 straightforward items. The score from the 8-item version will be referred to as the BFNE-Straightforward (BFNE-S) in the remainder of the article. A sample item is “I am frequently afraid of other people noticing my shortcomings.” In addition to showing excellent internal consistency (αs > .92; Rodebaugh et al., 2004; Weeks et al., 2005), the BFNE-S has also demonstrated excellent construct validity in clinical (Weeks et al., 2005) and undergraduate samples (Rodebaugh et al., 2004). The internal consistency of the BFNE-S in the current samples was excellent (SAD, α = .91; Control, α = .89).
Fear of Positive Evaluation Scale (FPES; Weeks, Heimberg, & Rodebaugh, 2008)
The FPES includes 10 items scored on a 10-point Likert-type scale, ranging from 0 (not at all true) to 9 (very true). Two reverse-scored items are included to assess response bias but are not included in the calculation of the total score. The FPES assesses fear of positive evaluation, or distress associated with being evaluated with approval in a public setting leading the individual to feel conspicuous or “in the spotlight” (Weeks, Jakatdar, & Heimberg, 2010). Fear of positive evaluation has been shown to be an important cognitive component of SAD (Heimberg, Brozovich, & Rapee, 2010). A sample item is “I am uncomfortable exhibiting my talents to others, even if I think my talents will impress them.” The FPES has demonstrated good internal consistency in clinical and nonanxious samples (αs > .83; Weeks, Heimberg, Rodebaugh, Goldin, & Gross, 2012). The FPES correlated significantly and positively with both the SIAS and SPS (Weeks, Heimberg, & Rodebaugh, 2008; Weeks, Heimberg, Rodebaugh, & Norton, 2008). In addition, fear of positive evaluation was found to mediate the relationship between social anxiety and discomfort when receiving positive feedback and partially mediate the relationship between social interaction anxiety and the tendency to question the accuracy of positive feedback (Weeks, Heimberg, Rodebaugh, & Norton, 2008). The internal consistency of the FPES in the current SAD sample was good (SAD, α = .80). We did not have FPES data for the nonanxious sample.
Measures for the Assessment of Discriminant Validity
Beck Depression Inventory–II (BDI-II; Beck, Steer, & Brown, 1996)
The BDI-II is a 21-item measure of depressive symptoms and attitudes. Each item is rated from 0 to 3. A sample item example is “Sadness—0 I do not feel sad; 1 I feel sad much of the time; 2 I am sad all the time; 3 I am so sad or unhappy that I can’t stand it.” The participant is asked to pick the statement that best describes how he or she has been feeling in the past 2 weeks. The BDI-II has demonstrated excellent internal consistency in both clinical and undergraduate samples (α > .92; Beck, Steer, & Brown, 1996). Additionally, the BDI-II has adequate internal consistency and convergent and discriminant validity (Beck, Steer, Ball, & Ranieri, 1996; Osman et al., 1997). In one study, the BDI-II was more strongly correlated with clinician-rated depression than clinician-rated anxiety (Beck, Steer, Ball, et al., 1996). The present study included data from both the BDI-IA (Beck, Rush, Shaw, & Emery, 1979) and the BDI-II. The standardization formula contained in the BDI-II manual was used to create comparable total scores. The internal consistency of the BDI-IA in the current samples was acceptable to excellent (SAD, α = .90; Control, α = .76). The internal consistency of the BDI-II in the current sample was excellent (SAD, α = .92). No BDI-II data were available for the nonanxious sample.
Penn State Worry Questionnaire (PSWQ; Meyer et al., 1990)
The PSWQ consists of 16 items designed to assess trait-worry, the core feature of generalized anxiety disorder (GAD). Each item is rated on a 5-point Likert-type scale, ranging from 1 (Not at all typical) to 5 (Very typical). A sample item is “My worries overwhelm me.” The PSWQ has displayed good to excellent internal consistency (e.g., α = .86-.83; Molina & Borkovec, 1994). Furthermore, individuals with GAD score higher on the PSWQ than do individuals with SAD (T. A. Brown, Antony, & Barlow, 1992). Fresco, Mennin, Heimberg, and Turk (2003) found the PSWQ to discriminate those with a diagnosis of GAD from those with a diagnosis of SAD. The internal consistency of the PSWQ in the current sample was acceptable (SAD, α = .79; Control, α = .75).
Anxiety Sensitivity Index (ASI; Reiss, Peterson, Gursky, & McNally, 1986)
The ASI is a 16-item scale designed to assess panic and anxiety sensations, as well as the perception that these sensations will have catastrophic consequences. Each item is rated on 5-point Likert-type scale, ranging from 0 (Very little) to 4 (Very much). An item example is “It scares me when my heart beats rapidly.” The ASI has demonstrated adequate test–retest reliability (r = .75, Reiss et al., 1986; r = .88, Peterson & Heilbronner, 1987). The internal consistency of the ASI in the current samples was good (SAD, α = .87; Control, α = .86).
Statistical Analyses
Internal Consistency and Correlational Analyses
For each set of 6-item scales (SIAS/SPS 6A and 6B), as well as for the original long forms of these scales, we assessed internal consistency separately for SAD and nonanxious samples. Average interitem correlations were also calculated, as were bivariate correlations between the short and long forms of the SIAS and SPS.
Convergent and Discriminant Validity Analyses
Within the SAD sample, relationships between each SIAS/SPS scale (i.e., all short forms as well as the original long forms) and measures of convergent and discriminant validity were examined by calculating bivariate correlations. To assess whether the two SIAS/SPS short forms differed from each other or from the long forms in terms of convergent and discriminant validity, we compared the obtained correlation coefficients using the formula developed by Meng, Rosenthal, and Rubin (1992).
Diagnostic and Treatment Sensitivity Analyses
To assess whether each short form adequately discriminated nonanxious controls from individuals with SAD, we conducted independent-sample t-tests and calculated effect sizes (Cohen’s d). Effect sizes for both short forms and the long forms were then compared.
To assess the sensitivity of each version of the SIAS/SPS to treatment (group and individual CBT and pharmacotherapy, considered together), we conducted paired-sample t tests on pre- and posttreatment scores and calculated effect sizes (Cohen’s d).
Readability Analyses
We calculated reading grade levels for all short forms using the same set of formulas originally reported by Fergus et al. (2012)—the Flesch-Kincaid Grade Level Formula (Kincaid et al., 1975), the McLaughlin (1969) SMOG Formula, the FORCAST Formula (Kern et al., 1976), and the Dale–Chall reading tool (Chall & Dale, 1995). Following those authors, we then calculated a “mean composite grade level” for each scale.
Results
Internal Consistency and Average Interitem Correlations
Cronbach’s alpha coefficients for both the long and short forms of the SIAS and SPS ranged acceptable to excellent (α = .74-.92) in the SAD sample and poor to good (α = .56-.87) in the nonanxious sample (see Table 2 for internal consistency data as well as average interitem correlations).
Internal Consistency for the Original and Short Forms of the SIAS and SPS Among Patients With Social Anxiety Disorder (SAD) and Nonanxious Controls.

Note. SIAS-S = Social Interaction Anxiety Scale Straightforward; SPS = Social Phobia Scale; SIAS/SPS-6A = Social Interaction Anxiety Scale/Social Phobia Scale Version A (Peters et al., 2012); SIAS/SPS-6B = Social Interaction Anxiety Scale/Social Phobia Scale Version B (Fergus et al., 2012).
Correlations Between the Short and Long Forms of the SIAS and SPS
The SIAS-S correlated .94 (n = 495) with the SIAS-6A and .97 (n = 496) with the SIAS-6B. The long form of the SPS correlated .91 (n = 500) with the SPS-6A and .89 (n = 500) with the SPS-6B.
Convergent Validity
Bivariate correlations were calculated to determine the relationships between scores on SIAS/SPS scales and each measure of convergent validity (LSAS, Mini-SPIN, BFNE-S, FPES; see Table 3). Scores on all versions of the SIAS/SPS were significantly and positively correlated (ps < .05) with measures of convergent validity with the exception of the correlation between the SPS-6B and the Mini-SPIN, which was not significant.
Correlation Between Different Versions of the SIAS/SPS and Measures of Convergent Validity Among Patients With Social Anxiety Disorder.
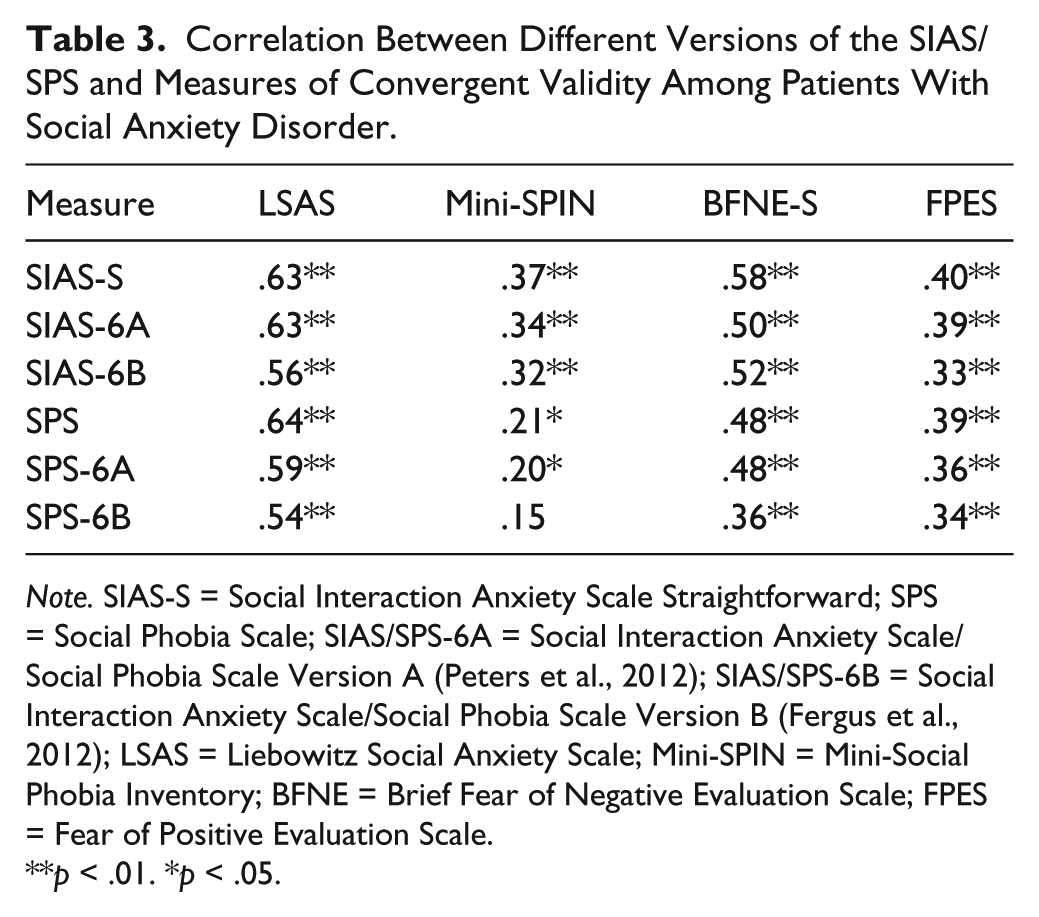
Note. SIAS-S = Social Interaction Anxiety Scale Straightforward; SPS = Social Phobia Scale; SIAS/SPS-6A = Social Interaction Anxiety Scale/Social Phobia Scale Version A (Peters et al., 2012); SIAS/SPS-6B = Social Interaction Anxiety Scale/Social Phobia Scale Version B (Fergus et al., 2012); LSAS = Liebowitz Social Anxiety Scale; Mini-SPIN = Mini-Social Phobia Inventory; BFNE = Brief Fear of Negative Evaluation Scale; FPES = Fear of Positive Evaluation Scale.
p < .01. *p < .05.
Comparison of the Two Short Forms
The SPS-6A and SPS-6B demonstrated some differences in convergent validity. The SPS-6A was significantly more highly correlated with the LSAS than was the SPS-6B (z = 2.13, p < .05). Similarly, the SPS-6A showed a significantly higher correlation with the BFNE-S compared with the SPS-6B (z = 4.44, p < .01). No other measures of convergent validity differed in their relationships to the short forms.
Comparison of the Short Forms and the Long Forms
The SIAS-6A/6B and the SPS-6A/6B demonstrated significant differences in convergent validity when compared with their longer counterparts. The SIAS-S had a significantly higher correlation with the LSAS than the SIAS-6B (z = 4.04, p < .01) but not the SIAS-6A. The SPS had a significantly higher correlation with the LSAS than either the SPS-6A (z = 2.64, p < .01) or the SPS-6B (z = 5.14, p < .01). Last, the SPS had a significantly higher correlation with the BFNE-S than the SPS-6B (z = 4.94, p < .01) but not the SPS-6A.
Discriminant Validity
Bivariate correlations were calculated to determine the relationships between scores on each SIAS/SPS scale and each measure of discriminant validity (ASI, BDI-II, PSWQ; see Table 4). Scores on all forms of the SIAS/SPS were significantly and positively correlated with scores on each of the measures of discriminant validity (ps < .05), except for the correlation between the ASI and the SIAS-6B, which was not significant.
Correlations Between Different Versions of the SIAS/SPS and Measures of Discriminant Validity Among Patients With Social Anxiety Disorder.
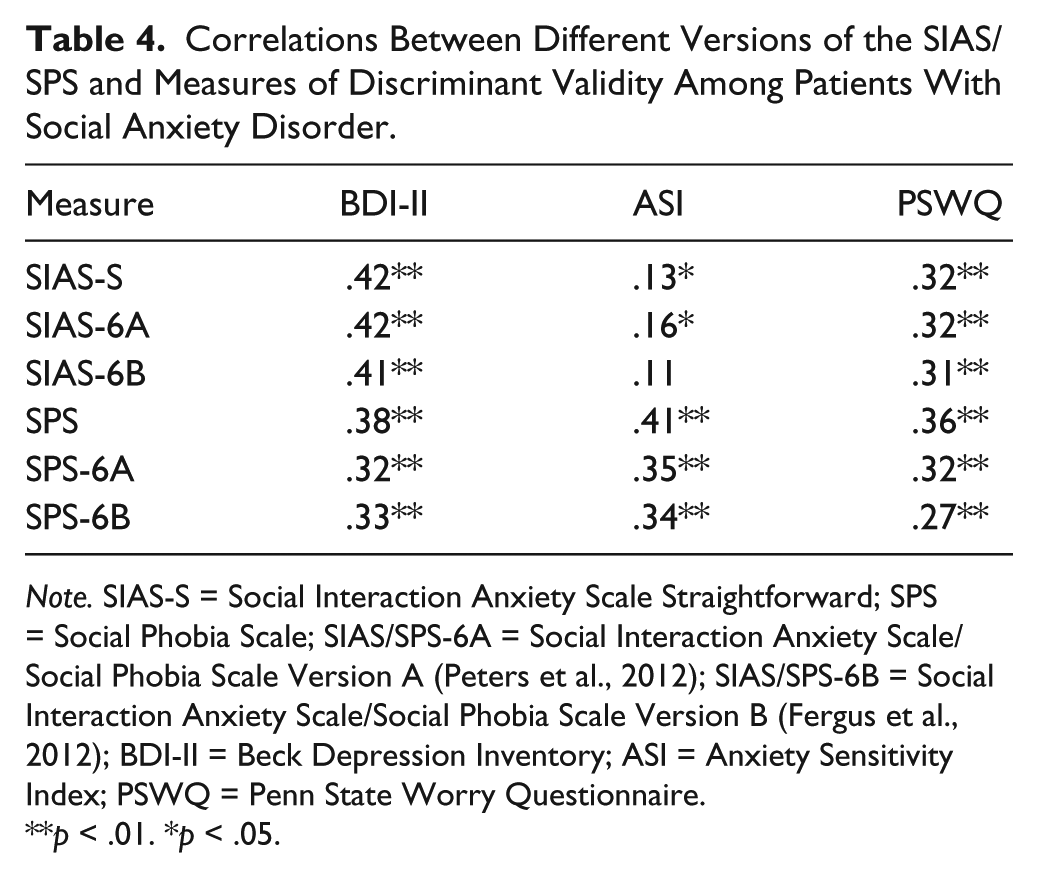
Note. SIAS-S = Social Interaction Anxiety Scale Straightforward; SPS = Social Phobia Scale; SIAS/SPS-6A = Social Interaction Anxiety Scale/Social Phobia Scale Version A (Peters et al., 2012); SIAS/SPS-6B = Social Interaction Anxiety Scale/Social Phobia Scale Version B (Fergus et al., 2012); BDI-II = Beck Depression Inventory; ASI = Anxiety Sensitivity Index; PSWQ = Penn State Worry Questionnaire.
p < .01. *p < .05.
In general, the SIAS and SPS short forms were more strongly related to measures of related constructs (i.e., LSAS, Mini-SPIN, BFNE-S, FPES) than to measures of unrelated constructs (i.e., BDI-II, ASI, PSWQ). However, counter to expectations, some versions of the SIAS/SPS showed equivalent or stronger correlations with measures of discriminant validity than measures of convergent validity (see Tables 3 and 4 for correlation coefficients).
Comparison of the Two Short Forms
There were no significant differences in discriminant validity between the two short forms.
Comparisons of Short Forms and Long Forms
There were significant differences in correlations between scores on the SIAS/SPS long forms and three of the four short forms (SIAS-6B, SPS-6A, SPS-6B) in relationship to measures of discriminant validity. Specifically, the SIAS-6B had a significantly lower correlation with the BDI-II than the SIAS-S (z = 4.11, p < .01), but the SIAS-6A did not significantly differ from the SIAS-S. The SPS-6A had a significantly lower correlation with the BDI-II than the SPS (z = 2.20, p < .05), but the SPS-6B did not significantly differ from the SPS. The SPS-6A (z = 2.83, p < .01) and the SPS-6B (z = 2.85, p < .01) both had significantly lower correlations with the ASI than the SPS. In addition, the SPS-6B had a significantly lower correlation with the PSWQ than the SPS (z = 2.19, p < .05), but the SPS-6A did not significantly differ from the SPS.
Diagnostic Sensitivity
To assess whether each version of the SIAS and SPS adequately discriminated nonanxious controls from individuals with SAD, we conducted independent-sample t tests and calculated effect sizes (Cohen’s d). All forms successfully discriminated between individuals with SAD and nonanxious controls, with large effect sizes (see Table 5).
Diagnostic Sensitivity: Means, Standard Deviations, and Effect Sizes Among Patients With Social Anxiety Disorder (SAD) and Nonanxious Controls.

Note. SAD sample (n = 429). Nonanxious sample (n = 86). SIAS-S = Social Interaction Anxiety Scale Straightforward; SPS = Social Phobia Scale; SIAS/SPS-6A = Social Interaction Anxiety Scale/Social Phobia Scale Version A (Peters et al., 2012); SIAS/SPS-6B = Social Interaction Anxiety Scale/Social Phobia Scale Version B (Fergus et al., 2012).
p < .01.
Sensitivity to Treatment
We examined the sensitivity of each version of the SIAS/SPS to treatment (CBT and pharmacotherapy, considered together) by conducting paired-sample t tests on pre- and posttreatment scores and calculating effect sizes. Results from the t tests suggest that all versions of the SIAS and SPS are sensitive to the effects of treatment (see Table 6); however, effect sizes differed. The SIAS-S showed a large treatment effect size (d = 1.21), slightly larger than those demonstrated by the short forms of that scale, which were also large (SIAS-6A d = 1.03; SIAS-6B d = 1.05). The SPS displayed a large effect size (d = 1.06), as did the SPS-6A (d = 0.84), but the SPS-6B (d = 0.33) displayed only a small effect size.
Sensitivity to Treatment: Means, Standard Deviations, and Effect Sizes Among Patients With Social Anxiety Disorder.
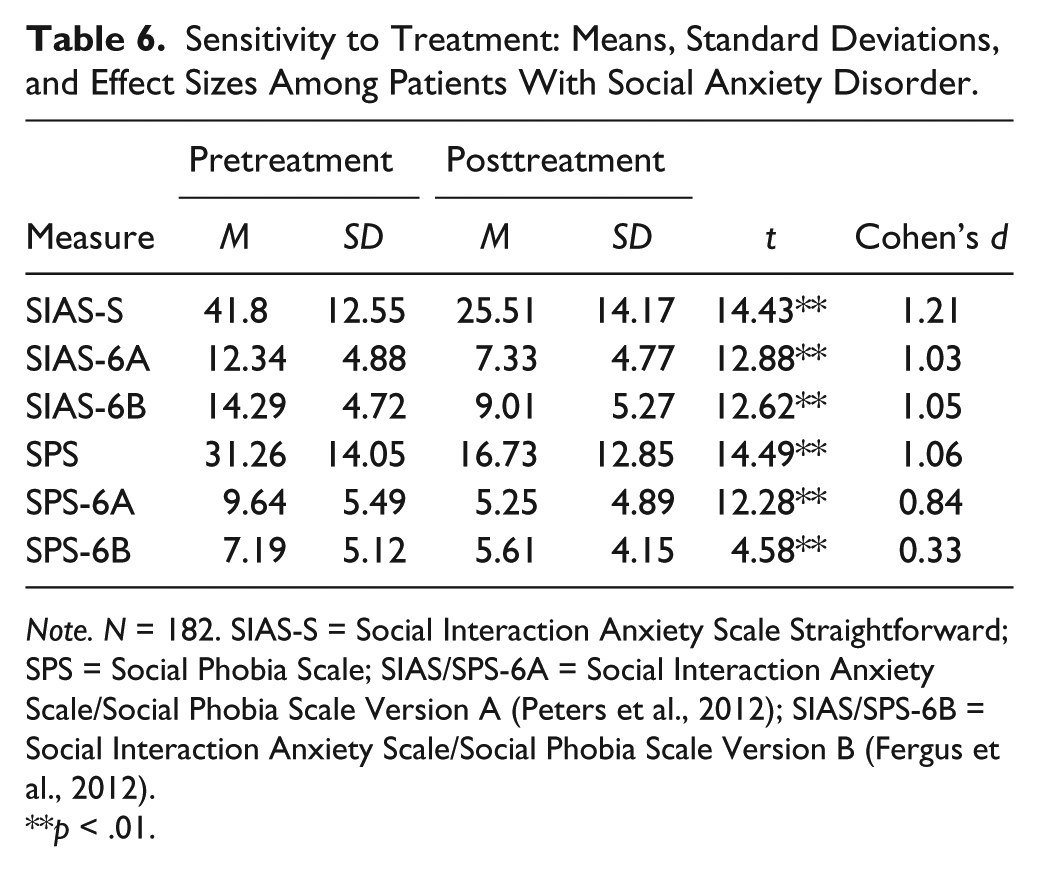
Note. N = 182. SIAS-S = Social Interaction Anxiety Scale Straightforward; SPS = Social Phobia Scale; SIAS/SPS-6A = Social Interaction Anxiety Scale/Social Phobia Scale Version A (Peters et al., 2012); SIAS/SPS-6B = Social Interaction Anxiety Scale/Social Phobia Scale Version B (Fergus et al., 2012).
p < .01.
Readability
We first compared our readability calculations for the SIAS-6B and SPS-6B with those reported by Fergus et al. (2012). Although there were minor differences from formula to formula, we essentially replicated their findings of good readability scores for these short forms (mean composite scores for the SIAS-6B and the SPS-6B were 5.9 and 5.1, respectively; similar scores as reported by Fergus et al. were 5.6 and 4.9). We do not consider these differences to be meaningful. The mean composite scores for the SIAS-6A and the SPS-6A were 7.7 and 6.9, respectively. Thus, by our calculations, the 6B forms required less reading skill to adequately comprehend than the 6A forms (a difference of 1.8 grade levels for each scale). 3
Discussion
The aim of the present study was to examine the psychometric properties of two short forms of the SIAS and SPS in a treatment-seeking sample of individuals with SAD and a sample of nonanxious controls. We sought to replicate and extend the findings of Peters et al. (2012) and Fergus et al. (2012). Specifically, we compared the short forms with each other and with the original long forms on indices of internal consistency, validity, diagnostic sensitivity (compared with a sample of nonanxious control participants), treatment sensitivity, and readability.
Consistent with the findings of Fergus et al. (2012), the SIAS-6B and SPS-6B displayed adequate internal consistency within the SAD sample. Furthermore, we extended the findings of Peters et al. (2012), who did not report internal consistency data, by demonstrating that the SIAS-6A and SPS-6A displayed adequate internal consistency within the SAD sample. We also assessed the internal consistency of the SIAS-S, SPS, and their short forms within the nonanxious sample. All versions of the SIAS, as well as the SPS and SPS-6A, displayed good internal consistency. In contrast to the findings reported by Fergus et al. (2012), internal consistency of the SPS-6B was poor in our nonanxious sample.
It is likely that the different methods used to create the 6A and 6B scales affected our pattern of results. The 6A scales were developed using IRT, which seeks to maximize the relationships among items, whereas the 6B scale was developed based on item readability—a process that is conceptually agnostic. Thus, the 6B scales, and in particular the short form of the SPS (which has been shown in previous research to be multifactorial; e.g., Safren, Turk, & Heimberg, 1998), may contain more heterogeneous item content, and it may be prudent to consider our results in light of this notion. However, as noted by McCrae, Kurtz, Yamagata, and Terracciano (2011), compared with other indices of reliability, internal consistency may be of limited utility for evaluating the potential validity of developed scales.
Consistent with the performance of the SIAS-S and SPS in previous research, both six-item versions correlated significantly and positively with most measures of convergent validity. The one exception was the Mini-SPIN, which did not correlate significantly with the SPS-6B. While unexpected, this finding is not surprising considering (a) the Mini-SPIN showed questionable internal consistency in the SAD sample and could have contributed to variability through measurement error and (b) prior research has shown lower correlations between the SPS and the Mini-SPIN as compared with the LSAS, BFNE, and SIAS (Weeks et al., 2007).
In general, our findings not only replicate but also extend prior research. Whereas the developers of the short forms reported data for only two convergent measures each, our study examined four convergent measures (LSAS, Mini-SPIN, BFNE-S, FPES). The SPS-6A displayed better convergent validity than the SPS-6B, correlating significantly more highly with two of the four measures (LSAS, BFNE-S) and similarly with the other two measures (Mini-SPIN, FPES). This is consistent with findings reported by Fergus et al. (2012) of higher correlations between the BFNE-S and the SPS compared with the SPS-6B. In our analyses, the short forms of the SIAS displayed similarly good convergent validity, although the SIAS-6B was less strongly correlated with the LSAS than was the SIAS-S, consistent with the report of Fergus et al. (2012) for the LSAS-SR.
We found no significant differences in discriminant validity between the short forms. However, some significant differences between the SIAS-S and the SIAS-6B, and between the SPS and both SPS short forms, were noted. The SIAS-6B displayed better discriminant validity than the SIAS-S, as suggested by its significantly lower correlation with the BDI-II. Both the SPS-6A and SPS-6B showed better discriminant validity than the SPS (SPS-6A: significantly lower correlations with the BDI-II and ASI; SPS-6B: significantly lower correlations with the ASI and PSWQ). These findings suggest that all four short forms adequately discriminate between social anxiety and distinct-but-related constructs and performed better in this regard than their longer counterparts. It is likely that the reduction of problematic items (i.e., items that contain random error), as well as a lowered ability to correlate with other forms in general as a function of scale length, produced these improvements in discriminant validity. Furthermore, it is possible that the short forms did not capture as much variance because of general distress or underlying personality traits. Future research might explore this possibility by comparing the variance “left over” on short and long SIAS/SPS forms after controlling for general distress, trait anxiety, or neuroticism.
Both Fergus et al. (2012) and Peters et al. (2012) attempted to create short forms of the SIAS/SPS that would reduce response time without compromising the scales’ psychometric properties. Because these scales are widely used in clinical and research contexts, it is important that they reliably distinguish between groups with higher and lower levels of social anxiety. Peters et al. (2012) found that the SIAS-6A and the SPS-6A discriminated well between groups of participants with and without SAD; however, the SIAS-6A did not perform as well as the long form of the SIAS in this respect. In contrast, our findings suggest that all forms of the SIAS and SPS discriminated well between patients and nonanxious controls. Effect sizes for all scales, long and short, were large, suggesting little difference in diagnostic sensitivity across scales. Thus, the use of these short forms appears to be apt for both clinical and research applications.
Furthermore, it is vitally important for treatment outcome research that measures reliably capture changes in social anxiety over the course of treatment. Peters et al. (2012) found that the short forms did not differ from the long forms in their ability to measure symptom reductions over the course of CBT for patients with SAD. We replicated and extended these findings in a sample of outpatients with SAD who received CBT and/or pharmacotherapy. The SIAS short forms adequately and similarly captured changes across treatment in comparison to the full-length SIAS-S. Of the SPS forms, the original SPS long form was most sensitive to treatment changes, followed by the SPS-6A, followed by the SPS-6B. Each version of the SIAS and SPS adequately captured changes in social anxiety due to treatment, with the exception of the SPS-6B, which demonstrated a smaller effect size than the original SPS or the SPS-6A.
Overall, the results of this study indicate that the SIAS-6A/SPS-6A and the SIAS-6B/SPS-6B can be used to assess social interaction anxiety and fears about scrutiny in place of their longer counterparts. In addition to the added efficiency of being shorter, both the SIAS-6A and SIAS-6B are free of heterocentric bias that has been identified as problematic in the original SIAS (Weiss, Hope & Capozzoli, 2013). However, although free of heterocentric bias, the short forms do not exclude items that appeared to be problematic when administered to groups differing in ethnicity (Hambrick et al., 2010). Future research might examine whether the short forms demonstrate the same ethnic variance.
Although there is no overwhelming evidence to suggest the use of either set of short forms over the other, our findings suggest that some degree of caution is appropriate when using the SPS-6B. The SPS-6B had the lowest internal consistency and average interitem correlation by a considerable margin. Problems with internal consistency/average interitem correlation were particularly marked in the nonanxious sample, suggesting that the SPS-6A may be preferable in this context. Additionally, the SPS-6B was relatively poor at capturing social anxiety symptom change over the course of treatment and showed lower correlations with well-validated convergent measures (LSAS and BFNE-S). On the other hand, the 6B scales may also be more appropriate for use with individuals who have low levels of educational achievement or for whom English is not their primary language. Future research might examine whether the SIAS/SPS-6B are preferred for use in populations with below average reading-levels, as readability was the primary consideration in item selection by Fergus et al. (2012), and our analyses do suggest that the 6B scales are more readable than the 6A scales. For the time being, we recommend that researchers and clinicians selecting short social anxiety self-report measures do so based on their unique needs (i.e., whether they require scales that are highly internally consistent and valid within a variety of populations or those that are more widely readable).
A significant limitation of the present study is the use of data from administrations of the original SIAS and SPS long forms to calculate total scores for the 6-item scales. It is possible that the short forms, if administered independently, might show different relationships to each other or to the long forms. Future research should explore this possibility. Furthermore, we did not include in our analyses the slightly longer scales developed by Kupper and Denollet (2012) or the 14-item Social Interaction Phobia Scale (Carleton et al., 2009), which integrates items from both the SIAS and SPS into a single measure. Future research should examine and compare the psychometric qualities of all short forms inclusively.
Our study also has some notable strengths. First, we included a large and carefully diagnosed clinical sample, which is rare in this type of research. We also included more measures of convergent and discriminant validity than either Fergus et al. (2012) or Peters et al. (2012). Furthermore, unlike both Fergus et al. (2012) and Peters et al. (2012), we assessed internal consistency, discriminant and convergent validity, diagnostic sensitivity, treatment sensitivity, and readability together in one study.
Overall, results from our analyses suggest that, like their longer counterparts, the SIAS-6A/SPS-6A and the SIAS-6B/SPS-6B have sound psychometric properties, displaying adequate internal consistency, convergent and discriminant validity, diagnostic discrimination, and treatment sensitivity. These findings support use of both sets of short forms in clinical and research settings to reduce response burden and simplify screening procedures. However, we urge clinicians and researchers to look at each set of scales’ strengths and weaknesses when considering whether one is more appropriately suited to their goals.
Footnotes
Authors’ Note
Portions of this article were presented at the 2013 meeting of the Association for Behavioral and Cognitive Therapies.
Declaration of Conflicting Interests
The author(s) declared the following potential conflicts of interest with respect to the research, authorship, and/or publication of this article: Michael Liebowitz holds the copyright for the Liebowitz Social Anxiety Scale, which was used in this study. The authors have no other direct or indirect conflicts of interest, financial or personal relationships or affiliations to disclose.
Funding
The author(s) disclosed receipt of the following financial support for the research, authorship, and/or publication of this article: The research reported herein was supported in part by grants from the National Institute of Mental Health to Richard G. Heimberg (MH64481, MH44119) and to Michael R. Liebowitz (MH64726) and from the National Institute of Drug Abuse to Carlos Blanco (DA23200) and by the New York State Psychiatric Institute (Drs. Blanco and Schneier).