
Abstract
Social anxiety is a common psychological disorder that often emerges during adolescence and is associated with significant impairment. Efforts to prevent social anxiety disorder require sound assessment measures for identifying anxious youth, especially those from minority backgrounds. We examined the factorial invariance and latent mean differences of the Social Anxiety Scale for Adolescents (SAS-A) across gender and age groups in Hispanic American adolescents (N = 1,191; 56% girls; 15-18 years) using multigroup confirmatory factor analyses. Results indicated that the factorial configuration of the correlated three-factor model of the SAS-A was invariant across gender and age. Analyses of latent mean differences revealed that boys exhibited higher structured means than girls on the Social Avoidance and Distress–General (SAD-General) subscale. On all SAS-A subscales, Fear of Negative Evaluation, Social Avoidance and Distress-New, and SAD-General, estimates of the structured means decreased with adolescent age. Implications for further research and clinical practice are discussed.
Social anxiety involves marked and persistent fear of one or more social situations (American Psychiatric Association, 2013). Social anxiety disorder is common among youth, often emerging during adolescence (Beesdo, Knappe, & Pine, 2009) and is associated with low rates of recovery and significant impairments in social functioning (e.g., Keller, 2006).
Even at subclinical levels, youth with elevated levels of social anxiety demonstrate impaired peer relations (e.g., Inderbitzen-Nolan & Walters, 2000; La Greca & Lopez, 1998), impaired social skills (Spence, Donovan, & Brechman-Toussaint, 1999), and comorbid psychological disorders (Essau, Conradt, & Petermann, 1999). For example, socially anxious adolescents have fewer and poorer quality friendships and demonstrate delays and/or impairments in their romantic relationships (e.g., Glickman & La Greca, 2004; Herbert, Fales, Nangle, Papadakis, & Grover, 2013; La Greca & Harrison, 2005).
Currently, little is understood about social anxiety symptoms among Hispanic American adolescents, despite the fact that Hispanic Americans comprise the fastest growing segment of the U.S. population (Bureau of the Census, 2011) and are the least likely to use mental health services (Glover, Pumariega, Holzer, Wise, & Rodriguez, 1999). Efforts are needed to understand social anxiety among Hispanic American adolescents in order to develop culturally appropriate intervention programs for such youth.
Although self-report questionnaires are a common method for assessing social anxiety in adolescents, no social anxiety measures have been validated for use with Hispanic American adolescents. For the present study, we focused on the Social Anxiety Scale for Adolescents (SAS-A; La Greca & Lopez, 1998), because it is a widely used empirically-supported measure of social anxiety that has been recommended for screening or formal clinical evaluations (Garcia-Lopez, Ingles, & Garcia-Fernandez, 2008; Kearney, 2005).
Thus, our first study aim was to examine the construct validity of the SAS-A with Hispanic American adolescents, an important first step in evaluating whether aspects of social anxiety may be universal versus subcultural and context-specific (e.g., Hambrick et al., 2010). Social anxiety measures may perform differently in individuals from different ethnic/cultural backgrounds (e.g., Hambrick et al., 2010). The psychometric properties of the SAS-A obtained from predominantly European American youth (e.g., Inderbitzen-Nolan & Walters, 2000) may or may not generalize to Hispanic American youth.
Previous research with the SAS-A (Ingles, La Greca, Marzo, Garcia-Lopez, & Garcia-Fernandez, 2010; La Greca & Lopez, 1998) identified a three-factor structure: (a) Fear of Negative Evaluation (FNE), or fears, concerns, or worries regarding peers’ negative evaluations; (b) Generalized Social Avoidance and Distress (SAD-General), or general social inhibition, distress, and discomfort with peers; and (c) Social Avoidance Specific to New Situations or Unfamiliar Peers (SAD-New), or avoidance or distress with unfamiliar peers or social situations. Additional studies support the validity of the SAS-A and its subscales, which have been related to measures of social functioning, such as peer relations and acceptance/rejection, close friendships, and perceptions of social support (Inderbitzen et al., 1997; La Greca & Lopez, 1998), as well as to other measures of social anxiety (Cunha, Gouveia, Alegre, & Salvador, 2004; Zhou, Xu, Ingles, Hidalgo, & La Greca, 2008).
We evaluated the construct validity of the SAS-A for Hispanic American adolescents, following the steps outlined by Dimitrov (2010). Specifically, we examined the following: (a) configural or form invariance (i.e., whether the three-factor structure of the SAS-A was equivalent) across gender and age groups, (b) measurement invariance (i.e., whether there was equivalence in how adolescents ascribed meaning to the three factors) across gender and age groups, and (c) structural invariance (i.e., equivalence of variance and covariance structures) across gender and age groups. Establishing construct validity in this manner allows researchers to distinguish “true” differences between groups from measurement differences.
Our second study aim examined gender and age differences in Hispanic American adolescents’ symptoms of social anxiety. We expected that girls might report greater overall social anxiety than boys, as some previous studies found that girls reported higher scores than boys on the SAS-A total and the FNE and SAD-New subscales (e.g., Cunha et al., 2004; Inderbitzen-Nolan & Walters, 2000; La Greca & Lopez, 1998). We did not establish a priori expectations about age-related differences, as previous findings are inconsistent regarding age differences in social anxiety. Some studies have not found age or grade differences for the SAS-A (Cunha et al., 2004; García-López et al., 2001; La Greca & Lopez, 1998), whereas others have found that younger adolescents report higher scores than older adolescents on the SAS-A or one of its subscales (Inderbitzen-Nolan & Walters, 2000; Storch, Masia-Warner, Dent, Roberti, & Fisher, 2004).
In summary, our first study aim was addressed by (a) examining the internal consistencies of the SAS-A total and subscale scores, (b) examining the normality or distribution of the SAS-A items by gender and adolescent age groups, and (c) analyzing form and measurement invariance, using multigroup confirmatory factor analysis (MGCFA). The second study aim was addressed by analyzing the invariance of latent mean (LM) structures on the SAS-A across gender and adolescent age groups, using MGCFA.
Method
Participants
The sample included 1,191 adolescents (57.8% girls) between 15 and 18 years of age (M = 16.46; SD = 1.05) attending public high schools (Grades 9-12) in Miami-Dade County, FL. The distribution of the sample according to gender and age was 282 (113 boys, 169 girls) 15 year olds, 303 (126 boys, 177 girls) 16 year olds, 380 (146 boys, 234 girls) 17 year olds, and 226 (118 boys, 108 girls) 18 year olds. All adolescents were from Hispanic backgrounds (countries of origin were most commonly Latin or South American). Approximately 70% of the adolescents reported speaking Spanish as their first language.
Procedures
Participants were drawn from three large, unselected community samples of adolescents who participated in studies of adolescent peer relations conducted between 2002 and 2008 (e.g., La Greca & Mackey, 2007). Study protocols were approved by the University of Miami Institutional Review Board. Parents (or adolescents who were 18 years of age) provided informed consent for adolescent participation; adolescents also provided written assent. All data were collected during the spring of the school year in a group setting.
Measures
The SAS-A (La Greca & Lopez, 1998) contains 18 items (e.g., “I worry about what others think of me”) rated on a 5-point Likert-type scale, ranging from 1 (not at all) to 5 (all the time). The FNE subscale contains eight items, the SAD-General subscale contains six items, and the SAD-New subscale contains four items. Subscale items are summed so that higher scores reflect greater social anxiety. The three subscales also are summed to form a total SAS-A score, which can range from 18 to 90.
Statistical Analyses
First, we estimated internal consistency reliability for the SAS-A total and subscales using Cronbach’s alpha, both for the entire sample and by gender and age groups. Second, we examined the normality or distribution of the SAS-A items by obtaining univariate skewness, univariate kurtosis, and multivariate kurtosis values, following the procedures outlined by Finney and DiStefano (2006). Third, we conducted MGCFA to investigate the factorial invariance of the SAS-A across gender and age groups. Specifically, we analyzed the configural or form invariance (i.e., whether the three-factor structure of the SAS-A holds across groups); the measurement invariance, which includes the metric invariance (i.e., equal factor loadings across groups) and the scalar invariance (i.e., equal item intercepts across groups); and the structural invariance (i.e., invariance of factor variances and covariances). Finally, we analyzed LM differences on the SAS-A subscales across gender and age groups using structured means modeling approach.
Results
Internal Consistency Reliability
Coefficient alpha estimates of internal consistency for the SAS-A total and the three subscales were all >.70. They ranged from .72 (SAD-General) to .89 (FNE) for the entire sample. By gender, the coefficients ranged from .76 (SAD-General) to .89 (FNE) for boys and from .71 (SAD-General) to .89 (FNE) for girls. By age groups, the coefficients ranged from .70 (SAD-General) to .88 (FNE) for 15 and 16 year olds, .73 (SAD-General) to .90 (FNE) for 17 year olds, and .76 (SAD-General) to .89 (FNE) for 18 year olds.
Testing for Configural/Form Invariance of the SAS-A Across Gender and Age
We examined assumptions for univariate and multivariate normality by obtaining univariate skewness and univariate kurtosis values and the Mardia’s normalized multivariate kurtosis coefficient. Analyses used EQS Version 6.1 (Bentler, 2005).
Univariate skewness and univariate kurtosis values were acceptable and within the expected range for normality across gender and age groups. For example, the range for these values was close to 0.0 in all cases (Finney & DiStefano, 2006). However, we found evidence of multivariate nonnormality in all samples; values were much higher than 3 in all samples by gender and age groups, indicating deviation from normality in the distribution of SAS-A scores by groups (Bentler, 2005). Thus, based on Finney and DiStefano (2006), we used the Satorra–Bentler chi-square (SBχ2) scaling method (Satorra & Bentler, 1994). Robust comparative fit indexes were also examined (robust comparative fit index [R-CFI], robust root mean square error of approximation [R-RMSEA]; Hu & Bentler, 1999).
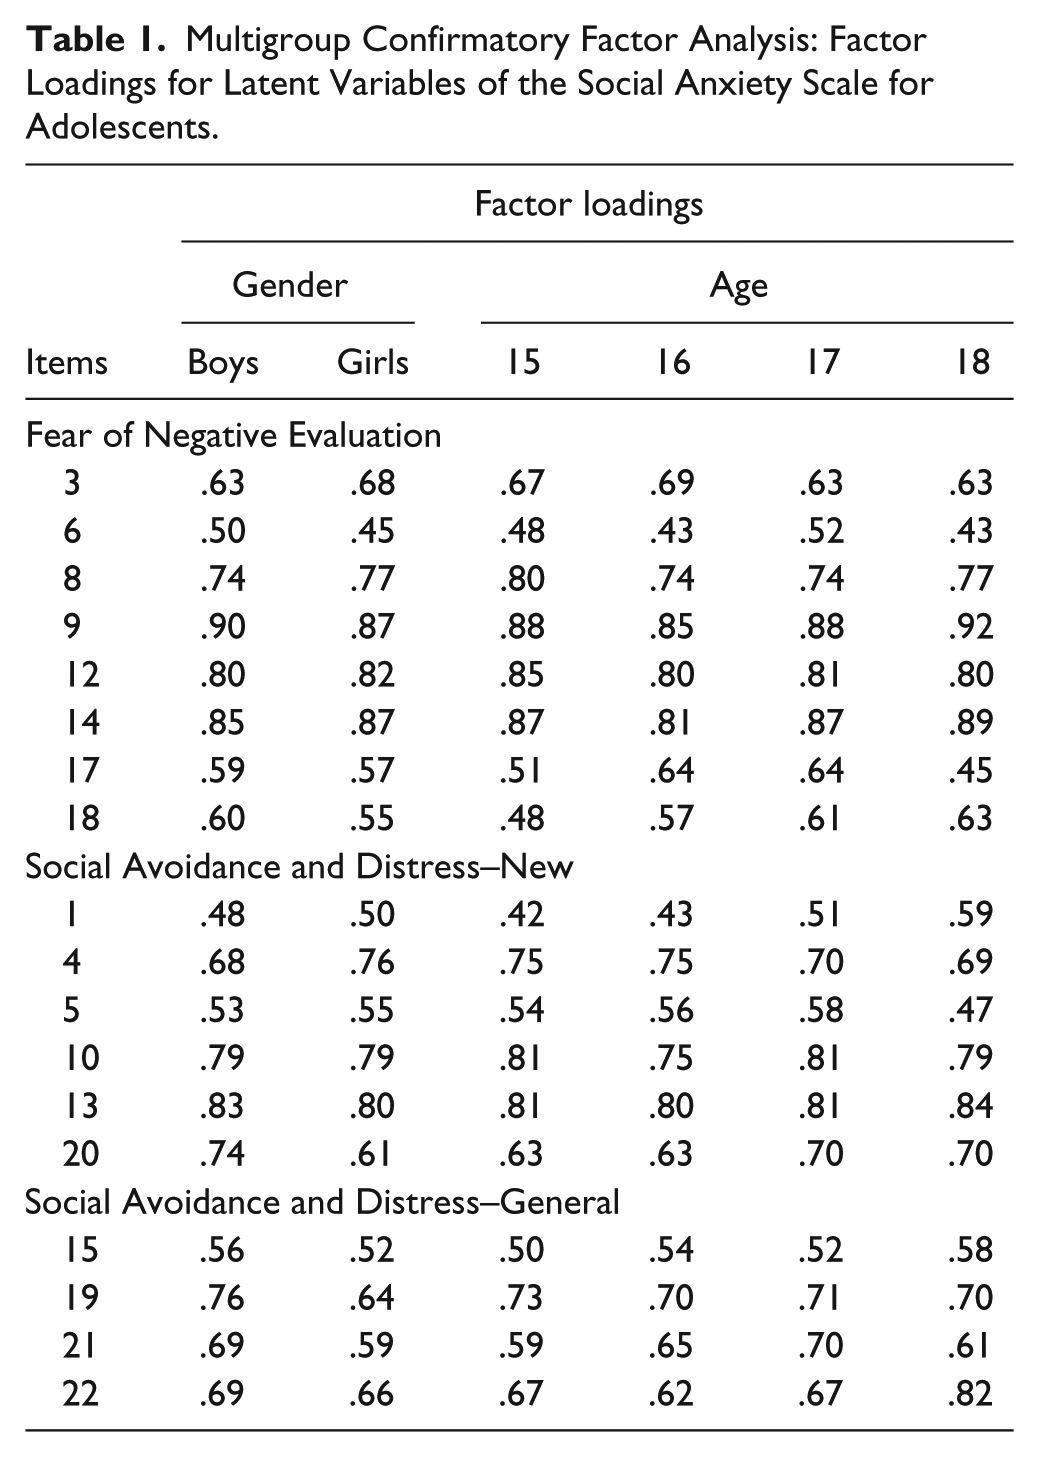
We tested the adequacy of the correlated three-factor structure of the SAS-A for Hispanic American adolescents divided by gender and age. Table 1 contains factor loadings for latent variables; all items had a factor loading greater than .40. Furthermore, correlations between the latent dimensions of the SAS-A were similar across gender and age groups (Table 2). Intercorrelations among the SAS-A factors across gender and age were high in magnitude (correlation greater than .50; Cohen, 1988). Overall, the fit of the three-factor model of the SAS-A was reasonable for girls, boys, and various age groups, with appropriate values for R-CFI, R-RMSEA, and standardized root mean square residual (SRMR; see Table 3). Furthermore, using the full sample, we compared a one-factor model of social anxiety with the three-factor model. The one-factor model did not fit the data well: Sattora Bentler Scaled Chi-Square (SBχ2) = 1530.85, gl = 133, p < .001, R-CFI = .81, R-RMSEA = .09 (confidence interval [CI] = .09, .10), and SRMR = .08. In contrast, the three-factor model had a good fit, SBχ2 = 702.88, gl = 132, p < .001, R-CFI = .92, R-RMSEA = .06 (CI = .06, .07), and SRMR = .06. We did the same for boys, girls, and all age groups, obtaining a similar pattern of results in all cases. Thus, there is configural invariance of the CFA model across gender and age groups.
Multigroup Confirmatory Factor Analysis: Factor Loadings for Latent Variables of the Social Anxiety Scale for Adolescents.
Correlations Between Latent Dimensions of the Social Anxiety Scale for Adolescents by Gender and Age Groups in the MGCFA.
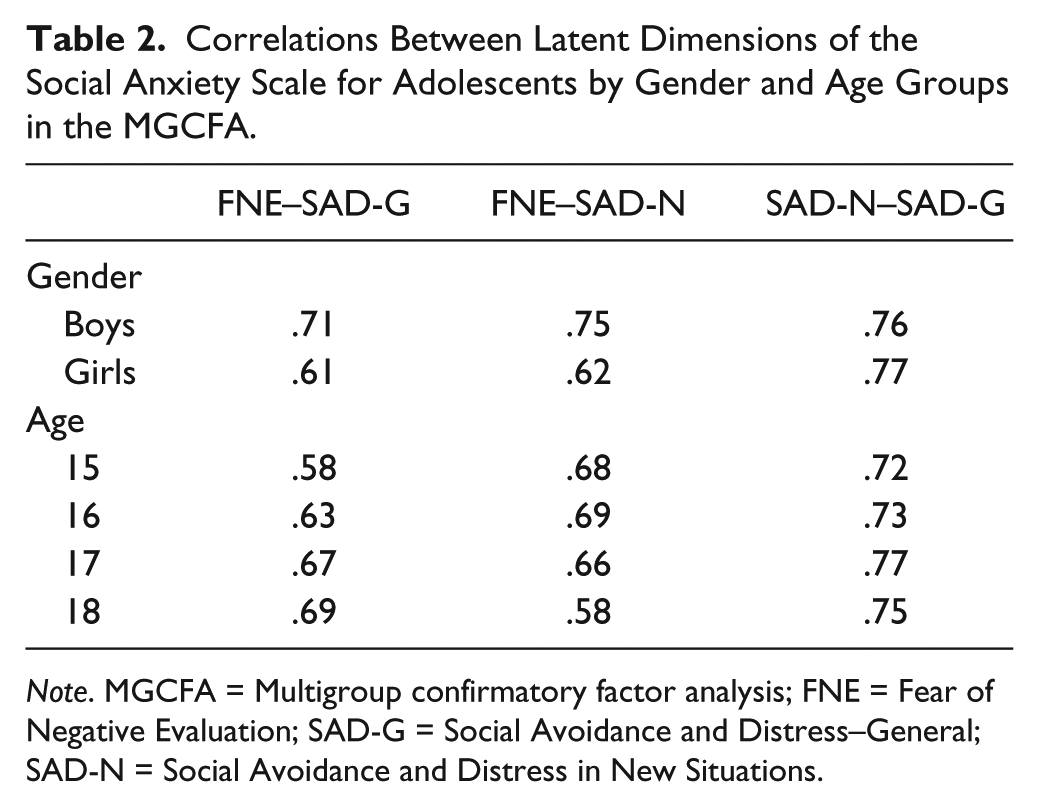
Note. MGCFA = Multigroup confirmatory factor analysis; FNE = Fear of Negative Evaluation; SAD-G = Social Avoidance and Distress–General; SAD-N = Social Avoidance and Distress in New Situations.
Goodness-of-Fit Indices in the MGCFA of the Social Anxiety Scale for Adolescents by Gender and Age Groups.
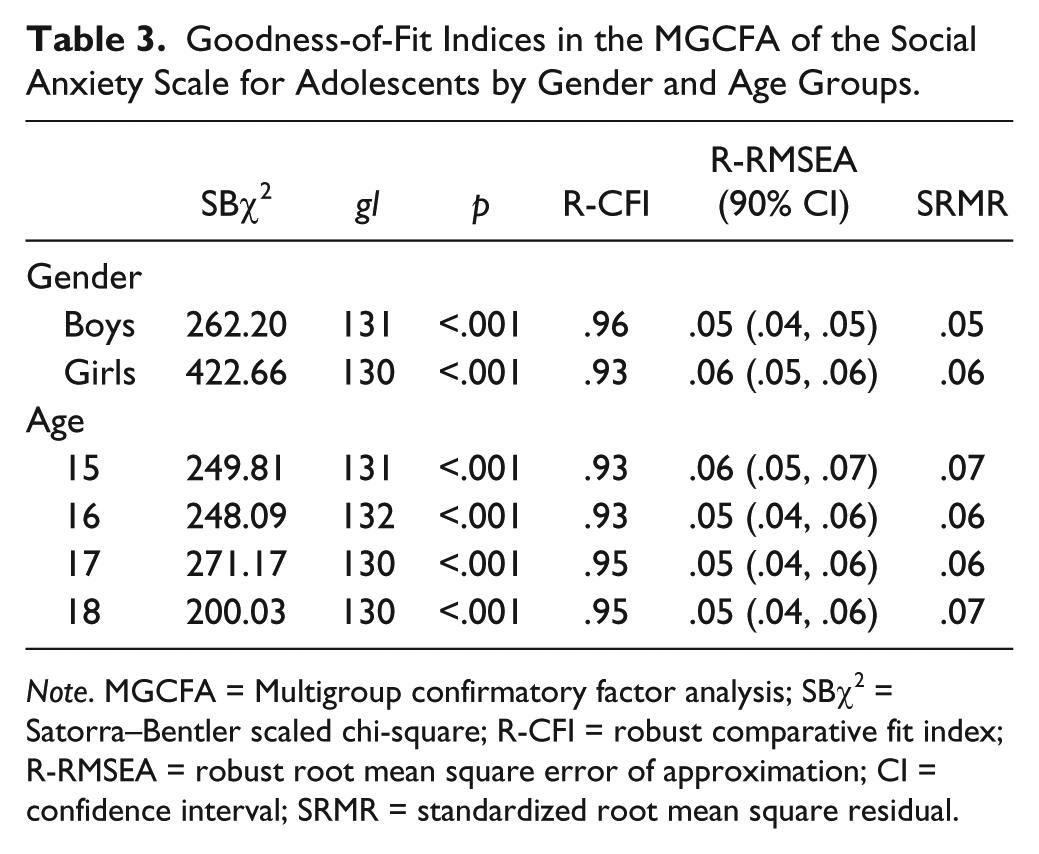
Note. MGCFA = Multigroup confirmatory factor analysis; SBχ2 = Satorra–Bentler scaled chi-square; R-CFI = robust comparative fit index; R-RMSEA = robust root mean square error of approximation; CI = confidence interval; SRMR = standardized root mean square residual.
Testing for Measurement and Structural Invariance of the SAS-A Across Gender
First, using MGCFA with robust ML estimation, we tested for factorial invariance across gender to determine if the factor structure of the SAS-A was the same for boys and girls. We tested a baseline model (M0), with no equality constraints across gender; this model had adequate fit to data (R-CFI > .90, R-RMSEA < .06, SRMR < .08; see Table 4).
Invariance Constraints for the Social Anxiety Scale for Adolescents Across Gender and Age Groups.
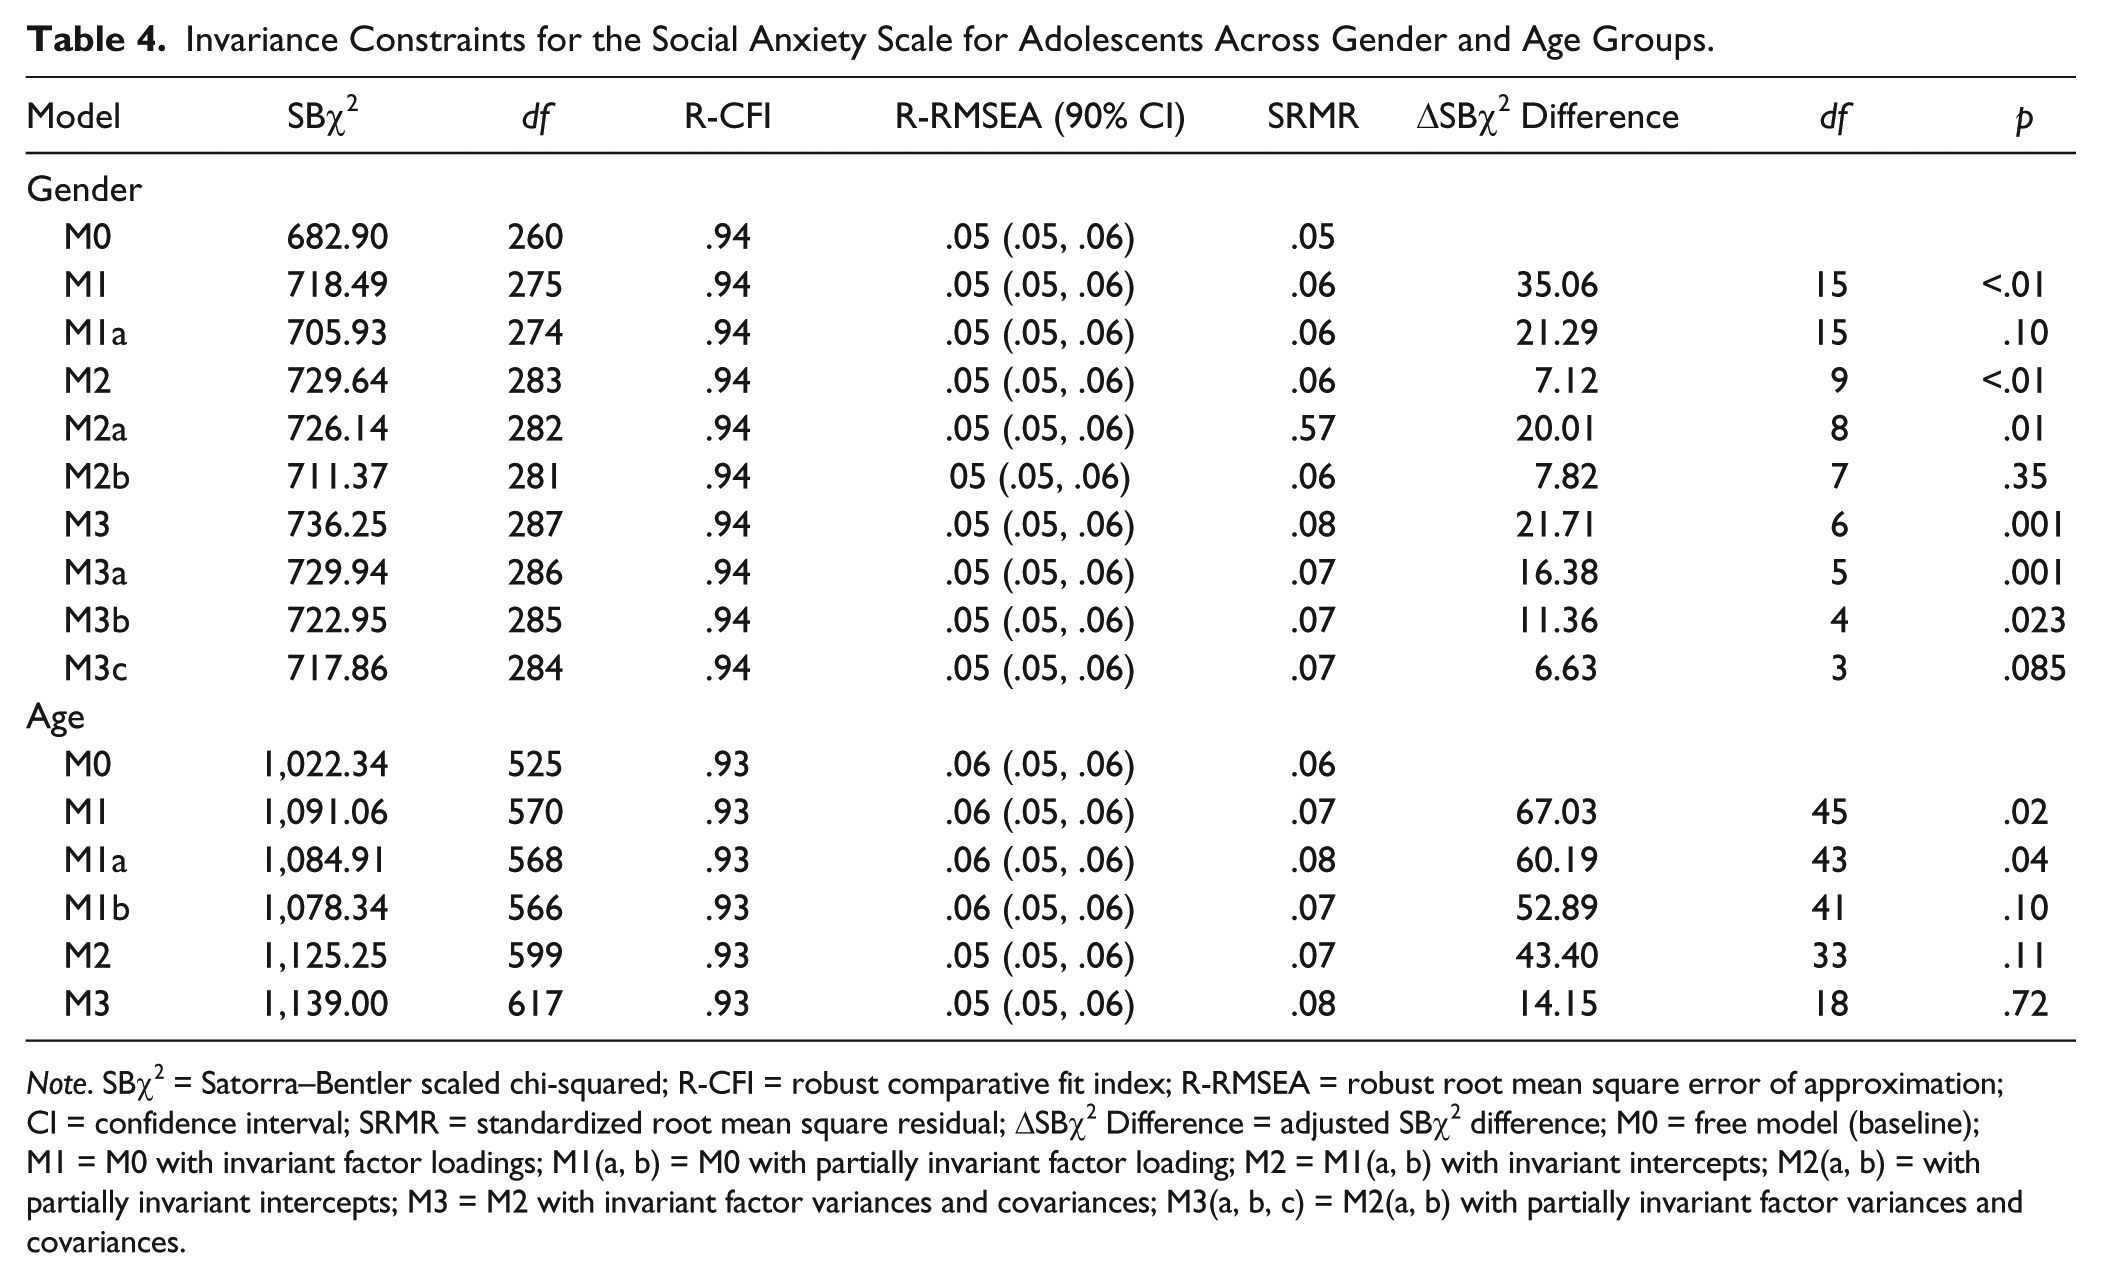
Note. SBχ2 = Satorra–Bentler scaled chi-squared; R-CFI = robust comparative fit index; R-RMSEA = robust root mean square error of approximation; CI = confidence interval; SRMR = standardized root mean square residual; ΔSBχ2 Difference = adjusted SBχ2 difference; M0 = free model (baseline); M1 = M0 with invariant factor loadings; M1(a, b) = M0 with partially invariant factor loading; M2 = M1(a, b) with invariant intercepts; M2(a, b) = with partially invariant intercepts; M3 = M2 with invariant factor variances and covariances; M3(a, b, c) = M2(a, b) with partially invariant factor variances and covariances.
Next, all free factor loadings were constrained to be equal across gender groups (M1). The fit of this model was also reasonable. Chi-square differences were adjusted with Satorra and Bentler’s (2001) correction, referred to as the Satorra–Bentler scaled chi-square (ΔSBχ2) difference test. The ΔSBχ2 difference test between the constrained model (M1) and the unconstrained baseline model (M0) indicated that the factor loadings were not equivalent across gender (p < .01), so there is no complete invariance of factor loadings across boys and girls. In this case, the recommended procedure is to free parameters one at a time (Dimitrov, 2010). Thus, M1 was modified by freeing the factor loadings for SAS-A Item 20 (“I feel nervous when I’m around certain people”), allowing the factor loadings for this item to have different estimates across the two groups. The resulting modified model is labeled Model 1a (see Table 4). There was a nonsignificant difference (p = .10) between the model with partial factor loadings constrained (M1a) and the unconstrained baseline model (M0). Therefore, this model is partially equivalent (i.e., partial metric invariance).
The next step was to fix equality of intercepts (M2). The ΔSBχ2 difference test between Models M2 and M1a indicated that item intercepts were not equivalent across gender (p = .01). Thus, the equality of the intercept for SAS-A Item 17 (“I feel that other make fun of me”) was freed (M2a; see Table 4). However, the difference between M1a and M2a also was statistically significant (p = .01). Thus, based on the LM test, the equality of the intercept for SAS-A Item 14 (“I worry that the other person will not like me”) also was freed, creating model M2b. The ΔSBχ2 difference test comparing Models M2b and M1a was not significant (see Table 4). Therefore, this model is partially equivalent (i.e., partial scalar invariance).
An acceptable degree of partial invariance is less than 20% freed parameters (Dimitrov, 2010). As only three parameters were freed here, this condition was satisfied. Thus, we can conclude that there is acceptable partial measurement invariance, with invariance of all but one factor loading, and invariance of all but two intercepts.
Finally, factor variances and covariances were constrained to be equal across gender groups (M3). The ΔSBχ2 difference test showed significant differences (p < .001). Following the LM test, the equality of variance of factor FNE was freed (M3a). Again, the ΔSBχ2 comparing M2b and M3a showed statistical differences (p = .001). Following the LM test, the next equivalence for being deleted was the variance of factor SAD-General, creating the M3b. Comparing M2b and M3b, the ΔSBχ2 difference test showed significant differences (p = .02). Then, indications of the LM test suggest that we eliminate the equivalence of covariance FNE–SAD-General, creating Model M3c. This model was statistically equivalent to M2b (p = .09). Therefore, this model is also partially equivalent (i.e., partial structural invariance). As only three parameters were freed in this case, the results suggest acceptable partial measurement invariance (i.e., metric and scalar invariance) and acceptable partial structural invariance across gender groups.
Testing for Measurement and Structural Invariance of the SAS-A Across Age Groups
Similarly, first we examined a baseline model (M0) with no equality constraints across age groups, which had a good fit to the data (see Table 5). Next, all free factor loadings were constrained to be equal across age groups (M1). The ΔSBχ2 difference test comparing M0 and M1 was significant. Following the LM test, factor-loading equivalence for the groups of 15- and 18-year-olds for SAS-A Item 9 (“I’m afraid that others will not like me”) was eliminated (M1a). Again, the adjusted chi-square test between M0 and M1a revealed significant differences. Thus, factor-loading equivalence for the groups of 15- and 18-year-olds for SAS-A Item 22 (“It’s hard for me to ask others to do things with me”) was eliminated. The ΔSBχ2 test with this new model (M1b) had significant equivalence with model M0 (p = .10). Therefore, this model is partially equivalent (i.e., partial metric invariance).
Structured Mean Differences Across Gender and Age Groups on Social Anxiety Scale for Adolescents Scores.
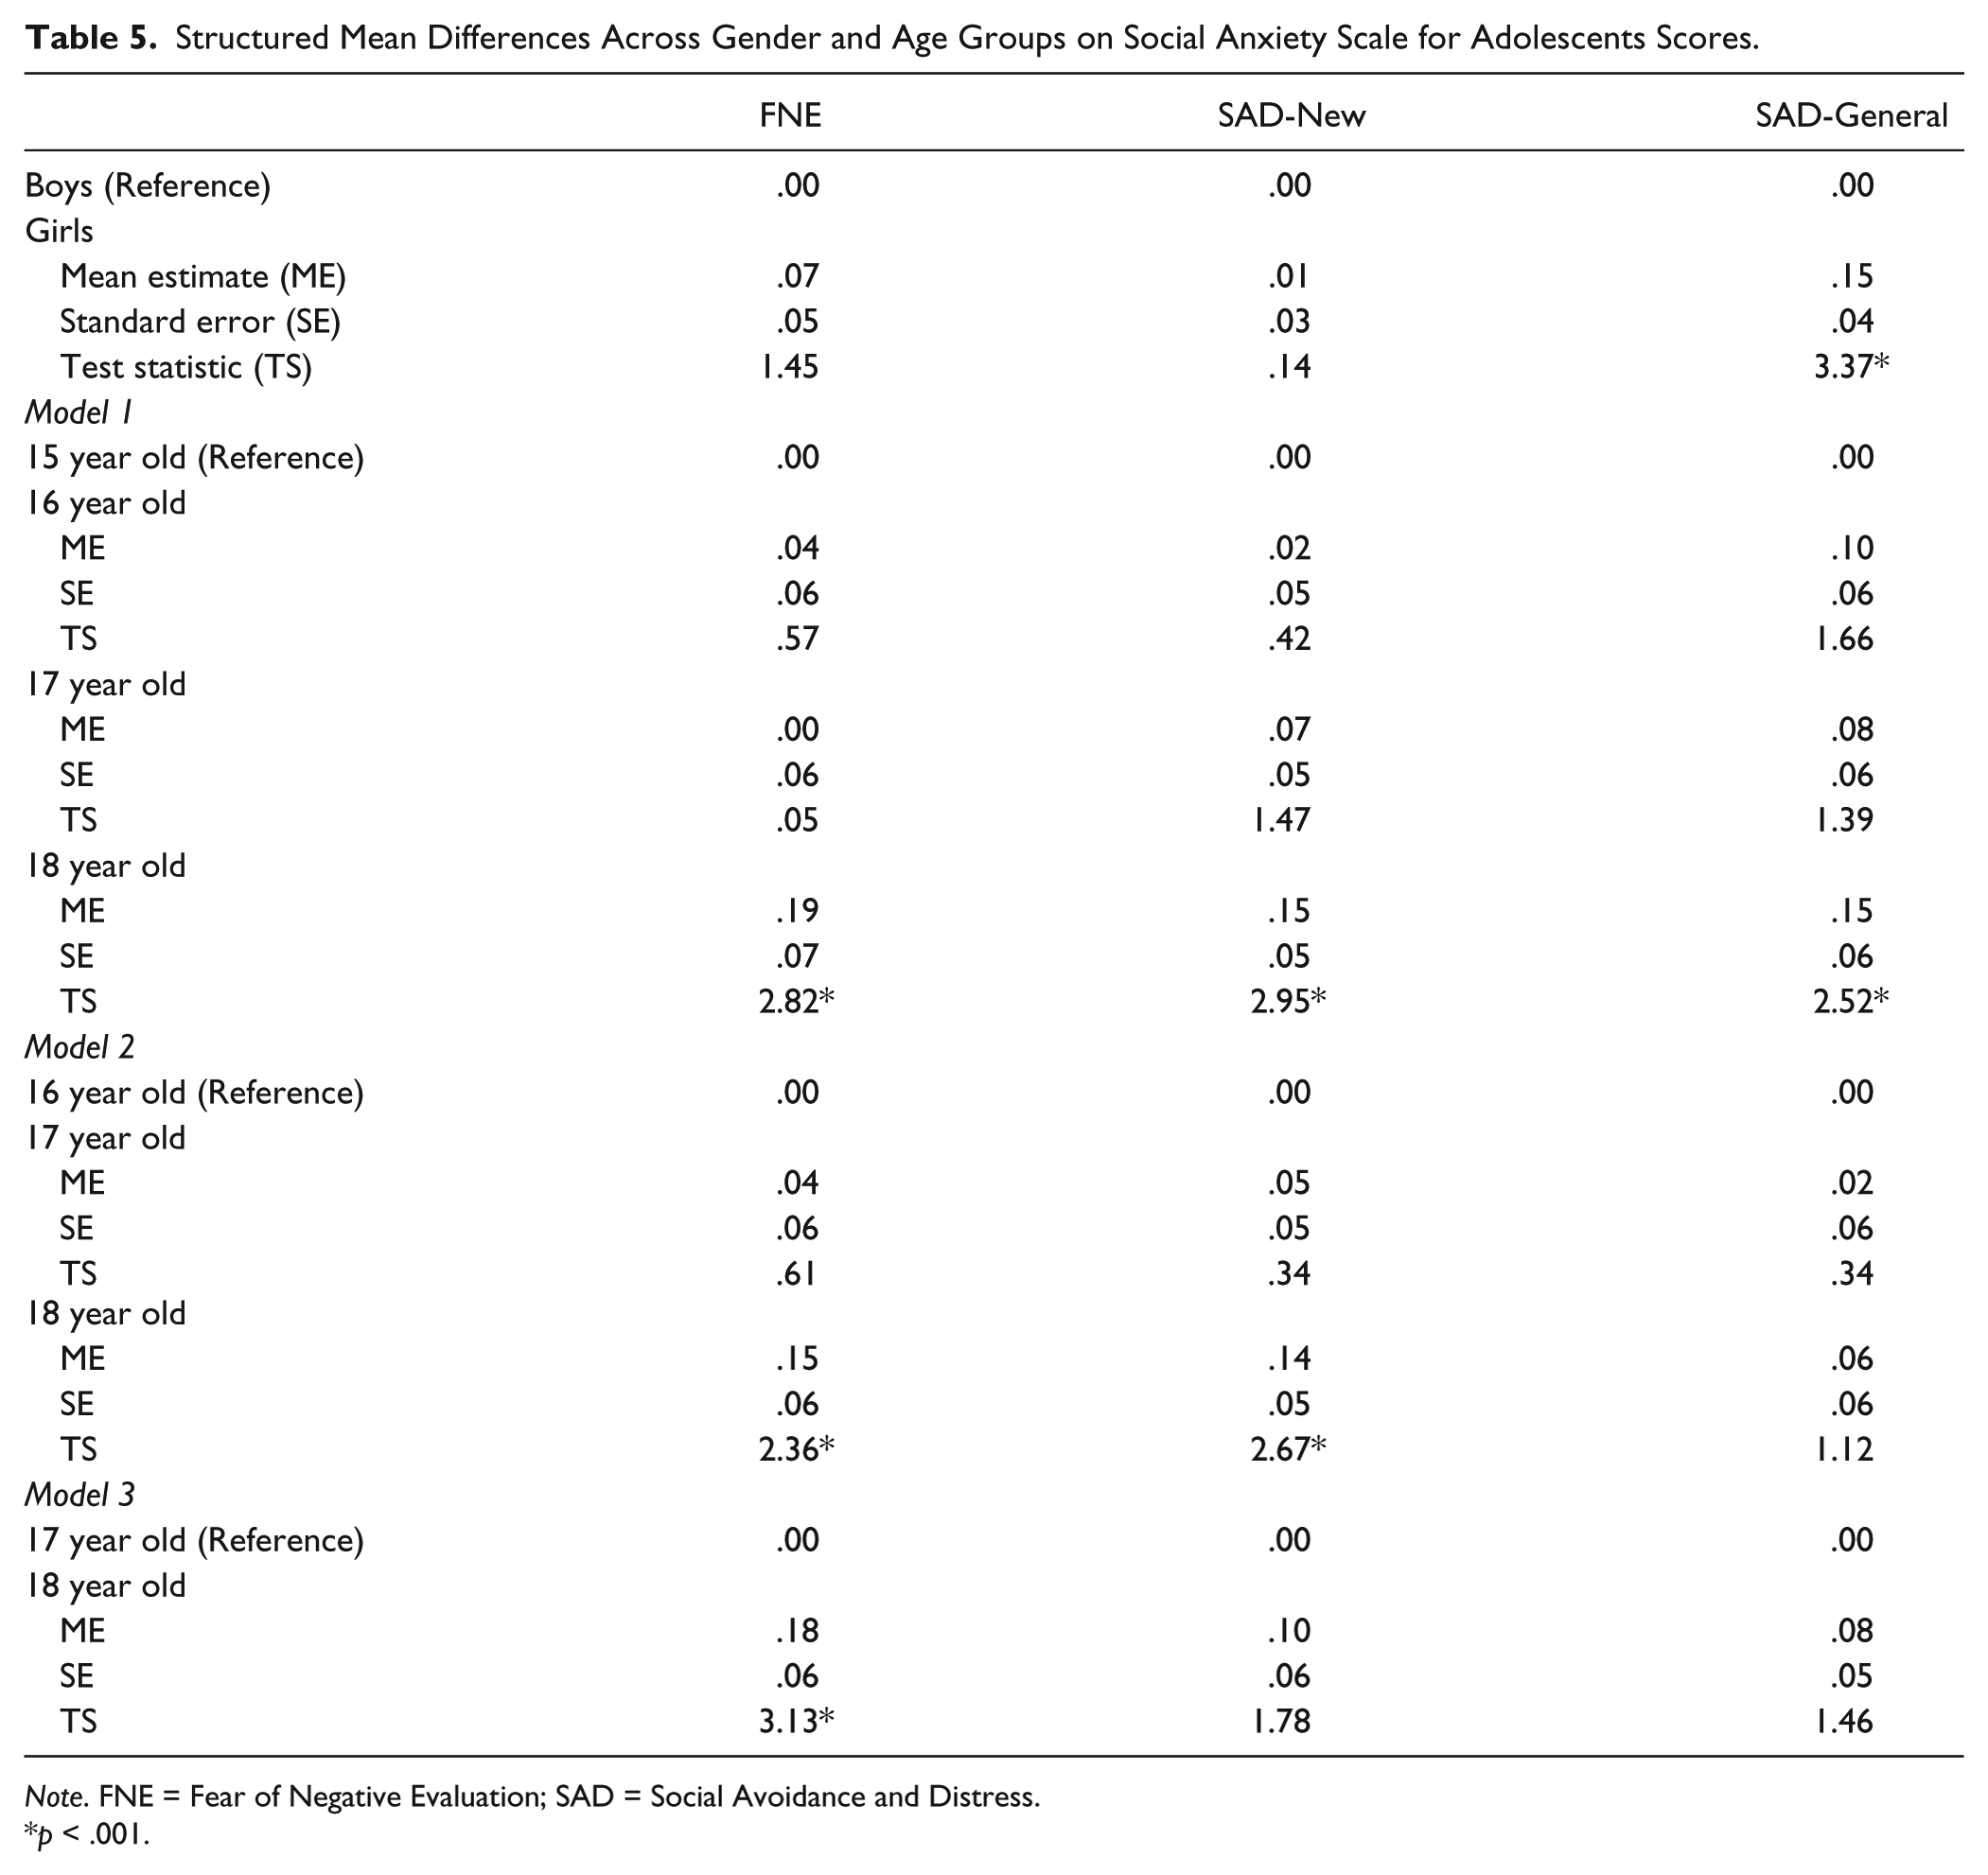
Note. FNE = Fear of Negative Evaluation; SAD = Social Avoidance and Distress.
p < .001.
Second, equality of intercepts was imposed (M2). The ΔSBχ2 difference test between M1b and M2 indicated significant equivalence (i.e., scalar invariance). As only two parameters were freed, we can conclude that there is acceptable partial measurement invariance, with invariance of all but two factor loadings, and invariance of all intercepts.
The final step was to fix the factor variances and covariances to be equal (M3). The results indicated statistical equivalence between Models M2 and M3 (p = .72). Taken together, these results suggest that there is acceptable partial measurement invariance (i.e., metric and scalar invariance) and structural invariance for age groups.
The presence of measurement invariance is critical for practical comparisons of groups on latent variables/constructs (Dimitrov, 2010). Thus, we were able to proceed to our next study aim of comparing LM differences across gender and age groups.
Structured Latent Mean (LM) Differences Across Gender and Age Groups on the SAS-A
Observed means for the FNE, SAD-New, and SAD-General subscales by gender and age groups were as follows: 16.46, 15.11, 7.45 (boys); 16.98, 15.07, 6.73 (girls); 17.16, 15.48, 7.41 (15 year olds); 16.86, 15.34, 6.90 (16 year olds); 17.21, 15.01, 7.09 (17 year olds); and 15.36, 14.37, 6.62 (18-year olds).
However, LMs are better indicators of true differences than observed means because they are not associated with measurement error (Hancock, 1997). In order to be certain that the LMs of the SAS-A were equal across gender and age groups, restrictions need to be imposed on the observed variable means. Specifically, testing for the LM differences on the SAS-A was conducted with EQS, which imposes equality constraints on item intercepts and fixes the factor intercepts for one of the samples to zero. As a result, the estimated LM for the other groups represents the mean difference in the construct between groups.
The model for comparing gender groups used boys as the reference group (see Table 5). The fit statistics of the LM structures were satisfactory: SBχ2 = 907.70, df = 284, p < .001, R-CFI = .939, R-RMSEA = .06 (CI = .06, .07), and SRMR = .05. Boys had significantly higher structured means than girls on SAD-General.
Because there are four age groups, three models were established in order to make all possible comparisons; in each model we set the lowest age group to zero (see Table 5). Fit statistics were acceptable in each model: Model 1: SBχ2 = 1430.78, df = 602, p < .00, R-CFI = .919, R-RMSEA = .07 (CI = .06, .07), and SRMR = .07; Model 2: SBχ2 = 1028.33, df = 446, p < .00, R-CFI = .93, R-RMSEA = .07 (CI = .06, .07), and SRMR = .07; and Model 3: SBχ2 = 786.86, df = 289, p < .001, R-CFI = .91, R-RMSEA = .08 (CI = .07, .08), and SRMR = .07. The 18 year olds had significantly lower means on (a) FNE, SAD-New, and SAD-General than the 15 year olds, (b) FNE and SAD-New than the 16 year olds, and (c) FNE than the 17 year olds.
Discussion
Social anxiety disorder is a common mental health disorder among adolescents that impairs social functioning and contributes to the development of other psychological disorders (Merikangas, Avenevoli, Costello, Koretz, & Kessler, 2009). Thus, identifying culturally appropriate measures of social anxiety for Hispanic American adolescents represents an important area. This study is the first to assess the equivalency of social anxiety symptoms, as measured by the SAS-A, across gender and age groups for Hispanic American youth. Findings support the construct validity of the SAS-A with this population.
Construct Validity of the SAS-A With Hispanic American Adolescents
Supporting our first study aim, analyses of internal consistency showed that the total and subscale scores of the SAS-A have acceptable internal consistency reliability estimates (>.70) across gender and adolescent age groups. In all groups, SAD-General had the lowest internal consistency (alphas = .70 to .76) and the FNE the highest (alphas = .88 to .99), comparable to internal consistencies reported in the original SAS-A (La Greca & Lopez, 1998).
In addition, across gender and age groups, the data fit the three-factor correlated model of social anxiety, thus providing evidence for form or configural invariance of the SAS-A. Our findings also demonstrated acceptable partial measurement invariance and acceptable partial structural invariance of the SAS-A across gender groups and across age groups. In practical terms, this means that Hispanic American adolescents from 15 to 18 years of age, both boys and girls, ascribe the same meanings to the SAS-A subscales. Therefore, it is possible to use the SAS-A to test specific hypotheses about gender and age differences in social anxiety among Hispanic American adolescents.
Gender and Age Differences in Social Anxiety Symptoms on the SAS-A
Our second study aim examined gender and age differences in social anxiety for Hispanic American youth. Interestingly, boys exhibited higher structured means than girls on the SAD-General subscale. Prior studies have not found gender differences on this SAS-A subscale, but some have found that girls report more FNE and SAD-New than boys (e.g., Cunha et al., 2004; Inderbitzen-Nolan & Walters, 2000; La Greca & Lopez, 1998).
Our findings suggest that boys of Hispanic American ethnicity may feel more socially uncomfortable or distressed around other peers than girls do, although it is not clear why. It is possible that this gender difference reflects an underlying peer relationship concern for Hispanic American boys. For example, overt peer victimization (i.e., being hit, chased, or threatened) has been associated with social anxiety among boys (Storch, Nock, Masia-Warner, & Barlas, 2003); if Hispanic American adolescent boys experience more overt peer victimization, this might contribute to their symptoms of generalized social avoidance and distress. Boys are also less likely than girls to report peer victimization experiences to others (La Greca, Chan, Landoll, & Siegel, 2012), and if this is particularly the case for Hispanic American boys, it also might contribute to their feeling more anxious or uncomfortable around peers. Further investigation of this gender issue will be important and desirable.
In addition, our analyses of age differences revealed that on all the SAS-A subscales, the structured means significantly diminished from the 15 year olds to 18 year olds. In general, the 18 year olds had lower scores on the SAS-A subscales than each of the other age groups. This finding may reflect the broader social context of adolescents’ lives. The younger adolescents in our sample (who differed most from the 18 year olds) had recently made a major transition from middle school to high school, which affects adolescents’ social networks and peer relationships (Furman, McDunn, & Young, 2009). Adolescents’ key concerns during the transition to high school include dealing with social issues, such as how to fit in and make new friends and how to cope with bullies or older students (Akos & Galassi, 2004). Apparently, the transition to high school is particularly challenging for ethnic/racial minority students; in fact, rates of attrition for Latino/Hispanic youth are two to three times higher than for other youth (Wheelock & Miao, 2005). Thus, this transition period may heighten social anxiety in Hispanic American adolescents.
An important conclusion from our study is that the LM differences across gender and age groups can be attributed to differences in the actual responses of Hispanic American adolescents, not to differences in the way that SAS-A works with this population. These findings pave the way for future studies of social anxiety among Hispanic American youth using the SAS-A.
Study Limitations and Implications for Future Research and Practice
Although this study provided valuable information about the utility of the SAS-A for Hispanic American adolescents, several issues warrant attention. First, the study focused on community samples; extension of these findings to clinical samples of Hispanic American youth and to other ethnic/cultural groups will be important. Second, further evaluation of social anxiety among Hispanic American youth is needed to understand the potential mechanisms underlying observed gender- or age-related differences in social anxiety. For example, age-related differences may be because of greater social stresses occurring early in the high school years and/or to older adolescents’ increased familiarity with peers once they have been in the same school setting for a while. Third, this study used a cross-sectional design; extension of these findings using longitudinal designs will be important in future research. It could be interesting, for example, to examine the longitudinal factorial invariance of SAS-A scores among Hispanic American adolescents to further test hypotheses about the change and growth in adolescents’ social anxiety across developmental stages and/or education levels. Fourth, in terms of practical implications, demonstrating factorial invariance across gender and age groups for Hispanic American youth is of substantial importance because gender and age are key moderators of treatment outcome for anxiety disorders (e.g., Beidel et al., 2007; Silverman, Pina, & Viswesvaran, 2008). Our findings suggest that researchers focusing on social anxiety in Hispanic American adolescents might have confidence using the SAS-A to evaluate treatment outcome for social anxiety interventions or to examine developmental trajectories of adolescents’ social anxiety over time.
Finally, our findings have implications for practitioners. Measurement equivalence suggests that gender differences on the SAS-A for Hispanic American youth are primarily differences of degree rather than of kind. Thus, the content of clinical interventions for adolescent social anxiety (e.g., Masia-Warner et al., 2005), which have been developed and tested with mostly European American samples, also may be relevant for Hispanic American youth.
Footnotes
Acknowledgements
A special thanks to Dimiter Dimitrov, Professor of Educational Measurement and Statistics at George Mason University, for his helpful comments on the article. We also thank Ryan Landoll and Sherilynn Chan, University of Miami, for their assistance in organizing the data set.
Declaration of Conflicting Interests
The authors declared no potential conflicts of interest with respect to the research, authorship, and/or publication of this article.
Funding
The authors received no financial support for the research, authorship, and/or publication of this article.