
Abstract
The current research evaluated a bifactor model for the Disgust Emotion Scale (DES) in three samples: N = 1,318 nonclinical participants, N = 152 clinic-referred patients, and N = 352 nonclinical participants. The primary goals were to (a) use bifactor modeling to examine the latent structure of the DES and in turn (b) evaluate whether the DES should be scored as a unidimensional scale or whether subscales should also be interpreted. Results suggested that a bifactor model fit the DES data well and that all DES items were strongly influenced by a general disgust proneness dimension and by five content dimensions. Moreover, model-based reliability analyses suggested that scoring a general disgust dimension is justified despite the confirmed multidimensional structure. However, subscales were found to be unreliable after controlling for the general disgust factor with the potential exception of the Mutilation/Death and Animals subscale. Subsequent analysis also showed that only the general disgust factor robustly predicted an obsessive-compulsive disorder symptom latent factor—a clinical condition closely related to disgust proneness; latent variables representing DES domains displayed weak relations with an obsessive-compulsive disorder factor above and beyond the general disgust factor. Implications for better understanding the structure of DES responses and its use in clinical research are discussed.
There has been growing interest in disgust proneness—a dimensional personality trait that is characterized by the tendency to experience disgust frequently and intensely (van Overveld, de Jong, Peters, Cavanagh, & Davey, 2006). Consistent with other personality traits, research has shown that disgust proneness is relatively stable over time (De Jong, Andrea, & Muris, 1997) and is present to a greater or lesser extent in all individuals (Olatunji & Broman-Fulks, 2007). Research has suggested that disgust proneness may confer risk for the development of some anxiety disorders, especially obsessive-compulsive disorder (OCD; Olatunji, Cisler, McKay, & Phillips, 2010). However, it remains unclear how individual differences in disgust proneness develop (see Stevenson, Oaten, Case, Repacholi, & Wagland, 2010) and how these individual differences relate to OCD more generally. Disgust is generally understood to have evolved to protect humans from risk of disease (Curtis, Aunger, & Rabie, 2004), and this “disease avoidance” function has been the basis for hypothesized associations between disgust proneness and some symptoms of OCD. However, a better understanding of the role of disgust proneness in OCD requires psychometrically sound measures. In what follows, we briefly review several existing measures and call attention to limitations. We then focus our examination of the latent structure disgust on one scale, the Disgust Emotion Scale (DES; Walls & Kleinknect, 1996) that was developed to measure disgust and its potential components.
Measures of Disgust Proneness
The first measure of disgust proneness to appear in the literature was the Disgust and Contamination Sensitivity Questionnaire (DQ; Rozin, Fallon, & Mandell, 1984). The DQ was initially developed to assess concerns about food contamination. However, this conceptually narrow approach that focuses exclusively on contaminated foods is limited given that stimuli that elicit disgust span a rather broad and diverse range (Olatunji & Sawchuk, 2005; Rozin, Haidt, & McCauley, 2000).
To better assess the diverse manifestations of disgust, Haidt, McCauley, and Rozin (1994) developed the Disgust Scale (DS). The DS assesses disgust proneness across eight content domains: (a) food that has spoiled, is culturally unacceptable, or has been fouled in some way; (b) animals that are slimy or live in dirty conditions; (c) body products including body odors and feces, mucus, and so on; (d) body envelope violations, or mutilation of the body; (e) death and dead bodies; (f) sex involving culturally deviant sexual behavior; (g) hygiene, or violations of culturally expected hygiene practices; and (h) sympathetic magic, which involves stimuli without infectious qualities that either resemble contaminants (e.g., feces-shaped candy) or were once in contact with contaminants (e.g., a sweater worn by an ill person). Although the DS is currently regarded as the measure of choice for assessing disgust proneness (Olatunji & Sawchuk, 2005), it is not without limitations. Prior research, for example, has reported adequate internal consistency for the DS total score but poor internally consistency (α < .65) for each of the eight subscales (Björklund & Hursti, 2004; Schienle, Stark, Walter, & Vaitl, 2003; Tolin, Woods, & Abramowitz, 2006).
Theoretical accounts suggest that disgust proneness has diverse manifestations (Rozin et al., 2000); however, psychometric research has shown that the DS is limited in yielding reliable distinct component factors. To address this limitation, Olatunji et al. (2007) conducted a converging set of analyses evaluating the item properties of the DS with the goal of refining its factor structure. Based on the results of this study, the Disgust Scale–Revised (DS-R) was created by eliminating items with poor psychometric properties. The DS-R consists of three distinct factors: (a) core disgust, which is characterized primarily as a food rejection response centered on oral incorporation of offensive stimuli (e.g., eating monkey meat); (b) animal reminder disgust, which consists of stimuli or behaviors that serve as reminders of the animal origins of humans (e.g., touching a dead body); and (c) contamination disgust, which is marked by concerns of contagion through direct or indirect contact with others (i.e., accidentally drinking from someone else’s cup). Although factor analytic research has replicated this three-factor structure of the DS-R in several countries (Olatunji et al., 2009), recent research suggest that the internal consistency of the contamination disgust component (alpha estimates range from .37 to .61) may be low (Olatunji, Haidt, McKay, & David, 2008; van Overveld, de Jong, Peters, & Schouten, 2011).
The DES was developed to more precisely measure disgust proneness and its potential components. The DES consists of 30 items hypothesized to assess disgust proneness across five content domains with six items per domain: (a) food that is rotten, (b) animals that are small, (c) injections and blood draws, (d) mutilation of the body and death, and (e) smells that are offensive. Despite its appeal as a potentially more precise measure of components of disgust proneness, only two studies have examined the factor structure of the DES. In the first, Olatunji, Sawchuk, de Jong, and Lohr (2007) replicated the proposed five-factor structure with exploratory and confirmatory factor analysis (CFA). In a second investigation, Muris et al. (2012) employed principal components analysis on DES items and found support for the same five factors in a sample of children. Unlike the DS and the DS-R, the five components of the DES have been shown to display good internal consistency. For example, Kleinknecht, Kleinknecht, and Thorndike (1997) found alpha coefficients for the five DES subscales ranging from .80 to .90. To the extent that the construct of disgust proneness consists of distinct components, the DES may be a more precise measure for delineating the nature and function of such components. However, no study has examined the degree to which these components yield reliable scores that are distinct from the general dimension. More in-depth analyses that specifically assess the reliability of the DES subdomains relative to the general domain are thus needed in order to make this determination.
The DES appears to be a psychometrically sound measure of disgust proneness with five reliable subscales based on the previous studies. However, these five subscales have been found to be moderately to highly intercorrelated, with correlations ranging from .22 to .81 among children (Muris et al., 2012) and from .17 to .46 among adults (Olatunji et al., 2007). The question thus remains as to how researchers should analyze a clinical instrument that measures disgust proneness in general, while at the same time measures five distinct, yet related manifestations of disgust proneness.
Dimensionality of the DES
The question of whether to provide total and/or subscale scores when using the DES not only is a psychometric one but also has important clinical implications. For example, existing studies have typically correlated measures of OCD with full-scale disgust questionnaire scores with the assumption that the data are unidimensional (Mancini, Gragnani, & D’Olimpio, 2001; Sawchuk, Lohr, Tolin, Lee, & Kleinknecht, 2000). It is unclear whether the range of disgust domains that are associated with OCD represents a narrow and circumscribed set of elicitors (i.e., homogeneous) or a broad and diverse range of repugnant stimuli (i.e., heterogeneous). Data from Woody and Tolin (2002) suggest that certain categories of disgust proneness may be more salient to OCD than others. Subsequent research has also shown that disgust proneness toward stimuli that have an underlying commonality of threat of contagion may best predict symptoms of OCD (Olatunji, Williams, et al., 2007; Olatunji, Sawchuk, Lohr, & de Jong, 2004; Tolin et al., 2006). Research employing the DES also found that a latent disgust proneness factor that consisted of the animals, smells, and rotting foods (core disgust elicitors) items uniquely predicted OCD symptoms, whereas a latent disgust proneness factor consisting of the injection/blood draws and mutilation (animal reminder disgust elicitor) items did not (Olatunji, Williams, Lohr, & Sawchuk, 2005).
The previous studies highlight the need to more clearly understand the dimensionality of the DES scores. A commonly used solution to not knowing whether to emphasize interpretation of the total score or subscales has been to report both score types. However, Reise, Moore, and Haviland (2010) contend that this practice can be problematic for several reasons. First, variance in subscale scores can reflect two sources of variance—the general and specific domains. Second, subscales are correlated with each other, causing multicollinearity problems. For example, in a multidimensional (subscale) model, multicollinearity can interfere with the ability to judge the unique contribution of each subscale. Last, because in clinical measures subscales often reflect variation on both a general construct (disgust proneness) and more specific constructs (e.g., disgust proneness toward food that is rotten), subscale scores may appear reliable, due not to the unique reliable construct variance but rather to the general variance that is also measured by the subscale.
Overview of the Current Studies
In this investigation, we will apply exploratory and confirmatory bifactor analysis of DES responses in three samples. The primary goals were to (a) use bifactor modeling to better understand the latent structure of disgust proneness as measured by the DES and in turn (b) evaluate whether the DES should be scored as a unidimensional scale or whether subscales should be additionally scored and interpreted. The bifactor model was originally introduced to the field over seven decades ago (Holzinger, & Swineford, 1937) and has recently been found to provide a new compelling way to represent psychological constructs and judge the viability of computing subscale scores (e.g., see Reise, Bonifay, & Haviland, 2013; Reise et al., 2010; Reise, Morizot, & Hays, 2007). A bifactor model may offer some advantages in analyzing the DES given the heterogeneity of the DES item content (Reise et al., 2007, Reise et al., 2010). The bifactor model can be used to evaluate the extent to which scores on the DES reflect a single variable even when the data are multidimensional. Importantly, a bifactor model can complement traditional dimensionality investigation by evaluating whether item response variance is because of a general disgust proneness construct versus distinct disgust proneness factors. To our knowledge, no study to date has applied the bifactor model to the DES.
In Study 1, we thus employed exploratory and confirmatory bifactor analysis (in a large nonclinical sample) to determine how well the DES data conform to a bifactor structure. The bifactor model that we examined included a general factor related to disgust proneness (presumed to underlie all the DES items), along with five “group” factors that correspond to each of the five subscales found in previous factor analytic studies on the DES (Olatunji, Sawchuk, et al., 2007). In Study 2, we used applied confirmatory bifactor modeling using DES data derived from one independent clinical and one nonclinical sample to replicate and extend the generalizability of the Study 1 findings. In addition, we also administered a multi-item OCD symptom measure in Study 2. Structural equation modeling (SEM) was then used to examine differences in the association between a latent OCD variable and a general latent disgust variable relative to five latent variables corresponding to the five DES subscale domains. An OCD latent factor was formed and then SEM was used to test whether the DES subscales provided any additional predictive power over and above the general disgust factor in a clinical sample and a nonclinical sample.
Study 1
Participants
Study 1 included 1,318 of 1,371 participants (96.1%) who completed the DES at a large southern university with no missing data. This nonclinical sample included 884 (67.4%) females and 428 (32.5%) males. Six participants (0.5%) did not report their gender. Ages ranged from 17 to 52 years (M = 20.69, SD = 4.82).
Procedure
Questionnaire packets including the DES were distributed to student volunteers in a classroom setting and were completed in exchange for research credit.
Measure
The DES (Walls & Kleinknect, 1996) is a 30-item scale measuring disgust sensitivity across five domains of disgust elicitors: Animals, Injections and Blood Draws, Mutilation and Death, Rotting Foods, and Smells. As shown in the appendix, participants are asked to rate their degree of disgust or repugnance if they were to be exposed to each item using a 5-point Likert-type scale, ranging from 0 = no disgust or repugnance at all to 4 = extreme disgust or repugnance.
Data Analytic Approach
Because of the DES Likert-type scale producing ordinal (categorical) responses, we based all analyses on polychoric correlation matrices (Olsson, 1979). We divided our Study 1 sample in half randomly to create an exploratory factor analysis (EFA) subsample and CFA subsample for the subsequent EFA and CFA.
Exploratory Bifactor Model
There are both exploratory and confirmatory approaches to bifactor modeling (Reise, 2012). The Schmid–Leiman approach (SL; Schmid & Leiman, 1957) and the Jennrich–Bentler approach (JB; Jennrich & Bentler, 2011) are two alternative methods that may be used for exploratory bifactor analysis (Reise, 2012). Both have their strengths and weaknesses. Specifically, the JB method performs a direct rotation to a bifactor criterion and thus is a true analytic rotation. On the other hand, the JB method has not been extensively researched and there are some indications that parameter estimates may be biased when the data are not perfectly consistent with a bifactor structure (e.g., when items have loadings on more than one group factor). The SL is an orthogonalization of a second-order factor model and is thus a “two-stage” rotation rather than a direct rotation. Moreover, parameter estimates in an SL may be biased because of the well-known “proportionality constraints” discussed in the literature (Yung, Thissen, & McLeod, 1999). The SL, however, is not expected to be as sensitive to a lack of perfect bifactor structure in the data. Given these factors, it is wise to perform both an SL and a JB and judge the consistency of results or lack thereof.
We thus employed SL bifactor EFA(Schmid & Leiman, 1957) on the DES data using a random EFA subsample (n = 659). We used the psych package (Revelle, 2013) in the R statistical program (R Development Core Team, 2013) to conduct the SL. The minimum residual (ordinary least squares) solution estimation method (Harman & Jones, 1966) and oblimin rotation were employed for the SL bifactor analysis. 1 On the same exploratory EFA subset, we employed the JB exploratory bifactor model recently made available in Mplus Version 7.11 (Muthén & Muthén, 2013). In both bifactor models, it was presumed that a general disgust proneness factor underlies all the DES items, while five “group” factors coexist and correspond to each of the five subscales found in previous factor analytic studies on the DES (Olatunji et al., 2007). Given that we a priori specified five factors to be extracted in addition to a general factor (based on disgust theory and the well-established findings that there are five subdomains associated with the DES), we also reported eigenvalues and fit statistics results to provide an empirical basis to support this decision to extract five factors.
Confirmatory Factor Analysis
We then conducted a CFA on our CFA subsample (n = 659) to examine the fit of the models examined in the EFA analyses outlined above. The root mean square error of approximation (RMSEA; Steiger, 1990) and comparative fit index (CFI; Bentler, 1990) were used to evaluate model fit:. CFI values greater than .90 (Bentler, 1990) and CFI values greater than .95 (Hu & Bentler, 1999) were used as benchmarks for adequate and good model fit, respectively. RMSEA values lower than .08 and lower than .05 were used as cutoffs for adequate and good fit, respectively (Browne & Cudeck, 1993).
Scale Score Reliability
We also calculated and reported various indices to evaluate the reliability of the five DES subscale scores in relation to the total score. First, we computed (a) coefficient alpha for the total scale score and for each of the five subscales considered alone. Despite the extremely wide use of the alpha statistics to evaluate reliability, alpha can yield misleading results, particularly when data are multidimensional (Cortina, 1993). This is because coefficient alpha reflects the reliability of all sources of systematic variance, including variance from the presence of any general factor, content group factors, and specific factors.
Omega indices
To obtain a better gauge of reliability, we thus computed (b) “model-based” statistics based on confirmatory bifactor model results. Here we will refer to these indices as omega indices. Omega provides a better estimate of reliability than coefficient alpha as omega only assumes that items are congeneric rather than tau equivalent (Graham, 2006). 2
Based on our confirmatory bifactor results, we computed (c) OmegaGeneral (the reliability of the total score based on all sources of reliable variance across all the items) and (d) OmegaSubscale (the reliability of a particular subscale based on all sources of reliable variance across the items from that subscale).
In addition to the omega statistic, we also computed the omega hierarchical (OmegaH) statistic (Zinbarg, Barlow, & Brown, 1997; Zinbarg, Revelle, Yovel, & Li, 2005), which is a statistic based on the bifactor model and recommended when evaluating the dimensionality of bifactor models (Revelle & Zinbarg, 2009). OmegaH controls for the general factor and provides an estimate of the proportion of variance in scores that is because of the general factor (e.g., general disgust). OmegaH is an important statistic because the difference between alpha and OmegaHierarchical represents the degree to which the alpha reliability estimate is inflated because of including variance attributed to group factors. We calculated (e) omegaHierarchical for the total score (OmegaHTotal), which, as noted above, is the amount of total score variance that can be associated with variation on a single latent common to all the items on a scale (e.g., general disgust). This index also allows one to examine the degree to which scores reflect a single latent variable. We also computed (f) OmegaH for each subscale (OmegaHSubscale), which provides an index of the degree to which the subscale scores provide reliable variance after accounting for the general factor. Last, we computed (g) explained common variance (ECV): This index represents the percentage of common variance attributable to the general factor in a bifactor model (see Reise, Scheines, Widaman, & Haviland, 2013). The ECV has recently been recommended as an index of “degree of unidimensionality” when dealing with potentially multidimensional data. The ECV index an additional advantage, in that it is relatively easy to interpret; when the ECV value is high, there is little common variance beyond that accounted for by the general factor. Indices in (c) to (g) were calculated based on factor loadings from the CFA models.
Results
Exploratory Bifactor Model
Based on the standard five-factor EFA results (available from the first author), the DES appears to have a five-factor structure corresponding to the following five disgust types: Animals, Rotting Foods, Injections/Blood Draws, Mutilation/Death, and Smells. Results of both the exploratory SL and JB bifactor analyses appear in Table 1 (with factor loadings less than .20 suppressed). Interestingly, the SL model provides support for a clear bifactor model underlying the DES items across five subdomains. Specifically, all 30 DES items loaded strongly on the general disgust factor (factor loadings >.35), ranging from .37 to .71. This five-factor structure also fit the data well (i.e., RMSEA = .048, CFI = .983, Tucker–Lewis index = .973, standardized root mean square residual = .024). Eigenvalue results also supported this five-factor bifactor structure. That is, the first five eigenvalues (only) were greater than 1.0 (supporting the presence of five factors), and the first eigenvalue was especially large (supporting the presence of a strong, general factor). The eigenvalues were as follows: 13.23, 3.49, 1.76, 1.39, 1.14, 0.77, 0.75, 0.60, 0.58, 0.53, 0.53, 0.51, 0.48, 0.42, 0.40, 0.37, 0.35, 0.33, 0.29, 0.28, 0.25, 0.25, 0.23, 0.22, 0.21, .018, 0.16, 0.14, 0.11, and 0.07. The factor loadings in each of the five content domains were lower than the factor loadings based on the standard EFA (due to being residualized against the common g factor); however, all factor loadings in each content domain (in the bifactor model) remained above .30 (range = .32-.87). The JB model did show that the Smells subdomain disappeared once accounting for the general disgust dimension. To determine which model would be most appropriate to retain for further examination in the present study (i.e., the five-factor bifactor model based on the SL analyses versus the four-factor bifactor model based on the JB analyses), we compared model fit of both models via CFAs in the following study.
Factor Loadings of the (DES) Based on Schmid–Leiman and Jennrich–Bentler Exploratory Bifactor Analysis Based on Study 1’s Nonclinical Sample (N = 659).
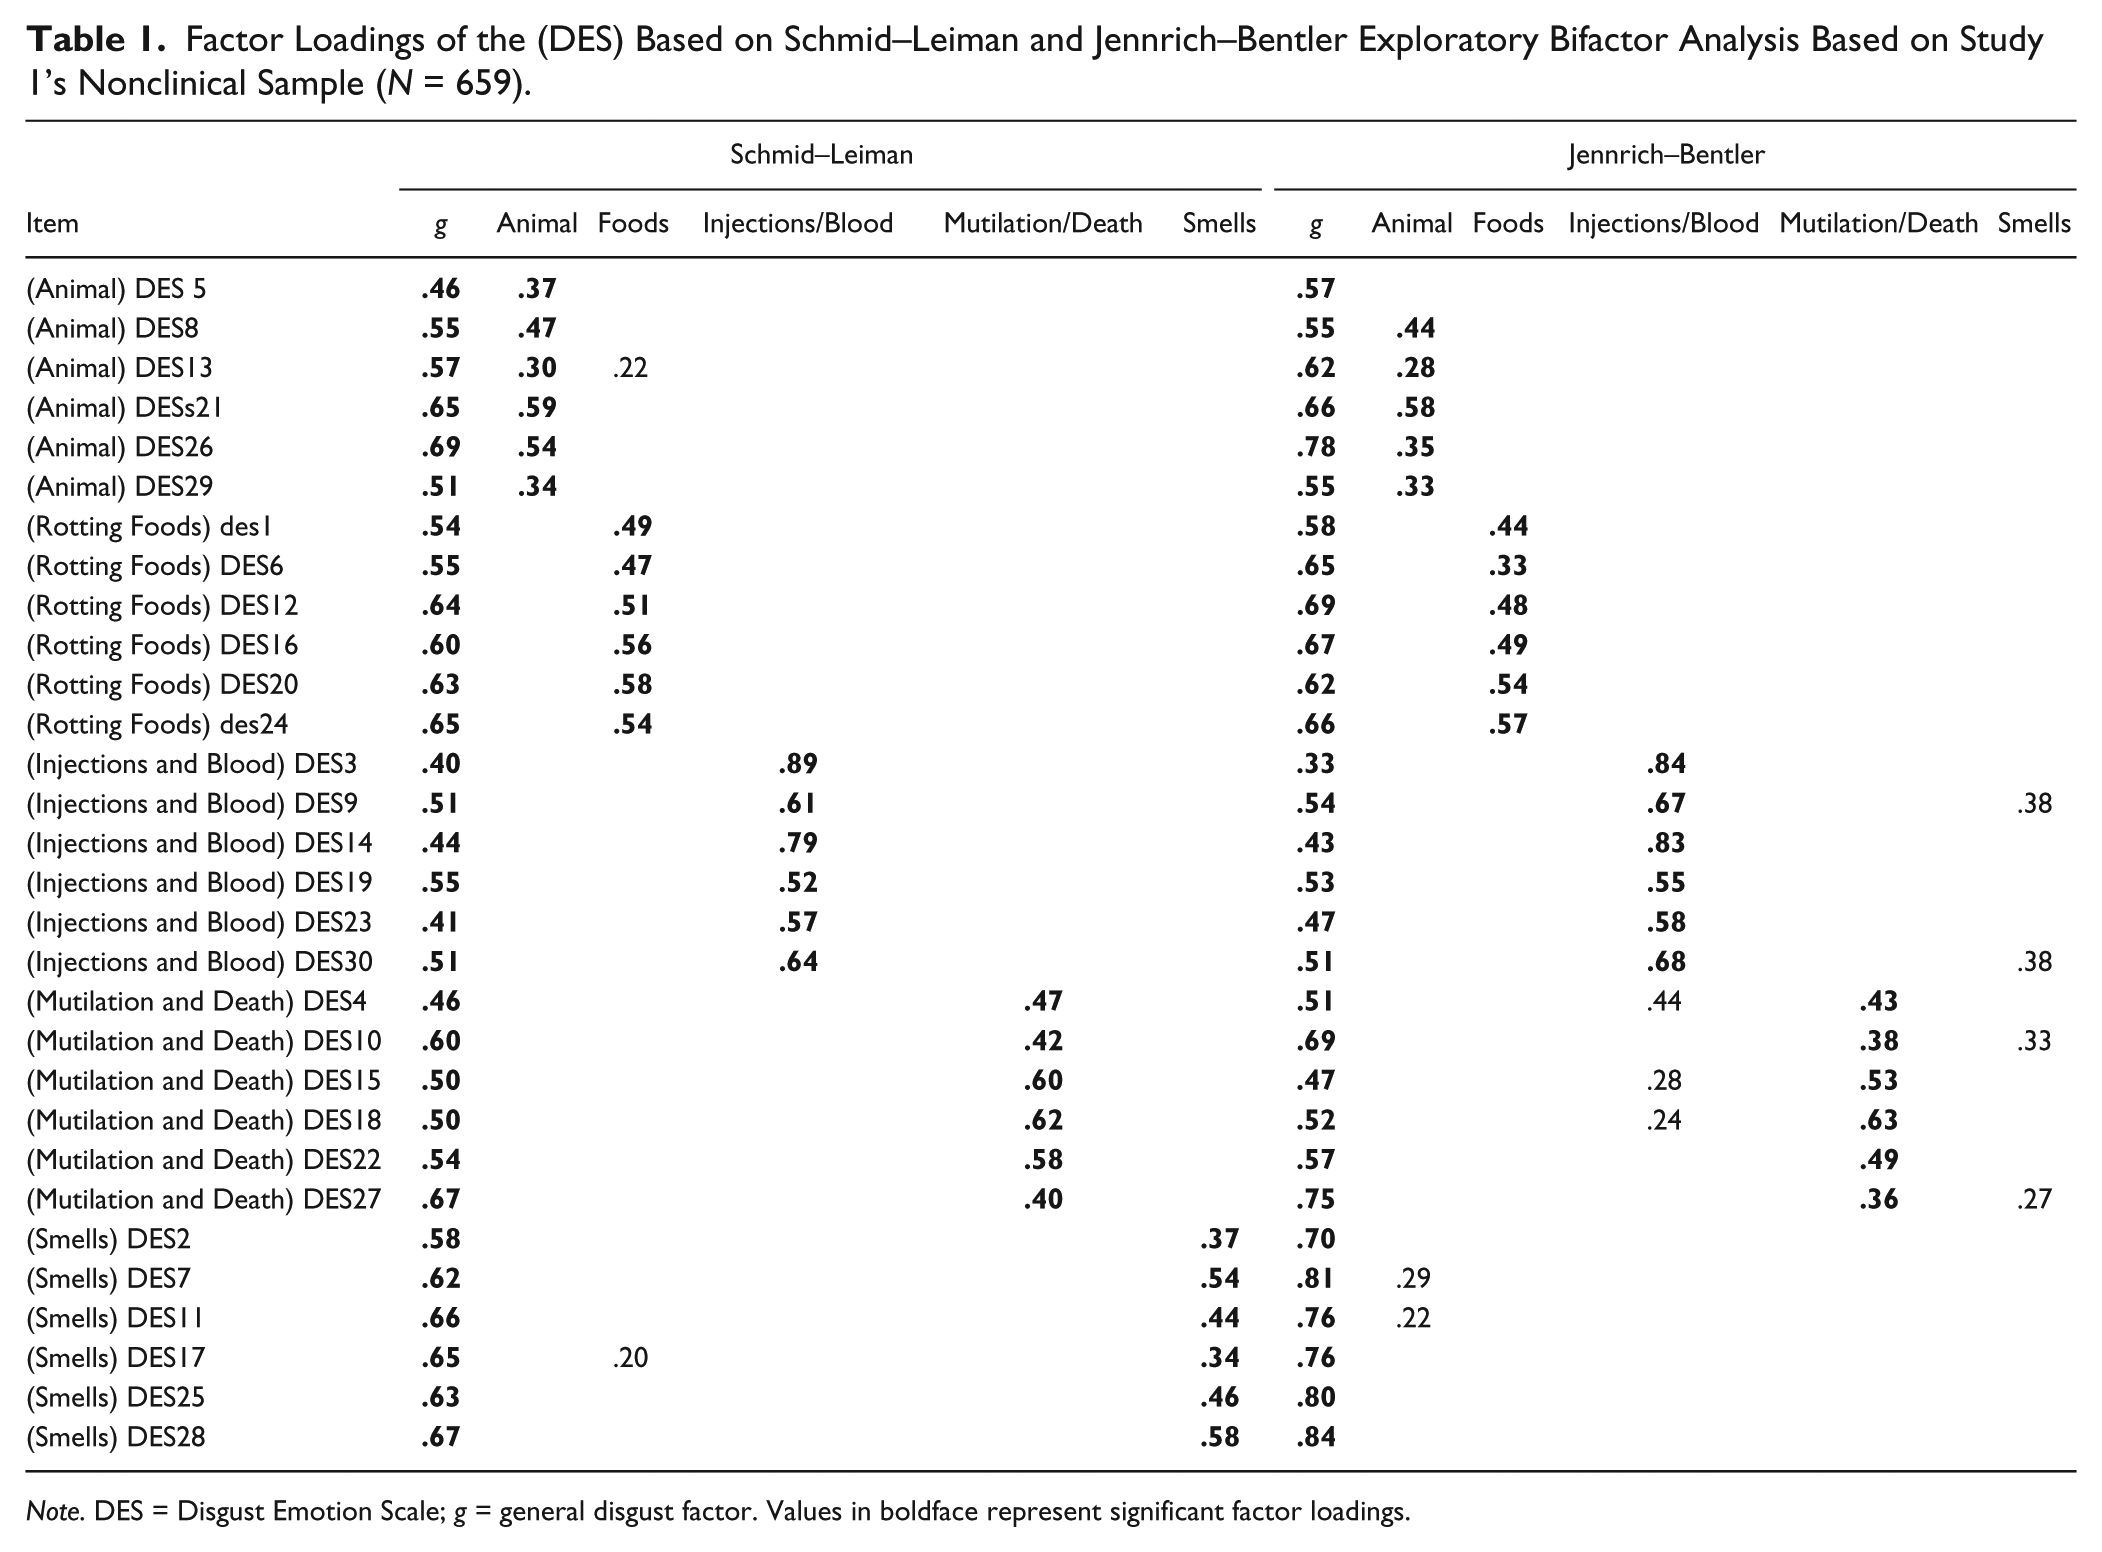
Note. DES = Disgust Emotion Scale; g = general disgust factor. Values in boldface represent significant factor loadings.
Confirmatory Bifactor Model
The five-factor bifactor model evidenced moderate fit (i.e., RMSEA = .089, CFI = .920, χ2 = 2333.039, degrees of freedom = 375). The 4-factor bifactor model (with the Smells subscale eliminated, based on the JB bifactor EFA results) also evidenced moderate fit (i.e., RMSEA = .093, CFI = .911, χ2 = 2565.753, degrees of freedom = 381). Notably, however, the five-factor bifactor model was associated with better model fit than the modified four-factor bifactor model based on both the chi-square difference test,
Factor Loadings (and Standard Errors) of the DES Based on Study 1’s Confirmatory Bifactor Analysis in a Nonclinical Sample (N = 659).
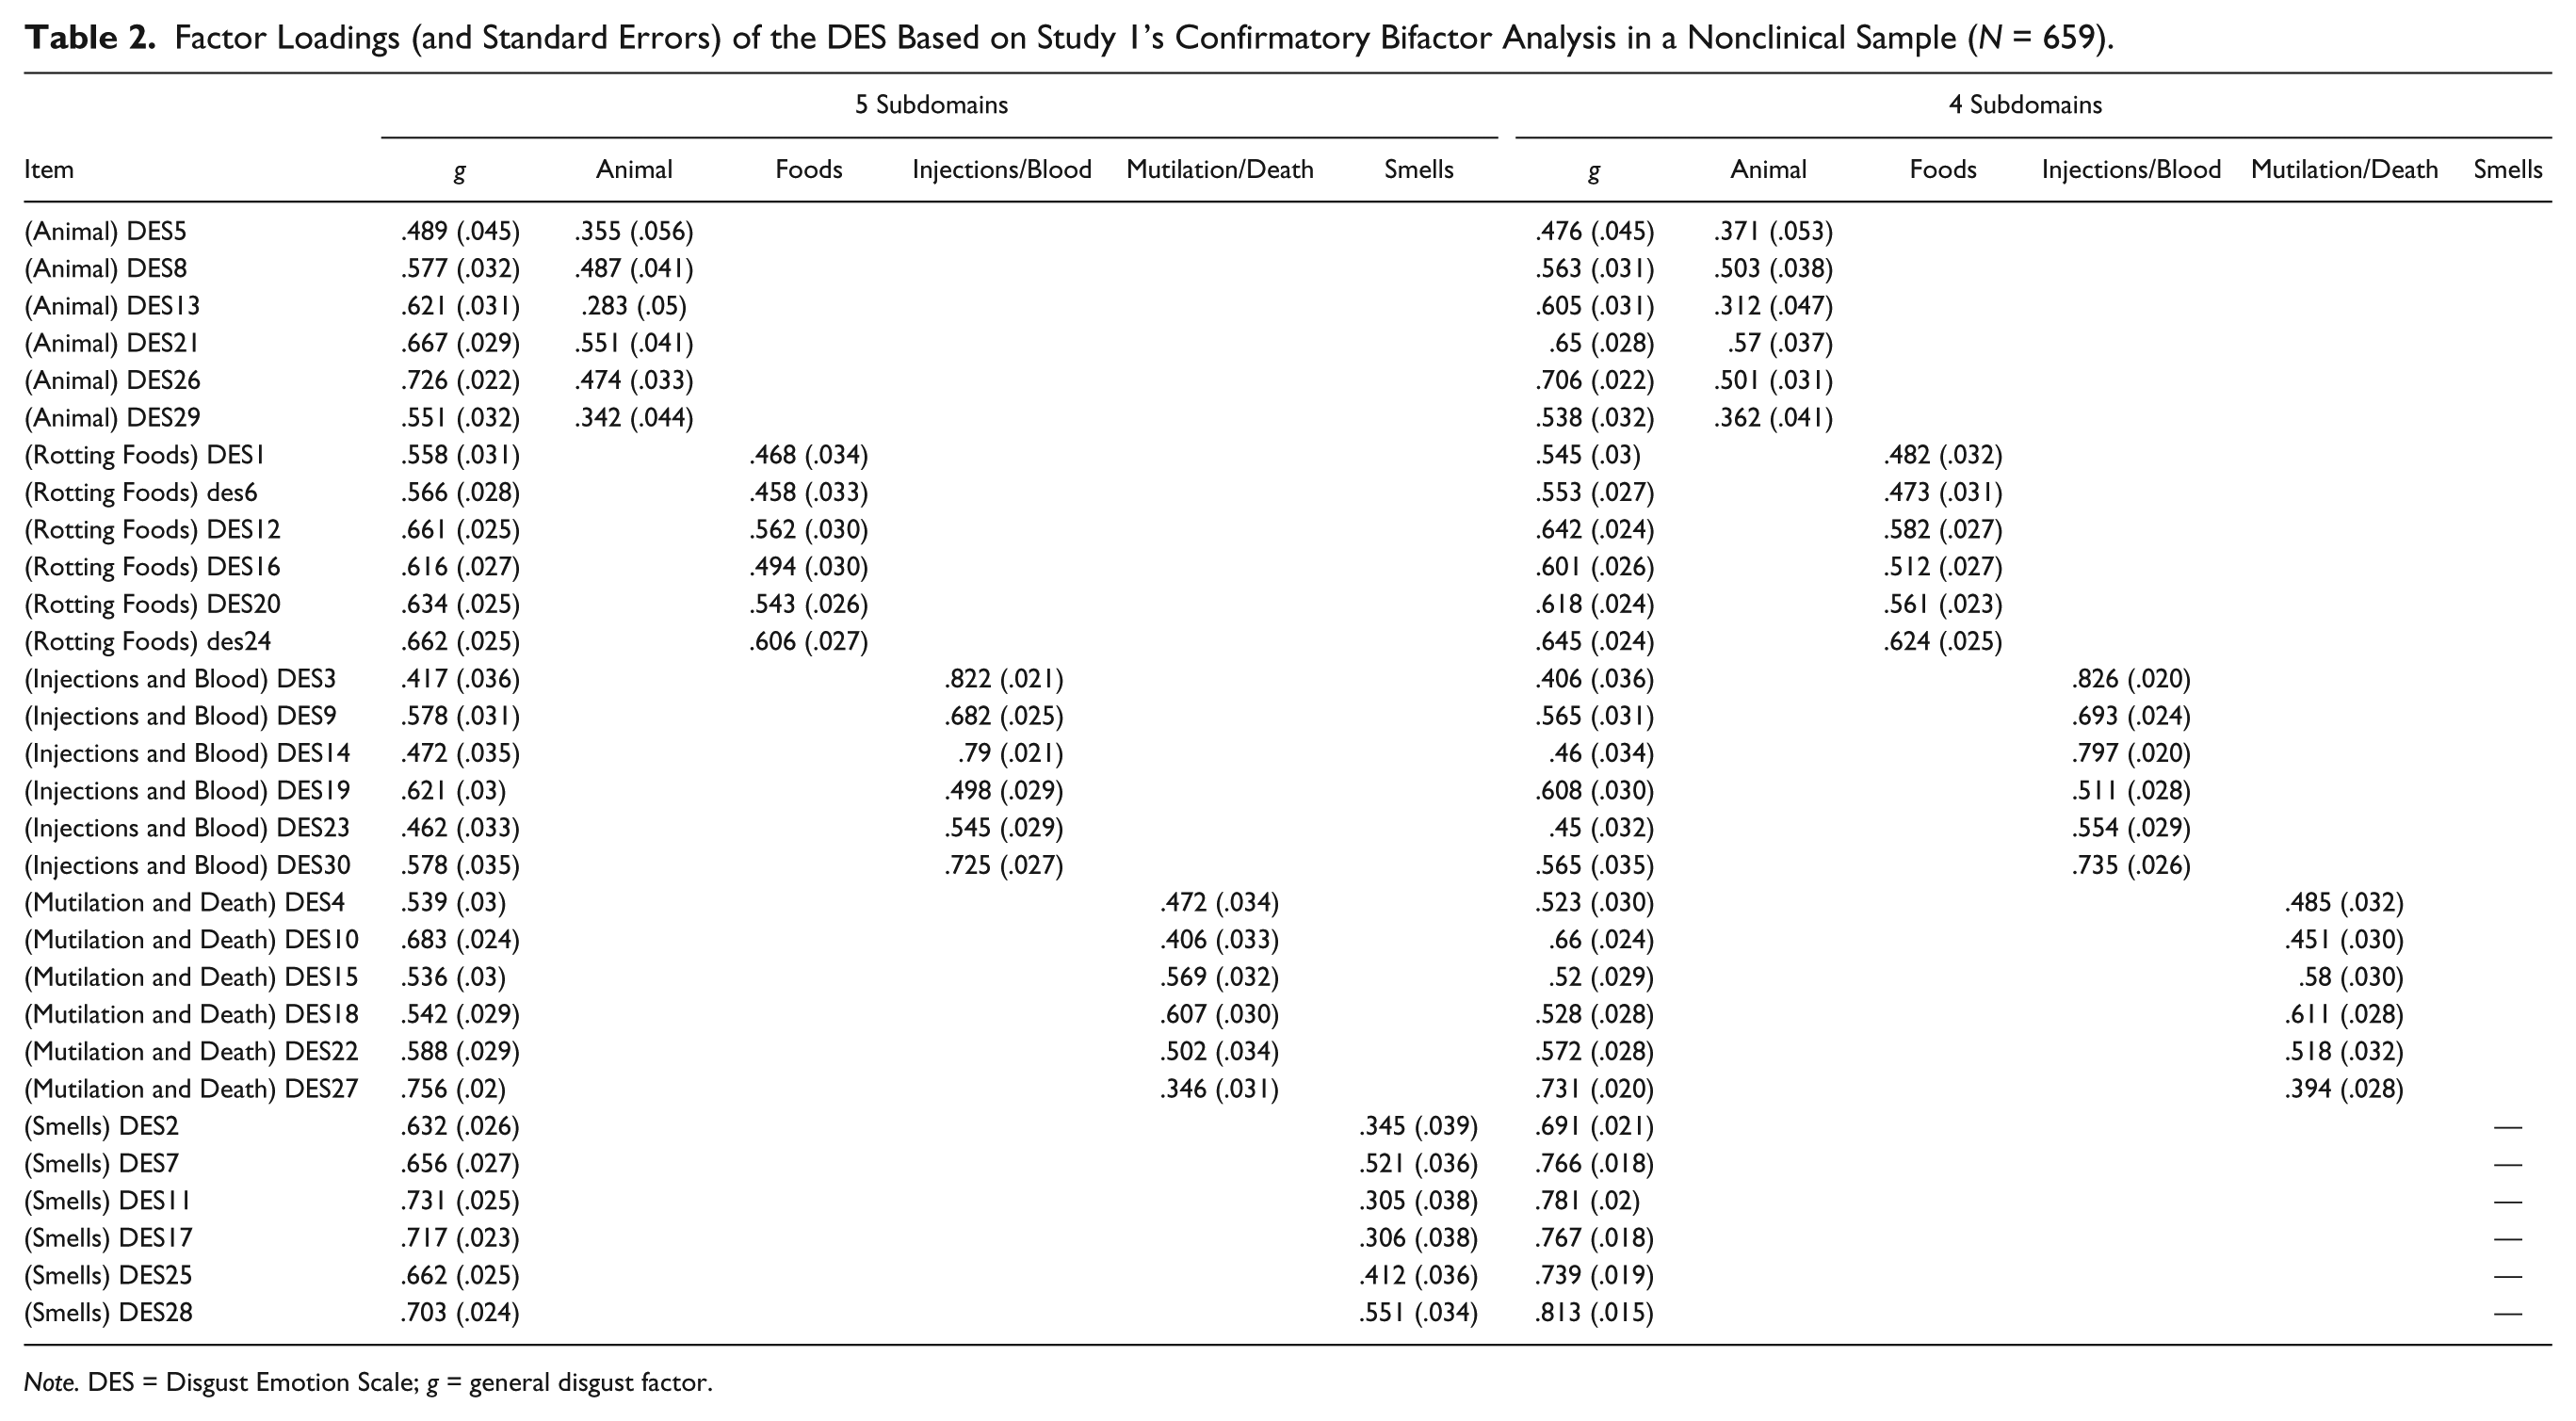
Note. DES = Disgust Emotion Scale; g = general disgust factor.
Scale Score Reliability and Dimensionality
All reliability indices appear in Table 3. As can be seen in this table, the total score and all subscale scores were associated with high alpha and omega reliability estimates. However, once accounting for the general factor, the reliability in the subscales dropped significantly (i.e., OmegaHsubscale was lower for all subscales, ranging from .239 to .594). OmegaHTotal on the other hand, was high (.836), supporting the presence of a strong general disgust dimension. Regarding dimensionality, the ECV was just under .60 (i.e., ECV = .582). This suggests that the DES scale may not be purely unidimensional but may have a structure that is at least somewhat multidimensional. In fact, the Mutilation/Death subscale was associated with the highest OmegaH relative to all other subscales, accounting for substantial reliable variance in the Mutilation/Death subscale scores above and beyond the general disgust factor. Similarly, ECV for the Mutilation/Death subscale was 15%, which is almost twice that of all other subscales. It is important to note, however, that dimensionality and determining whether to make interpretations based on the total score versus subscale scores are different issues, and we address the latter in Study 2.
Reliability Statistics (Including Alpha, Omega, and OmegaH) for the DES Total Scale and Subscales in Study 1 and Study 2.
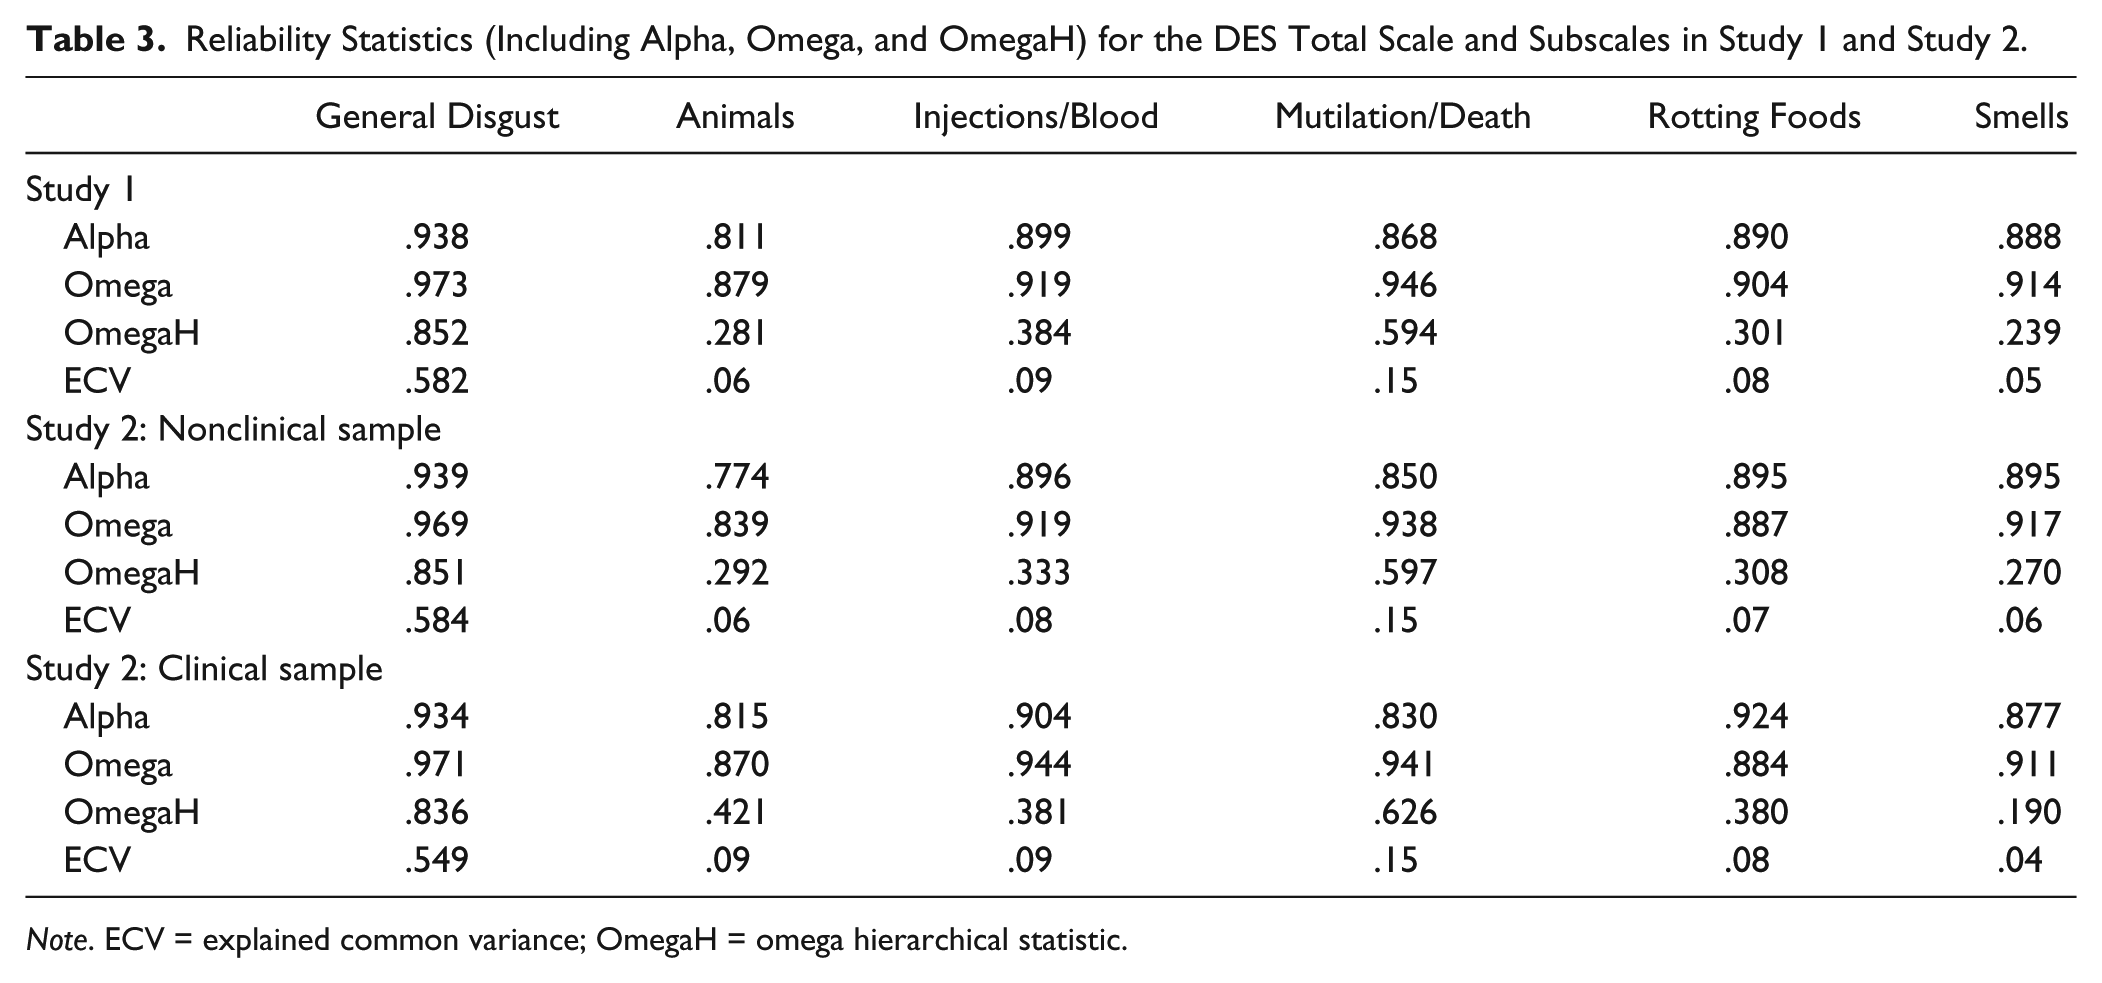
Note. ECV = explained common variance; OmegaH = omega hierarchical statistic.
Study 1 Discussion
Results from Study 1 are consistent with previous research suggesting that the DES consists of five factors including Animals, Rotting Foods, Injections/Blood Draws, Mutilation/Death, and Smells (Olatunji, Sawchuk, et al., 2007). However, when applying SL exploratory bifactor analysis, a similar, yet substantially different, model emerged—namely, the bifactor model of disgust proneness. Based on this bifactor model, all DES items were influenced by a common “general disgust proneness” dimension. The presence of a strong general disgust dimension was also supported by a high OmegaHTotal statistic. Although the reliability of the subscales also dropped substantially after accounting for the general factor of disgust in a bifactor model framework, the Mutilation/Death subscale was consistently associated with the highest OmegaH relative to the other DES subscales. This suggests that some consideration should be given to differentiating the Mutilation/Death subscale from the general disgust factor. This bifactor model may provide a better framework for understanding the structure underlying the DES items and may thus yield more accurate (i.e., less inflated) parameter estimates when examining the factor structure of the DES. Results from the JB exploratory bifactor analysis also supported the presence of a general factor of disgust. However, the JB exploratory bifactor analysis results suggested that the Smells subscale could be dropped, while the SL exploratory bifactor analysis results suggested that the Smells subscale could be retained. More research is needed to clarify the necessity of scoring the Smells subscale. Given the clinical implications of disgust proneness and its related subscales (Olatunji, Cisler, et al., 2010), Study 2 was conducted to examine the structure of the bifactor DES model via CFA in a nonclinical and clinical sample. We also sought to examine the relative contributions of the DES subscales in predicting an external anxiety criterion above and beyond the total DES score.
Study 2
Nonclinical Participants
Study 2 included 352 non–clinic-referred participants at a large southern university that completed the measures in exchange for research credit. The sample included 209 (59.4%) females and 143 (40.6%) males. Ages ranged from 18 to 50 years (M = 22.35, SD = 6.40).
Clinical Participants
A sample of 152 clinic-referred patients presenting to an intensive outpatient anxiety disorder treatment program provided informed consent and then completed the measures as part of the diagnostic intake assessment. Diagnoses were based on the Mini International Neuropsychiatric Interview (MINI; Sheehan et al., 1998). The MINI is a structured clinical interview used to assess 17 Axis I disorders. The MINI was administered by trained and certified master’s- and doctoral-level clinicians. A large proportion of the sample received a primary diagnosis of OCD (42%), 15% of the sample received a primary diagnosis of social anxiety disorder, 19% of the sample received a primary diagnosis of panic disorder, and 9% received a primary diagnosis of generalized anxiety disorder. A small minority received a primary diagnosis of anxiety disorder—not otherwise specified (5%), specific phobia (3%), posttraumatic stress disorder (2%), agoraphobia without panic disorder (2%), body dysmorphic disorder (1%), depression (1%), and Asperger’s (1%). Many participants were diagnosed with multiple disorders (50%), and the most common additional diagnosis was major depressive disorder (22%). The sample included 82 (53.9%) females and 70 (46.1%) males with a mean age of 28.53 (SD = 13.87). The majority of the sample was Caucasian (93%).
Measures
The DES Described in Study 1
The Obsessive-Compulsive Inventory–Revised (OCI-R; Foa et al., 2002) is an 18-item measure of OCD symptoms. Participants rate the degree to which they are bothered or distressed by OCD symptoms in the past month on a 5-point scale from 0 = not at all to 4 = extremely. The OCI-R assesses six types of OCD symptoms: Washing Concerns, Checking/Doubting, Obsessing, Mental Neutralizing, Ordering, and Hoarding.
Data Analytic Approach
Confirmatory Bifactor Model
Mplus Version 7.11 was employed to examine the bifactor model of the DES via CFA. Data were treated as categorical (ordinal) and multiple imputation (with 10 categorically imputed data sets) was employed to deal with missing data.
Scale Score Reliability
As in Study 1, we calculated reliability indices (i.e., Alpha, Omega, OmegaH) based on the confirmatory factor loadings from the DES bifactor model.
Unique Contribution of Group Factors
To further examine the relative predictive power of the specific subdomain constructs relative to the general disgust construct, we used SEMs whereby we had the DES group factors and general factor simultaneously predict an OCD factor as defined by the Washing Concerns, Checking/Doubting, Obsessing, Mental Neutralizing, Ordering, and Hoarding subscales of the OCI-R. Bivariate correlations, means, and standard deviations for all variables appear in Table 4. As noted above, disgust proneness has been implicated in the development of OCD (Olatunji, Cisler, et al., 2010). If any group factors significantly predicted the OCD factor while controlling for the general common disgust dimension, this would be evidence for the specific subscales providing incremental predictive utility above and beyond that of general disgust.
Bivariate Correlations, Means, and Standard Deviations for All Variables in Clinical Group (Below Diagonal) and Nonclinical Group (Above Diagonal).
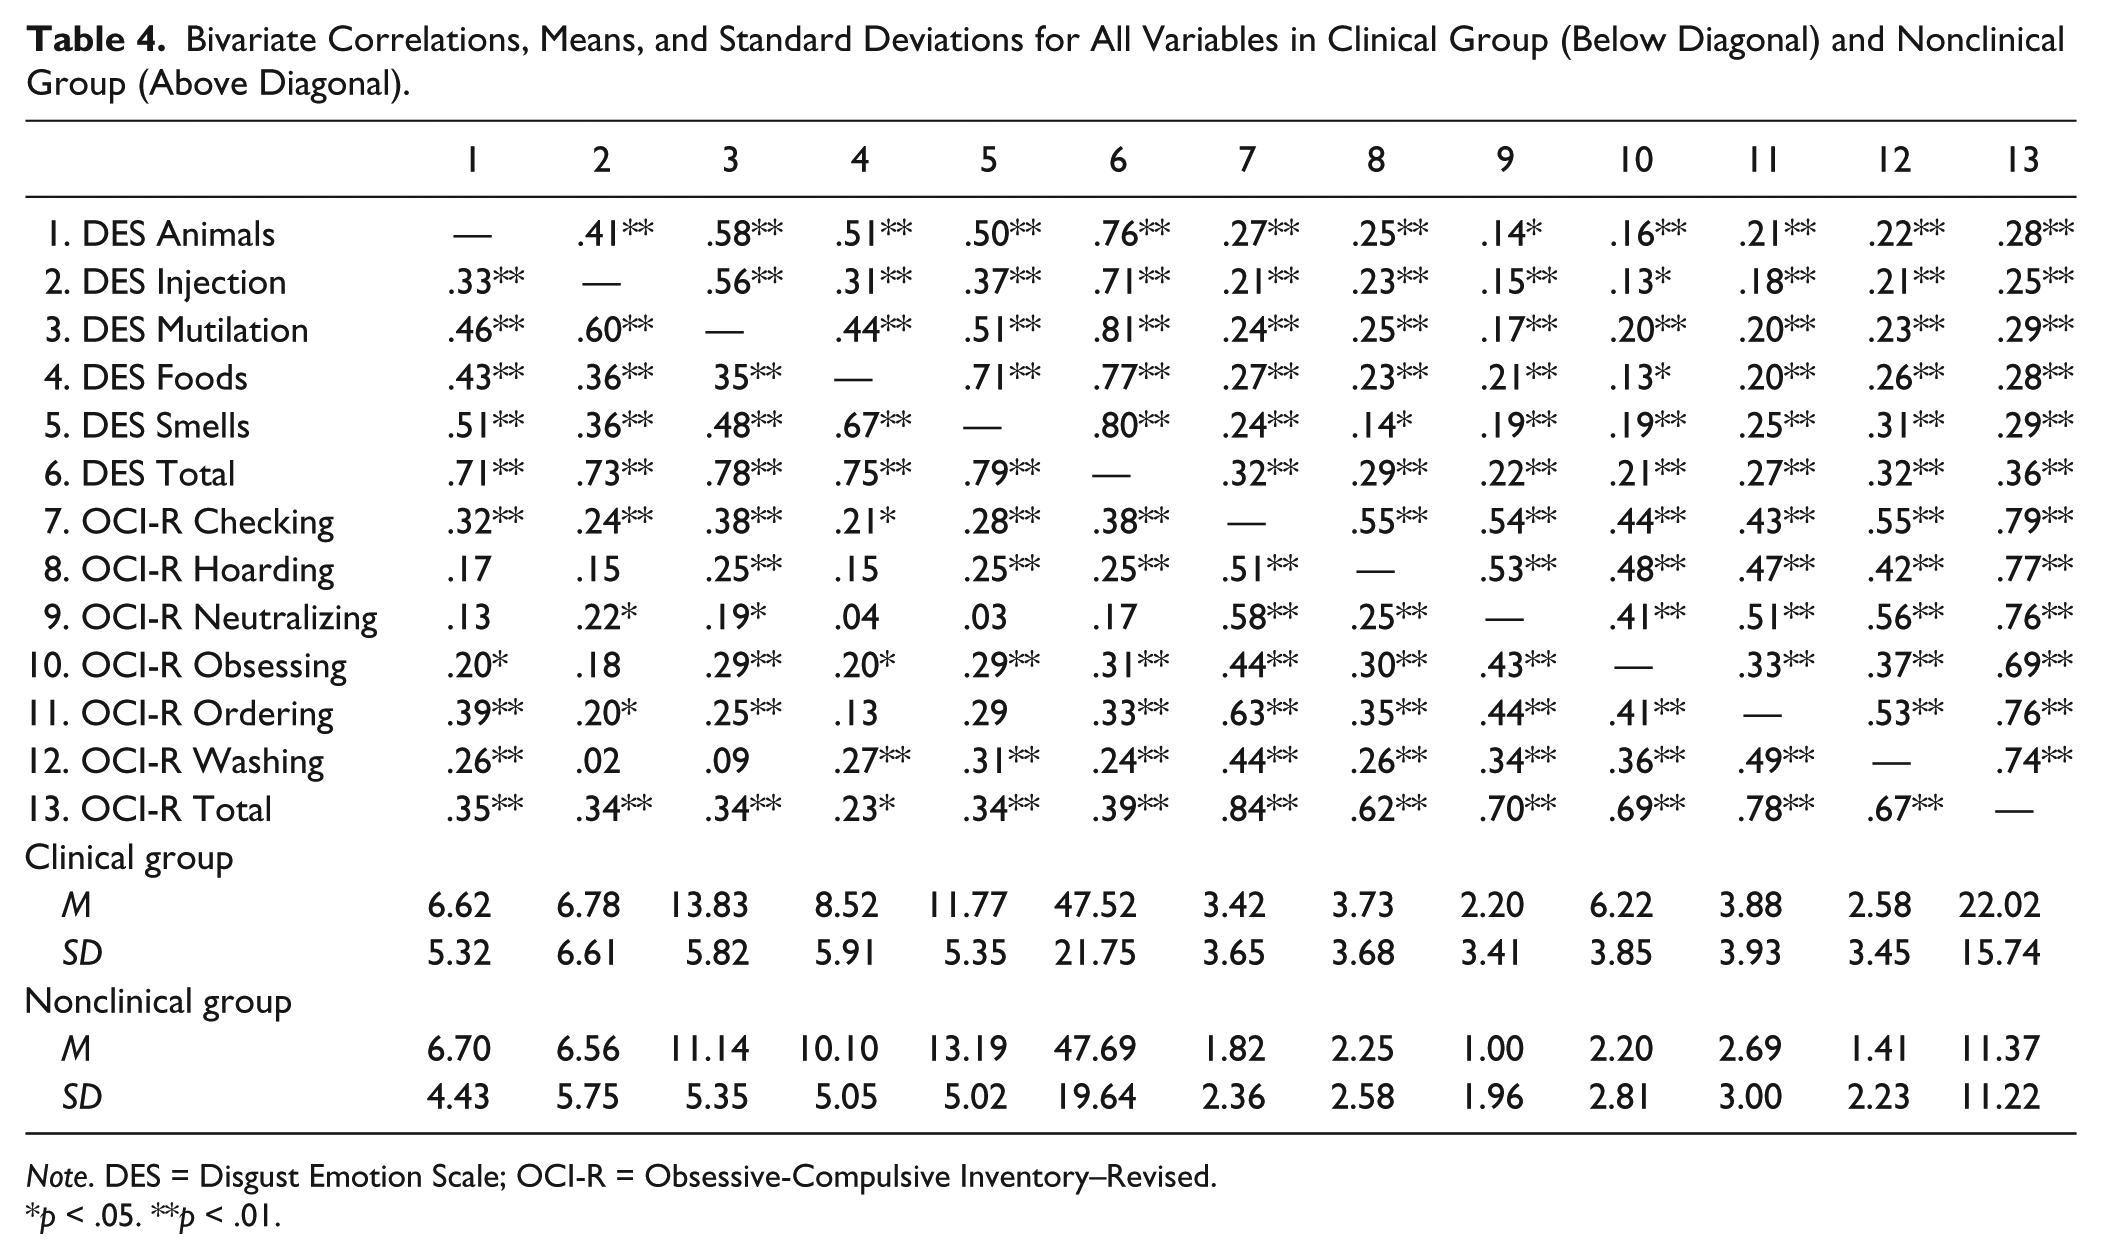
Note. DES = Disgust Emotion Scale; OCI-R = Obsessive-Compulsive Inventory–Revised.
p < .05. **p < .01.
Results
Confirmatory Bifactor Model
All items loaded significantly on the general g disgust factor, as well as on each of their respective five subdomains in the nonclinical and clinical sample. The five-factor bifactor model was also found to have adequate model fit based on the various fit indices in the clinical (RMSEA = .075, CFI = .94)3,4 and nonclinical (RMSEA = .090, CFI = .92) 5 sample. As with Study 1, all factor loadings significantly loaded on the general disgust factor, as well as on each of the five subdomains in both samples.
Scale Score Reliability and Dimensionality
All reliability indices appear in Table 3. Again, Alpha and Omega were high across all subscales and the total scale. As in Study 1, once accounting for the general factor, the reliability in the subscales dropped substantially on both the nonclinical (ranging from .27 to .59) and clinical sample (ranging from .19 to .62). OmegaHTotal on the other hand was high, supporting the presence of a strong general disgust dimension in the nonclinical and clinical sample. Regarding dimensionality, the ECV again fell just under .60 in the nonclinical (ECV = .584) and clinical sample (ECV = .549), suggesting that the scale may not be purely unidimensional. Consistent with Study 1, the Mutilation/Death subscale was associated with the highest OmegaH relative to all other subscales in the nonclinical and clinical sample, accounting for substantial reliable variance in the Mutilation/Death subscale scores above and beyond the general disgust factor. Similarly, ECV for the Mutilation/Death subscale was 15% in the nonclinical and clinical sample, which is almost twice that of all other subscales.
Unique Variance of the Subscales
The measurement model (for the SEM model used to examine the relative predictive power of the DES subscale dimensions compared with the total score general disgust dimension) was associated with good model fit (see Table 5) in both the nonclinical and clinical sample. Results from these SEM analyses revealed that the general disgust factor significantly predicted the OCD factor. The path from the Animals subscale to the OCD latent factor also became significant in the clinical sample. None of the other DES subscale dimensions predicted the OCD factor above and beyond the general disgust dimension. Prior research suggests that disgust proneness is more strongly related to the washing subtype relative to other OCD symptom subtypes (Tolin et al., 2006). Accordingly, these analyses were repeated with the OCD latent factor defined by only the items of the Washing Concerns subscale of the OCI-R, and the pattern of findings were unchanged in both samples.
SEM Measurement Model and Structural Parameter Results in Study 2: Disgust Latent Factors Simultaneously Predicting an OCD Latent Factor.
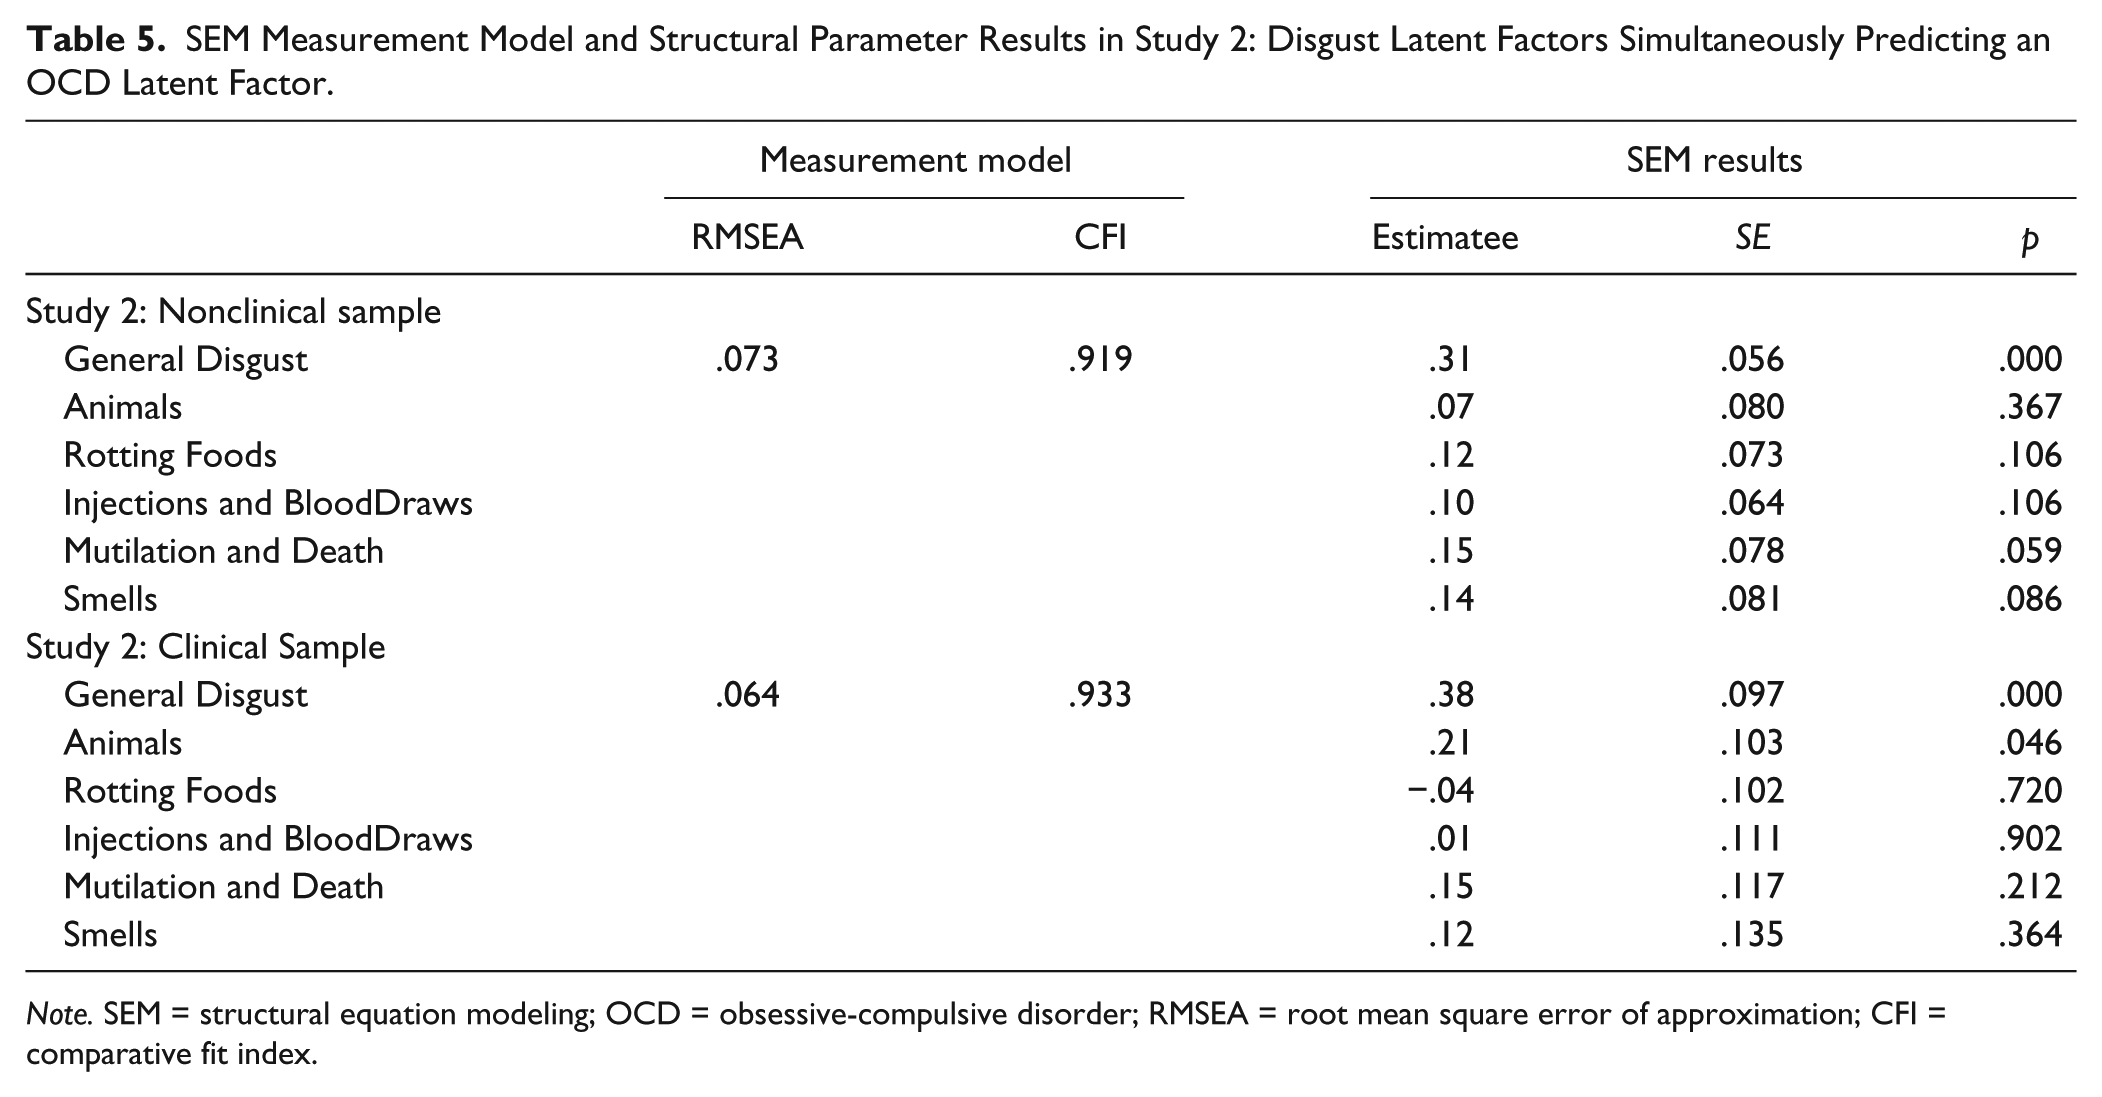
Note. SEM = structural equation modeling; OCD = obsessive-compulsive disorder; RMSEA = root mean square error of approximation; CFI = comparative fit index.
Study 2 Discussion
Findings from the confirmatory bifactor analysis support the robustness of the five-factor bifactor model underlying the DES items in an independent nonclinical sample and a clinical sample. Indeed, all bifactor model fit indices supported good model fit. All factor loadings also significantly loaded on the general disgust factor and on each of the five subdomains, as also seen in Study 1. The Mutilation/Death subscale was consistently associated with the highest OmegaH relative to the other DES subscales in the clinical and nonclinical samples. This supports the notion that the Mutilation/Death subscale should be differentiated from the general disgust factor. SEM did show that the general disgust factor significantly predicted the latent OCD factor, and only the Animals subscale in the clinical sample predicted the latent OCD factor above and beyond the general disgust factor.
General Discussion
Although preliminary data suggest that the DES may consist of distinct factors that are more reliable than those of commonly used measures of disgust proneness (Muris et al., 2012; Olatunji et al., 2007), much remains unknown about its underlying factor structure. To address this important limitation in the literature, a bifactor model was examined where a general disgust proneness factor underlies all the DES items, while five “group” factors coexist and correspond to each of the five subscales. The present study provided support for the bifactor structure of disgust proneness, as assessed by the DES, across three independent nonclinical and clinical samples. Support for a bifactor DES model in the current investigation suggests that a general disgust proneness factor coexists alongside specific domains of disgust proneness. Thus, the structure of disgust proneness in nonclinical and clinical samples appears to be more complex than first supposed, in that there are both general and specific components. This bifactor model of the DES provides a useful framework for conceptualizing the structure of disgust proneness in future research. Although the present findings are consistent with the notion that there is a broad overarching category of disgust proneness on the DES and specific domains of disgust proneness that correspond to Animals, Injections and Blood Draws, Mutilation and Death, Rotting Foods, and Smells, the bifactor model suggests that modeling these domains as merely lower level expressions of disgust proneness is incorrect. Rather, the domains of disgust proneness exhibit some communalities captured by a general disgust proneness factor, while also exhibiting specific components that are separate and unique from a general disgust proneness factor.
The present findings in both nonclinical and clinical samples also revealed that the total score on the DES and all subscale scores were associated with high reliability estimates. However, the present investigation also found that once accounting for the general factor, the reliability in the subscales dropped significantly. One implication of this finding is that the etiological pathway to the five distinct domains may be shared by a common general process that is rather robust. General disgust proneness may have its origins early in development where children learn to associate various objects with disgust, likely through intrafamilial modeling with facial expressions and social referencing (Davey, Forster, & Mayhew, 1993; Rozin & Fallon, 1987). This learning process in early development may largely serve the purpose of teaching the offspring to avoid oral incorporation of potential contaminants (“Don’t put that in your mouth!”). This oral rejection may function as the organizing principle for disgust proneness broadly defined that may be transferred from parent to child (Stevenson et al., 2010). Although disgust proneness to specific stimuli has expanded through cultural evolution, recent research suggests that the “outputs” (physiology, behavior, expression) have remained relatively stable (Chapman, Kim, Susskind, & Anderson, 2009). This suggests that disgust proneness toward stimuli such as Animals, Injections and Blood Draws, Mutilation and Death, Rotting Foods, and Smells may have evolved from a common oral rejection system that characterizes disgust proneness in general.
Although there was strong evidence for a strong general disgust dimension, the ECV did suggest that the DES may have a structure that is at least somewhat multidimensional. Some of this dimensionality may be understood by examining the distinctive features of the DES subscales. For example, prior research has shown that exposure to images of injections, blood draws, mutilation, and death evokes different patterns of brain activation than exposure to images of animals and contaminants (Borg, de Jong, Renken, & Georgiadis, 2013; Sarlo, Buodo, Poli, & Palomba, 2005; Schienle et al., 2006). Some of the dimensionality of the DES may also be understood by examining the distinct correlates of the DES subscales. For example, research has shown that the Injections and Blood Draws and the Mutilation and Death subscales of the DES show robust correlations with blood and injection phobia, whereas the other DES subscales showed weak correlations (Olatunji, Sawchuk, et al., 2007). Examination of the OmegaH values also provides some insight into which subscales contribute most strongly to the multidimensionality of the DES. The Mutilation/Death subscale was consistently associated with the highest OmegaH relative to all other group factors. Likewise, ECV for the Mutilation/Death factor was 15% in all three samples, which is almost twice that of all other group factors (4% to 9%) and suggests that the Mutilation/Death subscale cannot be rolled into the general disgust factor without losing some substantive variance. The OmegaH value for the Animals subscale was also relatively higher in the clinical sample. This suggests that the multidimensionality of the DES may be attributed more so to the distinctiveness of the Mutilation and Death and Animals subscales.
Despite the observed multidimensionality of the DES, the present findings showed that the general disgust factor of the DES significantly predicted a latent OCD factor indicated by Washing Concerns, Checking/Doubting, Obsessing, Mental Neutralizing, Ordering, and Hoarding in both nonclinical and clinical samples. These findings complement previous research implicating generalized disgust proneness in OCD (Olatunji, Cisler, et al., 2010). The path from the Animals subscale to the OCD latent factor was significant in the clinical sample, suggesting that disgust sensitivity toward small animals uniquely predicted the OCD latent factor above and beyond the general disgust factor. This finding is consistent with previous research showing that a number of elicitors representing core disgust (i.e., animals) uniquely predict symptoms of OCD (Olatunji et al., 2004). However, this could simply be a chance finding given multiple comparisons. Furthermore, the heterogeneous nature of the clinical sample (50% had comorbidities) could have given rise to this spurious relationship. In any case, because this was the first study to examine the relationship between disgust facets and OCD via a residualized model, the finding should be treated as preliminary and in need of replication.
Although it has been suggested that the association between OCD and disgust proneness may be strongest for specific components of disgust proneness (Olatunji et al., 2004; Olatunji et al., 2005), the present findings suggest that specific disgust domains assessed by the DES may not provide incremental predictive utility for OCD symptoms above and beyond that of general disgust (with the potential exception of the Animals subscale). This finding suggests that prediction of OCD symtpoms by specific disgust domains of the DES may be due largely to the association between the domains and a more generalized disgust response.
The present findings generally showed that the general disgust factor of the DES provides the greatest prediction (association) when targeting general OCD symptoms. Thus, assessment of a generalized disgust proneness is likely to be sufficient in predciting OCD. However, symptoms of OCD vary considerably (Mataix-Cols, do Rosario Campos, & Leckman, 2005), and distinct OCD symptom subtypes have been identified that are marked by differences in response to treatment (McKay et al., 2004), patterns of comorbidity (Holzer, Goodman, McDougle, & Baer, 1994), neural correlates (Phillips et al., 2000), genetic transmission (Leckman et al., 2003), and underlying latent structure (Olatunji, Williams, Haslam, Abramowitz, & Tolin, 2008). Similarly, there is consistent research showing that disgust proneness may be a stronger risk factor for contamination obsession and washing compulsion subtype of OCD compared with other variants of OCD (Tolin et al., 2006; Woody & Tolin, 2002). Given such findings, examination of the relationship between the washing subtype of OCD and the specific domains of disgust proneness supported by the bifactor model may yield a different pattern of associations. However, supplementary analysis showed that the general disgust factor of the DES significantly predicted a latent OCD factor indicated by Washing Concerns only, whereas none of the DES subscales uniquely predicted the OCD Washing latent factor above and beyond the general disgust factor. This finding suggests that the DES subscales have limited utility above and beyond the general disgust factor of the DES in predicting OCD symptoms most strongly associated with disgust.
Although the DES subscales did not add to the prediction of OCD symptoms above and beyond the general disgust factor, this may not necessarily be the case for other disorders. For example, there is preliminary evidence (Muris et al., 2012) that certain fears have stronger associations with specific DES subscales (e.g., spider/animal phobia with the Animals subscale, blood/injury phobia with Injection/Blood subscale), whereas other fears (e.g., social phobia, agoraphobia) are more strongly associated with general disgust. Future research employing a bifactor approach is needed to replicate these findings, given they clearly suggest that examination of the DES subscale may be useful in some clinical contexts.
The present study delineates the structure of the DES, and the findings have important implications for improving understanding of the structure of disgust proneness, improving clinical assessment of disgust proneness, and aiding in refinement of the behavioral phenotype of disgust proneness. With the availability of multidimensional measures of disgust proneness, it is vital to begin to examine the extent to which subscales are meaningful and provide reliable estimates of the subscale’s true score above and beyond that provided simply by the total score (cf. Reise, Bonifay, et al., 2013). This is especially important in research on disgust proneness where there is some controversy with regard to what the domains of disgust consist of and how to best go about assessing the domains (Rozin & Haidt, 2013). These more in-depth analyses are needed to more fully understand the psychometric properties of seemingly multidimensional scales of disgust proneness—although such analyses have yet to catch on as common practice in psychometric studies and analyses. This investigation shows that the DES is unidimensional and it comprises distinct subscales. However, this investigation also suggests that scoring a general disgust dimension on the DES may be preferred despite the confirmed multidimensional structure. This finding is quite consistent with the common assumption that subscales as well as total scores can be reliably and meaningfully interpreted. However, this often is not the case when put to the empirical test (cf. Reise, Bonifay, et al., 2013).
This is the first study to our knowledge to examine a bifactor model of disgust proneness, as assessed by the DES, and its implications for predicting symptoms of OCD. In fact, psychometric questions of this sort have only recently begun to be explored and understood in the literature. The bifactor model—albeit slow to be adopted among psychological researchers—provides the field with a new way of modeling “interrelated” constructs (that are theoretically linked by a common “general” factor) and also allows for the calculation of indices that estimate the degree to which multidimensional data may be represented as largely unidimensional. Although examination of the suitability of the bifactor model of the DES in a clinical sample is a strength of the present study, there may be added value in examining the model with different measures of disgust proneness in specific disorders when adequate sample sizes allow. Examination of the bifactor model across the developmental life span may also prove to be rather informative. It has been posited that the acquisition of disgust may have a specific developmental time course (Rozin & Fallon, 1987), and the extent to which a bifactor model of disgust proneness is observed may vary as a function of this time course. Examination of a bifactor model of measures that assess other domains will also be needed before more definitive claims can be made about the structure of disgust proneness. For example, the newly developed Three Domains of Disgust Scale (Tybur, Lieberman, & Griskevicius, 2009) assesses Sexual and Moral disgust domains that are not included in the DES. It remains unknown whether these other domains would overlap with a general disgust dimension to the same extent as do the five domains on the DES. Psychometric research along these lines may prove quite valuable in informing theoretical models on the psychological mechanisms that give rise to distinct disgust domains.
Footnotes
Appendix
Acknowledgements
The authors would like to thank Patrick McGrath for his assistance with data collection.
Declaration of Conflicting Interests
The author(s) declared no potential conflicts of interest with respect to the research, authorship, and/or publication of this article.
Funding
The author(s) received no financial support for the research, authorship, and/or publication of this article.