
Abstract
The present study examined the convergent and predictive validity of the Jesness Inventories (JI) in a sample of 138 juvenile offenders, completed in the course of routine service delivery. JI profiles were compared with ratings on three standardized forensic clinical scales: the Youth Level of Service/Case Management Inventory, Psychopathy Checklist: Youth Version, and Violence Risk Scale–Youth Version. The JI Asocial Index and the Undersocialized Active and Group-Oriented Conformist Interpersonal Maturity Level (I-level) subtypes demonstrated the strongest pattern of convergence and most consistently predicted recidivism. The Asocial Index did not incrementally predict recidivism after controlling for scores on the standardized forensic clinical scales; however, meaningful differences among broad I-Level groups (I-3 and I-4) remained after controlling for risk. Risk-need-responsivity applications of the JI (i.e., in terms of treatment dosage, identifying treatment targets, and adaptation of services) are discussed within the context of a comprehensive forensic assessment framework to inform case formulation, service delivery, and decision making with justice involved youth.
The psychological assessment of youth involved in the criminal justice system has many important functions. These include, but are not limited to, evaluating suitability for pretrial release or detention (Hoge, 2012); informing sentencing decisions post-conviction (Hoge, 1999, 2001); providing recommendations for treatment and case management services such as dosage, targets to be prioritized for services, and factors that may impact response to services (Borum, 2000; Grisso, 1998; Hoge, 2001, 2012; Hoge & Andrews, 1996); and the promotion of public safety (Borum, 2000).
To aid in the forensic assessment of juveniles a broad range of assessment tools and practices have been developed to evaluate juveniles in criminal justice contexts across multiple domains of psychological functioning, including cognitive and neuropsychological functioning, academic achievement, mental health and emotional functioning, and personality, as well as specialized forensic instruments that assess risk for different recidivism outcomes (see Hoge, 1999, 2001, 2012, for reviews). The latter includes clinical rating scales designed to appraise risk for violence (e.g., Structured Assessment of Violence Risk in Youth [SAVRY], Borum, Bartel, & Forth, 2002; Violence Risk Scale–Youth Version [VRS-YV], Wong, Lewis, Stockdale, & Gordon, 2004-2011); instruments intended to assess risk for general recidivism and inform case management (e.g., Youth Level of Service/Case Management Inventory [YLS/CMI]; Hoge & Andrews, 2003); and measures developed to assess personality constructs associated with antisocial behavior, such as juvenile psychopathy (e.g., Psychopathy Checklist: Youth Version [PCL:YV]; Forth, Kosson, & Hare, 2003). A meta-analysis of the SAVRY, PCL:YV, and juvenile variants of the Level of Service scales demonstrated that the tools each had good predictive accuracy for general (rs = .25 to .33) and violent (rs = .25 to .31) recidivism, approximately moderate in magnitude (Cohen, 1992; Rice & Harris, 2005), with no single instrument displaying superior predictive accuracy for any single outcome (Olver, Stockdale, & Wormith, 2009). As the present brief review highlights, however, these tools have overlapping but importantly distinct clinical purposes beyond recidivism prediction.
The Relevance of Personality in Forensic Assessment
The risk-need-responsivity (RNR) framework of Andrews and Bonta (1994-2010), embedded within the general personality and cognitive social learning theory of criminal conduct, identifies eight central criminogenic needs linked to the origin and maintenance of criminal behavior (e.g., antisocial attitudes, negative peers). Among the “Central Eight” are personality traits linked to criminal behavior, for instance, constructs pertaining to personality or temperament such as juvenile psychopathy assessed via measures such as the PCL:YV or Antisocial Process Screening Device (Frick & Hare, 2002) or other operationalizations such as the Personality/Behavior need domain of the YLS/CMI (i.e., a constellation of characteristics that include a lack of guilt/remorse, poor frustration tolerance verbal and physical aggression, inflated self-esteem, and empathy deficits). Discussion and debate exists as to whether personality traits constitute criminogenic needs that should be directly prioritized for treatment, responsivity issues (i.e., individual client characteristics that inform the manner in which treatment is provided), or both (Listwan, Van Voorhis, & Ritchey, 2007). Andrews and Bonta (2010), for instance, conceptualize subjective personal distress variables (e.g., depression, anxiety, low-self-esteem) which can have trait-like qualities (e.g., neuroticism) as responsivity issues, given that these attributes tend to be weak predictors of criminal behavior (Cottle, Lee, & Heilbrun, 2001) but nevertheless can affect engagement with treatment. It seems the forensic relevance of personality variables from an RNR perspective may well vary with the type of trait considered and/or method used to assess them.
The Jesness Inventory: A Brief Theoretical Overview and Recent Research
Specialized forensic self-report tools have also been developed to assess salient personality characteristics of youth involved in the justice system, a prominent example of which is the Jesness Inventory (JI; Jesness, 1962) and its revision (Jesness, 2004), collectively referred to as the “JI” scales. Since its inception 50 years ago, the JI has accumulated normative data on 4,380 North American youth and adults; the major aspect of the revision being the renorming (Jesness, 2004). Although the JI has been normed for youth as young as age 8 and adults, the most popular use of the tool has been with adolescents, particularly those demonstrating behavioral and emotional concerns (Jesness, 1988). The JI consists of 11 personality scales (summarized briefly in the Method section) and 9 subtypes based on the Interpersonal Maturity Level Classification System (I-level theory) described briefly below.
I-level theory posits that “a normal childhood developmental progression is characterized by higher levels of integration of perception, as shaped by the individual’s unique cognitive lens” (Jesness, 2004, p. 21). Originating in the work of Sullivan, Grant, and Grant (1957), I-level theory sought to integrate contributions from Piagetian, Lewinian, and psychoanalytic perspectives into a single theory of personality development characterized by growth in interpersonal maturity and cognitive–perceptual complexity (Harris, 1988). Warren (formerly Grant) later adapted this body of theory into a classification system for juvenile offenders, featuring an interview-based protocol, which was intended to identify response to intervention and tailor treatment (Harris, 1988; Warren, 1971, 1983); the I-level system was the primary treatment planning tool for the California Youth Authority’s (1961-1975) Community Treatment Project (Harris, 1988). Harris (1988) notes that I-level theory was not intended initially to classify juvenile offenders and seven stages of development were specified ranging from I-1 (characteristic of infants) to I-7 (a hypothetical stage seldom attained). In the California Treatment Project, most youth were classified into I-2, I-3, or I-4 (Harris, 1988).
That adolescence is a unique period of cognitive, emotional, and behavioral development is recognized in North American criminal justice systems. It is well established, for instance, that juveniles have incomplete prefrontal cortex development (which occurs into the mid-20s), are more behaviorally impulsive, have decreased emotional inhibition, underestimate negative consequences of risk-taking (including criminal behavior), and have greater vulnerability to negative peer influences (Steinberg, 2005, 2007, 2008; Steinberg, Cauffman, Woolard, Graham, & Banich, 2009; Steinberg & Monahan, 2007). Research on juvenile offending trajectories further illustrate that most juvenile offenders are adolescent limited, while only 5% to 10% go on to become serious, persistent offenders who are criminally active well into their adult years (Moffitt, 1993; Moffitt, Caspi, Harrington, & Milne, 2002). Such considerations were identified in a recent Amicus Curiae brief (Miller v. Alabama) prepared by the American Psychological Association (2012) to inform criminal justice sanctions of youth. The importance of an I-level classification system is that it recognizes that juveniles are different developmentally from adults in some very important ways, and the JI scales attempt to capture this as well as distinguish among juveniles with different levels of maturity.
The JI specifically incorporates separate scales and an overall profile classification for nine subtypes across these three levels with higher levels indicating more advanced cognitive, perceptual, and social integration (Jesness, 2004). Briefly, I-2 youth tend to view the world in concrete black and white terms, tending not to make fine discriminations of others, and may resort to aggression or passive withdrawal in response to frustration. I-2 is organized into two subtypes: Undersocialized Active (AA) and Undersocialized Passive (AP). I-3 youth “tend to view the world in terms of rules and power” (p. 21), they tend to be cognizant of rules, and much of their behavior is organized around utilizing, circumventing, or conforming to rules; particularly within the context of a peer-group power structure. I-3 is organized into three subtypes: Immature Conformist (CFM), Group-Oriented Conformist (CFC), and Manipulator Pragmatist (MP). Finally, I-4 youth view the world in a more complex and nuanced manner than youth in the lower levels, are more likely to organize their behavior according to internalized standards and values and to experience emotional conflict or distress if they fail to do so. I-4 is organized into four subtypes: Neurotic Autonomy Oriented (NA), Neurotic Introspective Anxious (NX), Situational Emotional Reaction Inhibited (SE), and Cultural Identifier/Adaptive (CI).
In principle, there are several important potential advantages to a tool such as the JI, which is a forensic self-report inventory that is easy to administer, has a Grade 4 reading level, can be completed quickly (about 30 minutes), has a wide age range of applicability, with I-levels intended to inform case conceptualization, assessment decisions, and treatment recommendations for juvenile offenders (Jesness, 2004). And given that it is a self-report tool, the JI is less likely to encounter problems with inconsistent field reliability as has been identified with some forensic clinical scales and actuarial tools in certain jurisdictions (e.g., Edens, Boccaccini, & Johnson, 2010; Murrie et al., 2009).
Support for the psychometric properties of the JI has been established in various forms. For instance, Dembo, La Voie, Schmeidler, and Washburn (1987) found, in a sample of 145 juvenile offenders, that a composite variable created through a factor analysis of the JI subscales that they termed Antisocial Value Behavior Orientation, was significantly associated with alcohol and illicit drug use and the number of secure custody placements, but not other indexes of criminal behavior. Moreover, in a sample of 414 juvenile offenders, high scores on the Denial and Asocial Index personality scales were found to uniquely predict 2-year rates of recidivism (Benda, Corwyn, & Toombs, 2001) and in a sample of 480 boot camp attendees within an adult correctional system, 8 out of 11 of the JI personality scales uniquely predicted 3-year recidivism (Benda, Toombs, & Peacock, 2002). Using an alternative I-level typology (Van Voorhis, 1994), Listwan et al. (2007) found the highest long-term rates of recidivism among adult male offenders classified as Neurotics (NA and NX). Subsequently, in a large sample of male parolees, Van Voorhis, Spiropoulos, Ritchie, Seabrook, and Spruance (2013) found that men classified as Neurotics who received cognitive treatment actually had higher rates of recidivism than similarly classified untreated controls.
Research comparing JI profiles among juvenile offender types has yielded contradictory results. Oliver, Hall, and Neuhaus (1993), in a sample of 150 juvenile offenders, found that adolescent sex offenders scored significantly lower on Social Maladjustment (an index of antisocial attitudes) than violent and nonviolent youths and were also significantly less likely to be classified in I-4 compared with the other two groups. In a sample of 101 juvenile offenders, Butz and Spaccarelli (1999) found that the JI did not reliably differentiate among juveniles classified as rapists, nonsexual offenders, and deniers. However, in a juvenile sample of 30 hands-on sex offenders and 34 nonsexual offenders, Flores (2002) found that nonsexual offending youth scored significantly higher on the Social Maladjustment, Value Orientation, Alienation, and Asocial Index subscales. In a sample of 94 female juvenile offenders, Allen et al. (2003), contrary to expectations, found that youth convicted of nonviolent offenses actually had more pathological JI profiles (higher scores on approximately two-thirds of the scales) than violent youth. In addition, Clark (2011) found that JI-R scores on Manifest Aggression and Withdrawal-Depression (the only subscales examined) did not predict recidivism or discriminate violent from nonviolent offending in a sample of 95 male juvenile offenders. It is difficult to decipher the meaning of such contradictory findings, however, when measures of risk have not been administered.
Present Study
The development of specialized forensic youth measures frequently used to inform risk, identify treatment needs, and to assist with sentencing, risk management, and supervision decisions may have interesting implications for the additive value of forensic self-report tools such as the JI. The primary objective of the present study was to examine the forensic relevance and psychometric properties of the JI in the context of juvenile offender assessment. In doing so, this work endeavored to contribute to extant knowledge to inform clinical integration of assessment data obtained from multiple methods and sources.
The current study was thus organized into four central aims. First, very little research has examined the convergent validity of JI scores with well-known standardized clinician rated tools; our first aim was to examine patterns of convergent validity of JI scores with the YLS/CMI, PCL:YV, and VRS-YV. We hypothesized that the Asocial Index and I-level subtype scores associated with lower levels of maturity (I-2 and I-3) would have the strongest associations, while higher levels of interpersonal maturity (I-4) would show inverse associations. Broadly, we anticipated that JI personality scales associated with more delinquent functioning (e.g., Social Maladjustment) would also demonstrate positive associations, while those scales associated with internalizing emotional pathology (e.g., Social Anxiety) would show inverse associations or no association. The extent to which JI scores covary in meaningful and expected directions with standardized forensic measures indicate shared variance in the measurement of risk and forensically relevant personality constructs (e.g., juvenile psychopathy), and thus underscore the forensic relevance and potential utility of the JI in juvenile offender evaluations.
Second, although the JI was developed in part to be used in criminal justice contexts with delinquent youth, there is relatively little research examining its predictive accuracy for recidivism, and to our knowledge no research examining to what extent the JI may have value added beyond clinician rated forensic tools. As such, our second aim was to examine the predictive accuracy of JI scores for short and longer term recidivism outcomes while controlling for individual differences in follow-up time. In addition, we sought to examine the incremental predictive validity of selected JI scales for recidivism beyond the three aforementioned standardized forensic youth assessment measures. Specifically, we hypothesized that the Asocial Index, which may have the most risk variance, accordingly, would be the most likely of the JI personality scales to predict violent and any criminal recidivism. We similarly anticipated higher scores on the lower I-levels (I-2 and I-3), as above, to predict increased recidivism and for scores on the higher I-levels (I-4) to predict decreased recidivism. We did not expect JI scores in these domains, however, to be incremental in the prediction of recidivism, given that the standardized clinician rated measures are purpose-built tools designed specifically to appraise risk or to assess personality and behavioral constructs that overlap highly with it.
Third, limited research has examined other relevant correlates of the I-levels which would aid in their interpretation. Theoretically, I-2 and I-3 youth should have greater problems in other societally relevant domains that would require some modicum of cognitive integration and interpersonal maturity, compared with I-4 youth (e.g., cognitive ability and academic achievement), as well as possess a greater number risk-need, personality, and behavioral features linked to criminal behavior. As such, we examine theoretically relevant domains among the I-level subtypes which may have implications for case formulation and decision making, and hypothesized that I-2 youth would be highest risk and have the lowest level of ability and achievement, followed successively by I-3 and I-4 youth.
Finally, little research has examined possible differences in JI profiles and the validity of JI scores among gender and racial–ethnic groups. In the forensic risk-assessment and juvenile psychopathy literatures, there has been some controversy around the validity and appropriateness of such tools with females (Andrews et al., 2011; Van Voorhis, Wright, Salisbury, & Bauman, 2010) and ethnic minority youth (Rugge, 2006). In Canada our indigenous peoples, youth and adult, are overrepresented in criminal justice settings and some research has shown that they tend to score higher on risk assessment tools and to have higher rates of recidivism (Rugge, 2006). Male youth are also disproportionately represented in criminal justice settings (e.g., Statistics Canada, 2012) and forensic research as a result. As such, we examined broad group differences among male–female and Aboriginal–non-Aboriginal (predominantly White) youth in their JI profiles as well as the predictive accuracy of JI scores for recidivism outcomes. To our knowledge these comparative analyses, particularly with regard to the prediction of recidivism, have not been conducted. We anticipated that males and Aboriginal youth would each score higher on personality scales associated with more delinquent functioning (e.g., Asocial Index) than females and non-Aboriginal youth, respectively; however, we did not necessarily anticipate substantive differences in the predictive accuracy of JI scores for recidivism among gender and racial–ethnic groups.
Method
Participants
The sample consisted of 88 male and 50 female youths for a total of 138 participants. All participants had received forensic assessment and/or treatment services between 1996 and 2006 from a community-based mental health clinic in Saskatoon, Saskatchewan, Canada. Approximately 57.2% of participants were Aboriginal, 30.4% were non-Aboriginal (and primarily White), and 12.3% were of unknown ethnic descent. The mean age of the sample at the time of assessment was 16.3 years (range = 13-19, SD = 1.4). Youth were court adjudicated under the Canadian Youth Criminal Justice Act or the former Young Offenders Act. The majority of youth had an index (i.e., current) conviction for assault (50.8%), followed by property crimes (35.5%), weapons-related offenses (23.2%), robbery (22.4%), contact sex offenses (13.8%), threats (11.6%), and a very small number had been charged or convicted for murder or manslaughter (4.3%). Not uncommonly youth had multiple overlapping index offense categories. In terms of criminal history, 55.8% of the youths in this sample had one or more previous criminal convictions and 34.8% had at least one previous conviction for violence. In all, 92.8% of youth in the present sample had either an index or previous conviction for a violent (including sexual) offense. Approximately 51.4% of youth were living in the community at the time they received services, while 36.2% were in custody (open 6.5%, secure 26.1%, adult 3.6%). The residential status or sentencing outcome was unknown for 12.3% of youth at the time of data collection.
Data Collection
The present study is an archival investigation that involved extraction and analysis of JI, ability, and achievement test data from the youths’ court, treatment, and psychometric test files located at the community facility noted above, and is an extension of an ongoing program of research (Olver, Stockdale, & Wong, 2012; Stockdale, Olver, & Wong, 2010, 2014). Ethical approval to conduct the present research was obtained from several sources including a Saskatoon Youth Court Justice, the University of Saskatchewan Behavioural Research Ethics Board, an advisory committee within the Saskatoon Health Region, and the Province of Saskatchewan’s Ministry of Corrections Public Safety and Policing. The data collection procedures for specific measures incorporated in this study are explained in tandem with the description of each study measure below.
Study Measures
Jesness Inventory and the Jesness Inventory–Revised
The JI (Jesness, 1962) and the Jesness Inventory–Revised (Jesness, 2004), or JI scales, are self-report personality inventories intended for assessment and treatment planning purposes with youths involved in delinquent or criminal behaviors. The original JI was composed of 155 true–false items and was later updated to include 160 items (Jesness, 2004) using the same response format. Common to both measures are 11 basic personality scales: Social Maladjustment, Value Orientation, Immaturity, Autism, Alienation, Manifest Aggression, Withdrawal, Social Anxiety, Repression, Denial, and the Asocial Index. Of further note, the Asocial Index is a composite measure generated from weightings of selected personality scales and reflects the extent to which the youth engages in delinquent acts and contravenes general social norms. Both versions further include 9 subtype scales organized into a three tiered I-Level classification system described above, containing two (I-2), three (I-3), or four (I-4) subtypes. The levels, and the subtypes within each level, are organized in ascending order indicating increasingly advanced integration in perception and cognition. Youth are assigned an overall subtype within one of the three I-levels based on classification rules detailed in Jesness (2004). In some circumstances, youth can be assigned a primary and secondary subtype diagnosis and in rare instances, the youth’s I-Level profile may have no subtype diagnosis.
New to the JI-R are two diagnostic scales, Conduct Disorder (CD) and Oppositional Defiant Disorder (ODD), as well as two five-item experimental validity scales, Lie (L) and Random Responding (RR). In the present study, the vast majority of the sample (n = 108) completed the JI, while only 30 youths completed the JI-R, thus not making individual analyses of the two versions practicable owing to the small n with the revised version. All JI and JI-R protocols included in the present study were judged to be valid by the assessing clinician and utilized in the final assessment report.
Youth Level of Service/Case Management Inventory
The YLS/CMI (Hoge & Andrews, 2003) is a risk-need assessment tool designed to assess risk, identify treatment targets, and inform case management and community supervision among youthful offenders. Part I (Assessment of Risks and Needs) consists of 42 binary items, scored as present or absent (1-0). Part II (Summary of Risk/Need Factors) provides an overall summary of Part I, in which the items are summed to arrive at total scores for the eight criminogenic needs, which can be prioritized for treatment or risk management. Items are also summed to arrive at a total score which in turn is organized into four risk cutoffs of low (0-8), medium (9-22), high (23-34), and very high (35-42) risk. As with other variants of the family of LS measures, the YLS/CMI includes separate sections to identify strengths, additional presenting concerns of the youth and her or his family, and responsivity issues (covered in Parts III through VIII). For the purposes of the present study, Part I is examined in incremental predictive and convergent validity analyses as detailed below. Although the YLS/CMI 2.0 (Hoge & Andrews, 2010) has since been introduced and contains important developments (e.g., new norms from a large U.S. sample, new recommended cutoffs for different risk/need levels), the user manual states “the scoring of the Total Risk/Need Score and the eight subcomponents of Part I (Assessment of Risks and Needs) remains unchanged from the YLS/CMI” (Hoge & Andrews, 2010, p. 3).
In the present sample, the YLS/CMI was rated primarily from court and treatment files (n = 126) at the facility by trained research personnel described in Olver et al. (2012), or when available, actual test protocols rated in real time in the course of clinical service delivery were extracted from youth files (n = 41). The clinically rated protocols were rated by registered psychologists (equivalent to a licensed psychologist in the United States) experienced in risk assessment and trained on the YLS/CMI. Olver et al. (2012) found YLS/CMI total scores significantly predicted youth, adult, and total, violent, nonviolent, and general criminal recidivism (area under the curve [AUC] values ranged from .66 to .75). High interrater reliability for YLS/CMI total scores was also obtained on 25 randomly selected cases (ICC = .90). 1
Psychopathy Checklist: Youth Version
The PCL:YV (Forth et al., 2003) is a 20-item symptom construct rating scale designed to assess youth aged 12 to 18 years on several behavioral and personality characteristics associated with psychopathy. Each item is scored on a 3-point scale of 0 (absent), 1 (partially or possibly present), 2 (present), with possible scores ranging from 0 to 40. Higher scores reflect a greater number of psychopathic traits as well as increasing risk for general and violent recidivism (e.g., Edens, Campbell, & Weir, 2007; Forth et al., 2003; Olver et al., 2009). The PCL:YV can be subdivided into four domains: Interpersonal (e.g., superficiality, grandiosity, deceitfulness, manipulation), Affective (e.g., lack of remorse, callousness, shallow affect, failure to accept responsibility), Lifestyle (e.g., need for stimulation, parasitic, lacks goals, impulsive, irresponsible), and Antisocial (e.g., early behavior problems, poor anger controls, juvenile delinquency, release violations, criminal versatility).
In the present sample, the PCL:YV was rated primarily from court and treatment files (n = 133) at the facility by trained research personnel described in Stockdale, Olver, and Wong (2010) or when available, actual test protocols rated in real time in the course of clinical service delivery were extracted from youth files (n = 28). The clinically rated protocols were rated by registered psychologists experienced in risk assessment and trained on the PCL:YV. Stockdale et al. (2010) found PCL:YV total scores significantly predicted youth, adult, and total violent, nonviolent, and general reconviction (AUC values ranged from .61 to .79). Strong interrater reliability was also observed in the present sample on 25 randomly selected cases for PCL:YV total scores (ICC = .91) and tended to be higher for the Lifestyle and Antisocial facets (ICC = .89 and .84, respectively), with lower levels of agreement for the Interpersonal and Affective facets (ICC = .60 and .66, respectively).
Violence Risk Scale–Youth Version
The VRS-YV (Wong et al., 2004-2011) is a 23-item clinician-rated measure designed to assess adolescents’ risk for violent offending and to inform and facilitate violence reduction interventions. The tool is composed of 4 static/stable and 19 dynamic items. Each item is rated on a 4-point scale from 0 to 3 according to broad descriptions of the construct measured by the item. Higher ratings indicate stronger associations of the item with violence or problem behaviors thus increasing the youth’s risk for future violence. Static/stable and dynamic items can be tallied separately to produce static and dynamic domain scores. Scores on each item can be summed to produce a total score representing the individual’s current or pretreatment risk. In the present sample, the VRS-YV was rated from file information by the present study authors as outlined in Stockdale et al. (2014). In the present sample, Stockdale et al. (2014) found VRS-YV stable, dynamic, and total scores significantly predicted youth, adult, and total violent, nonviolent, and general reconviction in the present study sample (AUC values ranged from .66 to .77). High interrater reliability of VRS-YV total scores was also obtained for 23 randomly selected cases (ICC = .90).
Measures of Intellectual Ability
Intellectual ability was frequently assessed in the course of routine service delivery by the assessing clinician (a registered psychologist) using a variant of the Wechsler Scales including the Wechsler Abbreviated Scale of Intelligence (Wechsler, 1999), Wechsler Intelligence Scale for Children third (WISC; Wechsler, 1991) and fourth (Wechsler, 2003) editions, Wechsler Adult Intelligence Scale–Third Edition (Wechsler, 1997), or the Kaufman Brief Intelligence Test (Kaufman & Kaufman, 1990). The use of different variants reflects the emergence of newer versions of a given test and eventually abbreviated measures (e.g., WASI). Scores across the different measures were collapsed into a single verbal IQ (VIQ) as a measure of verbal problem solving ability, performance IQ (PIQ) as a measure of visual–spatial and nonverbal problem solving ability, and Full Scale IQ (FSIQ) as an overall index of cognitive ability. As the WISC-IV does not include VIQ or PIQ indexes, the Verbal Comprehension Index (VCI) and Perceptual Reasoning Index (PRI) were used in place of them, respectively. Standard scores based on a mean of 100 and standard deviation of 15 are employed.
Measures of Academic Achievement
Academic achievement was also frequently assessed in the course of service delivery by a registered psychologist using brief screening measures or more extensive measures including the Wechsler Individual Achievement Test (Wechsler, 1992), its second edition (Wechsler, 2001a), and its abbreviated version (Wechsler, 2001b), or the Wide Range Achievement Test-3 (WRAT3; Wilkinson, 1993), or WRAT4 (Wilkinson & Robertson, 2006). As with the measures of intellectual ability, newer versions of a given test were successively used when these became available and scores based on a mean of 100 and standard deviation of 15 are also employed. For analytic purposes, scores across the measures were collapsed to yield single composite measures of Reading, Math, and Spelling.
Recidivism and Other Offense Criteria
All convictions in the present study were violations of the Canadian Criminal Code verified by fingerprinting. Criminal recidivism data were obtained from two sources to obtain the most inclusive outcome data possible: (a) a provincial database maintained by Corrections Public Safety and Policing, which includes criminal sentencing information for young offenders in the province of Saskatchewan adjudicated through Youth Court, that is, offenses committed prior to the youth’s 18th birthday and (b) the nationwide Canadian Police Information Centre database, which includes complete information regarding youth and adult criminal charges, court adjudicated convictions, and sentencing information. The combined information from the two criminal record systems enabled us to obtain inclusive outcome data from official sources.
The index sentence refers to the youth’s most recent admission (i.e., court-ordered assessment or other psychological referral) to the community mental health facility following adjudication for an offense and encompasses all charges/convictions for which the youth is on remand, on an undertaking, serving a period of probation, or in custody (i.e., for index offenses). A violent offense was defined as any criminal conviction for an offense against the person with a high likelihood of physical or significant psychological harm (e.g., homicide, assaults, weapons offenses, threatening/fear inducing behaviors, arson, robbery, or sexual offenses). All other offenses were considered to be nonviolent (e.g., theft, drug offenses, and breaches). Recidivism was defined as any criminal conviction following the youth’s first release to the community from a custodial setting or following his/her assessment at the community facility for youth with community dispositions. Recidivism was binary coded (yes-no [1-0] recidivism) along with release and sentencing dates to perform survival analyses. In the present study, we examine violent recidivism (i.e., any criminal conviction for a new violent offense) and general recidivism (i.e., any criminal conviction for a new offense). All outcome data were collected between 2008 and 2009 by the present study authors following the extraction or rating of assessment measures.
Data Analytic Strategy
Data analysis proceeded in the following steps. First, we report normative descriptive data (means and standard deviations) of the JI scale components and conduct comparisons among ancestral and gender subgroups of youths using t test comparisons and Cohen’s d to interpret the magnitude of difference. Second, we examine the convergent validity of the JI through computing correlations between JI personality and I-level subtype scales with scale components of the YLS/CMI, PCL:YV, and VRS-YV. In addition, we examine group differences between the three I-levels as outlined above on measures of cognitive and academic functioning, in addition to the standardized forensic measures.
Third, we examine the predictive validity of the JI for violent and general recidivism using receiver operating characteristics (ROC) analyses. ROCs generate an AUC value from 0 to 1 representing the probability that a randomly selected recidivist will obtain a higher score on an instrument than a randomly selected non-recidivist (Rice & Harris, 1995). An AUC value of .50 represents chance level predictive accuracy, while values above .50 indicate that higher scores are associated with increased probability of recidivism and values below .50 indicate that higher scores are actually associated with a decreased probability of recidivism. We use the interpretive rubric of Rice and Harris (2005) in which the magnitude of AUC values were interpreted as follows: .56 to .63 (small/low), .64 to .70 (medium), and .71 and up (large/high). Given the variability in follow-up times for this sample, predictive validity was examined for fixed 1-, 3-, and 5-year follow-up periods in which youth were followed for equal temporal periods and any new offenses occurring within each of these time periods were coded accordingly. Recidivism data were available for 134 cases. ROC analyses for violent and general recidivism occurring at these three time periods were conducted on the overall sample. For space considerations, ROC analyses with respect to general recidivism only were conducted for the racial–ethnic (Aboriginal and non-Aboriginal) and gender (male and female) subgroups at the three follow-up time points. A third set of predictive validity analyses was conducted through Kaplan–Meier survival analysis to examine the violent and general recidivism rates over time of youth JI profiles classified into one of the three broad I-levels.
In the fourth and final set of analyses, Cox regression survival analysis was performed: (a) to examine the incremental validity of the JI Asocial Index for general and violent recidivism, controlling for either the PCL:YV, YLS/CMI, or VRS-YV and (b) to examine differences in the trajectories of recidivism among the three I-Levels, after controlling for risk, using indicator contrasts. Exponentiated regression coefficients (eB) were used to evaluate the unique relationships of the predictors to outcome. The eB coefficient is an odds ratio statistic representing the predicted change in hazard for each unit increase in the predictor variable. Coefficients above 1.0 indicate a positive relationship to the criterion (i.e., increases in the value of the predictor are associated with increases in recidivism; Tabachnick & Fidell, 2001). We use Cox regression survival analysis since it controls and adjusts for individual differences in follow-up time. For all youth with custodial sentences, their date of release from custody following their assessment was used to adjust for individual differences in follow-up time when assessing recidivism in subsequent Cox proportional hazards models. For youth without custodial sentences, and thus who had community dispositions only, their date of assessment was used instead. For these analyses, the follow-up time stopped at the time of the first recidivism event or the data collection date.
Results
Basic Descriptive Statistics and Group Comparisons on JI Scales
Basic descriptive statistics for the JI subscales are presented in Table 1 along with comparisons as a function of gender and racial–ethnic group. The only significant difference observed between male and female youth was on the Asocial Index, in which females scored higher by roughly one-half standard deviation. Aboriginal youth scored significantly higher (by approximately two thirds of a standard deviation) on the Asocial Index and Repression personality scales, and the CFC (Group Conformist) I-3 subtype, while non-Aboriginal youth scored significantly higher on the NX (Neurotic Introspective Anxious) I-4 subtype. There were no other significant group differences.
Means and Standard Deviations of Jesness Inventory Scores and Within Subgroup Comparisons as a Function of Gender and Ethnicity.

Note. CI = confidence interval. Aboriginal/non-Aboriginal subgroup comparisons are significant on Repression (p < .001), Asocial Index (p < .001), Group conformist (p = .003), and Neurotic Introspective Anxious (p = .001). Male/female comparisons on Asocial Index is significant at p = .007. Significant d values are presented in bold font. No other subgroup comparisons are significant.
Convergent Validity of the JI with Standardized Youth Psychological Measures
Tables 2 and 3 present the results of convergent validity analyses between the JI and three standardized forensic youth measures: the PCL:YV, VRS-YV, and YLS/CMI. As seen in Table 2, the Asocial Index was significantly positively correlated with all PCL:YV components except the Interpersonal facet, which did not significantly correlate with any JI scales. Otherwise, the PCL:YV Lifestyle facet demonstrated the largest number and highest magnitude of convergent validity correlations with the JI scales, including significant positive correlations with five out of the ten remaining personality scales (generally associated with acting out behaviors), moderate positive correlations with the lower I-2 and I-3 subtypes (AA, AP, CFC), and negative correlations with the I-4 subtypes (NA, NX, SE, CI). The Antisocial and Affective facets were each significantly correlated with CFC and (negatively) with the CFM, NX, and SE I-level subtype scales. The Antisocial facet was also positively correlated with the Social Maladjustment and Value Orientation scales while the Affective facet was not significantly correlated with any other JI personality scales. Finally, the VRS-YV Stable, Dynamic, and Total scores all had significant correlations with Social Maladjustment, the Asocial Index and negative correlations with NX, SE, and CI. Moreover, VRS-YV Dynamic and Total scores each had significant correlations with the Value Orientation and Alienation and positive correlations with AA and CFC I-level scales, while the Stable items were also significantly correlated with the Repression scale.
Convergent Validity Correlations Between the Jesness and the Psychopathy Checklist: Youth Version (PCL:YV) and the Violence Risk Scale–Youth Version (VRS-YV).
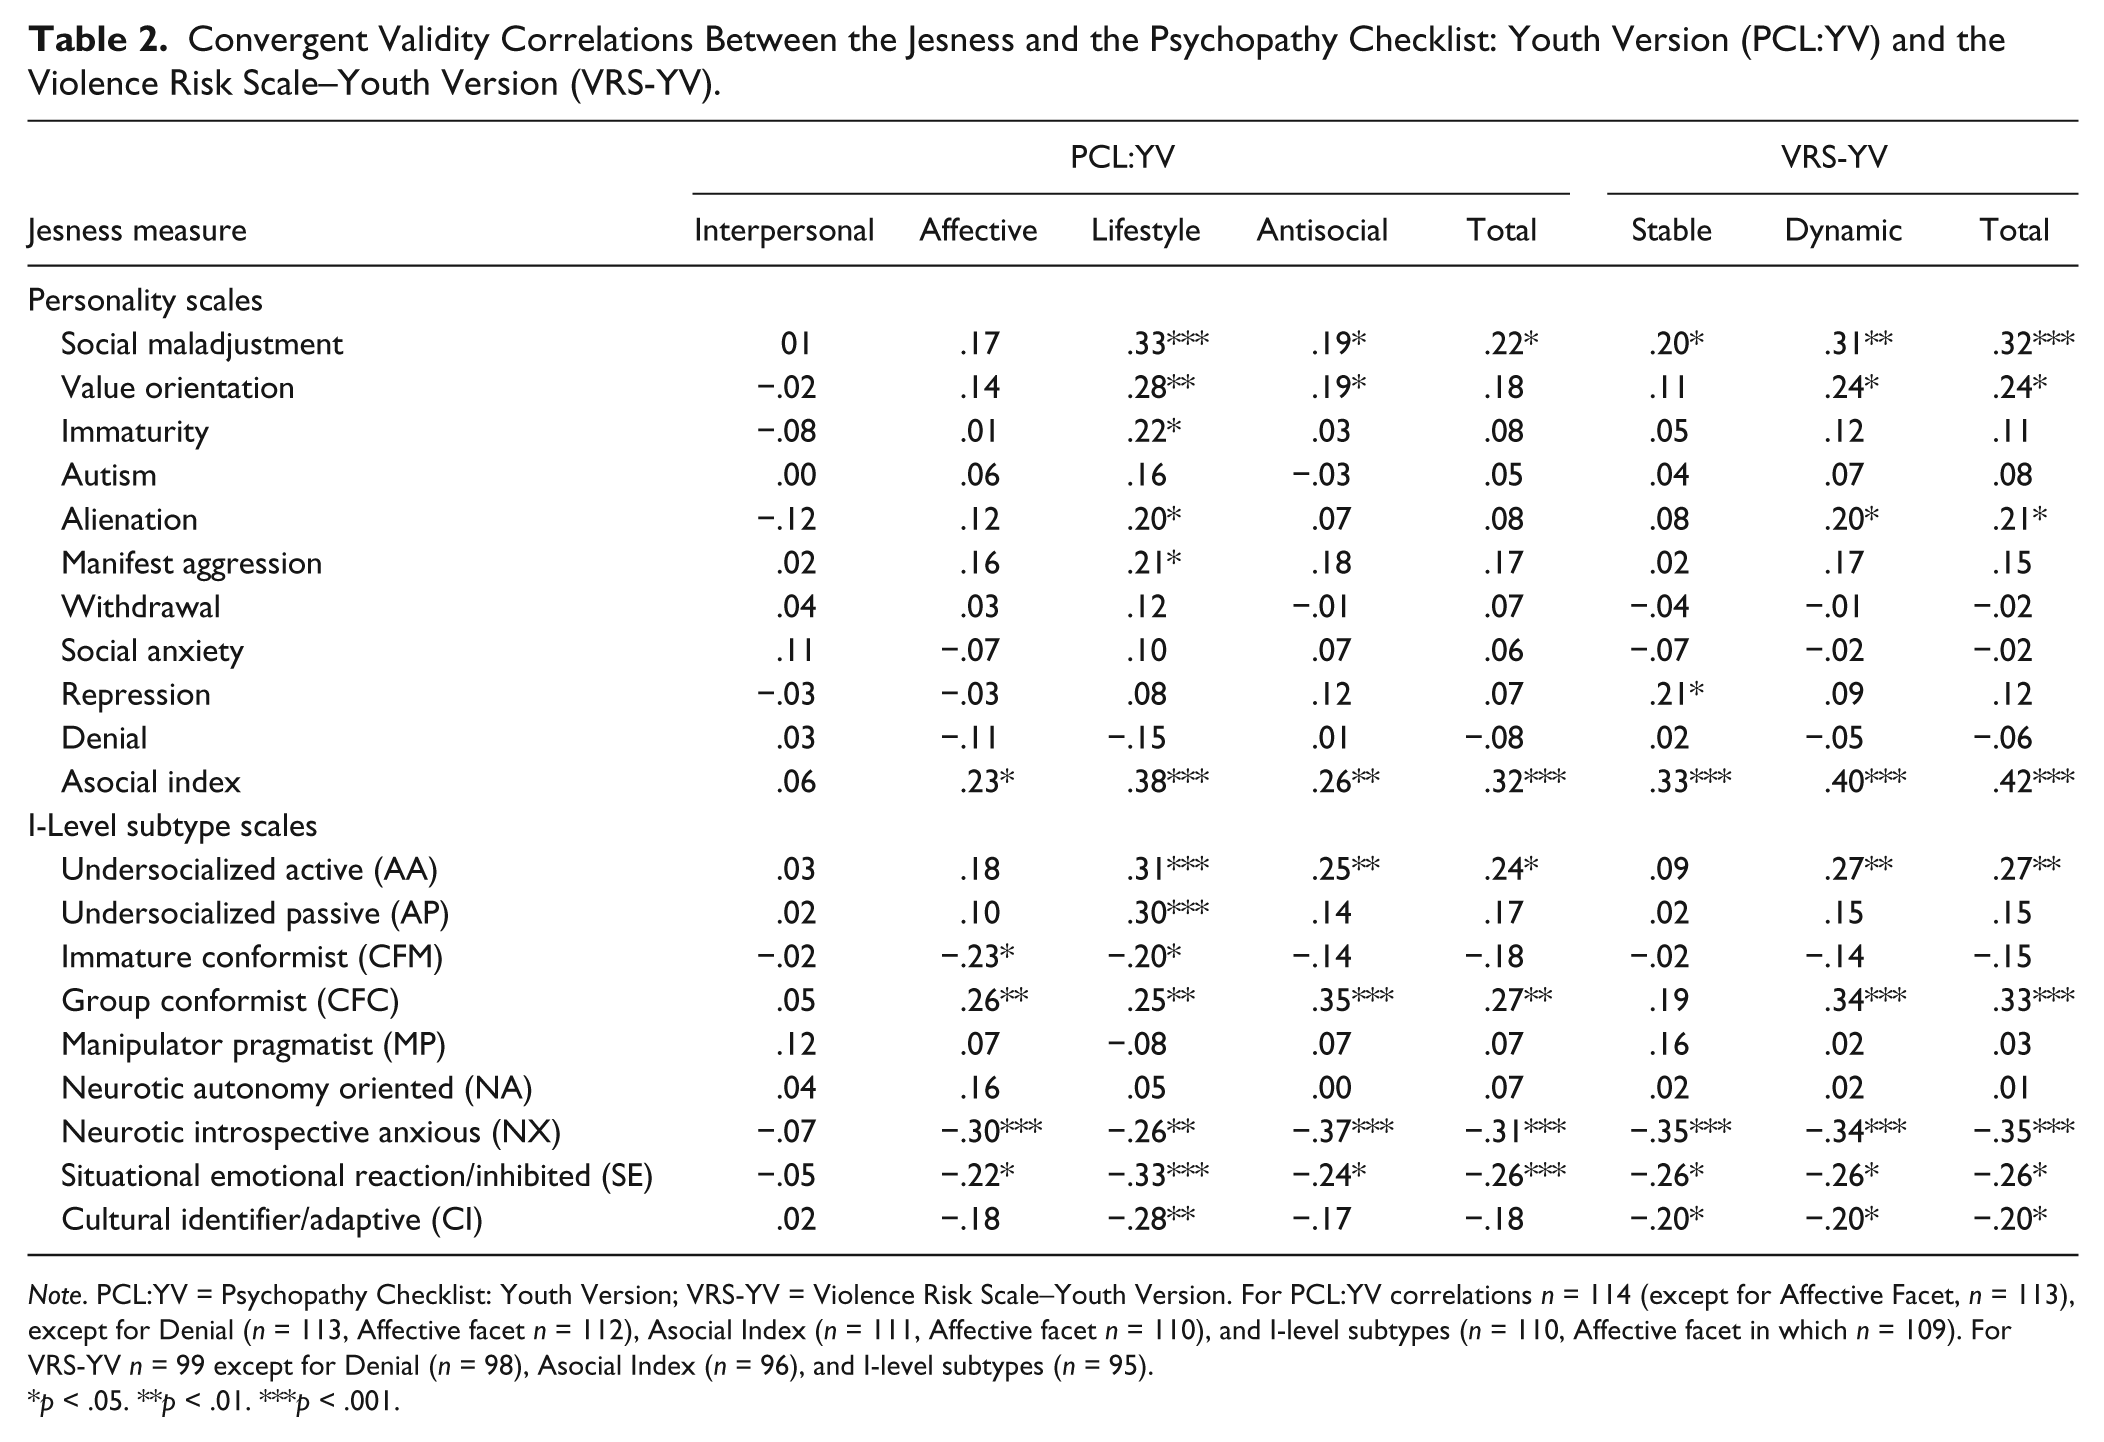
Note. PCL:YV = Psychopathy Checklist: Youth Version; VRS-YV = Violence Risk Scale–Youth Version. For PCL:YV correlations n = 114 (except for Affective Facet, n = 113), except for Denial (n = 113, Affective facet n = 112), Asocial Index (n = 111, Affective facet n = 110), and I-level subtypes (n = 110, Affective facet in which n = 109). For VRS-YV n = 99 except for Denial (n = 98), Asocial Index (n = 96), and I-level subtypes (n = 95).
p < .05. **p < .01. ***p < .001.
Convergent Validity Correlations Between the Jesness and the Youth Level of Service/Case Management Inventory (YLS/CMI).

Note. n = 115 except for Denial and Value Orientation (n = 114), Asocial Index (n = 112), and I-level subtypes (n = 111).
p < .05. **p < .01. ***p < .001.
Validity correlations with the YLS/CMI demonstrated the Employment/education and Alcohol/drugs need domains and the YLS/CMI total score were most consistently significantly correlated with the JI scales. Certain JI scales were also more likely to converge with criminogenic need domains. Specifically, the Asocial Index was significantly positively correlated with all eight YLS/CMI criminogenic need domains and the total score. Social Maladjustment was significantly positively correlated with six out of eight need domains, and this scale accounted for the only significant correlation with the Family/parenting and Attitudes/orientation domains among the JI personality scales. Immaturity was significantly positively correlated with four need domains and Value Orientation, three need domains. In terms of the I-Levels, as with the PCL:YV and VRS-YV convergent validity analyses, CFC had the largest number of significant validity correlations with the YLS/CMI need domains, including the total score, followed by AA and AP, which were each significantly correlated with Employment/education, Alcohol/drugs, and the total score. The NX and SE I-4 subtypes were significantly negatively correlated with most YLS/CMI need domains with the exception of Family/parenting and Personality/behavior.
Finally, Table 4 draws comparisons across the three I-level subtypes on the standardized forensic measures examined above as well as standardized measures of cognitive ability and academic achievement. Youth were assigned an I-level subtype and thus category (I-2, I-3, or I-4) based on the JI classification rules referenced above. Owing to shrinking n associated with arranging the scores into categorical variables, analyses were performed for the three broad I-level groups, rather the 9 individual subtype scales. In terms of cognitive ability, the lowest scores on verbal, nonverbal, and full scale IQ were observed for youths falling into I-2, followed by I-3, and the highest scores observed for youth falling into I-4. Significant positive linear relationships were observed for global and verbal measures of cognitive functioning. Tukey beta post hoc comparisons demonstrated that youth in I-4 had significantly higher verbal IQ scores than youth in both lower I-level groups, and significantly higher full scale IQ scores than youth in I-2. There were no significant differences across the groups in nonverbal cognitive ability. The same trends were observed for measures of reading, spelling, and math achievement; however, Tukey beta post hoc comparisons demonstrated the only significant pairwise difference to be on math achievement between I-4 and I-2 youth. Otherwise, broad linear relationships were significant between academic achievement and I-level group membership, with a trend of higher levels of achievement observed with each successive increase in I-level.
Jesness I-Level Subtype Comparisons on Intellectual, Achievement, and Forensic Assessment Measures.

Note. Tukey beta post hoc comparisons conducted to examine I-Level group differences on subtype variables. a = significantly different from I-2, b = significantly different from I-3. AA = Undersocialized Active; AP = Undersocialized Passive; CFM = Immature Conformist; CFC = Group-Oriented Conformist; MP = Manipulator Pragmatist; NA = Neurotic Autonomy Oriented; NX = Neurotic Introspective Anxious; SE = Situational Emotional Reaction/Inhibited; CI = Cultural Identifier/Adaptive.
PCL:YV = Psychopathy Checklist: Youth Version; YLS/CMI = Youth Level of Service/Case Management Inventory; VRS-YV = Violence Risk Scale–Youth Version.
p = .052. *p < .05. **p < .01. ***p < .001.
The results for the three standardized forensic measures parallel the bivariate correlations reported in Tables 4 and 5 computed between individual subscales of these measures and the individual JI scales, and are reported for comparative purposes. Broadly, I-2 youth tended to have the most serious scores on all measures, followed in order by I-3 and I-4 groups. Significant overall differences were observed for the total scores on the three measures, the PCL:YV Antisocial facet, and the YLS/CMI Employment/education and Alcohol/drug need domains. In short, I-2 youth tended to be higher risk for recidivism, have a greater number of antisocial behavioral concerns, and greater problems in the domains of education/employment and substance use linked to criminal behavior, compared with I-3 youth, who in turn, were more serious on these domains than I-4 youth.
Jesness Inventory Prediction of General and Violent Recidivism at 1-, 3-, and 5-Year Fixed Follow-Ups: Aggregate Sample.
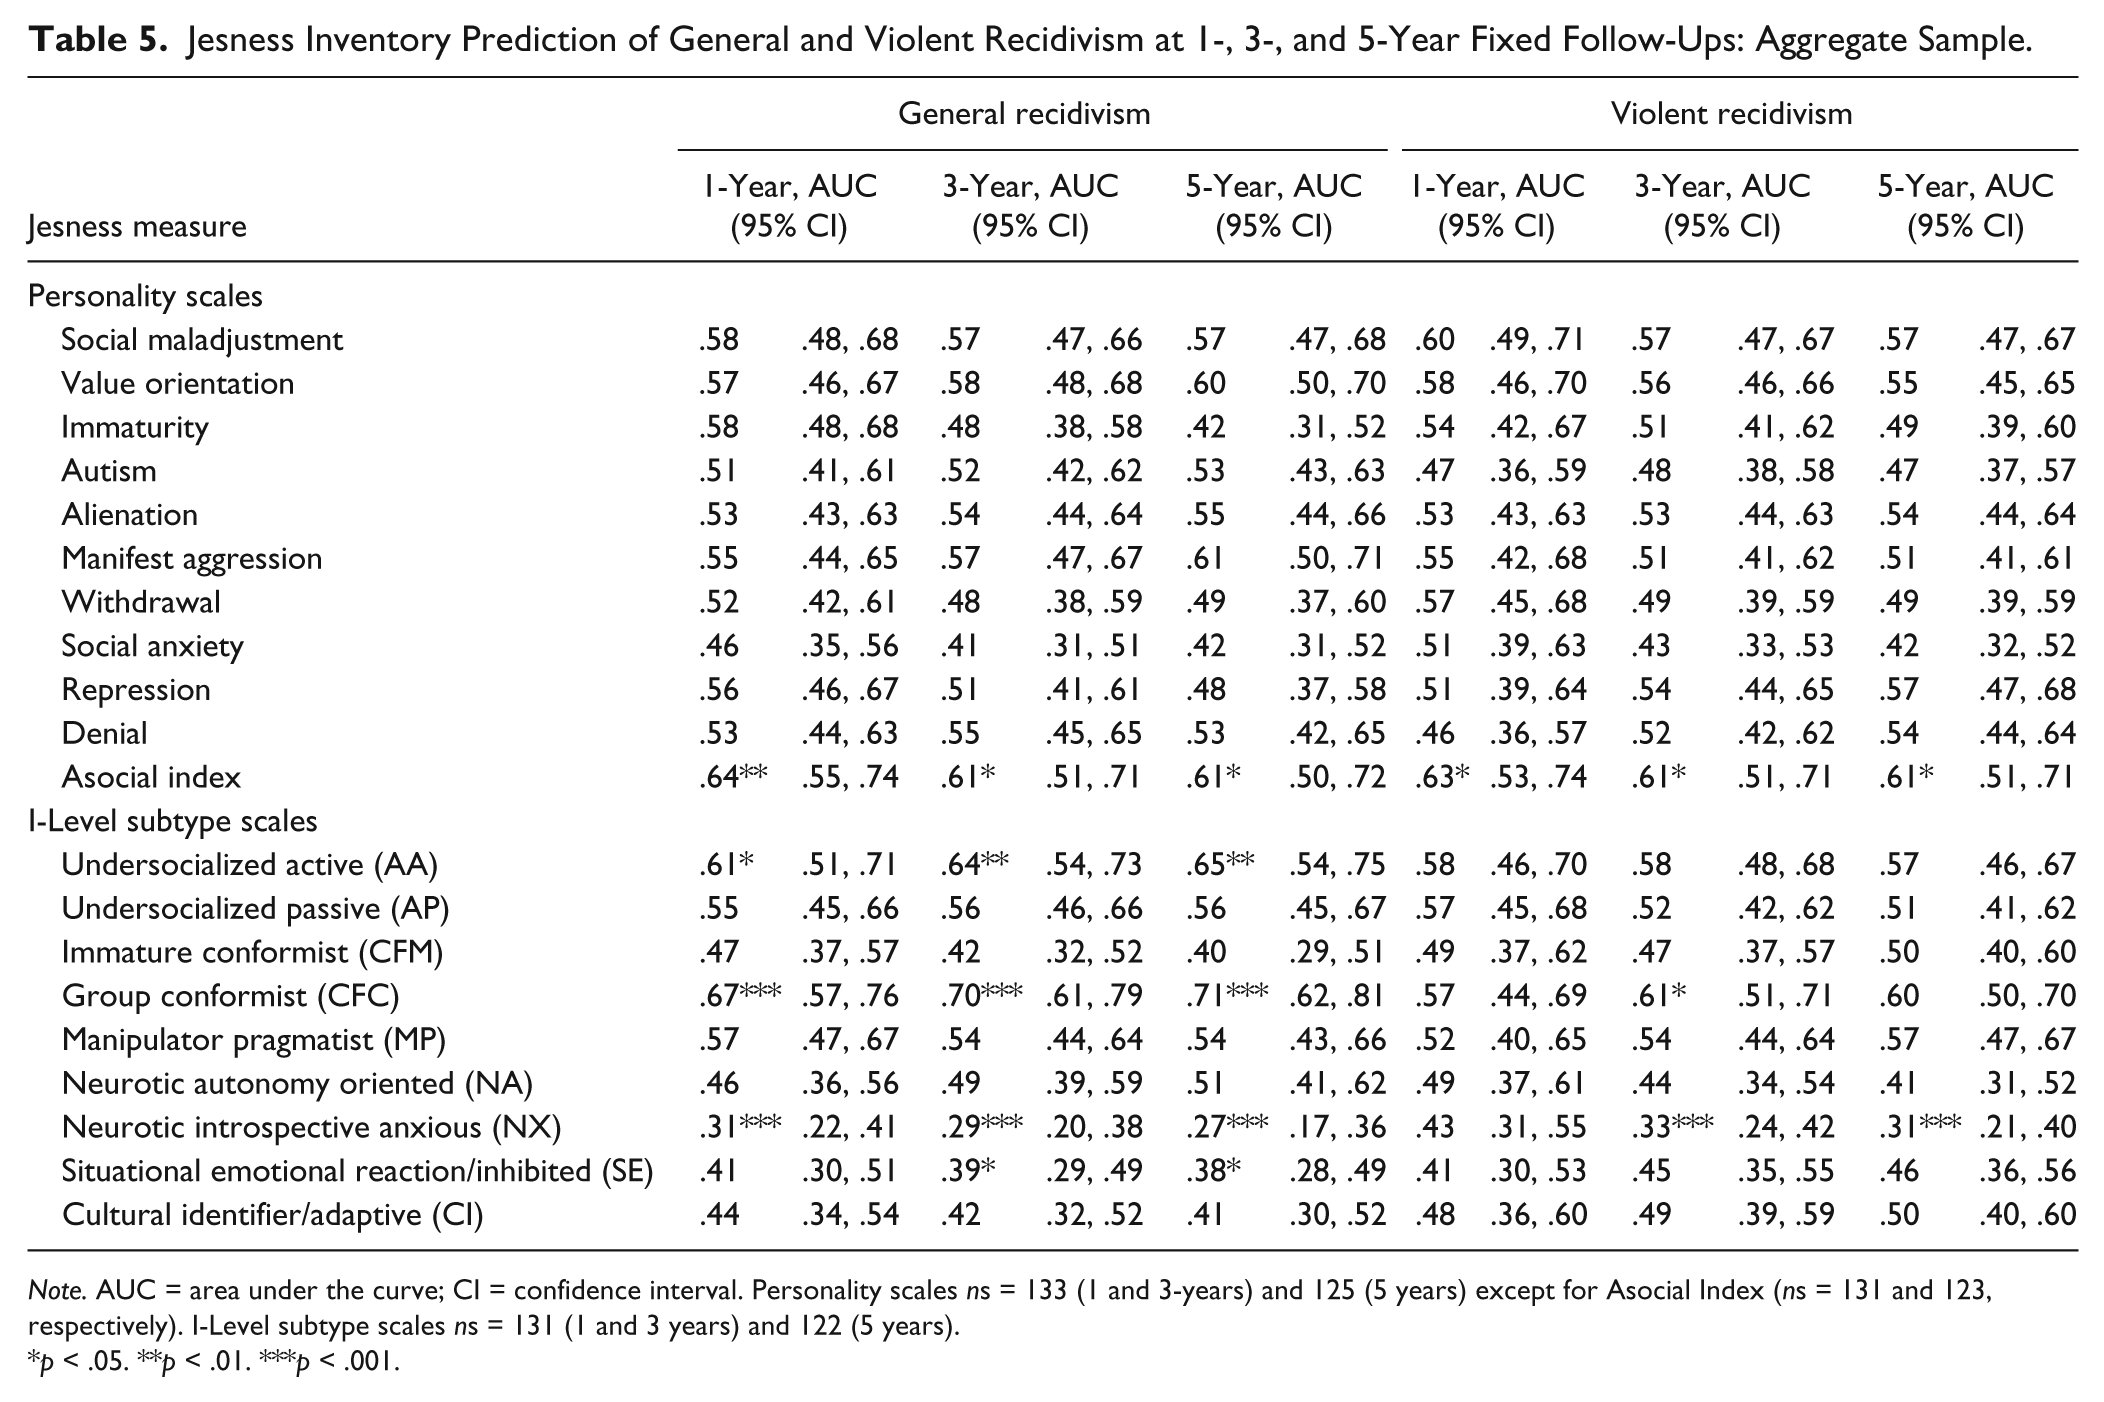
Note. AUC = area under the curve; CI = confidence interval. Personality scales ns = 133 (1 and 3-years) and 125 (5 years) except for Asocial Index (ns = 131 and 123, respectively). I-Level subtype scales ns = 131 (1 and 3 years) and 122 (5 years).
p < .05. **p < .01. ***p < .001.
Predictive Accuracy of the JI for Recidivism
The next set of analyses examined the univariate prediction of general and violent recidivism by the Jesness personality and I-level scales (Table 5). The youth were followed up a mean of 6.45 years (SD = 2.77) post assessment (when the youth received community dispositions) or post release (for youth in custody). Recidivism data at 1- and 3-year fixed follow-up periods was available for 134 youth while 5-year outcome data was available for 126 youth. During the follow-up period, 20.2% of youth were convicted for any new violent offense within 1 year, 39.6% within 3 years, and 44.5% within 5 years, while 41% of youth were convicted for any new offense within 1 year, 61.9% within 3 years, and 68.3% within 5 years.
The Asocial Index significantly predicted general and violent recidivism at 1-, 3-, and 5-year follow-ups. None of the other personality scales, however, significantly predicted any of these outcomes. The I-level subtypes, in turn, bore interesting relationships to outcome. Specifically, high scores on the AA and CFC scales were significantly associated with increased general recidivism (AUC = .61 to .71), while the CFC scale significantly predicted 3-year violence and trended toward significance in the prediction of 5-year violence. In contrast, the NX scale was significantly inversely associated with both recidivism outcomes and the SE scale was significantly inversely associated with general recidivism at 3 and 5 years. For instance, the SE 3-year general recidivism AUC of .39 would be interpreted to mean that there is a 39% chance that a randomly selected recidivist would have a higher score on the SE scale than a randomly selected non-recidivist, or conversely, a 61% chance that a randomly selected nonrecidivist would have a higher score.
The predictive validity analyses were subsequently disaggregated as a function of gender and racial–ethnic group (Table 6). Among male youth, the Asocial Index significantly predicted general recidivism at each time point while Social Maladjustment significantly predicted recidivism at 3 and 5 years, and Immaturity at 1 year. Among female youth, however, none of the basic personality scales of the JI predicted any recidivism outcomes. With respect to the I-level subtypes, high CFC scores significantly predicted almost all recidivism outcomes for both genders, while high NX scores were similarly associated with decreased recidivism. Among male youth specifically, AA significantly predicted increased recidivism across all three time points, while CFM and SE were associated with decreased recidivism at 3 and 5 years. Among female youth, NA was significantly associated with decreased recidivism at 3 years.
Jesness Inventory Prediction of General Recidivism (1-, 3-, and 5-Year Fixed Follow-Ups) as a Function of Gender.

Note. AUC = area under the curve; CI = confidence interval. Personality scales: male n = 83 and female n = 49 (1 and 3 years) and n = 79 and 45, respectively (5 years) except for Asocial Index (males; n = 82 and 78, respectively). I-Level subtype scales: male n = 83 and female n = 47 (1 and 3 years) and n = 79 and 43, respectively (5 years).
p < .05. **p < .01. ***p < .001.
Among the subsample of Aboriginal youth, Social Maladjustment predicted 1-year recidivism while Social Anxiety predicted decreased recidivism at 3 years and 5 years (see Table 7). Among non-Aboriginal youth, Manifest Aggression predicted 3-year and 5-year recidivism while Repression predicted decreased 5-year recidivism. The Asocial Index did not significantly predict any outcomes, although of note, the AUC magnitudes were frequently of comparable magnitudes to the aggregate analyses, raising the possibility of some Type II errors. Finally, with respect to the I-level subtypes, high scores on the CFC scales were significantly associated with increased recidivism for both racial–ethnic groups for all time points with the exception of 1-year recidivism among non-Aboriginal youth. The NX scale was inversely associated with recidivism for Aboriginal youth while CFM was inversely predictive of outcome among non-Aboriginal youth. In addition, the AA and NA subtypes each significantly predicted 3-year and 5-year recidivism for non-Aboriginal youth.
Jesness Inventory Prediction of General Recidivism (1-, 3-, and 5-Year Fixed Follow-Ups) as a Function of Race/Ethnicity.
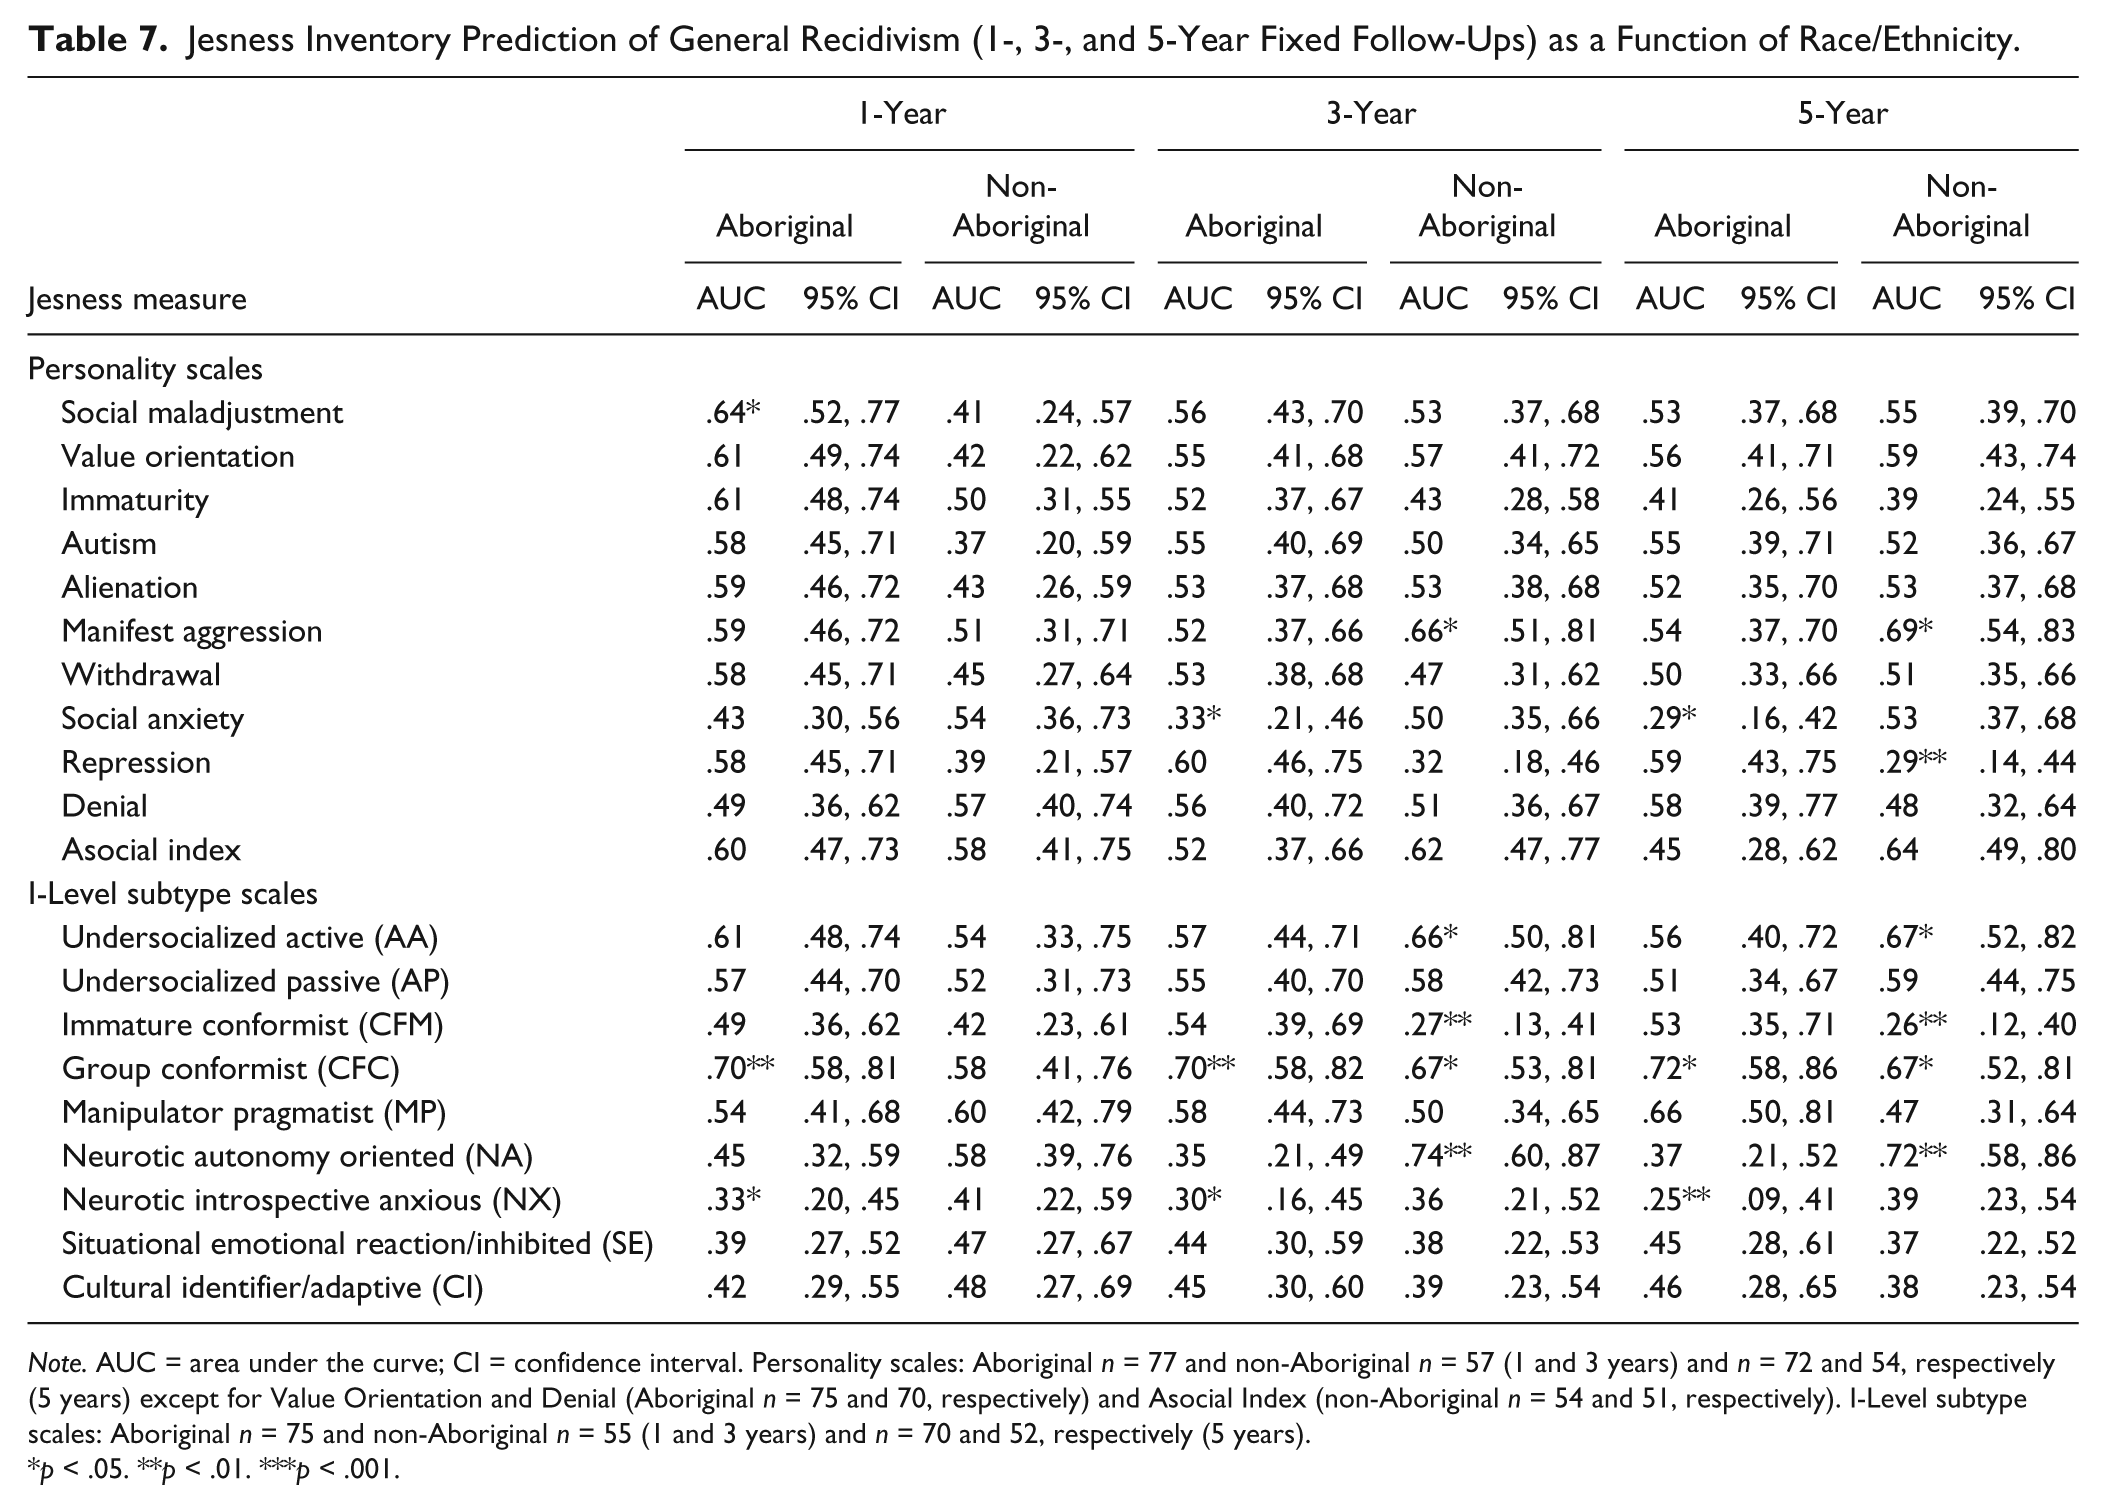
Note. AUC = area under the curve; CI = confidence interval. Personality scales: Aboriginal n = 77 and non-Aboriginal n = 57 (1 and 3 years) and n = 72 and 54, respectively (5 years) except for Value Orientation and Denial (Aboriginal n = 75 and 70, respectively) and Asocial Index (non-Aboriginal n = 54 and 51, respectively). I-Level subtype scales: Aboriginal n = 75 and non-Aboriginal n = 55 (1 and 3 years) and n = 70 and 52, respectively (5 years).
p < .05. **p < .01. ***p < .001.
Finally, Kaplan–Meier survival analyses were conducted to examine rates of violent failure and general recidivism as a function of JI I-level subtype (Figure 1). I-4 had significantly lower rates of violent recidivism than I-2 (χ2[1, N = 79] = 11.35, p = .001) and I-3 (χ2[1, N = 112] = 6.11, p = .013). Although I-2 had higher rates of violent failure than I-3, this difference did not attain significance (χ2[1, N = 73] = 1.25, p = .263). Similar results were obtained with respect to general recidivism. I-4 youth had lower rates of general recidivism than I-2 (χ2[1, N = 79] = 4.48, p = .034) and I-3 (χ2[1, N = 112] = 3.67, p = .055) youth. Again, there were no significant differences between I-2 and I-3 youth (χ2[1, N = 73] = 0.24, p = .623).

Survival analyses: Cumulative failure rates of violent and general recidivism as a function of JI subtype (I-2, I-3, I-4).
Incremental Validity of the JI-R for General and Violent Recidivism
The final set of analyses examined the incremental validity of the JI Asocial Index and the JI I-level subtypes for general and violent recidivism controlling for the three standardized clinician-rated forensic measures. We examine the Asocial Index and the broad I-levels since these were consistent JI predictors of outcome in the sample and demonstrated patterns of convergence with the three clinical forensic measures. In the first set of analyses, the aggregate score of one of the clinical forensic measures was entered into the regression equation in the first step, followed by the Asocial Index in the second step to ascertain if it added incrementally to the prediction of violent or general recidivism over time (regression models 1-3). As seen in Table 8, PCL:YV, YLS/CMI, and VRS-YV total scores each significantly predicted general and violent recidivism with or without controlling for the Asocial Index; however, the Asocial Index did not significantly add to the prediction of either outcome.
Cox Regression Incremental Validity Analyses: Jesness Asocial Index and I-Level Subtype Prediction of General and Violent Recidivism Controlling for Forensic Youth Measures.

Note. Significant p values in bold font. PCL:YV = Psychopathy Checklist: Youth Version; YLS/CMI = Youth Level of Service/Case Management Inventory; VRS-YV = Violence Risk Scale–Youth Version.
In the second set of analyses, group differences among the three I-levels were examined through indicator contrasts, controlling for each of the standardized clinical forensic measures (Models 4-6). As with the previous analyses the PCL:YV, YLS/CMI, and VRS-YV total scores each significantly predicted general and violent recidivism in both steps. In turn, I-3 youth had significantly higher rates of general and violent recidivism than I-4 youth (the reference group), controlling for each of the standardized forensic measures; however, for all but one analysis, any differences between I-4 and I-2 youth decreased to nonsignificance after controlling for each of the three measures. The results indicate that individual differences in risk level accounted for group differences in rates of recidivism between the I-2 and I-4 youth; however, other factors in addition to criminogenic risk accounted for differences in rates of recidivism between I-3 and I-4 youth given that the differences remained after controlling for risk.
Discussion
As a long established forensic self-report measure, and one developed particularly for juvenile offender populations, the Jesness Inventory (JI and JI-R) is unique in its purpose and theoretical background. With the rise in the development and popularity of standardized forensic clinical rating scales in forensic juvenile evaluations, a natural question seems to be one of where the JI continues to fit in? The present study aimed to address this question through an examination of the convergent and predictive validity of JI scores with respect to three forensic clinical rating scales in a sample of juvenile offenders, with an eye toward where the JI may be situated within contemporary juvenile forensic assessment and intervention.
Forensic and Risk Relevance of the JI: Convergent and Predictive Findings
The JI’s Social Maladjustment, Value Orientation, and Asocial Index demonstrated the strongest patterns of convergence with the three forensic clinical measures, indicating these three JI scales to also have the greatest risk relevance. This has some consistency with Hocker’s (2005) findings of these JI scales showing some positive associations with PCL:YV scores at the item level, particularly those of the Lifestyle and Antisocial factors. The results make sense conceptually given that Social Maladjustment and Value Orientation are essentially attitudinal scales; the former is intended to reflect attitudes indicative of disturbed socialization (i.e., antisociality), while the latter “reflects the tendency to share attitudes characteristic of individuals of low socioeconomic status” (Jesness, 2004, p. 14). Moreover, the Asocial Index is a composite index developed through discriminant function analysis of the 10 personality scales that discriminated delinquent from nondelinquent youth. It may be viewed as a proxy of risk, and it is perhaps for this reason that the Asocial Index was the only personality scale that predicted general and violent recidivism, and did so at each follow-up in the sample as a whole (AUC = .61 to .63), consistent with findings elsewhere (Benda et al., 2001, 2002; Dembo et al., 1987). We suspect the Asocial Index did not incrementally predict recidivism over and above any of the three forensic clinical scales given that it was not developed as a risk assessment scale per se; the clinical rating scales, in contrast, were intended to either directly appraise risk for such outcomes or to assess behavioral and personality correlates highly linked to them. Although such findings demonstrate the Asocial Index has little unique risk variance beyond that of standardized forensic clinician rated tools, we do not believe the Asocial Index must trump the predictive efficacy of such measures for the JI to demonstrate its value in forensic assessment which we elaborate on in the next section.
Of the I-level subtypes, AA (I-2) and CFC (I-3) had the most consistent pattern of convergence, and hence, risk relevance with the three forensic clinical measures, while three of the I-4 subtypes had inverse relations. Moreover, dimensional AA and CFC scores predicted increased recidivism, while NX and SE predicted decreased recidivism. This stands in contrast with Listwan et al. (2007) who found that adult offenders with “neurotic” profiles had higher rates of recidivism. That finding, however, is seemingly contradicted by Van Voorhis et al. (2013) who found that men with such a profile who received treatment were more likely to recidivate. Given that I-4 individuals are theorized to have higher psychological functioning, the Listwan et al. (2007) finding is counterintuitive, while Van Voorhis et al. (2013) may reflect the potential iatrogenic consequences of overtreating low risk individuals as per the risk principal (see also Lovins, Lowenkamp, & Latessa, 2009). That these were adult male samples, however, hinders the comparison made with the present study’s findings.
In the present study, I-4 youth had significantly lower rates of general and violent recidivism than I-2 and I-3 youth, while I-2 youth had the highest rates of both recidivism outcomes. I-2 youth also tended to have lower levels of cognitive and academic ability, particularly verbal ability, although they were comparatively weak on academic domains as would be reasonably anticipated by I-level theory. The results of Cox regression survival analyses demonstrated that controlling for baseline risk essentially, that differences in outcome between I-3 and I-4 youth remained, and to a lesser degree, the differences between I-2 and I-4 youth also did. The results demonstrate that differences in risk level do not account completely for observed differences in recidivism over time among the I-levels; rather, there are likely RNR (or other) factors that may contribute to such observed differences, which we turn to next.
Situating the Clinical Use of the JI Within a Risk-Need-Responsivity Framework
The pattern of JI convergent and predictive findings is consistent with the authors’ clinical experience and point to several risk, need, and responsivity (RNR) implications in forensic assessment and intervention. From a risk principle standpoint, I-2 and I-3 youth (particularly AA and CFC in our sample) are likely to be higher risk, have a higher probability of recidivism, and likely warrant a higher dosage of intervention and supervision. From the perspective of the need principle, such youths present with a greater number of criminogenic needs to be prioritized for services. Finally, in terms of responsivity, there are implications to adapt service delivery to better engage I-2 and I-3 youths. For instance, AA youth are likely to be impulsive, have low frustration tolerance, poor problem-solving skills, and respond aggressively in response to provocation or when their goals are thwarted; all of which are consistent with academic delays and lower levels of cognitive functioning. Services would need to be adapted to the youth’s learning style and cognitive capabilities and service providers emphasizing a patient, tolerant, flexible stance (with good de-escalation skills) may find some benefit. CFC youth, in contrast, would be more interpersonally mature but gravitate toward the power structure of the peer group, doing what is necessary to fit in and to rise within its ranks. For persistent or serious young offenders, this may be a group of negative peer influences, or worse yet, a group of gang members. Arguably, similar considerations with I-2 youth still apply, but the findings would suggest that service providers could engage I-3 youth on a more advanced cognitive and interpersonal level, displaying the correctional service provider characteristics (e.g., firm but fair, warm, empathic, respectful) demonstrated to engage offender clientele (Andrews, Bonta, & Hoge, 1990).
The youth falling within I-4, particularly those with the highest levels of integration, had the lowest rates of violent and general recidivism, even after controlling for criminogenic risk. These youth were also found to have fewer criminogenic needs linked to crime, including better attitudes toward school and authority, internalized standards, and stronger verbal cognitive and academic ability than youth in I-2 and I-3. As such, there may be something inherent to I-levels beyond individual differences in risk that contribute to the prediction of outcome. For instance, I-4 is associated with a higher level of interpersonal maturity, emotional control, higher levels of anxiety, and cognitively complex view of the world, compared with the lower I-levels. From an RNR standpoint, this would be linked to different strategies to engage the youth, different anticipated responsiveness by the youth to intervention, and possibly different intervention strategies. For instance, I-4 youth may be able to benefit from verbal and cognitively based interventions and be easier to therapeutically engage. In principle this should also translate into greater cooperation with legal sanctions and treatment recommendations.
Considerations With Respect to Gender and Ethnicity
There are important RNR implications for gender and culture/ethnicity including the relevancy of assessment constructs and measures with diverse populations. In the present sample, the JI seemed to perform better in prediction (particularly the Asocial Index) among males than females, while there seemed to be few differences between Aboriginal and non-Aboriginal youth, at least in terms of the number of significant prediction effect sizes. The exception to this seemed to be that CFC (I-3) predicted increased recidivism across genders and racial–ethnic groups, while NX (I-4) similarly predicted decreased recidivism. Conclusions from these analyses should be made cautiously, particularly regarding the psychometric properties of a given tool and the appropriateness of its use with specific subgroups, given the smaller cell sizes (in contrast with the aggregate analyses) which decrease the generalizability and power of findings. Tentatively, the results would seem to buttress support for the I-level classification scheme across diverse groups, with concordant RNR implications specific to those groups in addition to those outlined above. Specifically, the JI does not seem to be any less applicable to female or Aboriginal youth, at least based on a single sample. Given the lack of JI research on specific gender and racial–ethnic subgroups, further research is almost certainly warranted to replicate and extend the present findings.
Strengths, Limitations, and Future Directions
There are some important strengths and limitations with implications for future research. Perhaps the most significant potential limitation is the limited sample size which likely reduced statistical power for subgroup analyses owing to shrinking cell sizes, thus contributing to some possible Type II errors. This is partly offset, however, by the robustness of some effects and the inclusive nature of the recidivism data obtained. A second potential limitation though is the reliance on official criminal records to measure and capture recidivism. While the use of multiple data sources helps increase the representativeness of outcome information, invariably not all youth are apprehended for their crimes. Thus, official records represent a conservative estimate of recidivism and owing to plea bargaining or a lack of evidence, the official conviction may not necessarily represent the actual crime committed. Third, we also cannot rule out the possibility of criterion contamination given that the JI measures were administered during routine clinical practice; in each instance, the JI was administered for a specific reason and the assessments findings may have affected the clinical treatment and/or management of these youth. As a consequence, recidivism data may not be completely independent of the JI results. A fourth potential shortcoming is the convenience nature of the sample, given that completed JI protocols were extracted from youth files as available, and it is possible that the sampling of protocols is not representative of all JIs completed by youth referred to the agency. Finally, given that a disproportionately small percentage of the sample had JI-Rs, this precluded analysis of scales that are new to the revision (CD and ODD) or a comparative analysis with the original iteration of the tool.
An important strength of this study is its prospective nature, given that the JI was administered in the course of routine service delivery (e.g., court-ordered evaluations), with criterion measures obtained after the fact, and convergent forensic clinical measures rated independently. These design features would seem to lend credibility to the findings, specifically through reducing threats to validity such as criterion contamination; however, given that the JI assessments were used as one piece of information to inform sentencing and service delivery, we acknowledge the possibility that this could affect the outcome variable, and thus the recidivism criteria may not be completely free of contamination. A further strength we believe is the nature of the sample itself, which was comprised predominantly of violent youth who had committed serious offenses. These are the types of cases that may be prioritized for more comprehensive assessments for which one may choose to use additional assessment measures and thus for whom the present study findings may have particular relevance.
The findings also suggest several directions for future research. One avenue would be continued lines of inquiry comparing JI profiles of different juvenile offender groups (e.g., sexual and nonsexually violent offenders, property offenders), the prediction of outcome, and how this may complement existing measures in case formulation and service delivery. Moreover, there is a continued need to examine the psychometric properties of the JI scales as a function of potential moderators such as gender, race/ethnicity, and culture. While support exists for the predictive accuracy of standardized clinical forensic rating scales (such as those reviewed in the present study) among diverse juvenile offender samples (e.g., Olver et al., 2009), this seems less clear for the JI in the present study sample. Finally, we believe it would be of interest and practical value to examine the potential role and utility of the JI with respect to less studied but equally important aspects of standardized assessment. For instance, how do the JI in general and the I-levels in particular, relate to treatment adherence, therapeutic change, and specific responsivity issues? Future research addressing practical and psychometric considerations such as these may inform further uses and application of the JI in juvenile offender assessments. More broadly, the examination of additional self-report measures of personality and emotional functioning in youth and their integration with standardized risk assessment measures could inform case conceptualization and clinical practice with justice involved youth.
In conclusion, the results suggest the JI to be a potentially useful addition to structured risk assessment tools in forensic evaluations. In our view, the JI can inform decision making and case formulation within the context of a comprehensive risk assessment that includes multiple assessment measures and the evaluation of multiple domains of functioning. In particular, the I-levels seem to embody a combination of risk, need, and responsivity characteristics that could inform case formulation and service delivery, particularly when paired with an established risk/need assessment tool.
Footnotes
Acknowledgements
We thank Garry Perry, Mary Lynn Wiebe, and members of the Young Offender Team, Saskatoon Health Region, for their support and assistance in implementing the present project. We also thank Dr. Brian Rector and Ron Bailey of Corrections Public Safety and Policing, Government of Saskatchewan, and the Canadian Police Information Centre, RCMP Headquarters, Ottawa, Ontario, for assistance in obtaining outcome data.
Authors’ Note
The views, opinions, and assumptions expressed in this article are those of the authors and do not necessarily reflect the views or official positions of the Saskatoon Police Service, the Saskatoon Board of Police Commissioners, the City of Saskatoon, the Saskatoon Health Region, or the University of Saskatchewan.
Declaration of Conflicting Interests
The author(s) declared no potential conflicts of interest with respect to the research, authorship, and/or publication of this article.
Funding
The author(s) received no financial support for the research, authorship, and/or publication of this article.