
Abstract
The current study examines a bifactor model for the Youth Psychopathic Traits Inventory (YPI) in a Dutch community sample of adolescents (N = 2,874). The primary goal was to examine the latent structure of the YPI with a bifactor modeling approach. Furthermore, the study examines the dimensionality and measurement invariance of the YPI. Results show that a bifactor model at subscale level fits the YPI best. The general psychopathy factor influences the 10 subscales of the YPI strongly, indicating that the YPI seems to be rather unidimensional than multidimensional. Nevertheless, the dimensions still explain nearly one third of the variance found. Findings imply that the bifactor model of the YPI should be used when examining relations with outcome variables, with a focus on the total score of the YPI, while factor scores should be reported with caution. Furthermore, the bifactor model appears invariant for gender, age, and ethnic background.
Keywords
Psychopathy is a personality disorder characterized by a particular constellation of interpersonal (e.g., superficial charm, manipulation, grandiosity, and lying), affective (e.g., lack of remorse or shame, shallow emotions, and callousness), and behavioral traits (e.g., impulsivity, need for excitement, and irresponsibility; Hare, 2003). Psychopathy in adults has been found related to antisocial behavior and criminal behavior (e.g., Frick & White, 2008; Patrick, 2010; Walters, 2003). Psychopathic traits are measurable in preschool, childhood, and adolescence (Colins et al., 2014; Farrington, 2005; Kimonis et al., 2015; Lynam et al., 2009). In preschool, associations between psychopathic traits and conduct problems (Colins et al., 2014; Kimonis et al., 2015) and in the transition from middle childhood to adolescence, moderate associations with delinquency and (violent) recidivism have been found (Asscher et al., 2011). Therefore, psychopathy is preferably detected early in life to decrease or avoid its negative consequences (Asscher et al., 2011; Frick & White, 2008).
The Youth Psychopathic Traits Inventory (YPI; Andershed, Kerr, Stattin, & Levander, 2002) is a self-report questionnaire designed to assess community samples of adolescents for psychopathic personality traits. The questionnaire consists of 10 subscales, each with five items, focusing on the core traits of psychopathy in a general population. The YPI measures a grandiose/manipulative factor (or interpersonal dimension), composed of the subscales dishonest charm, grandiosity, lying, and manipulation, a callous/unemotional factor (or affective dimension), composed of the subscales remorselessness, unemotionality, and callousness, and an impulsive/irresponsible factor (or behavioral or lifestyle dimension), composed of the subscales thrill seeking, impulsiveness, and irresponsibility. To minimize social desirable answering, most items of the YPI are worded in such a way that respondents do not necessarily see the psychopathic traits as deficits, but rather as neutral or positive characteristics (Andershed et al., 2002). Some traits are measured indirectly, for instance, “What scares others usually doesn’t scare me.” Compared with other measures of psychopathic traits in youth, such as the Psychopathy Checklist: Youth Version (Forth, Kosson, & Hare, 2003), which is an interview requiring time-consuming administration and scoring, the YPI as a self-report is cost- and time-effective, and easy to use in the general population (Andershed et al., 2002).
The total score and dimension scores of the YPI moderately correlate with related factors of, for instance, the Psychopathy Checklist: Youth Version (i.e., r ranging from .20 to .51; Andershed, Hodgins, & Tengström, 2007; Cauffman, Kimonis, Dmitrieva, & Monahan, 2009; Skeem & Cauffman, 2003), indicating good convergent validity. The YPI has been shown to have acceptable test–retest reliability (Campbell, Douchette, & French, 2009; Skeem & Cauffman, 2003), to predict institutional disciplinary infractions (Dolan & Rennie, 2006a; Skeem & Cauffman, 2003), to be positively related to aggression, delinquency, and impulsivity (Dolan & Rennie, 2007) and to be negatively related to anxiety (Skeem & Cauffman, 2003) and hence fits recent descriptions of psychopathy. In short, the YPI shows good construct validity.
Studies regarding the internal consistency of the YPI based on Cronbach’s alpha were systematically reviewed by Pihet, Suter, Meylan, and Schmid (2014). They found that on average, based on 11 studies, the total score and dimension scores and most of the subscales were internally consistent (mean α = .67-.87), while the internal consistency of the subscale Callousness was found to be low across studies (mean α = .54), and low to acceptable for the subscales Unemotionality, Remorselessness, and Irresponsibility (α = .60, α = .61, and α = .61, respectively).
Factor Structures
The factor structure of adult psychopathy has been exhaustively studied. Initially, a two-factor structure was distinguished composed of an affective/interpersonal dimension and a behavioral dimension (Harpur, Hakstian, & Hare, 1988). However, Cooke and Michie (2001) questioned the two-factor model and proposed a three-factor model consisting of an affective, an interpersonal, and a behavioral dimension. A four-factor model has also been proposed in which the behavioral dimension falls apart in two factors: lifestyle and antisocial (Neumann & Hare, 2008). The three different factor models have in common that they all assume that the factors represent correlated dimensions of a higher order psychopathy construct (Patrick, Hicks, Nichol, & Krueger, 2007). Only recently, an alternative structural model for psychopathy has been proposed, a bifactor model, in which the general factor does not relate to the dimensions but accounts for the overlap between all items, and items with similar content are additionally related to separate group factors (which for psychopathy represent the two, three, or four dimensions; Patrick et al., 2007; Reise, 2012). Thus, the items simultaneously load on a broad general construct and on one or more specific constructs. The general factor represents the conceptually broad construct which the questionnaire is intended to measure, that is, psychopathy, while group factors represent more conceptually confined constructs (i.e., interpersonal, affective, and lifestyle dimension; Reise, 2012). A characteristic of a bifactor model is that the group factors and general factors are uncorrelated, or orthogonal, while in a higher order factor model, the group factors are incorporated in the general factor (Chen, West, & Sousa, 2006). With a bifactor model, the general factor remains at the same level as the group factors, having a direct relation with the observed variables (Gustafsson & Balke, 1993). This way, the unique predictive validity of the group factors can be distinguished from the predictive validity of the general factor, and the strength of the relation between group factors and observed variables can be examined (Chen, Hayes, Carver, Laurenceau, & Zhang, 2012). This facilitates the examination of measurement invariance across different groups and of latent mean differences for both the general and group factors (Chen et al., 2006). Furthermore, the bifactor model provides the opportunity to test whether the group factors predict external outcomes, over and above the general factor.
Several studies using the Psychopathy Checklist–Revised found a bifactor model to be superior compared with a higher order factor model (Flores-Mendoza, Alvarenga, Herroro, & Abad, 2008; Patrick et al., 2007). Similar findings were reported for the Psychopathy Checklist: Screening Version (Boduszek, Dhingra, Hyland, & Debowska, 2015) and the Hare Self-Report Psychopathy Scale (Debowska, Boduszek, Kola, & Hyland, 2014). Furthermore, the bifactor model has been tested with the Inventory of Callous and Unemotional Traits (Essau, Sasagawa, & Frick, 2006; Frick, 2004; Roose, Bijttebier, Decoene, Claes, & Frick, 2010), with a general callous–unemotional factor and three distinct factors depicting uncaring, callousness, and unemotional items. The bifactor model for psychopathy suggests that even though there is a single construct measured (i.e., a general psychopathy factor), the items or subscales observed might also be grouped into distinctive underlying constructs with distinct relations with external outcomes and distinct etiologic processes (Flores-Mendoza et al., 2008; Patrick et al., 2007). For example, Patrick (1994) found that a deficit in fear response was related to the interpersonal/affective factor, but not to the behavioral factor, using a two-factor model of the Psychopathy Checklist–Revised.
Pihet et al. (2014) recently showed that for the YPI, a bifactor model is superior in representing the data over a higher order model, when the 10 subscale scores of the YPI are used as the observed variables (i.e., the subscale level, see Figure 1). Pihet et al. (2014) used data from a sample of 395 adolescents from the general population and 201 institutionalized adolescents and examined the factorial validity of the three dimensions and 10 subscales of the YPI. They compared six models with confirmatory factor analysis (CFA) using the 50 items of the YPI and three models using the 10 subscale scores as observed variables (i.e., subscale level). At item level (i.e., when the 50 items were used as observed variables), the bifactor model with 10 group factors and 3 general factors provided good fit, but the 3-factor bifactor model at subscale level provided the best fit (see Figure 1). This indicates that there is a general psychopathy factor best explaining or capturing the variance of the subscale scores of the YPI, while at the same time, the subscales are related to the dimensions. Pihet et al. (2014) concluded that because the bifactor model is superior, YPI users should rely on the total score along with the three dimension scores, as is common practice.

Bifactor model of the Youth Psychopathic Traits Inventory.
Dimensionality
Like Pihet et al. (2014), many researchers assume that when a multidimensional model has been found (i.e., a variety of factors influence and explain respondents’ item responses), the model is no longer unidimensional and both total score and subscale or dimension scores should be reported (Reise, Bonifay, & Haviland, 2013). However, using a bifactor model brings along an advantage complementing traditional dimensionality studies, namely, assessing the (uni)dimensionality of the model (Reise, Morizot, & Hays, 2007), which has not been taken into account by Pihet et al. (2014) or in other studies focusing on the bifactor model of psychopathy (e.g., Boduszek et al., 2015; Flores-Mendoza et al., 2008; Patrick et al., 2007). Testing the bifactor model allows to decide whether the YPI is essentially unidimensional and should not be broken up into dimension scores, or that the items are multidimensional, reflecting the complexity of the factor structure of the YPI (Brown, Finney, & France, 2011; Reise et al., 2007). To inspect multidimensionality, only examining a satisfying fit using CFA is insufficient, because adequate fit does not imply parameter accuracy (Reise, Scheines, Widaman, & Haviland, 2013). The fit indices do not indicate whether the total score, referring to the core construct, suffices as a reliable index or whether the subscale scores provide additional reliable information beyond the total score (Reise, Bonifay, et al., 2013). Cronbach’s alpha, which is often reported as measure for reliability of the subscales and total score, combines the variance that is explained by the general factor with the variance that is explained by the group factors (Zinbarg, Revelle, Yovel, & Li, 2005). Cronbach’s alpha assumes a unidimensional solution, and when a multidimensional solution has been proposed, alpha tends to overestimate reliability (Brown et al., 2011; McDonald, 1999). A bifactor model gives the opportunity to, in addition to fit indices, evaluate strength indices such as the explained common variance (ECV) and McDonald’s omega, to examine parameter accuracy (Reise, Scheines, et al., 2013). These estimates indicate the strength of a factor, and when a multidimensional model is found, it helps decide whether to continue to focus on a single core construct or also focus on the group factors (Reise, 2012). However, as regards the bifactor model for psychopathy, the consequences of working with a multidimensional model for analyzing the psychometric quality of the scale have been overlooked.
Furthermore, regarding the psychometric properties of the YPI, testing for measurement invariance of scales enables us to examine whether the questions of the overall psychopathic traits or the different factors are interpreted similarly by different groups (Van de Schoot, Lugtig, & Hox, 2012). One of few studies testing for measurement invariance found that a subscale-based correlated factor structure provided a proper fit for both Dutch and Moroccan Dutch incarcerated boys (Veen et al., 2011). Moreover, in addition to testing the bifactor model, Pihet et al. (2014) also examined the measurement invariance of the bifactor model using the subscale scores as observed variables for the YPI across gender, age, and community/institutionalized samples and established measurement invariance in all of these groups.
Current Study
The current study attempts to replicate the study of Pihet et al. (2014) in a community sample of Dutch adolescents, adding to the cross-cultural validity and usability of the YPI. The central aim of the current study is to examine the factorial validity of the YPI, comparing correlated factor models which were presented earlier in this introduction with a bifactor model. Replication of the bifactor model of psychopathy is of importance, because this may have implications for the way YPI measures should be used in research as well as in practice. Even more intriguing is that finding a superior fit for the bifactor model could eventually lead to better insight in the etiology of psychopathy (Patrick et al., 2007). We hypothesize that the bifactor model will be superior compared with other models.
Additionally, as recommended by Reise, Bonifay, et al. (2013), this study examines the degree of unidimensionality of the YPI and whether the dimensions of psychopathy remain reliable after accounting for the shared variance explained by the general factor. Dimensionality has not been taken into account in previous studies on bifactor models of psychopathy, but gives viable information on how to use a measurement. The YPI has been developed to measure the core personality traits of the psychopathic personality constellation, related to the three dimensions of Cooke and Michie (2001; Andershed et al., 2002), including the interpersonal style, emotional/affective traits, and behavioral/lifestyle aspects of psychopathy. Therefore, it is hypothesized that the YPI is primarily a multidimensional measure.
Furthermore, this study will examine the measurement invariance of the superior model of the YPI between gender, age, and ethnic groups. Previous studies have already established measurement invariance between boys and girls (e.g., Andershed et al., 2002), different age groups (e.g., Pihet et al., 2014), and different ethnic backgrounds (e.g., Dutch and Moroccan background; Veen et al., 2011), but it has not yet been established for the general Dutch population. In the present study, in accordance with Pihet et al. (2014), a distinction is made between younger adolescents (i.e., 12 to 15 years old) and older adolescents (i.e., 16 years and older) to examine whether younger and older adolescents interpret the questions of the YPI similarly. Furthermore, a distinction is made between native Dutch, Western, and non-Western backgrounds, because it has been suggested that ethnic background influences respondents’ interpretation of the items (Milfont & Fischer, 2010). It is hypothesized that the YPI will be measurement invariant for gender, age, and ethnic background.
Method
Participants
Participants were 2,874 adolescent students from 21 prevocational high schools (VMBO) and five vocational high schools (MBO) across the Netherlands. After completing the prevocational secondary education, students can continue to further vocational training within secondary vocational education. Forty-three percent of the participants was female (n = 1,239). The average age was 14.47 years (SD = 1.69). There were 51 participants who did not report their age. The ethnic background of the participants was diverse: 55% was native Dutch, 10% Moroccan Dutch, 8% Surinamese Dutch, 8% Turkish Dutch, 4% Antillean Dutch, and 16% had other backgrounds, such as Indonesian, Polish, or German. We distinguished three groups according to the definition of the Central Bureau of Statistics (CBS; 2000): 1,554 native Dutch adolescents, 209 Western immigrant adolescents (e.g., Polish or French), and 1,109 non-Western immigrants (e.g., Surinamese or Moroccan). Almost three quarters of the participants (74%) indicated high affluence on the Family Affluence Scale (Boyce, Torsheim, Currie, & Zambon, 2006), 24% intermediate, and 2% reported low affluence.
Measures
Youth Psychopathic Traits Inventory
The YPI (Andershed et al., 2002) is a 50-item self-report measure to assess the “core” traits of psychopathy in youths from the general population. The Dutch translation of the YPI was used (Das & De Ruiter, 2003). The measure consists of 10 subscales (e.g., Dishonest Charm, Grandiosity, Lying, Manipulation, Remorselessness, Unemotionality, Callousness, Thrill Seeking, Impulsiveness, and Irresponsibility), loading onto three dimensions: interpersonal (grandiose, manipulative dimension), affective (callous, unemotional dimension), and lifestyle (impulsive, irresponsible dimension). Each subscale consists of five items. Participants were asked to indicate to which degree each of the 50 statements applied to them on a 4-point Likert-type scale, ranging from 1 (does not apply at all) to 4 (applies very well) on questions such as “When I need to, I use my smile and my charm to use others,” for the interpersonal dimension, “When other people have problems, it is often their own fault, therefore, one should not help them,” for the affective dimension, and “I get bored quickly by doing the same thing over and over,” for the lifestyle dimension. Higher scores indicate higher levels of psychopathic traits.
Ethnicity
The questionnaire regarding ethnic background, started with questions about adolescents’ demographic background, such as gender, date of birth, and place of birth of the participant, both parents and grandparents. Based on place of birth of the (grand)parents, the adolescents were classified as native Dutch, Western immigrant, or non-Western immigrant. In order to be classified as native Dutch, both parents and all four grandparents had to be born in the Netherlands. To be classified as an immigrant (either Western or non-Western), at least two grandparents had to be born outside the Netherlands and to have similar ethnic backgrounds.
Procedure
Schools across the Netherlands were approached for participation. Parents of participants in junior vocational high schools were asked to complete and sign a consent form before their children could participate in the study. Participants from senior vocational high schools all were older than 16 years of age, and hence signed their own consent form. Of all the adolescents and their parents who were asked to participate, 3% declined to participate.
The questionnaires were digitally administered in a classroom setting. Before completing the questionnaires, students received a short instruction explaining the research and how to find the questionnaires online. In addition, students were informed that completing the questionnaires was voluntary and anonymous and that the information they provided would be treated strictly confidential. Two members of the research team were always present during the administration to answer questions and solve possible computer problems. The teacher also was present during the administration but was not directly involved in the administration.
Statistical Analyses
CFAs were first performed on the total sample to examine the best fitting model for the YPI, using the robust maximum likelihood estimation method. Data were treated as continuous variables. The subscales of the YPI were continuous variables and to remain consistent between subscale level and item level, the item level was also treated as continuous. At item level, the response scale was an ordinal scale with four response options. However, four response options is the minimum number of categories required to use data as continuous without running into serious problems (Byrne, 2008). To be able to compare the results with those of Pihet et al. (2014), several similar models were tested to find the best fitting model for the YPI. With a large sample size in the current study, it was possible to examine the factor structure of the YPI at both item level and at subscale level. At item level, four models were examined: (a) a one-factor model with all the items loading on a single factor; (b) a three-factor model, with all 50 items loading to three factors, allowing the factors to correlate; (c) a bifactor model, with each item loading on one of the three factors, as well as on a general factor; (d) a 10-factor model, with each item loading on their respective a priori subscale, allowing the subscales to correlate.
Pihet et al. (2014) examined two additional models, that is, a bifactor model with all 50 items loading on one general factor, as well as 10 specific factors representing the subscales, and a bifactor model with all 50 items loading on three general factors representing the dimensions and 10 specific factors representing the subscales. However, in order to test these same models using the data in the current study, the statistical program needed too many iterations to obtain reliable results. Therefore, these models were excluded from consideration. At the subscale level, however, three additional models were tested: (a) all 10 subscales loading on one general factor; (b) a three-factor model, with 10 subscales loading on three factors; and (c) a bifactor model, with the subscales loading on three factors, as well as one general factor. Goodness-of-fit indices were used to compare the different models. Model fit was examined using Satorra–Bentler scaled chi-square (S-B χ2) and associated degrees of freedom. S-B χ2 was used as the data were skewed. However, chi-square is sensitive for sample size and tends to reject reasonable models if the sample is large (Van de Schoot et al., 2012). Therefore, other fit indices, such as the comparative fit index (CFI), root mean square error of approximation (RMSEA), and Akaike information criterion were also taken into account. Because the data were skewed, robust calculations were used. An adequate fit was considered when CFI values were >.90, while values of >.95 indicated good fit (Hu & Bentler, 1999). Values of the RMSEA between .05 and .08 indicated acceptable fit, while values <.05 indicated good fit (Hu & Bentler, 1999). Furthermore, models with smaller values of the Akaike information criterion indicated superior fit compared with models with higher values (Byrne, 2008).
After finding the best fit to the data, the factor loadings of the one-factor model were compared with the factor loadings of the general factor of the bifactor model. Lower factor loadings of the general factor of the bifactor model would indicate that the dimensions have considerable influence on the variance in the items or subscales, pointing to multidimensionality (Brouwer, Meijer, & Zevalkink, 2013). Furthermore, the factor loadings of the dimensions of the bifactor model were compared with the factor loadings of the three-factor model. Lower factor loadings in the bifactor model, hence after accounting for the common variance, would indicate a high influence of the general factor, pointing to unidimensionality. Moreover, as an indicator of the degree of unidimensionality, the ECV was calculated. This index represents the percentage of common variance that can be attributed to the general factor in a bifactor model. This index is easy to interpret, as higher ECV values indicate little common variance beyond the variance accounted for by the general factor (Reise, Scheines, et al., 2013). To remain consistent with Pihet et al. (2014) and previous research on the YPI, internal consistency was also examined with Cronbach’s alpha. Alphas of .6 or lower were seen as low, between .6 and .7 as acceptable, and above .7 as high values (Leary, 2008). The model-based reliability index omega (ω) was also calculated for the general psychopathy factor and dimension factors (Reise, 2012). Omega for the general factor is comparable with coefficient alpha, as it is affected by all sources of common variance (Reise, 2012). It is an index of the reliability of the total score that is based on the variance attributed to all the factors. However, omega is model-based and unlike Cronbach’s alpha, does not assume tau equivalence (i.e., equal factor loadings; Zinbarg et al., 2005). Omega for the dimensions is the reliability of the dimension based on all sources of variance across the items from that dimension. Moreover, omega hierarchical (ωh) was calculated. This reliability index is appropriate for a bifactor model, as the variance of the general factor will be separated from the variance of the group factors (Zinbarg, Yovel, Revelle, & McDonald, 2006). Omega hierarchical indicates the proportion of the variance of the total score that can be attributed to one single common factor (the general factor), while the variance of the group factors is removed. Omega hierarchical was also calculated for each of the subscales (referred to as omega subscale [ωs] in Reise, 2012), which indicates the reliable variance of the dimensions when the effects of the general psychopathy factor are removed. Omega hierarchical is a direct index of general factor strength (Reise, Scheines, et al., 2013). Omega, omega hierarchical, and the ECV were calculated based on the factor loadings from the CFA models.
Finally, testing for measurement invariance was performed with multigroup CFAs in several steps. First, we tested the model for each group separately, to examine whether the same factor structure fitted each group. Next, configural invariance was examined, which examines whether the model is invariant across groups by testing the same model structure for both groups simultaneously (Milfont & Fischer, 2010). Then metric invariance was tested, for which the factor loadings or regression coefficients were set equal across groups. This examines whether the groups respond to the items in the same way, that is, whether respondents across groups attribute the same meaning to the latent factors. Finally, we tested scalar invariance, for which, in addition to equal factor loadings, the intercepts were constrained. When scalar invariance has been established, the observed scores are related to the latent scores, and groups can be compared regardless of group membership (Milfont & Fischer, 2010). Differences between the models tested are usually examined by testing the significance of the difference in chi-square and associated difference in degrees of freedom (Byrne, 2008). Because the robust S-B χ2 was used, the chi-square difference was corrected as suggested by Byrne (2008). However, the chi-square is sensitive to sample size. Therefore, the difference in CFI between the models was examined. This difference should not exceed .01 to indicate invariance between groups (Byrne, 2008). In addition, we checked the values of other fit indices (Byrne, 2008; Cheung & Rensvold, 2002). For the analyses of internal consistency, SPSS 21.0 was used. For testing the models, dimensionality, and measurement invariance, EQS 6.2 (Bentler, 2006) was used.
Results
CFA
Listwise deletion was used in EQS, and as a result, 20 cases were dropped because they had one or more missings on the measured variables. The results of the fit indices are presented in Table 1. Testing the one-factor model led neither at item level nor at subscale level to satisfactory fit indices. At item level, the best model fit was found for the 10-factor model with each item loading on their respective subscale (CFI = .816, RMSEA = .044, confidence interval [CI .043, .045]). However, with relatively low fit measures, this fit is not satisfactory. Overall, the best model fit with satisfactory values was found for the bifactor model at subscale level (CFI = .96, RMSEA = .068, CI [.062, .075]). The standardized factor loadings for the bifactor model at subscale level are presented in Table 2, as well as the one-factor model and three-factor model at subscale level.
Fit Indices of Models Tested for YPI.
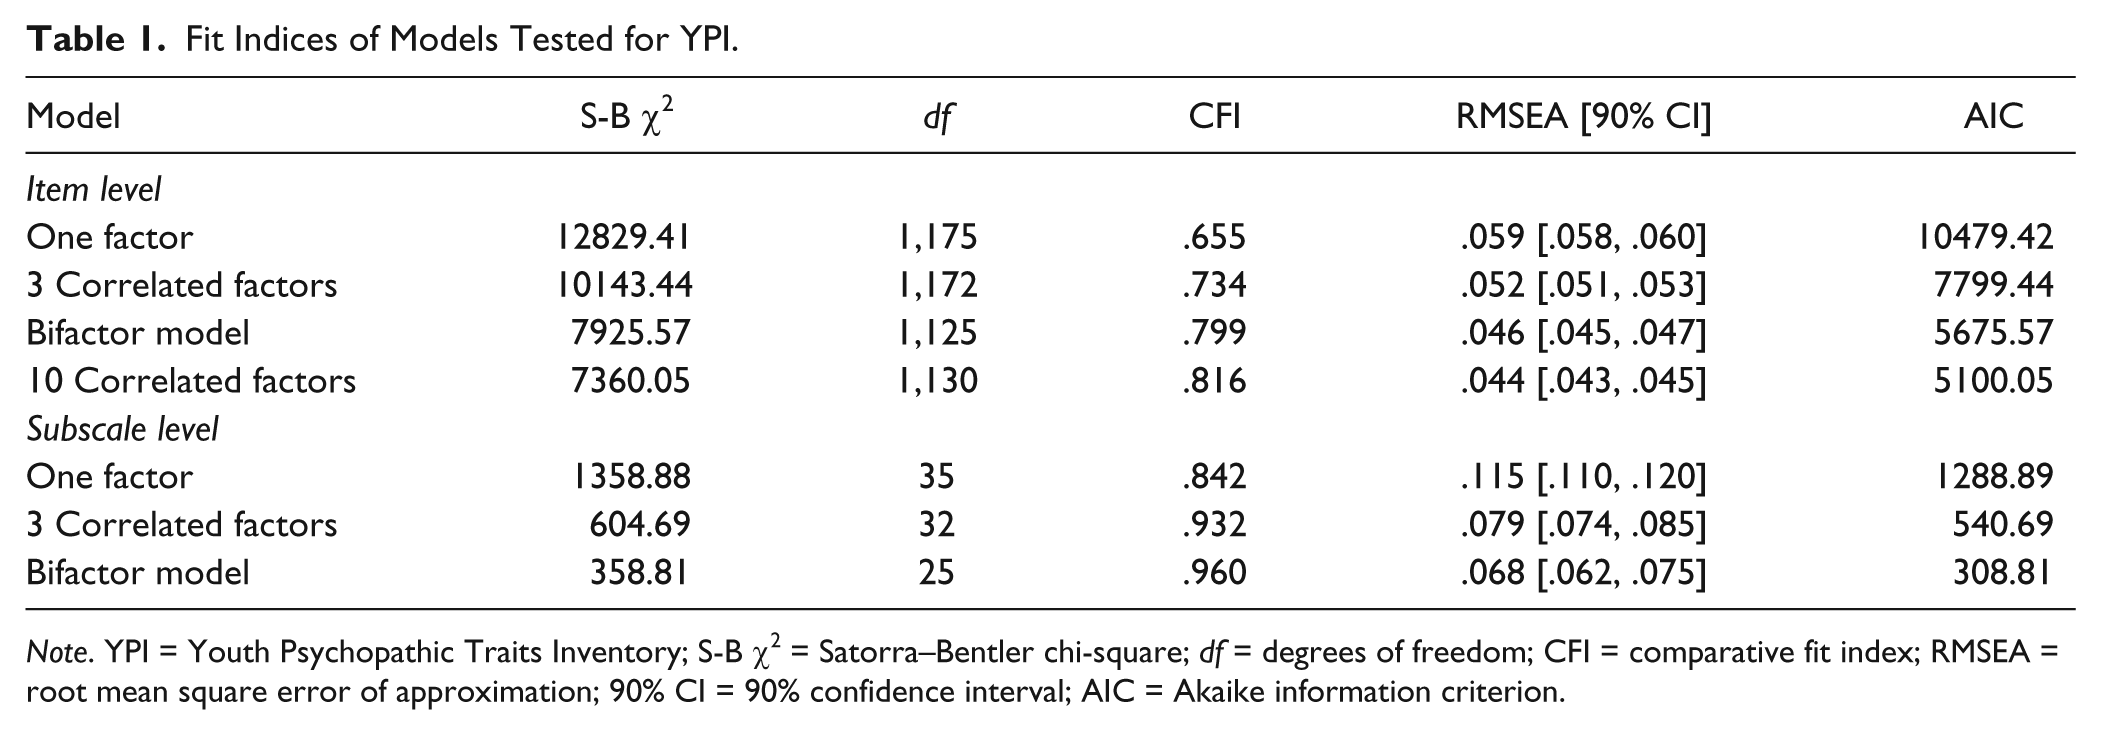
Note. YPI = Youth Psychopathic Traits Inventory; S-B χ2 = Satorra–Bentler chi-square; df = degrees of freedom; CFI = comparative fit index; RMSEA = root mean square error of approximation; 90% CI = 90% confidence interval; AIC = Akaike information criterion.
Standardized General and Dimension Factor Loadings of the Bifactor Model, One-Factor Model, and Three Correlated Factor Model at Subscale Level.

Note. GP = general psychopathy; Int = interpersonal dimension; Aff = affective dimension; Life = lifestyle dimension; α = Cronbach’s alpha; ω = omega, ωh = omega hierarchical; ECV = explained common variance. All the factor loadings were significant at p < .05.
Dimensionality and Internal Consistency
Comparing the factor loadings of the unidimensional model at subscale level with the factor loadings of the general factor in the bifactor model, the factor loadings are fairly similar (see Table 2). On average, the factor loadings differed .02. Furthermore, compared with the factor loadings of the three correlated factors at subscale level, the factor loadings of the dimension in the bifactor model are substantially lower. On average, the factor loadings dropped .35 (ranging from −.06 to .58) when controlling for the general factor. This is a first indication of a strong general factor in the data and that multidimensionality does not distort the unidimensional model.
This view was confirmed by the ECV, which was high (ECV = .71; see Table 2), while the percentages of explained variance by the dimensions were low (9%, 10%, and 10% for interpersonal, affective, and lifestyle, respectively). This indicates that the general factor explained a relatively large proportion of variance and that collectively, the dimensions account for nearly 30% of the common variance, above and beyond the general factor.
The internal consistency of the YPI in the present study as measured with Cronbach’s alpha for the total score was good (α = .93). Cronbach’s alphas of the three subscales were also acceptable (see Table 2). Alphas of the subscales were comparable with the alphas as reviewed by Pihet et al. (2014), ranging from .57, for unemotionality and callousness to .80, for manipulation. The omega for the general psychopathy factor also gave a high reliability (ω = .87; see Table 2). The omegas for the dimensions were moderate to high, .82, .65, and .66, for the interpersonal, affective, and lifestyle dimension, respectively. However, once accounting for the general factor as represented by omega hierarchical, the reliability of the dimensions dropped. Omega hierarchical for the dimensions were lower than omega for all dimensions, .11, .26, and .22, for interpersonal, affective, and lifestyle dimension, respectively, while the omega hierarchical remained high (ωh = .78). The results supported the presence of a strong general psychopathy factor.
For gender, ethnic background, and age, the analyses for the difference in factor loadings, ECV, Cronbach’s alpha, omega, omega hierarchical, and the ECV resulted in a similar pattern (see Table 3). That is, the differences between the factor loadings of the one-factor model and the general factor of the bifactor model were not large, while there was a large discrepancy between the factor loadings of the dimensions in the bifactor model and the factor loadings of the three-factor model. Furthermore, the ECV for the general factor was high, Cronbach’s alphas for the total score, dimension scores, and even subscale scores were high, except for the callousness and unemotionality subscales, the omegas for the general factor and the interpersonal dimension were high, while omegas for the affective and the lifestyle dimensions were moderate, and the high general omega hierarchical was combined with low omega hierarchicals for the three dimensions for all distinguished subsamples, indicating a relatively strong general factor for psychopathy.
Cronbach’s Alpha, Omega, Omega Hierarchical, and the ECV for the General Psychopathy Factor and Dimension Group Factors for Gender, Age, and Ethnic Background.
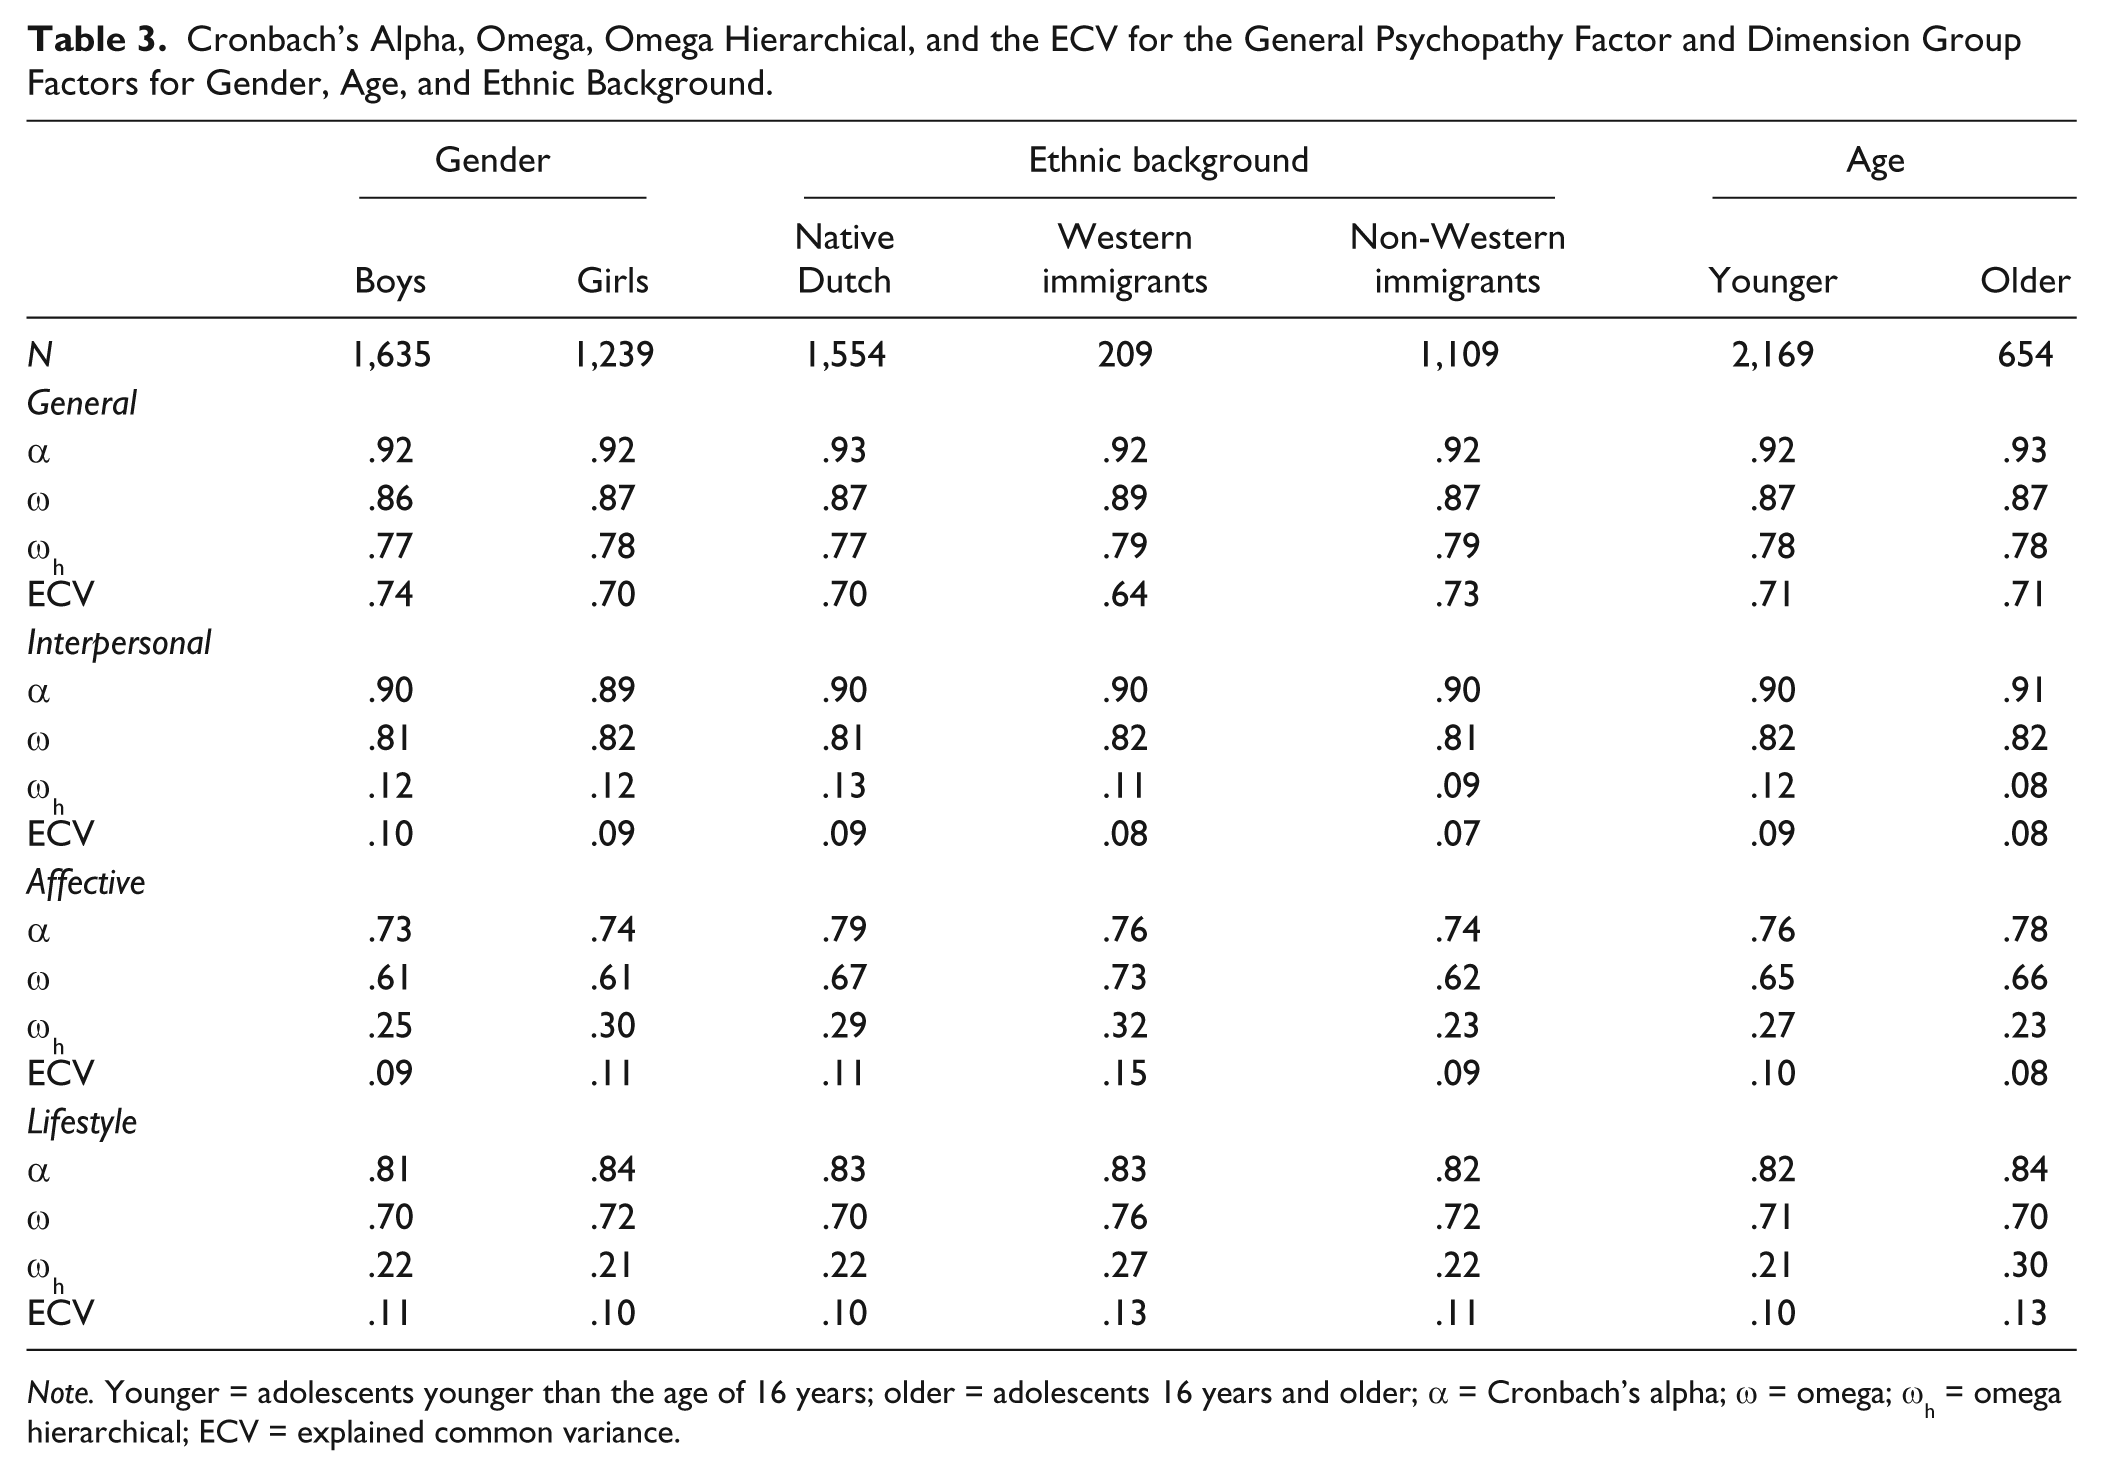
Note. Younger = adolescents younger than the age of 16 years; older = adolescents 16 years and older; α = Cronbach’s alpha; ω = omega; ωh = omega hierarchical; ECV = explained common variance.
Multigroup CFA
Results for the group comparisons are shown in Table 4. Results showed that at subscale level in all groups (gender, age, and ethnicity), the bifactor model was the best fitting model. At item level, the bifactor model could not be tested in the three ethnic groups, because the sample size of the Western immigrant group was too small (n = 209; at least 500 participants are needed per group; Meehan & Stuart, 2007; Pihet et al., 2014). Because the bifactor model at subscale level was the best fitting model in all groups, the measurement invariance was examined for this model.
Fit Indices of the Measurement Invariance Models for Gender, Age, and Ethnic Background.
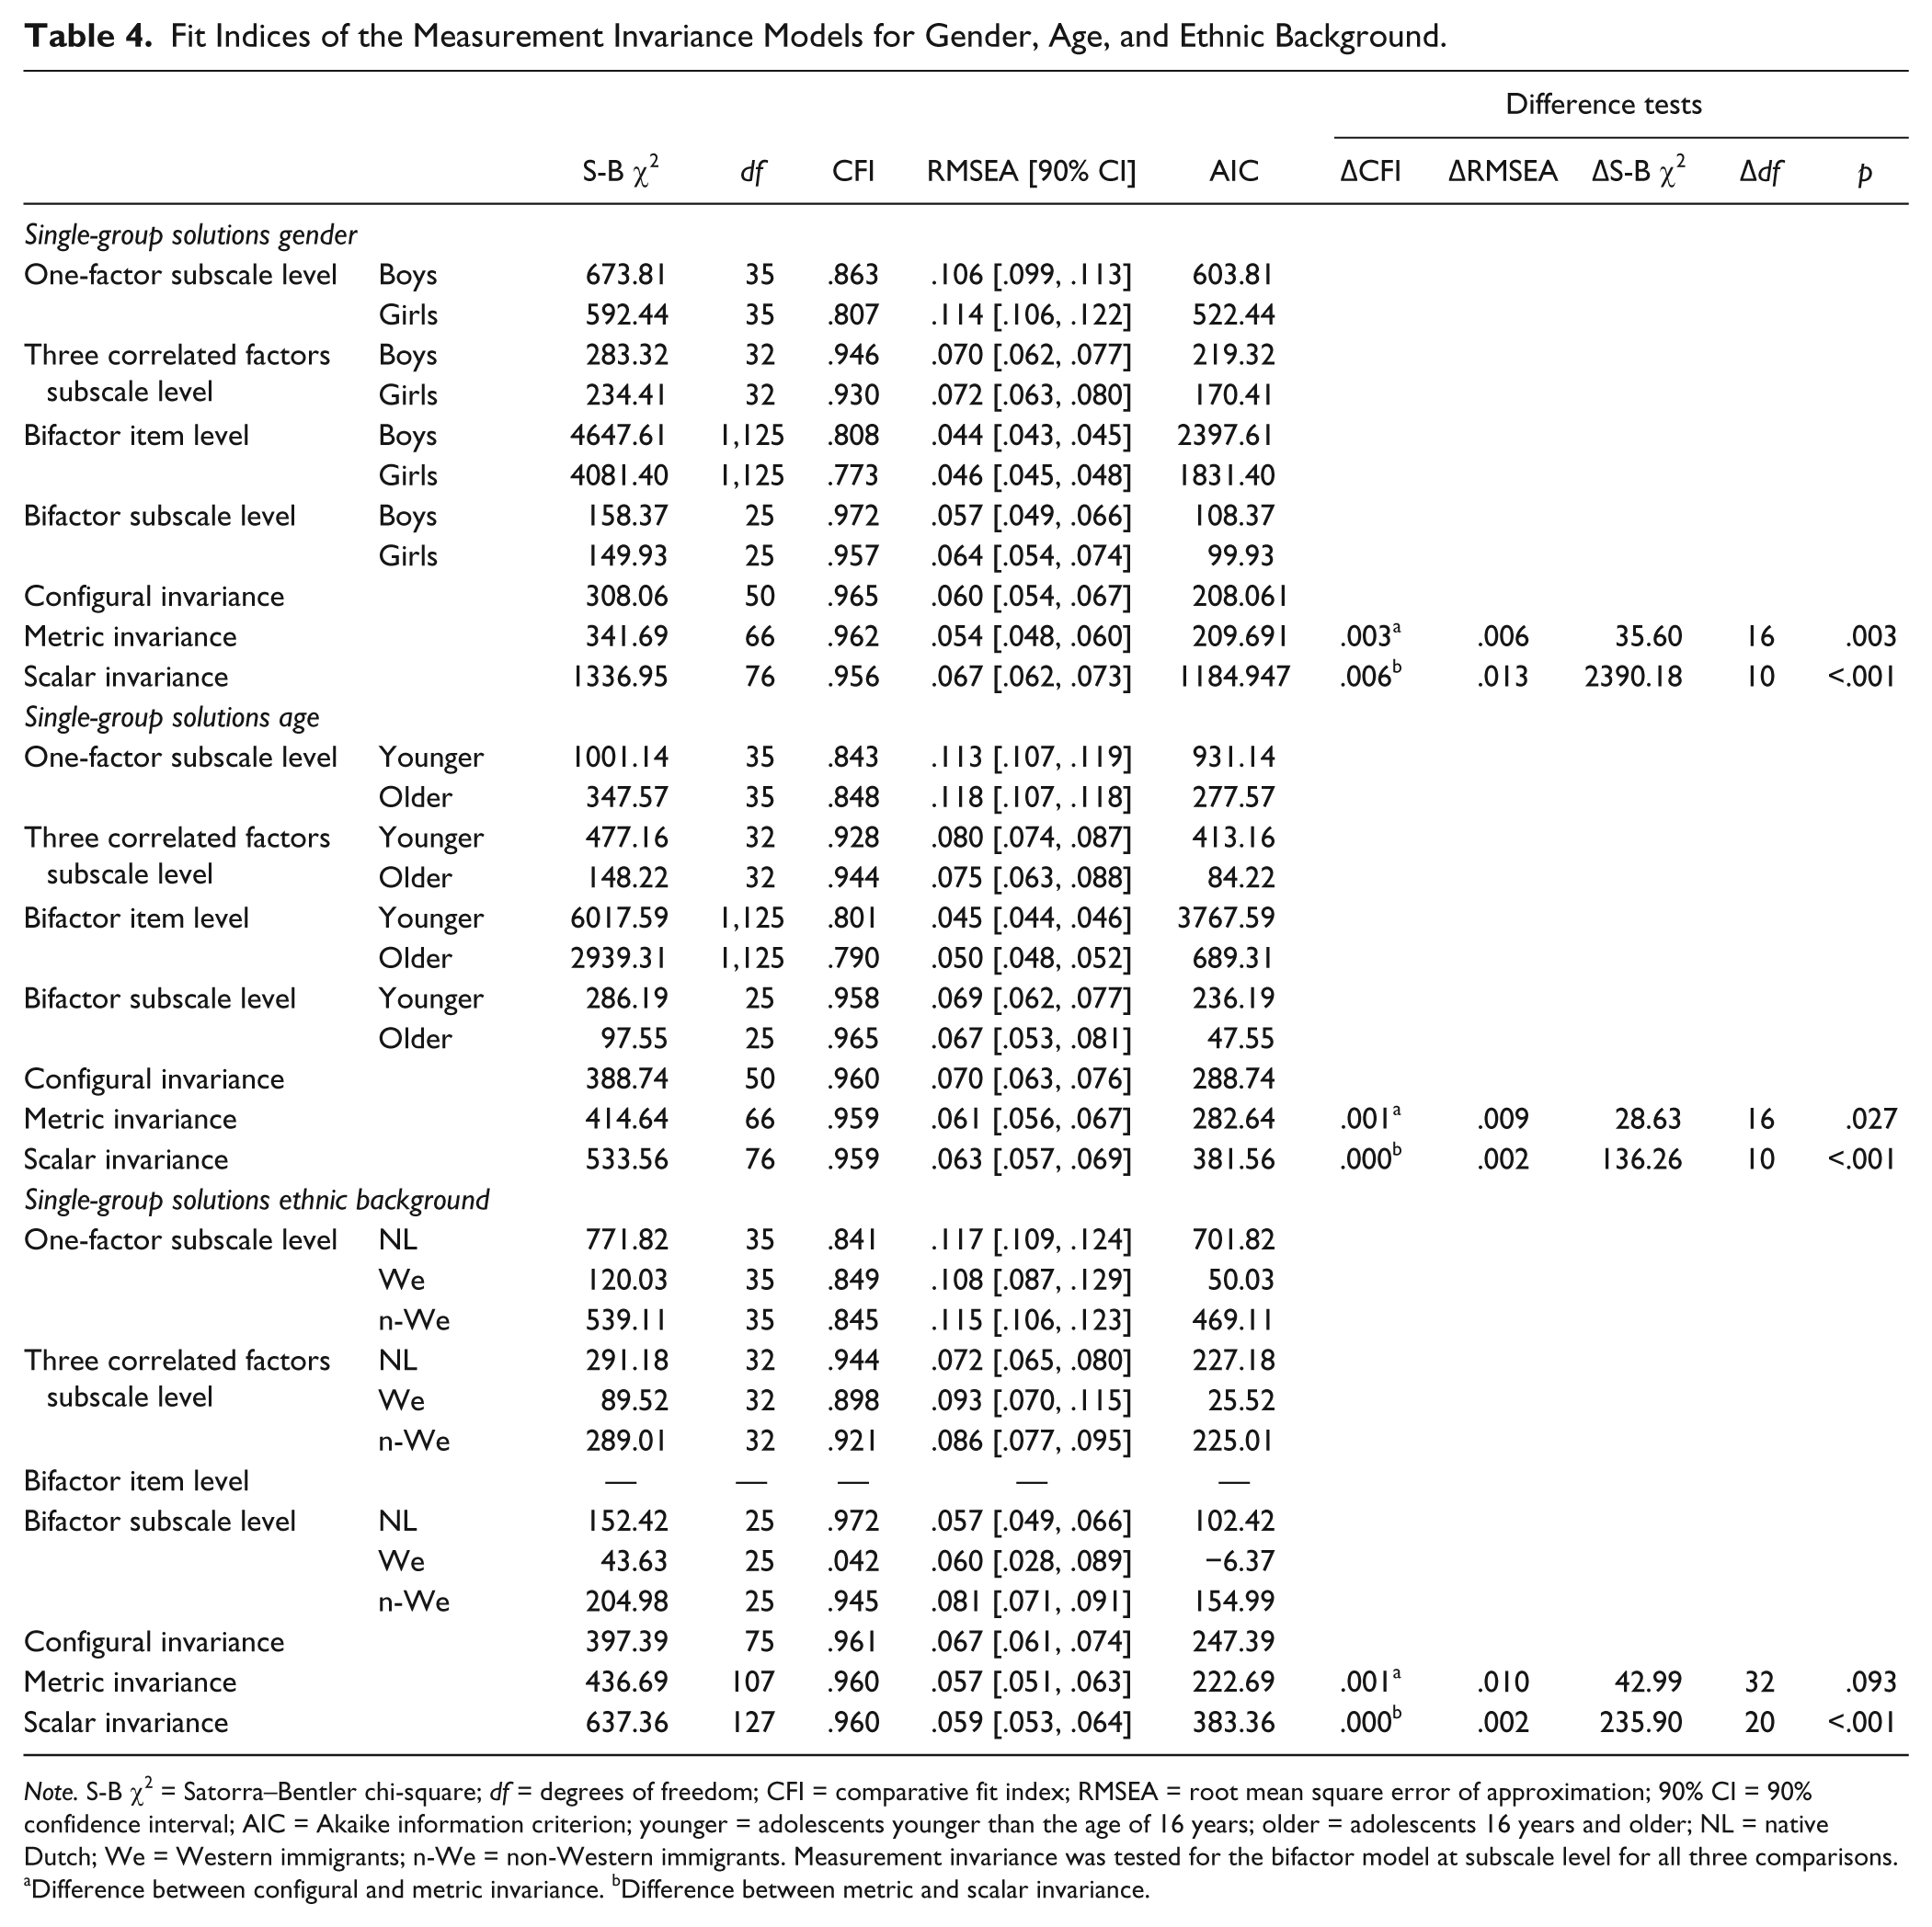
Note. S-B χ2 = Satorra–Bentler chi-square; df = degrees of freedom; CFI = comparative fit index; RMSEA = root mean square error of approximation; 90% CI = 90% confidence interval; AIC = Akaike information criterion; younger = adolescents younger than the age of 16 years; older = adolescents 16 years and older; NL = native Dutch; We = Western immigrants; n-We = non-Western immigrants. Measurement invariance was tested for the bifactor model at subscale level for all three comparisons.
Difference between configural and metric invariance. bDifference between metric and scalar invariance.
To start measurement invariance testing, configural invariance was examined. That is, the same factor structure has the best fit for each group. Configural invariance was found for gender, as well as age and ethnic background (see Table 4). The second step was testing for metric invariance, where factor loadings were set equal across gender (Van de Schoot et al., 2012). The results showed in Table 4 indicate that there was metric invariance. The model still indicated a satisfactory fit, and the difference in CFI was <.01 across gender, age, and ethnic background. Finally, scalar invariance was confirmed across all groups. For gender, age, and across ethnic background, the model remained satisfactory and the difference in CFI did not exceed .01. Overall, measurement invariance was demonstrated, indicating that group comparisons can be meaningfully made for the YPI.
Discussion
Recently, a bifactor model was proposed for the construct of psychopathy, suggesting that there is a general psychopathy factor underlying all items that constitute the construct of psychopathy (Patrick et al., 2007). This general factor explains subjects’ item responses in addition to the separate and unique influence of group factors, which represent the psychopathy dimensions (e.g., interpersonal, affective, and lifestyle dimension; Patrick et al., 2007). In line with previously reported results (Pihet et al., 2014), the present study provides support for a bifactor model for the YPI: a general psychopathy factor and dimension factors. Our results show that the bifactor model is invariant across gender, age, and ethnic background, indicating that the scores measure the same construct in different groups, enabling group comparisons with the YPI. Furthermore, internal consistency of the total score, dimensions, and subscales as measured with Cronbach’s alpha are consistent with previously reported alpha’s, indicating high reliability estimates. The model-based McDonald’s omega used as an alternative estimate of reliability also indicates high reliability for the total and dimension scores. However, the scores of omega are lower than the alphas, indicating that Cronbach’s alpha overestimates the reliability of the YPI (Gignac & Watkins, 2013). When inspecting the strength indices to assess multidimensionality of the YPI, omega hierarchical of the dimensions drops significantly once accounting for the general psychopathy factor. Moreover, the reliability of the general factor remains high, suggesting that the variance of the YPI is primarily explained by the general psychopathy factor. This finding is supported by the small differences in factor loadings between the one-factor model and the general factor from the bifactor model and the relatively high ECV for the general factor (i.e., 71% of the common variance was explained by the general factor). Around one third of the variance is explained by the psychopathy dimensions. Thus, the dimensions do explain variance over and above the general factor, but despite the multidimensionality in the data, the use of observed dimension scores should be discouraged (Ward, Nobles, & Fox, 2014). Significant confounding of the general psychopathy factor with the dimensions, is a likely result when dimension scores are used without first partialling out the general psychopathy factor, as is done when using a bifactor model. When examining the relation between the YPI dimensions and an outcome variable, future research should use structural equation modeling. In addition, future research should focus on the external validation of the bifactor model of the YPI, to examine whether the bifactor model has theoretically meaningful relations with outcome variables, such as aggression, delinquency, and impulsivity (Dolan & Rennie, 2007).
The results regarding the superiority of the bifactor model over a higher order factor could imply that there are separate etiological processes that contribute to the phenotypic expression of psychopathy (Patrick et al., 2007). That is, the general psychopathy factor and the distinct dimensions as represented in the bifactor model, being unrelated to each other, may imply that the general factor has a different etiological process than the dimensions separately. For example, the underlying etiology for externalizing psychopathology could also underlie the general psychopathy factor, whereas weakness in fear reactivity could underlie the interpersonal dimension more specifically (Patrick et al., 2007). However, as noted by Olatunji, Ebesutani, and Reise (2015), who also found a bifactor model for disgust proneness, the drop in reliability of the dimensions when accounting for the general factor and the high reliability of the general factor, could indicate that the dimensions share an etiological pathway through a common process. A possible explanation for this shared etiological pathway could be the genetic influence that has formerly been found for psychopathic traits. Several studies have examined heritability of psychopathic traits with twin studies and estimate that 40 to 78% of the variation in psychopathic traits in attributable to genetic factors (Tuvblad, Bezdjian, Raine, & Baker, 2014; Viding & McCrory, 2012). Also having examined the heritability of the second-order psychopathy factor of the YPI, Larsson, Andershed, and Lichtenstein (2006) found that genetic factors explained 63% of the variance. The remaining 37% of the variance was explained by nonshared environmental factors, for example, harsh parental discipline and child maltreatment and seems to be related to the development of psychopathic traits (Farrington, Ullrich, & Salekin, 2010). To further examine whether the psychopathy dimensions provide any additional predictive power over and above the general psychopathy factor, researchers are well-advised to use bifactor models within structural equation modeling when examining relations between the YPI scores and other outcome variables such as aggression, conduct problems, or anxiety, or when examining the heritability of psychopathy.
Furthermore, the bifactor model may also give more insight in the stability of psychopathic traits (Ward et al., 2014). There is an ongoing debate on whether the downward extension of psychopathy toward adolescents is justified, as behaviors related to psychopathy, such as impulsivity and sensation seeking, may be rather normative and temporary in adolescence (Seagrave & Grisso, 2002; Skeem & Cauffman, 2003). Most studies show moderate to high stability of psychopathic traits across several years, for most, but not for all individuals (Andershed, 2010). From adolescence to adulthood, it seems that the social deviance factor of psychopathy (antisocial, irresponsible behavior) decreases over time, while the interpersonal–affective factor seems to remain stable over time (Blonigen, Hicks, Krueger, Patrick, & Iacono, 2006; Harpur & Hare, 1994; Ullrich, Paelecke, Kahle, & Marneros, 2003). This suggests that the general factor of psychopathy and the lifestyle dimension are more fluid. Perhaps they are more influenced by the developmental period of the individual. Using a bifactor model may contribute insight in possible differences throughout developmental periods.
Studies that favor a bifactor model over a higher order model are proliferating (Reise, 2012). Cronbach’s alpha is still used as a measure of reliability in these studies. However, omega hierarchical is a model-based reliability index that is more suitable for a bifactor structure (Reise, 2012). Omega hierarchical provides a good indication of the general factor saturation (Revelle & Wilt, 2013). It has been previously argued that omega hierarchical for both the general factor and group factors should be routinely reported to provide more appropriate estimates of reliabilities (Canivez, in press). Using the ECV in addition to the omega hierarchical as an index of unidimensionality, the results of a bifactor model give more insight in the factor structure a questionnaire actually has, next to the fit indexes. Finally, it should be noted that the unidimensionality of a construct is not necessarily similar for different groups of people (Olatunji et al., 2015; Paap et al., 2012). It is possible that the unidimensionality of the YPI in the current study was influenced by sample characteristics and that the YPI dimension scores explain more variance in samples with a higher prevalence of psychopathic traits. Future research regarding the bifactor model, measurement invariance, and unidimensionality in a forensic sample with higher prevalence of psychopathic traits, is warranted.
Limitations and Prospects
In order to optimize chances to sample adolescents with problem behavior, the current study focused on adolescents in cognitively less demanding schools for vocational education (De Kooze et al., 2014). However, only 52% of the Dutch adolescent population follows vocational education, while the remaining 48% follows more academic educational streams (CBS, 2015). Thus, even though the results cannot be generalized toward the higher educated adolescents, the sample represents half of the Dutch adolescent population. Moreover, in the current sample, the group of Western immigrants is small compared with the native Dutch and non-Western immigrants. Although the percentage of Western immigrants in the sample is almost similar to the percentage in the general population (7% in the study vs. 9% in the Dutch population; CBS, 2014), we could not perform measurement invariance analyses at the item level, because the sample size for this subgroup was too small. Using stratification processes, targeting the Western immigrant population, future research should try to oversample this group.
Furthermore, the sample consists of adolescents of the general population, while the prevalence of psychopathy in the general population is low (i.e., 1% to 2%; Neumann & Hare, 2008). In forensic populations, the prevalence of psychopathic traits has been found to range from 15% to 30% (Hare, 2003; Nicholls, Ogloff, Brink, & Spidel, 2005). Although the YPI has been created to examine psychopathic traits in the general population, the YPI is often used in forensic settings (e.g., Cauffman et al., 2009; Poythress, Dembo, Wareham, & Greenbaum, 2006). In these forensic samples, similar factor structures have been found as in the general population (Dolan & Rennie, 2006b; Skeem & Cauffman, 2003).
In conclusion, the bifactor model fits the YPI properly and may be used to compare different groups (e.g., boys vs. girls). Furthermore, the omega hierarchical and ECV show that psychopathy as measured with the YPI within a general population, is primarily a unidimensional construct, indicating that when interpreting scores, the focus should be on the total score of YPI, rather than on dimensional scores. However, as the YPI dimensions do explain some variance and thus the measure is not purely unidimensional, calculating a total observed score confounds the variance associated with the general psychopathy factor and dimensions (Brown et al., 2011). Therefore, future research should use latent variables modeling techniques such as structural equation modeling to examine the relations between the general psychopathy score as well as the dimension scores with outcome variables. This provides insight into what the general psychopathy factor and the specific dimension factors represent (Brown et al., 2011; Chen et al., 2006).
Footnotes
Acknowledgements
The authors would like to thank Henrik Andershed for his useful comments on the final version of the article.
Authors’ Note
Research materials regarding the article are available on request from the first author.
Declaration of Conflicting Interests
The author(s) declared no potential conflicts of interest with respect to the research, authorship, and/or publication of this article.
Funding
The author(s) received no financial support for the research, authorship, and/or publication of this article.