
Abstract
The Clock Drawing Test (CDT) is a commonly used tool in clinical practice and research for cognitive screening among older adults. The main goal of the present study was to analyze the interrater reliability of three different CDT scoring systems (by Shulman et al., Babins et al., and Cohen et al.). We used a clock with a predrawn circle. The CDT was evaluated by three independent raters based on the normative data set of healthy older and very old adults and patients with nonamnestic mild cognitive impairment (naMCI; N = 438; aged 61-94). We confirmed a high interrater reliability measured by the intraclass correlation coefficients (ICCs): Shulman ICC = .809, Babins ICC = .894, and Cohen ICC = .862, all p < .001. We found that age and education levels have a significant effect on CDT performance, yet there was no influence of gender. Finally, the scoring systems differentiated between naMCI and age- and education-matched controls: Shulman’s area under the receiver operating characteristic curve (AUC) = .84, Cohen AUC = .71, all p < .001; and a slightly lower discriminative ability was shown by Babins: AUC = .65, p = .012.
Keywords
The Clock Drawing Test (CDT) is one of the screens for cognitive decline that has found its way into clinical research (Freedman et al., 1994; Mainland & Shulman, 2013; Nyborn et al., 2013). Moreover, the CDT has gained in popularity among practicing clinicians such as neuropsychologists, neurologists, geriatricians, and so on due to its valuable characteristics as a standard screening instrument (Rabin, Barr, & Burton, 2005). According to the American Neuropsychiatric Association (Malloy et al., 1997), optimal screening instruments have to fulfill the following criteria: require 5 to 15 minutes to administer, sample from all major cognitive domains, and demonstrate adequate test–retest and interrater reliability and acceptable sensitivity in common neuropsychiatric disorders. Mainland and Shulman (2013) also added requirements for simple paper-and-pencil administration and clear interpretation of the results in connection with subsequent medical care for the patient. The CDT sufficiently satisfies the majority of those requirements. As an overview, the CDT is short in length, but it is still a multifaceted task. Getting a high score implies the activation of several cognitive functions: Semantic memory plays a key role in the recollection and representation of the clock face and numbers, and the executive functions are responsible for planning, monitoring, inhibition, and the correction of errors. Furthermore, the construction of the clock employs visuoconstructive, visuospatial, and graphomotor abilities (Benton & Tranel, 1996). Performance is modulated by attentional resources and can be influenced by motivation, effort, and frustration tolerance. In the case of auditory-verbal administration, our auditory apparatus, hearing and speech perception are also activated (Bozikas, Giazkoulidou, Hatzigeorgiadou, Karavatos, & Kosmidis, 2008; Freedman et al., 1994; Mainland, Amodeo, & Shulman, 2014; Royall, Cordes, & Polk, 1998; Santana, Duro, Freitas, Alves, & Simões, 2013). And in spite of a number of variants and scoring systems for the CDT, the psychometric characteristics remain acceptable (Shulman, 2000).
The CDT was originally developed as an instrument for attentional and visual disorders, notably hemineglect syndrome (Battersby, Bender, Pollack, & Kahn, 1956; Benton & Tranel, 1996; Critchley, 1953). Its practical usage has since expanded into many branches of clinical neurology and neuropsychiatry, particularly as a brief cognitive screening test for the evaluation of cognitive impairment, especially due to pathological aging (Mainland & Shulman, 2013). Because of its simplicity and brevity of administration, it is well accepted by older and very old adults (Munang, Chan, & Lim, 2010). It has shown high discriminative validity for screening purposes in moderate to severe dementia (Brodaty & Moore, 1997; Lam et al., 1998; Lessig, Scanlan, Nazemi, & Borson, 2008; Nishiwaki et al., 2004; Rouleau, Salmon, Butters, Kennedy, & McGuire, 1992). In the case of mild dementia and mild cognitive impairment (MCI), the results are inconclusive. Ehreke et al. (2011) evaluated the diagnostic utility of six common scoring systems of the CDT, including scoring systems by Shulman et al. (1993); Shulman et al. (1986); and Babins, Slater, Whitehead, and Chertkow (2008), to screen for MCI, and they recommended none of them as reliable due to low values of sensitivity (48% to 76%) and specificity (58% to 79%). However, according to Yamamoto et al. (2004), the CDT is able to discriminate a group of MCI from normal elderly, and Babins et al. (2008) concluded that the result of the CDT can at least indicate that a comprehensive neuropsychological assessment is needed. Rubinova et al. (2014) further pointed out to a combination of scores of the CDT and Mini-Mental State Examination (MMSE), which seems to increase an ability to discriminate between an MCI and controls. Conflicting results of the studies can be explained on account of various methodologies regarding characteristics of subjects (number of subjects in samples, place where subjects are recruited, operationalization of MCI, etc.), methods of administration, and scoring (Ehreke, Luppa, Konig, & Riedel-Heller, 2010). At present, researchers concentrate on the determination of the most sensitive segments of the CDT to evaluate the evolution of cognitive impairment (Babins et al., 2008; Wang, Shi, Zhao, Hong, & Guo, 2014).
In clinical practice, there are several versions of the CDT that are currently used. Cacho et al. (2005) have identified three basic domains of differences: First, the clock face is predrawn or not predrawn (Lam et al., 1998; Nyborn et al., 2013; Rouleau et al., 1992; Shulman, 2000). The predrawn clock face eliminates problems such as a too small or asymmetric clock face, which can hinder the drawing of the rest (Tuokko, Hadjistavropoulos, Rae, & O’Rourke, 2000). Second, the time setting may differ. A time setting that covers both parts of the clock face and concurrently both visual receptive fields of the patient is the most frequently recommended (Benton & Tranel, 1996; Freedman et al., 1994). This administration is based on usage of the CDT for the evaluation of hemineglect syndrome, and there are several examples of this approach, for example, 11 hours and 10 minutes (Lezak, Howieson, Bigler, & Tranel, 2012; Pinto & Peters, 2009), 1:45 (Royall et al., 1998), 8:20 (Freedman et al., 1994), and so on. In some languages, for example, in Czech, there are more language descriptions for clock setting. In the case of 1:45, we can say: “one hour and forty-five minutes,” “thirteen hours and forty-five minutes,” or “three quarters to two.” The last example is considered not only more linguistically complex but also more cognitively demanding for the patient (Patocskai et al., 2014). Third, even though CDT construction is the most widely used version of the CDT, there is also a copy of the clock (Nyborn et al., 2013; Royall et al., 1998), or a version of it, in which the participants are asked only to read the time from a toy clock (Bodner et al., 2004; Lam et al., 1998).
In addition to administration differences, there are also various scoring systems for CDT evaluation, and currently, there is no unanimous agreement in relation to the accuracy and efficiency of these scoring systems. For their reviews, compare Pinto and Peters (2009) or Mainland et al. (2014). We can classify these scoring systems into simple dichotomous scales, for example, normal versus abnormal performance on the CDT (Nair et al., 2010), and multidimensional scales (Babins et al., 2008; Nyborn et al., 2013). Other researchers also analyze the error scores, because they surmise that this approach may be more revealing for the interpretation of normal and abnormal aging (Grande et al., 2013; Hubbard et al., 2008; Seigerschmidt, Mosch, Siemen, Forstl, & Bickel, 2002).
Studies analyzing the psychometric properties of the CDT are numerous, and a comparison between the studies may be difficult, although it is feasible regarding interrater reliability (Lezak et al., 2012); for a more detailed review, see Mainland and Shulman (2013). Reported values are in most cases consistent and high, r > .75, with the exception of Shulman’s et al. (1993, 1986) scoring system, in which the interrater reliability oscillates from r = .35 to r = .77 (Ehreke et al., 2011; Rubinova et al., 2014; Shulman et al., 1993; van der Burg et al., 2004). Most studies report interrater reliabilities based on small subsamples (9% to 50%) of the original and show the concordance between only two raters (Ehreke et al., 2011; Fuzikawa et al., 2003; Seigerschmidt et al., 2002; Storey, Rowland, Basic, & Conforti, 2001). The only exception is a study by Jørgensen, Kristensen, Waldemar, and Vogel (2015), which shows the interrater reliability between four raters on the whole sample of 231 mild Alzheimer’s disease patients versus elderly nonpatients.
The applicability of the CDT in clinical practice is limited by the lack of normative data, which would describe a cognitively normal performance in different and most-used scoring systems across different age groups (Mitrushina, Boone, Razani, & D’Elia, 2005). As a result, CDT scores could be misinterpreted, especially in older adults, or experts may use “norms” based on their own clinical practice (Hubbard et al., 2008). Recent studies are conclusive regarding the detrimental influence of age on the CDT (Hubbard et al., 2008; Santana et al., 2013). This effect is detectable notably in persons older than 60 years of age with a particularly sharp decline from 70 to 80 years (Bozikas et al., 2008; Caffarra et al., 2011; Sugawara et al., 2010). We can also observe certain trends regarding the influence of education on the CDT, where subjects with higher education levels achieve significantly higher CDT scores than those with lower education levels (Bozikas et al., 2008; Hubbard et al., 2008; Lourenço, Ribeiro-Filho, Moreira, Paradela, & Miranda, 2008); however, this finding was not replicated in a study by Caffarra et al. (2011). The results regarding the influence of gender on CDT performance are inconclusive. They range from no difference in a study by Bozikas et al. (2008) to a study by Sugawara et al. (2010) in which Japanese women outperformed men. However, the opposite was found for African Caribbean healthy older adults living in the United Kingdom (Stewart, Richards, Brayne, & Mann, 2001).
The primary goal of the present study was to analyze the interrater reliability and internal consistency of three major CDT scoring systems rated by three independent raters on a vast data set of older and very old adults. Second, we wanted to show the relationship of the CDT scoring systems to sociodemographic variables and provide the reader with normative values in healthy aging. And third, we show the ability of the CDT to differentiate between healthy older adults and older patients with nonamnestic mild cognitive impairment (naMCI). We focused on naMCI patients, as this subtype may have visuoconstructive or executive deficits and has not been included in clinical studies on the CDT.
Method
Participants
The current report summarizes the second year of a longitudinal project (National Normative Study of Cognitive Determinants of Healthy Aging [NANOK]; Štěpánková et al., 2015). We recruited a convenience sample of independently living senior volunteers through advertisements on the institution’s website, at post offices, and in general practitioners’ clinics; we used nonrandom quota sampling in 12 of the 14 regions of the Czech Republic. The numbers in each sociodemographic category were balanced based on the previous normative study for older adults: 5-year age intervals except very old adults (85+ years), balanced ratios of women to men, and of lower to higher education (Bezdicek, Libon, et al., 2014; Ivnik et al., 1990). Two educational categories were used: lower education level, 8 to 12 years of formal education; higher education level, ≥12 years of formal education in every case with a special exam after the 12th year (Table 1). There were predefined counts in each subgroup (1:1 for women/men and lower/higher education). The inclusion criteria consisted of the following: age ≥60 years; to prevent the inclusion of persons with possible pathological aging, we applied consensual anamnestic inclusion criteria that consisted of an absence of any neurodegenerative disease (e.g., dementia, Parkinson’s disease, MCI), head trauma with unconsciousness, stroke, history of alcohol or substance abuse, current radiotherapy or chemotherapy, aphasia, epilepsy, major depression and/or other major psychiatric disorders, unstable medical illness, and/or uncorrected visual or hearing disorders. To guard against including persons with an emerging dementia, MCI or affective disorder, additional exclusion criteria were employed, including a clinical assessment in which having the following scores meant being omitted: (a) 2 standard deviation (SD) units below the entire sample in any two of the three following neuropsychological tests: the Trail Making Test, Part B (TMT B; Bezdicek et al., 2012), a composite score of verbal letter and animal fluency or a composite score of first five attempts and a delayed recall in the Czech version of the Philadelphia Verbal Learning Test (Bezdicek, Libon, et al., 2014); (b) 2 SDs lower the entire sample in one of the neuropsychological tests described above, as well as a high score on one of the following questionnaires: the Geriatric Depression Scale-15 items (GDS 15; score ≥10/15; Sheikh & Yesavage, 1986) or the Functional Activities Questionnaire (score ≥10/30; Bezdíček, Lukavský, & Preiss, 2011; Bezdicek, Stepankova, Novakova, & Kopecek, 2015); and (c) below the 16th percentile (lower than −1 SD) on the MMSE according to Czech normative values (Štěpánková et al., 2015). In the second year of the longitudinal project, 510 participants were examined; 115 of them were excluded on the basis of their results in the clinical assessment in the first or second year of project NANOK, and 5 participants had to be excluded due to illegibility or the absence of identification numbers on the list of their clock drawings. Three hundred and ninety older adults (aged 61-94) who met the inclusion criteria and provided informed consent were enrolled in the study. They formed the Normative group (NG; Table 1).
Sociodemographic Characteristics of the Normative Group (N = 390).
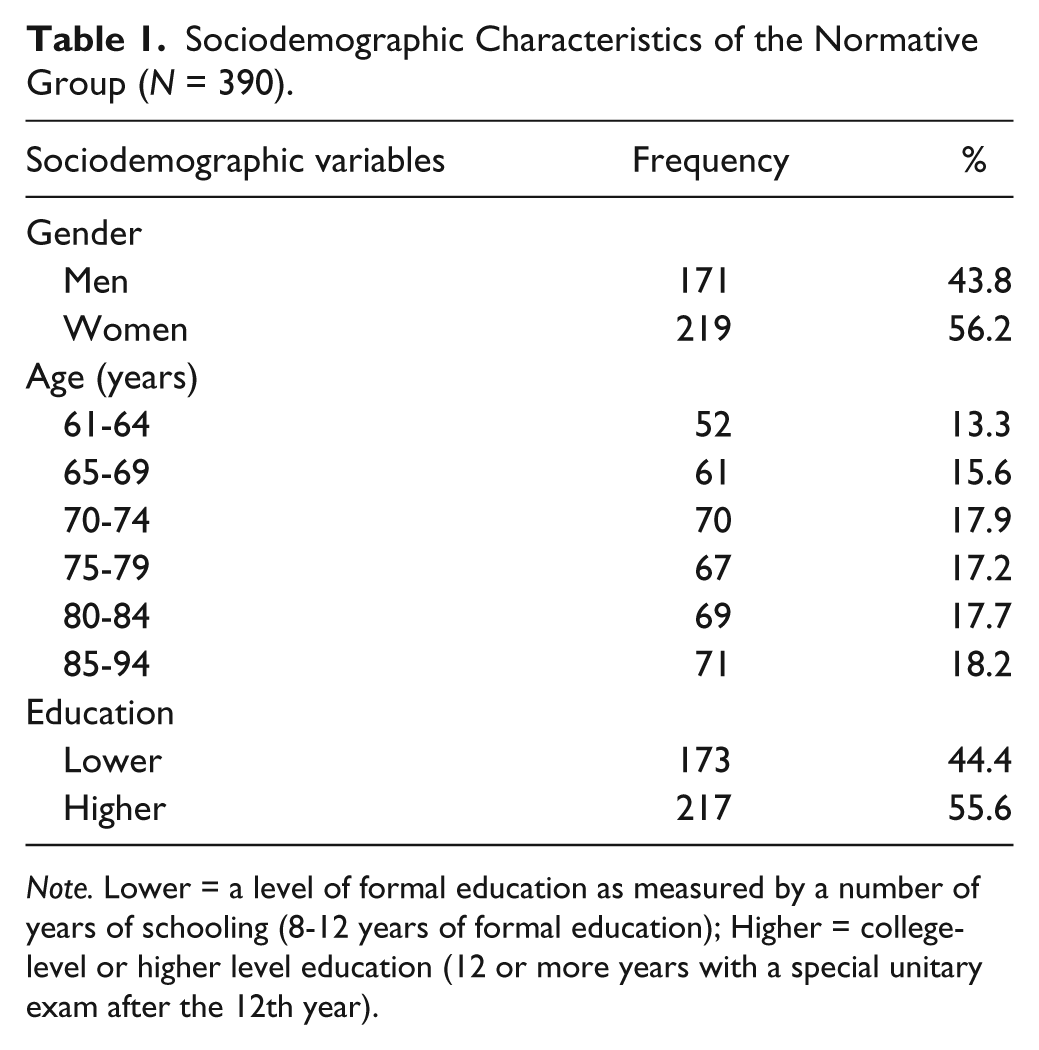
Note. Lower = a level of formal education as measured by a number of years of schooling (8-12 years of formal education); Higher = college-level or higher level education (12 or more years with a special unitary exam after the 12th year).
The patient group was recruited at the Memory Disorders Clinic at Motol University Hospital in Prague, Czech Republic. We applied the following inclusion criteria: age ≥60 years, meeting clinical criteria for naMCI published by Petersen et al. (1999), concretely having cognitive complaints reported by patients or by their caregiver, scoring more than 1.5 SD lower than the mean of age- and education-adjusted norms on tests for one of the main cognitive domains except memory, generally intact activities of daily living, and the absence of dementia. Moreover, only subjects with a score <10/15 on the GDS 15 (Sheikh & Yesavage, 1986), normal or corrected vision and hearing, no serious movement difficulties, and providing informed consent were included in the study. The sample of patients had 48 subjects (aged 61-84). Thirty of them had an isolated impairment in only one main cognitive domain except memory (executive function, visuoconstructive function, language, or attention) and 21 patients in the sample had impairments in more than one cognitive domain except memory (executive function, visuoconstructive function, language and/or attention) based on the Uniform Data Set (UDS; Weintraub et al., 2009). They formed the naMCI group (naMCI; Table 2). The control subjects formed the Control group (CG). They were chosen from the NG of the NANOK study and were paired with naMCI according to age and educational level. The CG consisted of 48 subjects (aged 61-84; Table 2).
Sociodemographic Characteristics and Differences Between the Control Group and the naMCI Group in the CDT.

Note. naMCI group = nonamnestic mild cognitive impairment group; M = mean; SD = standard deviation; U = the Mann–Whitney test statistic; χ2 = chi-square test statistic; Lower = a level of formal education as measured by a number of years of schooling (8-12 years of formal education); Higher = college-level or higher level education (12 or more years in every case with a special unitary exam after the 12th year); CDT = Clock Drawing Test; MMSE = Mini-Mental State Examination.
Materials and Procedure
All participants in the NANOK study completed a neuropsychological battery (UDS) and the CDT. The participants underwent an individual assessment. To assist with identifying early cognitive impairment (Steenland et al., 2008), the assessment protocol involved the MMSE (Folstein, Folstein, & McHugh, 1975; Štěpánková et al., 2015) and the Montreal Cognitive Assessment (Kopecek et al., in press; Nasreddine et al., 2005). Other administered tests included the Rey-Osterrieth Complex Figure (Drozdová, Štěpánková, Lukavský, Bezdíček, & Kopeček, 2015; Meyers & Meyers, 1995), the letter and semantic fluency tests (Nikolai et al., 2015), the TMT A and B (Bezdicek et al., 2012), the Boston Naming Test, 15-item version (Mack, Freed, Williams, & Henderson, 1992), the Czech version of the Philadelphia Verbal Learning Test (Bezdicek, Libon, et al., 2014), the Prague Stroop Test (Bezdicek, Lukavsky, et al., 2015; Troyer, Leach, & Strauss, 2006), the GDS 15 (Sheikh & Yesavage, 1986), and the Functional Activities Questionnaire (Bezdíček et al., 2011; Bezdicek, Stepankova, et al., 2015). The Institutional Review Board of the National Institute of Mental Health/Prague Psychiatric Center approved the study protocol.
Patients with naMCI underwent standard neurological, internal, and laboratory evaluations; magnetic resonance imaging of the brain; a semistructured interview; and an individual neuropsychological assessment (UDS). The neuropsychological battery included the CDT, the MMSE (Folstein et al., 1975; Štěpánková et al., 2015), the Wechsler Memory Scale―Third Edition Abbreviated Logical Memory I (Wechsler, 2011), the Auditory Verbal Learning Test (Bezdicek, Stepankova, et al., 2014), the Enhanced Cued Recall Test (Solomon et al., 1998; Urbanová et al., 2014), the Rey-Osterrieth Complex Figure (Drozdová et al., 2015; Meyers & Meyers, 1995), the Wechsler Adult Intelligence Scale–Third Edition Digit Span forward and backward and Digit Symbols (Wechsler, 1997), the TMT A and B (Bezdicek et al., 2012), the letter and semantic fluency tests (Nikolai et al., 2015), the Prague Stroop test (Bezdicek, Lukavsky, et al., 2015; Troyer et al., 2006), the BNT-15 (Mack et al., 1992), and the GDS 15 (Sheikh & Yesavage, 1986). The Institutional Review Board at Motol Hospital approved the study protocol.
To administer the CDT, the examiner placed a sheet with a predrawn clock face (pCDT protocol) in front of each participant and then stated the following instructions: “This is a clock, and I want you to write down all the numbers.” After the numbers were written, the examiner continued: “Now, please, draw in the hands set at thirteen forty-five.” For scoring each CDT, we chose three widely used scoring systems: the scoring systems by Shulman et al. (1993, 1986); Babins et al. (2008); and Cohen et al. (2000). The first mentioned system is the oldest one, and it is usually used as a quick screening tool for dementia (Ehreke et al., 2010; Pinto & Peters, 2009; Shulman et al., 1986). This 6-point scoring system (ranging from 5 to 0 for failing to draw the clock) is based on the overall evaluation of the clock, the severity of visuospatial errors, and errors in the representation of time. It can be used with a pCDT protocol without adaptation (hereafter Shulman CDT). The second, 18-point scoring system (Babins et al., 2008) is a modification of Freedman et al.’s (1994) 15-point scale. It separately evaluates the contour integrity of the clock face (2 points), the center (2 points), the numbers (6 points), the hands (6 points), and the general gestalt (2 points). This system was developed to examine subtle errors in the drawings that would be clinically valid for indicating a suspected MCI with probable progression to dementia. For the purpose of the pCDT protocol, we omitted the evaluation of contour integrity, which resulted in an adapted version of Babins’ 16-point scale scoring system (hereafter Babins CDT; Rubinova et al., 2014). The third scoring system, an 18-point scoring system (Cohen et al., 2000), was originally developed to investigate changes in clock drawing related to developmental maturity in school-age children (Cohen et al., 2000). Clock setting ability, according to Cohen et al. (2000), develops in children separately from graphomotor, visuospatial, and executive functions, and this was their rationale for separate scoring of the “conceptualization of time” (a 5-point scale) and the “construction of the clock face” (a 13-point scale). Again, we modified this system for the pCDT protocol and excluded one point for the evaluation of the concept of the clock. A result was an adapted version of Cohen’s scoring system, a 17-point scale (hereafter Cohen CDT). A strong feature of the latter two scoring systems is a more detailed evaluation of the clock drawing with possibly better predictive properties for MCI (Babins et al., 2008); on the other hand, those evaluations are more time-consuming and laborious. According to Mainland and Shulman (2013), expanding evaluations does not improve the effectiveness of the CDT; they opine that easier scoring systems are better. To the best of our knowledge, there are currently no normative data studies available using the scoring systems described above, with the exception of the Babins CDT (Santana et al., 2013), which is only for the variant without the predrawn clock face.
The clock drawings in this study were scored independently by three raters (AFM, TN, OB) experienced in all three of the aforementioned scoring systems (Shulman CDT, Babins CDT, Cohen CDT). The rating preceded a discussion of all scoring systems’ items or errors and an appropriate training on a small subsample of 30 pCDT protocols.
Statistical Analyses
The study samples were characterized through descriptive statistics. To estimate the reliability of the CDT, we analyzed three groups: the normative group, the naMCI group, as well as both groups together. The analysis of interrater reliability was based on the intraclass correlation coefficient (ICC; a two-way random analysis of variance model with absolute agreement to assess between raters’ variability; Crocker & Algina, 2008; Meyer, 2010). Then, the data of each scoring system scored by one rater (AFM) were correlated with each other to obtain intersystem correlations using Spearman’s rho. Also, the internal consistency of the two more detailed scoring systems was explored with Cronbach’s α based on unstandardized items (Sijtsma, 2009).
Further statistical tests were conducted with scores from the normative group by one rater (AFM), and considering the nonnormal distributions of data, nonparametric statistical techniques were used. For the analysis of differences between age groups, the Kruskal–Wallis H test, followed by the post hoc comparison of each of the two age groups using the Mann–Whitney U test with Bonferroni correction for multiple comparisons, were calculated. Groups based on the level of education and gender were analyzed by the Mann–Whitney U test as well. For the description of the normative data in the three scoring systems, we used the mean, the SD, the median, and percentiles.
To fulfill the third aim, the differences between the naMCI group and the age- and education-matched CG were calculated using the Mann–Whitney U test. Subsequently, we calculated the size of the area under the receiver operating characteristic curve (AUC), the values combined maximum of sensitivities and specificities, and the likelihood ratios (LR).
All tests were two-sided, and a significance level of .05 was adopted. The analyses were performed using IBM SPSS 20.0.
Results
The NG consisted of 390 healthy participants, and the sociodemographic characteristics of the sample are detailed in Table 1. The MMSE scores of the NG ranged from 25 to 30, M = 28.06 (±1.33). The naMCI and the paired CG consisted of 48 subjects. The sociodemographic and basic performance characteristics of those two groups are detailed in Table 2.
Interrater reliability (ICC) for all three scoring systems showed high agreement with the same significance level, p < .001, between all three raters, with slightly higher correlations for the more detailed scoring systems. The correlation coefficients are displayed in Table 3. Moreover, the scores of all three scoring systems were highly correlated to each other with the same significance level, p < .001, again with slightly higher concordance between the more detailed scoring systems. The correlation coefficients are presented in Table 4. The Babins CDT and the Cohen CDT showed similar low values of internal consistency: α = .446 (SEM = 1.33) and α= .358 (SEM = 1.60) in the case of the Normative group; α= .244 (SEM = 1.18) and α = .069 (SEM = 1.30) in the case of the naMCI group; and α = .424 (SEM = 1.33) and α = .345 (SEM = 1.57) for both groups together.
Interrater Reliability of the CDT Scoring Systems Between Three Raters.

Note. CDT = Clock Drawing Test; ICC = intraclass correlation coefficient; NG = normative group; naMCI = nonamnestic mild cognitive impairment group. All p < .001.
Intersystem Correlations of the CDT Scoring Systems.
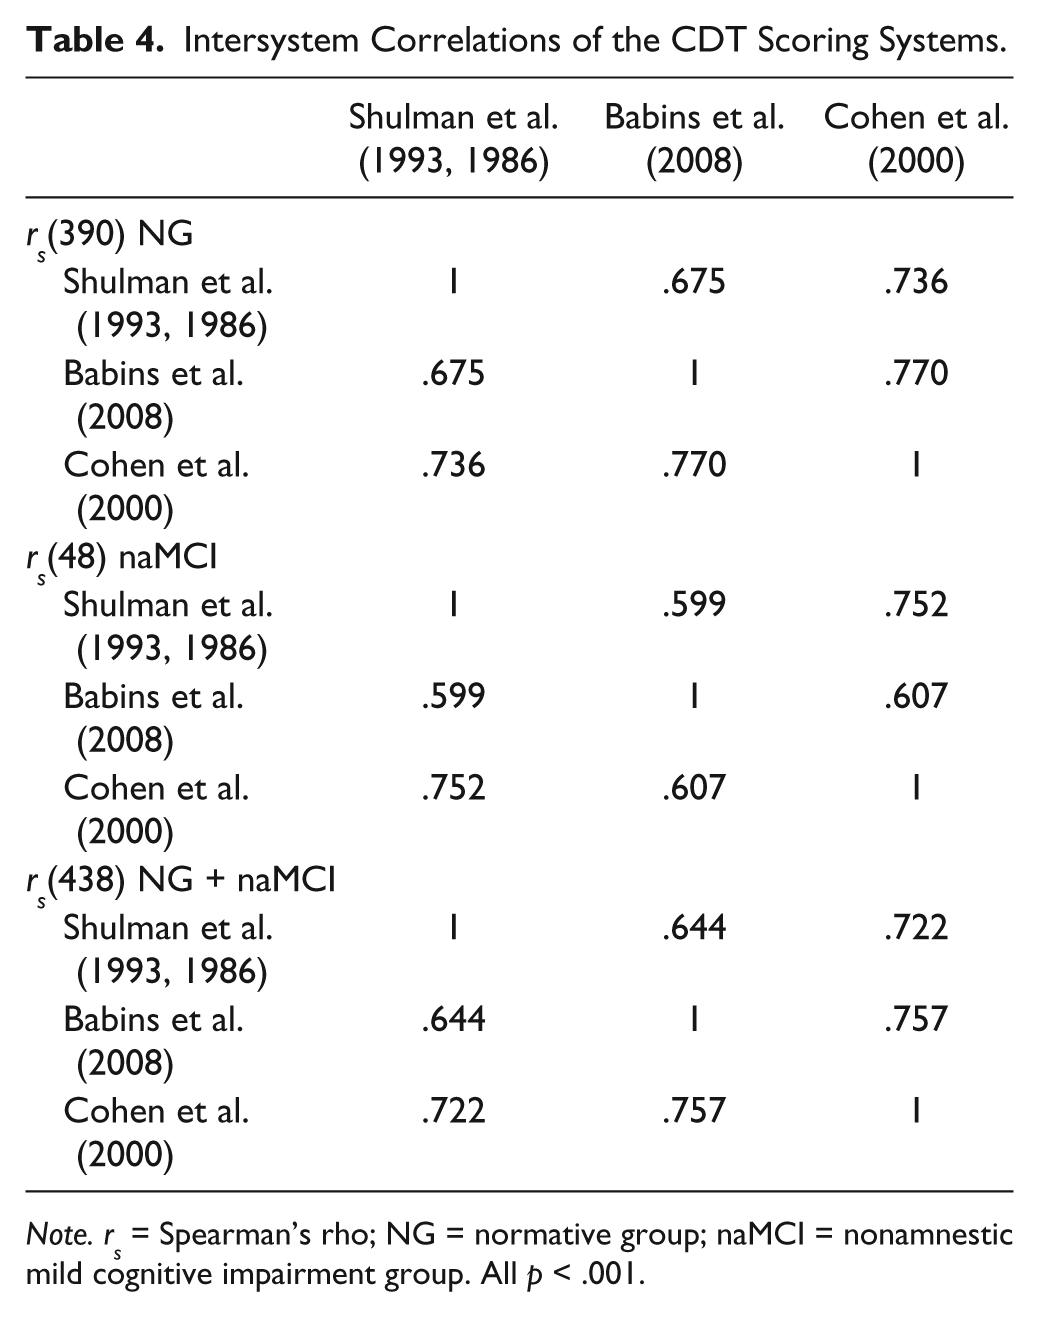
Note. rs = Spearman’s rho; NG = normative group; naMCI = nonamnestic mild cognitive impairment group. All p < .001.
We found clear age-related differences in CDT performance with the same significance level across all three scoring systems: Shulman CDT χ2(5) = 33.60; Babins CDT χ2(5) = 37.99; and Cohen CDT χ2(5) = 44.71, all p < .001. The subsequent post hoc analysis revealed that differences based on adjusted p = .0033 (p = .05/15) values were still significant only between some age groups. For normative data, considering the results of the statistical analyses, we decided to merge the original six age group classifications (61-64, 65-69, 70-74, 75-79, 80-84, 85-94) into larger age groups with broader ranges: 61 to 74 and 75 to 94 years of age. Further analysis also revealed differences in CDT performance regarding the level of education: Shulman CDT U = 13910, p < .001; Babins CDT U = 13744.5, p < .001; and Cohen CDT U = 15244.5, p = .001. Hence, we used two predefined education levels for providing normative data values: higher and lower. For age- and education-related influence on the CDT scores, see Table 5. The analysis regarding gender differences in CDT performance did not reveal significant differences in any of the three scoring systems; stratification according to gender was therefore not used in the normative data. We confirmed the need to provide normative data for the Czech population based on two demographic variables: age and education. Tables of the normative data are given in the appendix (Tables A1-A3).
Effect of Sociodemographic Variables on the CDT Scores.

Note. CDT = Clock Drawing Test; M = mean; SD = standard deviation; Lower = a level of formal education measured by a number of years of schooling (8-12 years of formal education); Higher = college-level or higher-level education (12 or more years in every case with a special unitary exam after the 12th year).
Finally, a difference was detected in the CDT performance between the naMCI and the CG: Shulman CDT U = 369, p < .001; Babins CDT U = 810.5, p = .010; and Cohen CDT U = 673, p < .001. The groups did not differ in age, education level, or gender (Table 2). The AUC showed the values .84 (95% confidence intervals [CIs; .76, .92]), p < .001 for Shulman CDT, and an AUC = .71 (95% CIs [.60, .81]), p < .001, for Cohen CDT, suggesting an acceptable ability to discriminate the groups; while an AUC = .65 (95% CIs [.54, .76]), p = .012, for Babins CDT revealed a slightly lower discriminative ability. The values of sensitivities and specificities for selected cutoff scores are listed in Table 6.
Results for Selected Cutoff Scores of the CDT Scoring Systems.
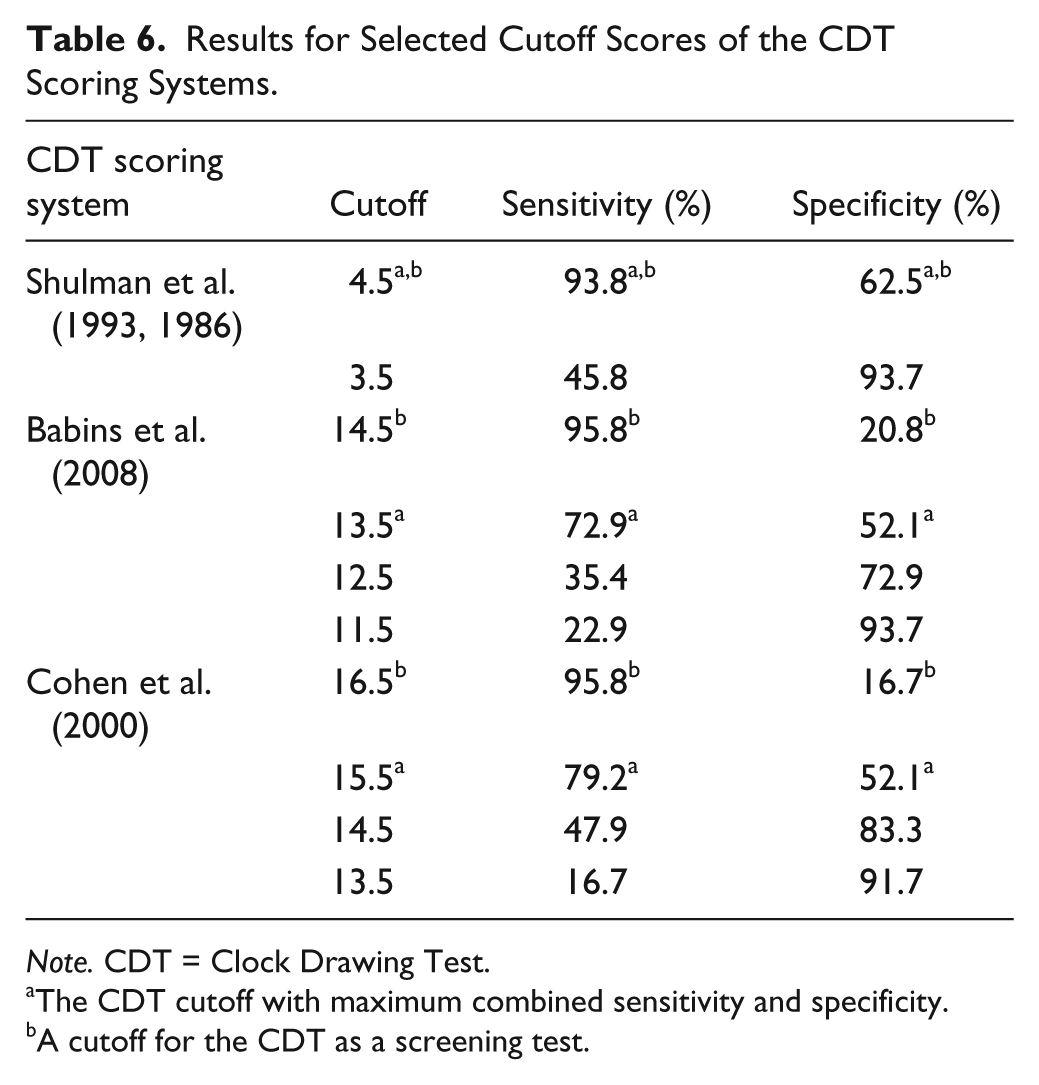
Note. CDT = Clock Drawing Test.
The CDT cutoff with maximum combined sensitivity and specificity.
A cutoff for the CDT as a screening test.
Discussion
The main goal of the present study was a determination of the reliability of CDT scoring systems. We performed an analysis of interrater reliability between three independent raters of three different CDT scoring systems. Furthermore, we wanted to model this analysis on data of older and very old adults and provide percentile norms of the CDT using a predrawn CDT protocol to allow a more objective assessment of the CDT. Additionally, we showed the ability of the CDT to differentiate between healthy older adults and patients with naMCI to point out to the clinical usefulness of the CDT.
We focused on quantifying the degree of agreement between independent raters, because the assessment of interrater reliability is necessary in clinical tools that are based on rating. The oldest currently used scoring system, that of Shulman, showed a wide range of interrater reliability in previous studies, and our results were consistent with the studies with higher correlation coefficients, r > .70 (Rubinova et al., 2014; Shulman et al., 1993). The results for the other two adapted scoring systems of Babins and Cohen were very high and consistent with previous studies, in our case, r ≥ .85 (Cohen et al., 2000; Rubinova et al., 2014). The reason for a slight difference between the brief and the complex scoring systems may lie in the number and details in the scoring criteria of the Babins CDT and the Cohen CDT, which make them more accurate and objective. In contrast, the scoring by Shulman is less detailed, and as a result, may be less accurate or more subjective (Hubbard et al., 2008). The strength of our study lies in the number of raters (three raters) and the number of analyzed data (Normative group, N = 390; and naMCI group, N = 48; age range of the samples: 61-94 years), which exceeds the previously published studies (Ehreke et al., 2011; Fuzikawa et al., 2003; Jørgensen et al., 2015; Seigerschmidt et al., 2002; Storey et al., 2001). Based on our analyses, we can conclude that all chosen scoring systems can be recommended after appropriate training in clinical practice; however, the complex scoring systems of Babins and Cohen seem to have slightly better results in interrater reliability in comparison to the short one of Shulman. Moreover, the reliability of the scoring systems was also proven by intersystem correlations, which revealed a good level of consistency (r = .60-.77) with slightly higher concordance between the more detailed scoring systems.
The internal consistency of the Babins and Cohen scoring systems, which employ covariances among items, may be considered to be poor. According to our assumption, this finding may be related to the heterogeneity of separate evaluations, for example, in Babins, a 16-point scale, evaluating the contour integrity of the clock face separately (2 points), the numbers (6 points), the hands (6 points), and so on, which taps different mental abilities that are not stable across different subjects; hence, we cannot obtain high internal consistency coefficients (Meyer, 2010). We did not calculate the consistency across items within the Shulman CDT, because the rating scale of this system (0-5 points) is ordinal, and subjects were not assessed for each item but for their overall performance. Overall, the data and results of the study can be used as a base for a generalizability theory of CDT scoring (Crocker & Algina, 2008).
The results of the present study further confirmed that age has a decremental influence on performance on the CDT, and this finding was in accordance with previous studies on healthy older adults (Freedman et al., 1994; Hubbard et al., 2008). Moreover, some recent studies described a pattern of significant decline in the CDT between 70 and 80 years of age (Bozikas et al., 2008; Caffarra et al., 2011; Jurado & Rosselli, 2007; Sugawara et al., 2010; Wardill & Anderson, 2008), and our study supports this finding as well, especially between the ages of 75 and 79 across all scoring systems. These findings found their place in the stratification of age groups for normative data; thus, we merged the six original age groups into two new groups: 61 to 74 and 75 to 94 years of age. Our results also added to the evidence that education level has a significant influence on CDT performance and were concordant with the results of a Greek normative data study (Bozikas et al., 2008), although discordant with an Italian study (Caffarra et al., 2011), which reports no influence of education on CDT performance. However, these results may have been influenced by the lower number of subjects in that study. Moreover, the stratification of education may underlie the discordant results, because some studies divided education into higher and lower, as in the present study or other studies (Hubbard et al., 2008). In the Czech Republic, a higher education level means the completion of a unitary exam regulated by the State that enables the student to enter a university, while some other take into consideration the total number of years of schooling (Bozikas et al., 2008; Caffarra et al., 2011; Sugawara et al., 2010). Neither approach is fully reconcilable and may result in overlapping education groups. Regarding the influence of gender on CDT performance, we did not find any difference, which is in accordance with the Greek normative data (Bozikas et al., 2008). Even though it was proven that there may be gender differences, these relate only to the CDT without the predrawn circle (Stewart et al., 2001; Sugawara et al., 2010). However, even in this case, we saw a lower number of subjects in the study by Sugawara et al. (2010), which was not the case in the present study, with a relatively large sample and regional representativeness for the Czech Republic.
We presented normative data (percentile values) for a more objective differentiation of CDT performance in aging. We found that most of the subjects in our normative sample scored near the ceiling across all three scoring systems. This finding can be interpreted as a ceiling effect, that is, healthy older adults obtain very high scores due to the low level of difficulty in simple screening measures such as the CDT in healthy aging (Hubbard et al., 2008; Ratcliff, Dodge, Birzescu, & Ganguli, 2003; Shulman, 2000). However, we found two important points. First, only part of the healthy older adults managed to draw the clock without error, especially in the more detailed systems of Babins and Cohen. Second, even though the vast majority of subjects achieved very high scores, we also saw some lower scores, notably in older ages. The results show a considerable amount of variability in CDT performance in very old age, and these findings have been corroborated across different cultures by previous studies (Bozikas et al., 2008; Caffarra et al., 2011; Hubbard et al., 2008; Sugawara et al., 2010). This evidence about wide variability in CDT performance reminds us that normative data studies of the CDT are needed for accurate differential reasoning in evidence-based neuropsychological practice (Chelune, 2010; Hubbard et al., 2008; Mitrushina et al., 2005).
In the case of the third aim, we replicated the previous study by Rubinova et al. (2014) in its comparison of the performance on the CDT of a healthy older group and a group with mild cognitive impairment (MCI). However, in contrast to that study, we included persons with nonamnestic MCI, instead of a group with mild amnestic deficit. In our analysis, we showed the potential of three scoring systems to distinguish between the groups, while according to Rubinova et al. (2014), only more detailed scoring by Babins and Cohen were able to discriminate. To examine the utility of the CDT as a screening test, we combined values of maximum sensitivity and specificity assuming the value of sensitivity ≥80%. In the case of the Babins CDT, the optimal value of sensitivity was 96%, LR+ = 1.22 (specificity = 21%, LR− = .19), and in case of the Cohen CDT, sensitivity = 96%, LR+ = 1.16 (specificity = 17%, LR− = .24). Our findings revealed slightly better results for the Shulman CDT, the optimal value of sensitivity was 94%, LR+ = 2.54 (specificity = 63%, LR− = .1), suggesting its higher, but still not satisfactory, ability to truly recognize both naMCI patients and healthy participants. All three CDT scoring systems demonstrated usefulness in detecting naMCI patients if the cognitive impairment is actually present (true positive results); however, at the same time, there is a high possibility of including subjects with no evidence of impairment (false positive results).
A limitation of this study is the fact that our NG did not undergo further medical evaluation, for example, a brain magnetic resonance imaging, to have additional sources of evidence about the participants’ health. However, our study is comparable in design and inclusion criteria to similar studies in this field (Caffarra et al., 2011; Santana et al., 2013; Sugawara et al., 2010). Then, we are aware of using inclusion criteria that were not very strict for the NG in the study; the purpose was to avoid providing norms based only on cognitively highly functioning healthy persons. For more on the rationale and inclusion criteria of the NANOK study, see Štěpánková et al. (2015). Further potential sources of bias may lie in the cultural background or ethnicity of our subjects (Menon, Hall, Hobson, Johnson, & O’Bryant, 2012; Stewart et al., 2001); however, Czechs are Caucasians and share the same or very similar cultural characteristics as other nations in the Euro-Atlantic space. Our data were not collected solely in Prague but also in most other regions (in 12 out of 14) of the Czech Republic and may be considered regionally representative. Although two of the scoring systems were modified by reducing by some points to be used for a predrawn CDT, this variation should not change the results, as healthy older adults are able to construct an intact clock contour (Freedman et al., 1994), but we could lose some variability in the performance of the naMCI group. The decision to include a CDT with predrawn circle was based on our previous research (Rubinova et al., 2014) and clinical experience.
In conclusion, our study revealed high interrater reliability for three widely used CDT scoring systems (by Shulman, Babins, and Cohen, with better results for the latter more detailed scoring systems) in a large sample of healthy older adults (N = 390) and even in a clinical sample (N = 48). Furthermore, we confirmed the need for culturally appropriate normative data for old and very old adults regarding simple cognitive screens such as the CDT for use in clinical practice. The present study showed conclusively the influence of age and education, but not of gender, on CDT performance. However, we do not support using the CDT as the only cognitive screening instrument to differentiate naMCI from healthy older persons due to the unsatisfactory values of specificity (Type II error).
Footnotes
Appendix
Frequency Table of Cohen CDT.

| Score | Frequency | Percentage | Cumulative percentage |
|---|---|---|---|
| 7 | 2 | 0.5 | 0.5 |
| 8 | 3 | 0.8 | 1.3 |
| 9 | 7 | 1.8 | 3.1 |
| 10 | 13 | 3.3 | 6.4 |
| 11 | 17 | 4.4 | 10.8 |
| 12 | 37 | 9.5 | 20.3 |
| 13 | 61 | 15.6 | 35.9 |
| 14 | 61 | 15.6 | 51.5 |
| 15 | 95 | 24.4 | 75.9 |
| 16 | 69 | 17.7 | 93.6 |
| 17 | 25 | 6.4 | 100.0 |
| Total | 390 | 100.0 |
Note. CDT = Clock Drawing Test.
Acknowledgements
The authors thank all the external administrators: Eva Biedermannova, Pavla Davidova, Lenka Freharova, Marketa Holubova, Karolina Horakova, Adela Jencova, Olga Kozicka, Lenka Malkova, Jiri Michalec, Barbora Mnukova, Vlasta Novotna, Klara Patlichova, Jana Pecinkova, Lucie Prazakova, Ilona Sedmidubska, Lenka Sreibrova, Nina Sterbova, Tomas Vacha, Martin Vaverka, Zuzana Velkoborska, Michaela Viktorinova, and Tomas Vilimovsky.
Authors’ Note
All data can be obtained from the first author on request.
Declaration of Conflicting Interests
The authors declared no potential conflicts of interest with respect to the research, authorship, and/or publication of this article.
Funding
The authors disclosed receipt of the following financial support for the research, authorship, and/or publication of this article: The work was supported by grants from the Internal Grant Agency of the Ministry of Health of the Czech Republic under Grant Number IGA MZCR NT 13145-4/2012; by the project “National Institute of Mental Health (NIMH-CZ),” under Grant Number ED2.1.00/03.0078; and the European Regional Development Fund and by the project FNUSA-ICRC (No. CZ.1.05/1.1.00/02.0123).