



Abstract
Keywords
Evidence-Based Treatments
Over the past several decades, efficacious treatments have been developed for various emotional and behavior problems for both youth (Chorpita et al., 2011; Kazdin & Weisz, 1998, 2003) and adults (Ayers, Sorrell, Thorp, & Wetherell, 2007; Ponniah & Hollon, 2008). These effective treatments span different theoretical orientations, including but not limited to, cognitive behavioral therapy for depression (Hofmann & Smits, 2008; Ost, 2008; Siev & Chambless, 2007), behavioral therapy for anxiety (Ekers, Richards, & Gilbody, 2008; Norton & Price, 2007), interpersonal psychotherapy for depression (Cuijpers, van Straten, Andersson, & Van Oppen, 2008), short-term psychodynamic therapy (Leichsenring, 2001; Shedler, 2010), and family therapy for conduct and eating disorder problems (Carr, 2009; Cottrell & Boston, 2002). The “dodo bird verdict”—that all treatments are equally effective—no longer seems to be true (Beutler, 2002; Crits-Christoph et al., 1991), and psychosocial interventions appear to have differential effectiveness depending on the therapeutic content delivered. These treatments with demonstrated research support are known as evidence-based treatments (EBTs).
Dissemination Efforts of EBTs
Despite these EBT developments, a large portion of mental health providers in the field continue to deliver treatments that have little to no empirical support (Baumann, Kolko, Collins, & Herschell, 2006; Weersing & Weisz, 2002; Zima et al., 2005)—and when tested against EBTs, these non-EBTs delivered by community clinicians tend to do worse than EBTs (Weisz et al., 2013; Weisz, Jensen-Doss, & Hawley, 2006). This is unfortunate, particularly given the amount of distress and long-term impairment associated with mental health and behavioral problems when left unresolved (e.g., Compton, Burns, Egger, & Robertson, 2002; Langley, Bergman, McCracken, & Piacentini, 2004; Rapaport, Clary, Fayyad, & Endicott, 2005). Given this problem, researchers have begun to focus on how to disseminate EBTs more effectively to practicing clinicians in the field (McHugh & Barlow, 2010). Efforts taken so far to increase the dissemination and implementation of EBTs have included (a) increasing accessibility of effective treatments (e.g., through publishing lists of effective practices online, such as via the American Psychological Association Division 12 Society of Clinical Psychology’s “Website on Research-Supported Psychological Treatments,” www.div12.org/PsychologicalTreatments/index.html), (b) increasing the flexibility of EBT approaches (e.g., Chorpita, Daleiden, & Weisz, 2005), and (c) funding agencies increasing support for training therapists to deliver EBTs in “real world” clinical settings (Clark et al., 2009).
EBTs in Cross-Cultural Contexts
EBTs have also begun to be tested and developed for implementation in non-English speaking settings and countries, including in Cambodia (Hinton et al., 2005; Otto et al., 2003), Vietnam (Hinton et al., 2004), Iran (e.g., Ebesutani, Helmi, Fierstein, Taghizadeh, & Chorpita, 2016; Jaberghaderi, Greenwald, Rubin, Zand, & Dolatabadi, 2004), Japan (Asukai, Saito, Tsuruta, Kishimoto, & Nishikawa, 2010), and South Korea (Park, Oh, Oh, Jung, & Na, 2014). Wide-scale adoption and implementation of EBTs in these countries have however been also limited, including in South Korea (e.g., Ebesutani & Shin, 2014). Several of these countries are in dire need of more effective mental health services. For example, anxiety and depression are highly prevalent among Korean adolescents (Ahn, Ebesutani, & Kamphaus, 2014; Ahn & Shin, 2012), and suicide rates are cited as the most common causes of death among Korean youth (Kim, 2003).
Measurement of EBT Attitudes
Across the world, uptake and implementation of EBTs in “real-world” settings have been slow and have faced with obstacles (Strupp & Anderson, 1997; Westen, Novotny, & Thompson-Brenner, 2004). Researchers have thus recently begun to step back and ask more basic questions regarding why clinicians are not adopting and using EBTs, despite their increased availability, flexibility, and training opportunities. Diffusion of innovation theory (Rogers, 2003) suggests that positive attitudes toward the “new technology” is important for successful dissemination and implementation. Assessment instruments have therefore been recently developed to measure clinician’s attitudes toward EBTs. The Evidence-Based Practice Attitude Scale (EBPAS; Aarons, 2004) was one measure developed for this purpose. The EBPAS asks questions about EBTs, such as “appeal” of EBTs, with a particular emphasis on manualized treatments. Through this measure, researchers found that therapists tend to view manualized EBTs as rigid and inflexible. Borntrager, Chorpita, Higa-McMillan, and Weisz (2009) modified the EBPAS and created the Modified Practice Attitudes Scale (MPAS), which does not specifically ask about treatment manualization, per se, but rather about the empirically supported nature of EBTs in general.
The MPAS has since been used in a variety of contexts, including examining changes in attitudes following professional trainings of EBTs (Borntrager et al., 2009) and university courses on evidence-based practices (Bearman, Wadkins, Bailin, & Doctoroff, 2015). The MPAS has also been used to understand beliefs held by clinicians hindering their adoption of EBTs (Lilienfeld, Ritschel, Lynn, Cautin, & Latzman, 2013) and also significant correlates of EBT attitudes, such as readiness to change and perceived client barriers to implementation (Lewis & Simons, 2011).
Additionally Needed Psychometric Validation of the MPAS
Despite increased use of the MPAS across a variety of settings to measure this important aspect of behavior change (i.e., attitudes; Rogers, 2003), relatively little work has been published on its psychometric properties. Borntrager and colleagues (2009) reported on its reliability (α = .80) and that the MPAS correlated significantly with the EBPAS scores (i.e., another attitude measure; r = .77) supporting its construct validity. However, no studies to date have examined the factor structure of the MPAS. This is somewhat concerning, particularly given that the MPAS includes both reversed-worded and non–reversed-worded items—a feature of self-report scales that can be problematic given that it may introduce wording “method effects” that can complicate factor structures and scoring procedures (Brown, 2003; Marsh, 1996). For example, van Sonderen, Sanderman, and Coyne (2013) found that the inclusion of both non–reversed-worded and reversed-worded items can contribute to respondent confusion while not adequately preventing response acquiescence. It also may produce spurious factors in exploratory factor analysis (EFA) whereby results often show a “2-factor structure,” when in reality, the data are unifactorial in nature (albeit with method effects; see Brown, 2006). Studies are thus needed to investigate the psychometric properties of the MPAS (among both U.S. and non-U.S. therapists), particularly while exploring for potential wording “method effects.”
The Present Study
The purpose of the present study was thus twofold. First, we sought to create a Korean version of the MPAS and examine its psychometric properties for use in the Korean mental health system. Second, we sought to examine for the first time the factor structure underlying the MPAS. 1 We were particularly interested in whether any modifications would be needed due to the presence of “method effects” introduced by the reversed- and non–reversed-worded items.
We predicted that wording “method effects” would have to be considered to achieve a well-fitting model with adequate psychometric properties. Even though the MPAS is theoretically posited to be a unidimensional scale (reflecting attitudes toward EBTs), not appropriately controlling for “method effect” could lead to a poorly fitting unidimensional model making it appear as though multiple factors are present, when in fact only a single attitude factor is responsible for meaningful item variation (as commonly found in the literature; Bagner, Storch, & Roberti, 2004; Fresco, Heimberg, Mennin, & Turk, 2002). When comparing attitudes of EBTs between Korean and U.S. therapists, we also hypothesized that Korean therapists would report significantly more negative attitudes toward EBTs compared with U.S. therapists. This is because dissemination of EBTs in Korea has begun relatively more recently compared to the United States. We also hypothesized that the methods effects associated with the original MPAS would lead to biased total scores in these group comparisons when and when not accounting for these method effects.
Method
Participants
Korean Sample
The Korean sample included 283 participants from the fields of clinical, counseling, health, and school psychology who completed the Korean version of the MPAS (K-MPAS) as part of a survey related to evidence-based practices in psychology in Korea. This sample included 256 females (90.5%) and 25 males (8.8%). Two participants did not report their gender. Ages ranged from 22 to 50 years (M = 30.0 years, SD = 7.73). All participants were Korean and fluent in Korean. Additional background information on the participants may be seen in Table 1.
Participants Background Information.
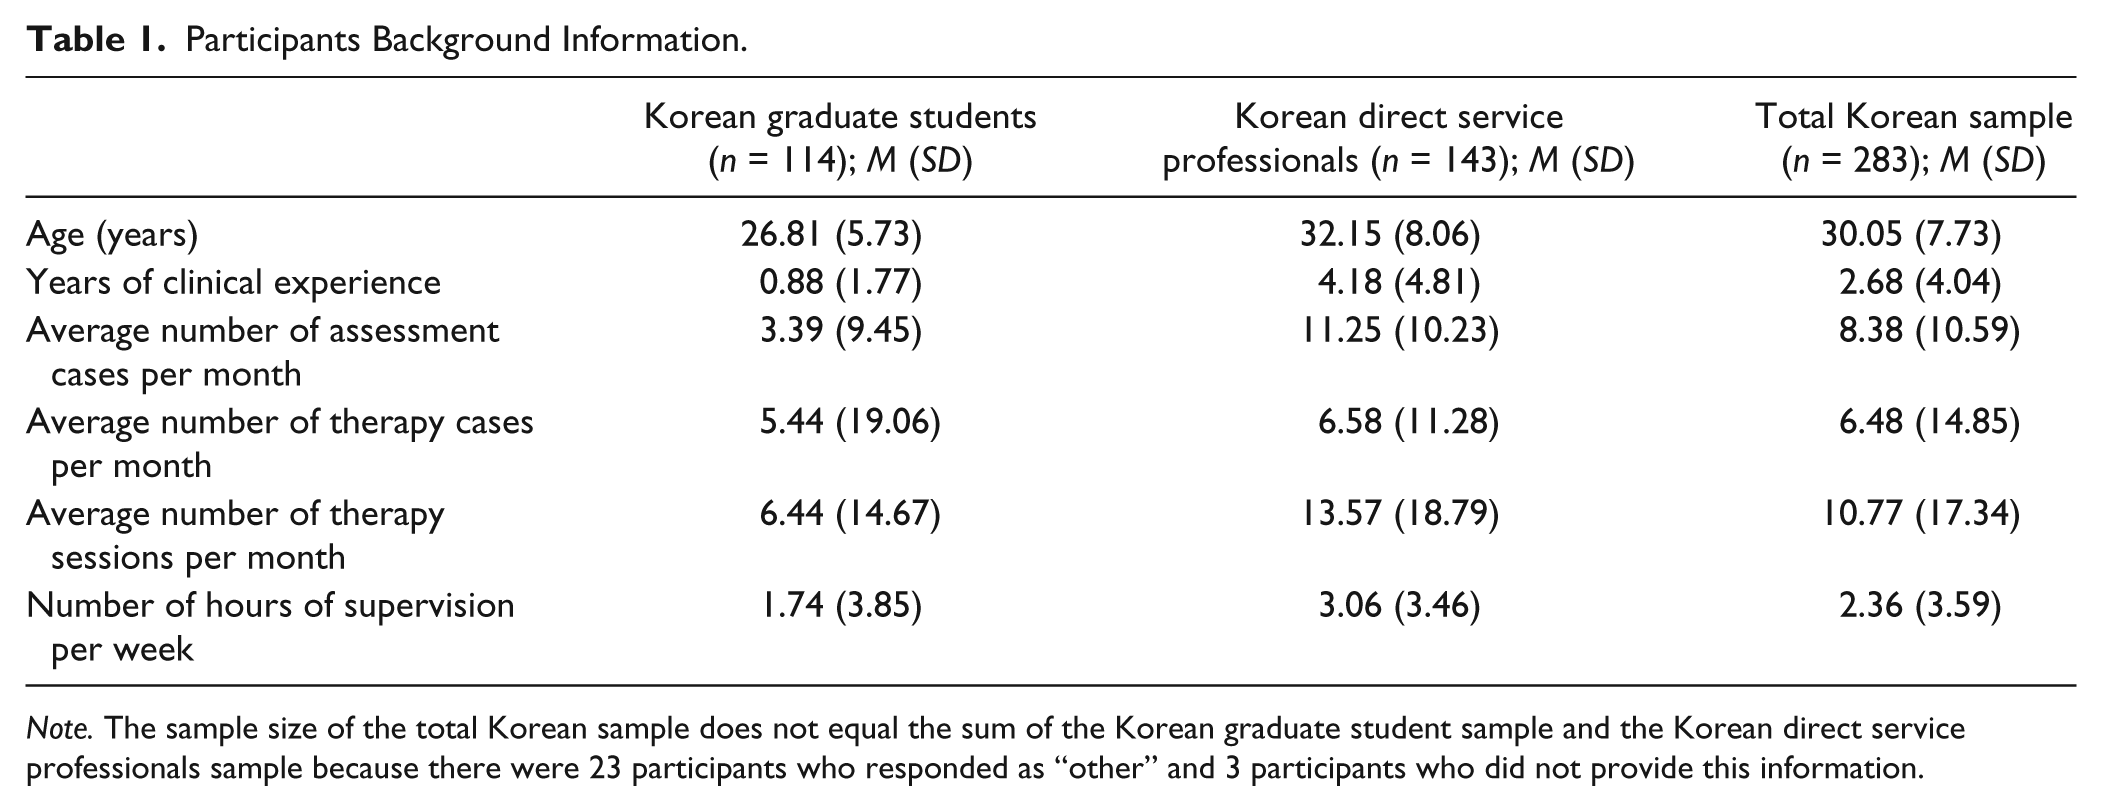
Note. The sample size of the total Korean sample does not equal the sum of the Korean graduate student sample and the Korean direct service professionals sample because there were 23 participants who responded as “other” and 3 participants who did not provide this information.
U.S. Sample
The U.S. sample included 189 therapist participants from the Montana mental health system. The gender composition of this therapist sample was 60% female and 40% male. A total of 77 therapists reported having a master’s degree (40.7%), 45 reported having a PhD (23.8%), and 1 reported having an “other” degree (0.5%); 66 therapists (34.9%) did not report their degree. The most common reported primary theoretical orientation was cognitive behavioral (n = 78, 41.3%), followed by eclectic (n = 38, 20.1%) and then psychodynamic (n = 18, 9.5%). Other primary theoretical orientations at rates of less than 5% included humanistic, interpersonal, client-centered, solution-focused, family systems, and Gestalt. Years of training ranged from 1 year to 35 years (M = 6.7 years, SD = 5.42). Participants reported an average of 17.4 years in practice (SD = 10.53), with a range of 0.5 to 45 years. All participants of this U.S. sample were American and fluent in English.
Procedure
Korean Sample Procedures
We sought to obtain responses from participants from a variety of areas in the mental health field in South Korea. We therefore first administered the MPAS measure (along with other related questionnaires) to psychology graduate students and direct service professionals attending a clinical psychology conference. We then created an online version of this survey and sent it to a listserv of school counselors. Last, we sent the same online survey to the Korean Clinical Psychology Association listserv. Participants who consented to participate completed the questionnaires anonymously. A random subset of participants was rewarded with gift certificates for their participation. All study procedures were approved by the university institutional review board.
U.S. Sample Procedures
U.S. therapists were identified through lists of psychologist and professional counselor licensees in the Montana mental health system. One thousand-five hundred anonymous surveys were sent to these individuals. A total of 191 participants returned their packets (response rate = 12.7%). In the mailed survey packet, participants were given an informed consent form explaining the full purpose of the study, that their participation was voluntary, that their return of the packet means that they agree to participate, and that their information will remain anonymous unless they chose to provide their name and phone number to be included in a $50 gift card raffle.
Measures
The Modified Practice Attitudes Scale
The MPAS (Borntrager et al., 2009) was developed in the United States to measure therapists’ attitudes toward EBTs. The original MPAS includes eight items, among which five items are reversed scored (Items 2, 3, 5, 7, and 8). Respondents are asked to rate the extent to which they agree with each item on a 5-point Likert-type scale, ranging from 0 (not at all) to 4 (to a very great extent). Reliability of the MPAS total scale score (estimated via internal consistency) based on a U.S. sample of therapists was reported to be .80 (Borntrager et al., 2009). No studies to date have reported on its factor structure.
The Korean Version of the Modified Practices Attitude Scale
The K-MPAS was based on the original 8-item English MPAS (Borntrager et al., 2009). For the translation of the MPAS from English to Korean, we followed the recommended back-translation procedures outlined by Brislin (1970). First, we had a bilingual MA graduate student in clinical psychology translate the MPAS items into Korean. We then had another bilingual MA graduate student in clinical psychology back-translate the Korean MPAS items into English. The research team (which included a PhD-level American clinical psychologist and a PhD-level Korean clinical psychologist) compared the back-translation with the original version to identify and resolve discrepancies. The eight MPAS items translated into Korean may be seen in the appendix.
Korean Version of the Attitudes Toward Standardized Assessment Scales
The Korean Version of the Attitudes Toward Standardized Assessment Scales (K-ASA; Ebesutani & Chung, 2014) is a 12-item measure developed to measure therapists’ attitudes toward standardized assessment scales. The K-ASA is based on the U.S. version of the ASA (Jensen-Doss & Hawley, 2010), and the K-ASA yields a total score and two subscales: “Benefit over Clinical Judgment” and “Practicality” of standardized assessment scales. Respondents are asked to rate items on a 5-point Likert-type scale, ranging from 1 (strongly disagree) to 5 (strongly agree). Higher scores indicate more negative attitudes toward standardized clinical assessment. The K-ASA demonstrated a well-fitting factor structure and acceptable reliability and validity indices (Ebesutani & Chung, 2014). Internal consistency of the ASA total score in the present sample was acceptable at .70.
Korean Version of the Knowledge of Evidence-Based Services Questionnaire
The Korean version of the Knowledge of Evidence-Based Services Questionnaire (K-KEBSQ; Ebesutani, 2014) was based on the original KEBSQ developed in the U.S. by Stumpf, Higa-McMillan, and Chorpita (2009). The KEBSQ measures knowledge of EBT practices for youth emotional and behavioral disorders. The KEBSQ contains 40 evidence-based and non-EBTs practices for the areas of anxious/avoidant, depressed/withdrawn, disruptive behavior, and attention/hyperactivity. Respondents are asked to indicate all problem areas where the practice has empirical support for effectiveness. All correct answers are summed to create a total knowledge score ranging from 0-160, with higher scores indicating more knowledge of EBTs. This questionnaire was reported as a stable and valid instrument to measure knowledge of EBTs (Stumpf et al., 2009). The total score was used in the present study as our criterion measure of EBT knowledge.
Data-Analytic Plan
Subsamples
We randomly divided our Korean sample (N = 289) into a random EFA subsample (n = 142) and a random confirmatory factor analysis (CFA) subsample (n = 141) for analyses described below.
Factor Analyses and Fit Indices
We used Mplus Version 7.11 (L. K. Muthén & Muthén, 2010) to conduct all factor analyses. Since the MPAS data were ordinal in nature, we treated these data as categorical and computed matrices based on polychoric correlations (Jöreskog, 1994; Olsson, 1979). We also used the robust weighted least squares with mean and variance adjustment (WLSMV) estimator, which has been recommended when conducting analyses on ordinal data (Flora & Curran, 2004; B. Muthén, du Toit, & Spisic, 1997). We used the following fit indices to evaluate model fit. Comparative fit index (CFI) values greater than .90 and .95 were used as benchmarks for acceptable and good fit, respectively (Hu & Bentler, 1999). Root mean square error of approximation (RMSEA) values less than .08 and .05 were used as benchmarks for acceptable and good fit, respectively (Browne & Cudeck, 1993). We also evaluated chi-square, which assesses the magnitude of discrepancy between the sample and fitted covariances matrices (Hu & Bentler, 1999). Good model fit is supported when the chi-square value is not significant (given its degrees of freedom; Kline, 2005).
Exploratory Factor Analysis
We first conducted EFA using Mplus Version 7.11 (Muthén & Muthén, 2010) to examine the factor structure of the K-MPAS data. We instructed Mplus to extract (a) a one-factor model (based on the original measure positing a single total score; Borntrager et al., 2009), (b) a two-factor model, given that the MPAS has both reversed-worded (e.g., “Evidence-based treatments do not allow me to tailor my therapy to each client’s individual needs”) and non–reversed-worded items (e.g., “I like using evidence-based treatments because of the structure they provide”), 2 and (c) a three-factor model to check for more than two factors.
We used multiple criteria to determine the number of factors underlying the MPAS. First, we examined eingenvalues; in particular, we examined the scree plot and the point at which the eingenvalues begin to “level-off” as indicative of the number of underlying factors (Costello & Osborne, 2005). Second, we examined the fit indices of each model to examine how well each model fit the data. Third, we considered the interpretability of the factor structures based on the item content of each factor. For example, if in the two-factor model, one of the factors consists of only the non–reversed-worded items, and the second factor consists of only the reversed-worded items, then the interpretation of the item-to-factor content mapping would suggest that this apparent “two-factor” model actually represents “method effects” due to the reversed-worded items—a common phenomenon in factor analytic research (Brown, 2006). Last, each latent factor had to have at least three items with significant factor loadings. Although “significance” of factor loadings in EFA used to be inferred based on the size of the factor loadings (e.g., >.30; cf. McDonald, 1999), Mplus now offers the ability to estimate the significance of each factor loading in an EFA context (L. K. Muthén & Muthén, 2010).
Confirmatory Factor Analysis
Standard One-Factor Model
We conducted CFA in the second half of the Korean sample to examine the fit of the original 8-item one-factor model (Borntrager et al., 2009). We then examined a one-factor model while controlling for method effects, as described directly below.
One-Factor Model, Controlling for Method Effects
In the context of CFA, “method effects” (i.e., systematic sources of item variance—such as due to the presence of reversed-worded and non–reversed-worded items) can be controlled for via two main techniques. The first is called (a) the correlated traits–correlated uniqueness (CT-CU) modeling approach. This CT-CU approach involves correlating error terms among the reversed-worded (or non–reversed-worded) items of a measure (see Corwyn, 2000; Marsh, 1996; Marsh, Scalas, & Nagengast, 2010). The theory underlying this approach is that error terms, under normal situations, are uncorrelated with each other. However, due to the same wording nature of either the reversed-worded (or non–reversed-worded) items, each set of reversed-worded (or non–reversed-worded) items are presumed to be affected by a portion of (nonrandom) error that is correlated with each other. This is modeled by correlating their error terms. The other way to control for method effects is called (b) the latent method factor (LMF) approach, which is also called the correlated traits–correlated method approach. This LMF approach involves creating and modeling (a) a LMF to account for the reversed-worded items and (b) an LMF to account for the non–reversed-worded items, or both (Bagozzi, 1993; Marsh & Grayson, 1995). Both CT-CU and correlated traits–correlated method approaches have been recommended and offer unique advantages (see Bagozzi, 1993; Brown, 2006; Tomas, Hontangas, & Oliver, 2000). For the present study, we used the CT-CU modeling approach to control for and model method effects (via correlating their error terms).
U.S. and Korean Samples
To examine the cross-cultural applicability of the newly identified model, we examined the CFA model in both the Korean sample and U.S. sample. We used the same fit index cutoffs noted above to examine model fit.
Reliability
We then examined reliability of the resulting items via internal consistency. We used .70 as the general cutoff score for acceptable reliability.
Validity
To examine convergent validity, we examined bivariate correlations between the K-MPAS total score and the K-ASA total score. This analysis examined whether attitudes toward EBTs converged significantly with attitudes toward evidence-based assessments (EBAs). We hypothesized that these correlations would be positive and significant. As an additional validity test, we also examined bivariate correlations between the K-MPAS total score and the K-KEBSQ total score. This analysis examined whether attitudes toward EBTs converged significantly with knowledge of EBTs. Significance was set at p < .05 for these analyses.
Cross-Cultural Comparison of Means
We then compared whether the U.S. and Korean therapists differed with respect to their attitudes toward EBTs across these two countries. We conducted a one-way analysis of variance to examine for significant differences across groups (p < .05).
Results
Exploratory Factor Analysis
The eigenvalues based on the Korean sample were as follows: 2.30, 1.69, 1.04, 0.83, 0.66, 0.55, 0.51, and 0.43. The scree plot can be seen in Figure 1. Based on the scree plot, it appears as though two factors are present. Examination of fit indices also suggested the presence of two-factors. Specifically, and consistent with a “method effects” model, fit indices for the one-factor EFA model were poor (RMSEA = .146, CFI = .689), and fit indices for the two-factor EFA model were excellent (RMSEA = .063, CFI = .962). The correlation between the two “factors” was nonsignificant (r = .15, p = .194). Although these fit indices suggest the presence of a two-factor model underlying the MPAS items, examination of the loading patterns in Table 2 clearly shows the presence of reversed-worded “method effects” contributing to the creation of the apparent two-factor structure, as predicted. All five of the reversed-worded items (i.e., MPAS Items 2, 3, 5, 7, and 8) loaded on the first factor, and all three of the non–reversed-worded items (MPAS Items 1, 4, and 6) loaded on the second factor. This is consistent with a “method effects” model, which may occur when reversed-worded items are present (e.g., Bagner et al., 2004; Fresco et al., 2002). In such cases, it may be the case that a single factor (e.g., “EBT Attitudes”) is largely responsible for item variation, albeit with wording-based method effects leadings to the statistical appearance of “two factors.” In such cases, however, the structure would still be unifactorial. This however cannot be tested in EFA. CFA is needed to be able to control for such method effects to then test the fit of a one-factor model (described below).

Scree plot.
Exploratory Factor Analytic Results of the Modified Practice Attitudes Scale.
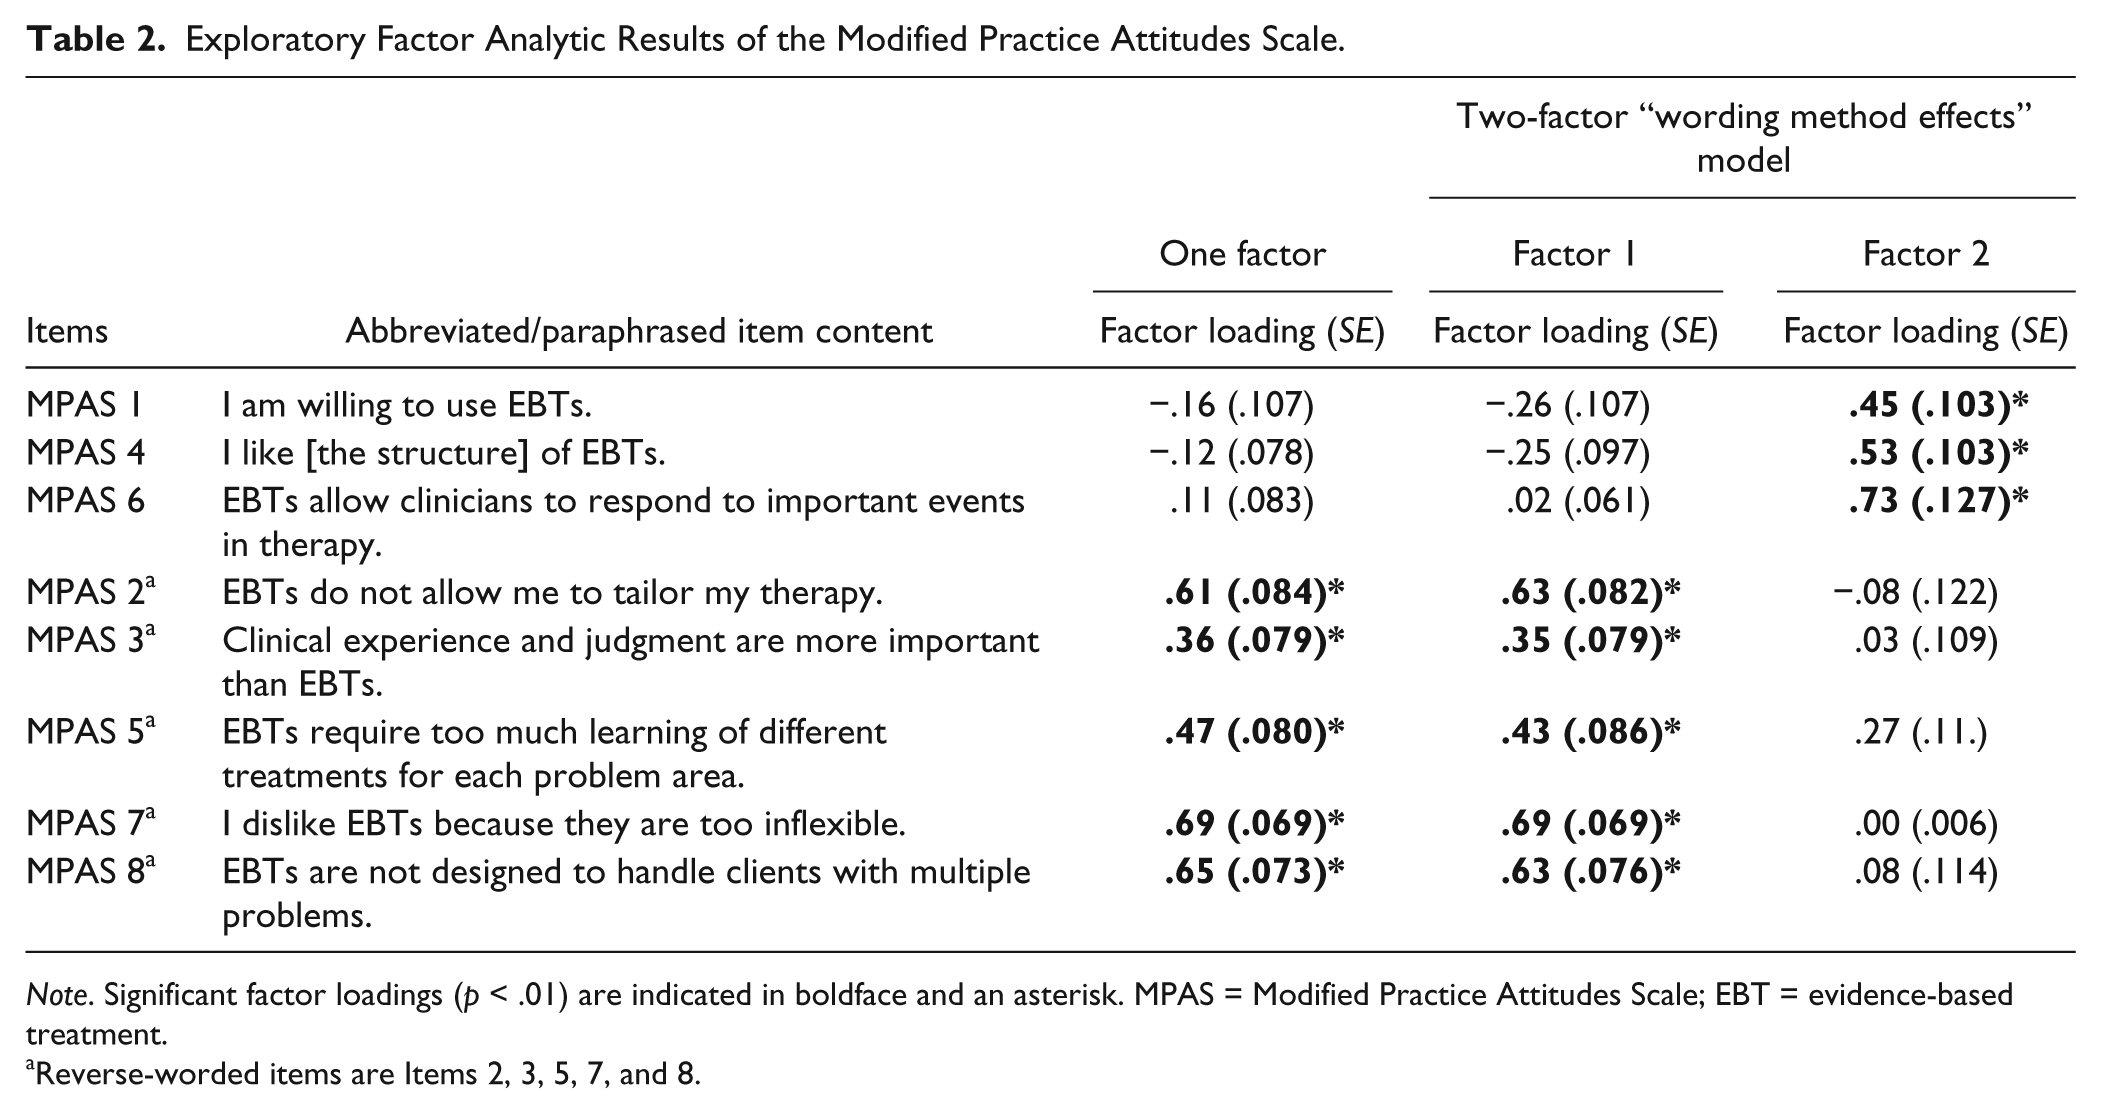
Note. Significant factor loadings (p < .01) are indicated in boldface and an asterisk. MPAS = Modified Practice Attitudes Scale; EBT = evidence-based treatment.
Reverse-worded items are Items 2, 3, 5, 7, and 8.
Confirmatory Factor Analysis
Results of the CFA analyses based on the Korean subsample may be seen in Table 3.
Fit Statistics for the Confirmatory Factor Analytic Models of the Modified Practice Attitudes Scale.
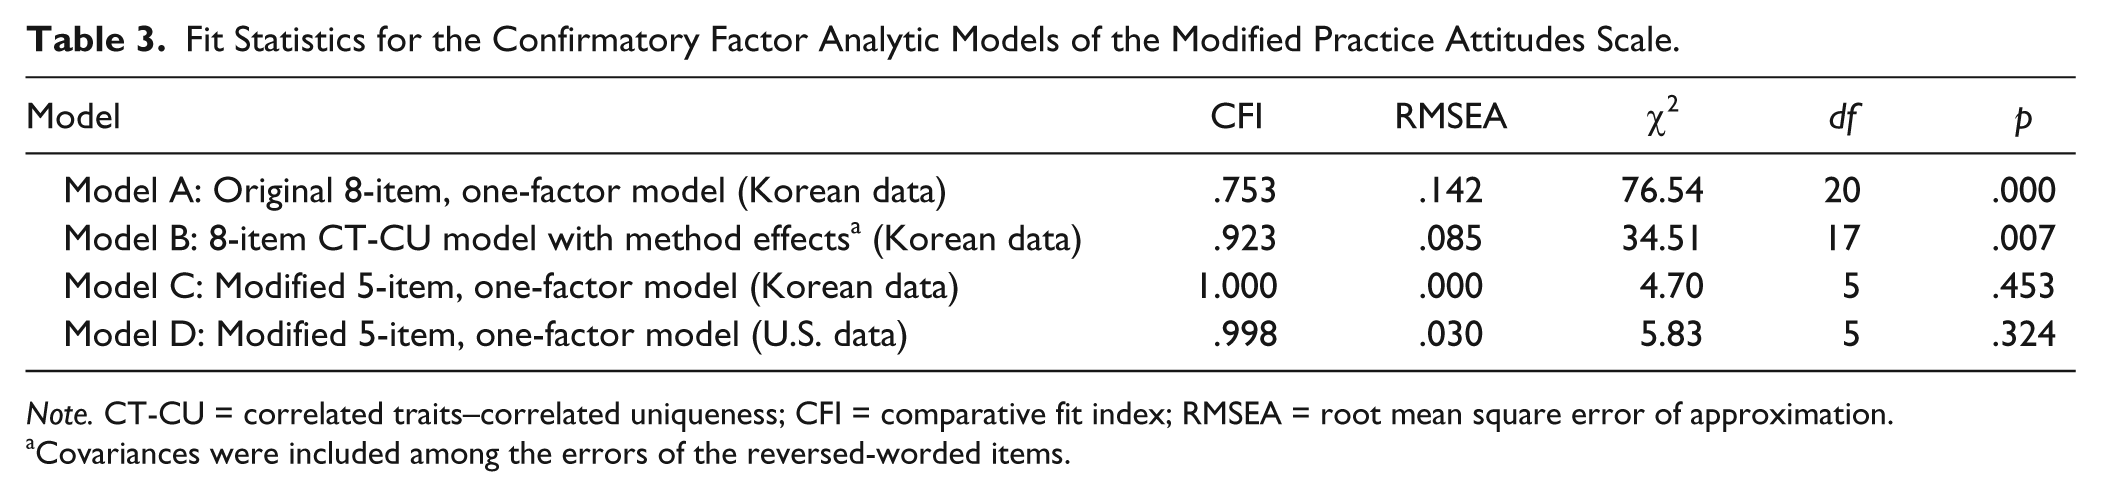
Note. CT-CU = correlated traits–correlated uniqueness; CFI = comparative fit index; RMSEA = root mean square error of approximation.
Covariances were included among the errors of the reversed-worded items.
Standard One-Factor Model
Results revealed poor model fit for the original 8-item, one-factor MPAS model, which did not control for method effects (i.e., Model A; RMSEA = .142, CFI = .753). Three of the eight items also had nonsignificant factor loadings: Item 1 (.17), Item 4 (.15), and Item 6 (.07). The original 8-item, one-factor MPAS model clearly did not fit well in the Korean sample.
One-Factor Model, Controlling for Method Effects
Model fit based on the CT-CU one-factor model may be seen in Table 3. This model evidenced acceptable fit (i.e., Model B; CFI = .923, RMSEA = .085). However, all loadings associated with the three non–reversed-worded items remained nonsignificant and small (.03, .10, and .13; see Table 4).
Confirmatory Factor Analysis Model Parameters of the (CT-CU) One-Factor Model (Controlling for Method Effects).

Note. Significant factor loadings (p < .01) are indicated in boldface and an asterisk. MPAS = Modified Practice Attitudes Scale; EBT = evidence-based treatment.
Reversed-worded items are Items 2, 3, 5, 7, and 8.
Another related recommendation for dealing with wording-related method effects is to simply remove either the reversed-worded or non–reversed-worded items (see Brown, 2003; Marsh, 1996). This is because (as noted above) the inclusion of both reversed-worded and non–reversed-worded items can introduce significant complexity with respect to factor structure and scoring procedures.
Following these recommendations (i.e., Brown 2003; Marsh 1996), we removed the three non–reversed-worded items from the scale and examined the fit of the 5-item one-factor CFA model. As shown in Table 3 (i.e., Model C: “Modified 5-item, one-factor model (Korean data)”), the fit of this revised model was now excellent (RMSEA < .05; CFI > .95). The factor loadings for the 5-item one-factor model appears in Table 5. All factor loadings were also significant (p < .001), ranging from .34 to .89. Collectively, these results provide support for this 5-item one-factor MPAS model in the Korean sample.
Confirmatory Factor Analysis Model Parameters of the 5-Item Modified Practice Attitudes Scale Based on the Korean and U.S. Data.
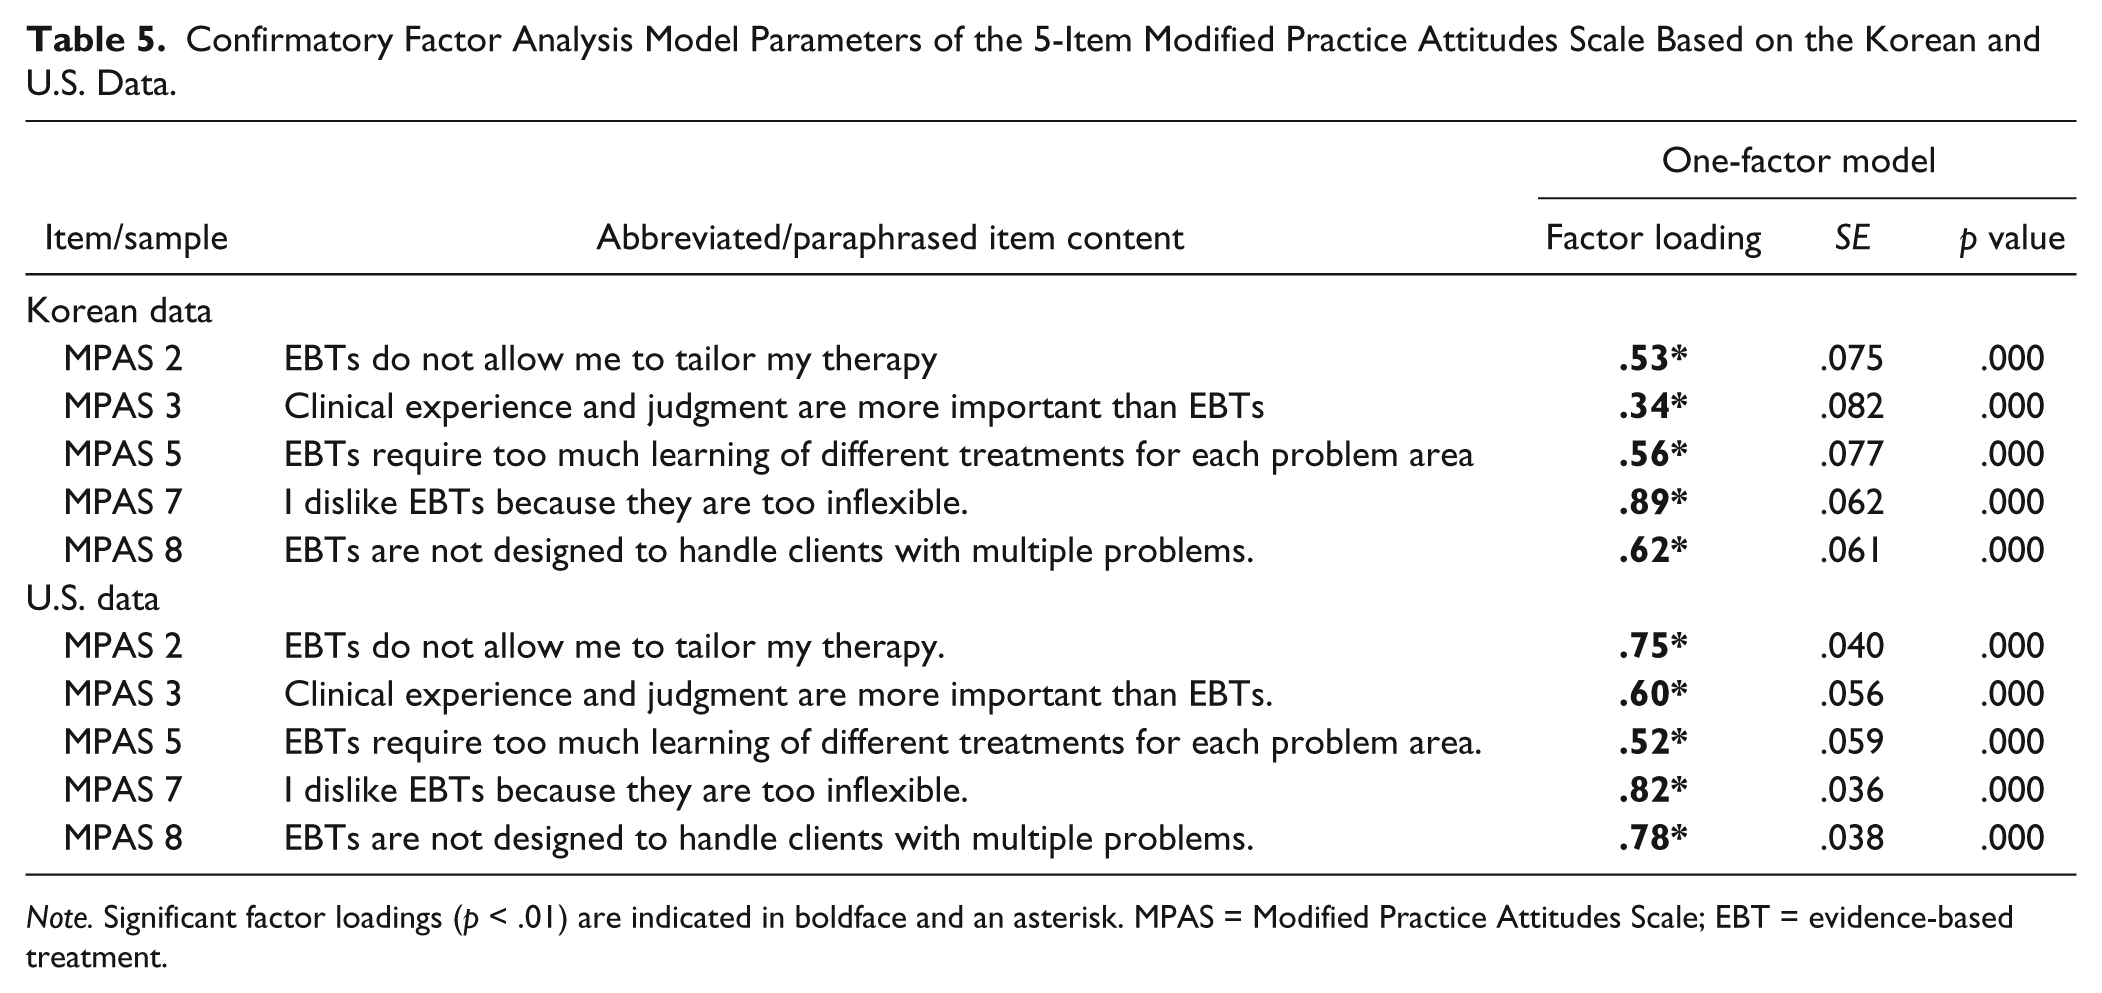
Note. Significant factor loadings (p < .01) are indicated in boldface and an asterisk. MPAS = Modified Practice Attitudes Scale; EBT = evidence-based treatment.
U.S. and Korean Samples
To examine whether this model also fit well in the U.S. sample, we examined this 5-item, one-factor MPAS model in a sample of U.S. therapists (n = 189). The fit of this model (based on the U.S. therapists’ data) appears in Table 3 (i.e., Model D: “Modified 5-item, one-factor model (U.S. data)”). This model also evidenced excellent model fit (e.g., RMSEA = .030, CFI = .998). All factor loadings for the 5-item one-factor model were also significant, ranging from .52 to .82 (see Table 5). Based on this sample of U.S. therapists, fit of the 5-item, one-factor model (RMSEA = .030, CFI = .998) was substantially better than the fit of the 8-item, one-factor model (RMSEA = .084, CFI = .964). These results provide support for the factor structure of this new (5-item) MPAS model across countries.
Reliability
Internal consistency of the 5-item MPAS total score was .78 based on the U.S. sample of therapists. Internal consistency of the 5-item K-MPAS total score was .65 based on the full Korean subsample.
Convergent Validity
EBT Attitudes With EBA Attitudes
Based on the Korean sample, the K-MPAS total score (i.e., attitudes toward EBTs) was significantly correlated with (a) the K-ASA total score (i.e., attitudes toward EBAs in general), r(283) = .45, p < .01; (b) the K-ASA Practicality subscale score (i.e., attitudes toward EBAs with respect to practicality), r(283) = .39, p < .01; and (c) the K-ASA Benefits Over Clinical Judgment subscale score (i.e., attitudes related to benefits over clinical judgment), r(270) = .40, p < .01. This indicates that the more positive one’s attitudes toward EBTs, the more positive are their attitudes are toward EBA.
MPAS Attitudes With Knowledge
Based on the Korean sample, (positive) attitudes toward EBTs (as measured by the K-MPAS total score) were positively and significantly correlated with K-KEBSQ total score (i.e., knowledge of EBTs), r(246) = .14, p < .05. Although this is associated with a small effect (Cohen, 1988), these results indicate that positive EBTs attitudes are somewhat related to greater knowledge of EBTs.
Cross-Cultural Comparison of Means
We compared attitudes toward EBTs based on the 5-item MPAS one-factor model total score across Korean and U.S. therapists. 3 Based on the revised model, Korean therapists (n = 67) reported significantly more negative attitudes toward EBPs (i.e., significantly greater MPAS total scores; M = 11.96, SD = 2.94) than the 187 U.S. therapists (M = 10.95, SD = 3.67). The magnitude of the difference was small but significant (p = .04).
We then compared means between these same two groups based on the original 8-item scale. When based on this 8-item total score, these two groups were no longer associated with significant differences in means. These analyses revealed that the U.S. therapists (M = 29.63, SD = 5.11) and the Korean therapists (M = 28.37, SD = 3.24) did not significantly differ on EBT attitudes when using the full 8-item scale, F(254) = 3.55, p = .061, ns. These results suggest that removal of the three non–reversed-worded items from the scale may not be a trivial modification, and that this refinement can lead to significant differences in results and interpretations of central study questions, such as differences in EBT attitudes between groups.
Discussion
In the present study, we sought to develop a Korean version of the MPAS to measure attitudes toward EBTs among Korean therapists. This is an important pursuit because the field has been focused on determining how to most effectively disseminate EBTs to practicing community clinicians in the field to enhance care delivered to patients. Researchers have thus begun to measure clinician’s attitudes toward EBTs. In the present study, we added to this movement by translating the MPAS into Korean and examining the psychometric properties of its scales so that the K-MPAS may be used within the Korean mental health system. More specifically, we developed a modified, 5-item K-MPAS that performed well and was associated with good model fit, adequate reliability, and acceptable convergent validity.
The present study was also the first to examine the factor structure of the MPAS. Although reversed-worded items have traditionally been recommended in scale development (to protect against response acquiescence), researchers more recently have found that they do not protect well against response acquiescence and may actually contribute to respondent confusion and inattention (van Sonderen et al., 2013). Similarly, researchers have begun to wonder whether the inclusion of oppositely worded items do more harm than good (Brown, 2003; Marsh, 1996). For example, researchers examined this issue via item response theory and found that the non–reversed-worded items of the Loneliness Questionnaire were associated with significantly better psychometric properties than the reversed-worded items (Ebesutani et al., 2012b). Consequently, researchers have more recently begun to recommend removing the poorly performing, reversed-worded (or non–reversed-worded) items from the measure entirely. In the present study, we followed this recommendation and removed the non–reversed-worded items to measure EBT attitudes. This led to a salient one-factor model that still assessed a relatively broad range of attitudes related to EBTs, including asking about training burden associated with EBTs, the ability for EBTs to be tailored to individual client needs, the relative importance of clinical judgment, research-informed clinical decision making, EBT flexibility, and comorbidity coverage achieved by EBTs. It is however worth noting that the reliability of this modified measure fell just below the cutoff for good reliability. Reliability of the original MPAS was reported to be .80 (Borntrager et al., 2009), and so more research is needed to understand if there are ways to increase the reliability of the K-MPAS. For example, given that internal consistency is known to reduce as items are removed (as was the case in the present study), future work in this area may strongly consider replacing the eliminated items with items that query the same content domains (and perhaps other content domains as well) yet in the same wording direction as the items included in the scale. The scores from the K-MPAS nonetheless significantly predicted EBT knowledge and attitudes toward EBAs, and it was associated with significant differences between U.S. and Korean therapists, demonstrating the validity and utility of this modified scale.
Clinical and Research Implications
The K-MPAS developed in the present study has the potential for important clinical and research application—particularly with respect to helping disseminate EBTs in the Korean mental health system. Through administering the K-MPAS to members in the Korean mental health system, the nature of attitudes toward EBTs may be determined specific to different groups (e.g., clinic-based psychologists, hospital-based assessors, school-based counselors, etc.). This can inform which populations are in more need of trainings and education programs to increase their (positive) attitudes toward EBTs to support subsequent EBT implementation. In education contexts, the K-MPAS can also be used to measure and monitor the attitudes of graduate students and trainees as they progress through their training programs to ensure that positive attitudes are fostered and maintained. In research, the K-MPAS can also be used to identify predictors of positive and negative attitudes toward EBTs, complementing work that has already begun in the United States (e.g., Nakamura, Higa-McMillan, Okamura, & Shimabukuro, 2011).
The present study also has implications with respect to the development of attitude measures in both Eastern and Western contexts. Specifically, the inclusion of both reversed-worded and non–reversed-worded items in the K-MPAS contributed to structural problems, supporting the recommendations in the literature to include either reversed-worded or non–reversed-worded items, but not both. Furthermore, significant group differences in attitudes were found between the Korean and U.S. therapists only when based on the total score that did not include both reversed-worded and non–reversed-worded items. These results suggest that including both non–reversed-worded and reversed-worded items in a single scale may distort the total score.
Limitations
Despite the strengths of the current article—including being the first to examine the factor structure underlying the MPAS—there were limitations worth noting. First, the present study was based on self-reports of attitudes. Attitudes however may also be assessed via other paradigms, including the Implicit Association Task, which has been shown to be a powerful assessment paradigm to assess attitudes (Greenwald, McGhee, & Schwartz, 1998; Karpinski & Hilton, 2001). Another limitation in the present study was the relatively small number of school-based counselors in the Korean sample. This is noteworthy because counselors have begun to be placed in schools in Korea to provide mental health services to students. In the present study, we only obtained responses from 36 school counselors. Given the importance of this service provider population with respect to delivering effective evidence-based services in school settings in Korea, it will be important for future studies to collect data from more school counselors to better understand their attitudes and readiness to deliver EBTs to students. Last, although the U.S. and Korean samples differed significantly on the 5-item MPAS total score, but not on the 8-item MPAS total score (thus supporting differential performance between these two versions of the MPAS), their p values were not drastically different (i.e., .06 vs. .04). Some caution should be taken when interpreting these results. The overall set of psychometric indices however do support the 5-item version over the 8-item version, so this too should be considered when interpreting this differential pattern regarding the significant differences of the total scores across samples.
Despite these limitations and areas for future research, the present study found support for the K-MPAS as a well-performing measure to assess attitudes toward EBTs. The adoption and delivery of EBTs will be an important focus through the upcoming decades of dissemination research, and we hope the K-MPAS can be used to assess and understand how mental health providers think about EBTs when providing care in the Korean mental health system. The present study also conducted the first factor analytic investigation to understand the structure underlying the MPAS to measure attitudes toward EBTs. Based on the factor analytic results, we recommended removing the reversed-worded items and instead retain only the non–reversed-worded items to measure EBT attitudes. In both Eastern and Western contexts, there are several measures that also include both reversed-worded and non–reversed-worded items. As demonstrated in the present study, this issue should be closely examined to identify bias and distortions in scale scores resulting from such method effects. This is not a trivial matter, and not making the necessary adjustments and modifications to eliminate score contamination can lead to undesirable outcomes, such as not being able to detect differences between groups. There may be other problems associated with such oppositely worded items, and future studies should carefully consider these findings when pursuing scale development and scale refinement.
Footnotes
Appendix
Declaration of Conflicting Interests
The authors declared no potential conflicts of interest with respect to the research, authorship, and/or publication of this article.
Funding
The authors received no financial support for the research, authorship, and/or publication of this article.