



Abstract
Observational measurement plays an integral role in a variety of scientific endeavors within biology, psychology, sociology, education, medicine, and marketing. The current article provides an interdisciplinary primer on observational measurement; in particular, it highlights recent advances in observational methodology and the challenges that accompany such growth. First, we detail the various types of instrument that can be used to standardize measurements across observers. Second, we argue for the importance of validity in observational measurement and provide several approaches to validation based on contemporary validity theory. Third, we outline the challenges currently faced by observational researchers pertaining to measurement drift, observer reactivity, reliability analysis, and time/expense. Fourth, we describe recent advances in computer-assisted measurement, fully automated measurement, and statistical data analysis. Finally, we identify several key directions for future observational research to explore.
Keywords
In day-to-day life, the success of any animal is heavily influenced by its ability to detect and interpret the behavior of other organisms. These crucial skills guide the search for life’s basic necessities (e.g., food, water, and security), as well as a variety of social and intellectual pursuits (e.g., reproduction, group formation, and skill acquisition). These skills also play an integral role in the scientific method (Kosso, 2011) as the basis of observational measurement, which is a systematic approach to detecting and interpreting behavior. A wide variety of scientific endeavors rely on observational measurement including biology, psychology, sociology, education, medicine, and marketing.
Observational measurement nicely captures the unfolding of behavior over time, which is essential to understanding its functionality (i.e., antecedents and consequences) and the dynamic processes it contributes to (Bakeman & Quera, 2011). Observational methods also circumvent many of the response biases that survey methods are prone to such as self-presentation and social desirability (Stone et al., 2000). They can even be used with participants for whom surveys would be impractical such as nonhuman animals, very young children, or patients undergoing medical procedures.
The current article provides an interdisciplinary primer on observational measurement. First, it details the various types of measurement instrument that can be applied to observational data. Second, it describes the various methods that can be used to validate inferences drawn from observational measurements. Finally, it outlines the challenges currently faced by observational researchers, several recent advances in observational methodology, and the directions that we hope future observational research will explore.
Measurement Instruments
Observational methods use trained individuals called observers to make quantitative judgments about behaviors of interest. These judgments are standardized across observers through the use of measurement instruments. Measurement instruments reflect researchers’ theories about what aspects of behavior are important and focus observers’ attention on specific types of behavioral information. Some instruments require observers to assign behaviors to one or more discrete categories, while others require observers to rate behaviors on one or more continuous dimensions. In the following subsections, we discuss several characteristics on which measurement instruments meaningfully vary.
Scale of Measurement
One of the fundamental characteristics of a measurement instrument is the statistical data type or “scale of measurement” (Stevens, 1946) that it yields (e.g., nominal, ordinal, interval, or ratio). The type of instrument chosen and its scale of measurement can have important consequences for data collection, validation, and statistical analysis. In general, instruments can be usefully characterized as either categorical or dimensional (Table 1).
Definitions for Different Approaches to Observational Measurement.
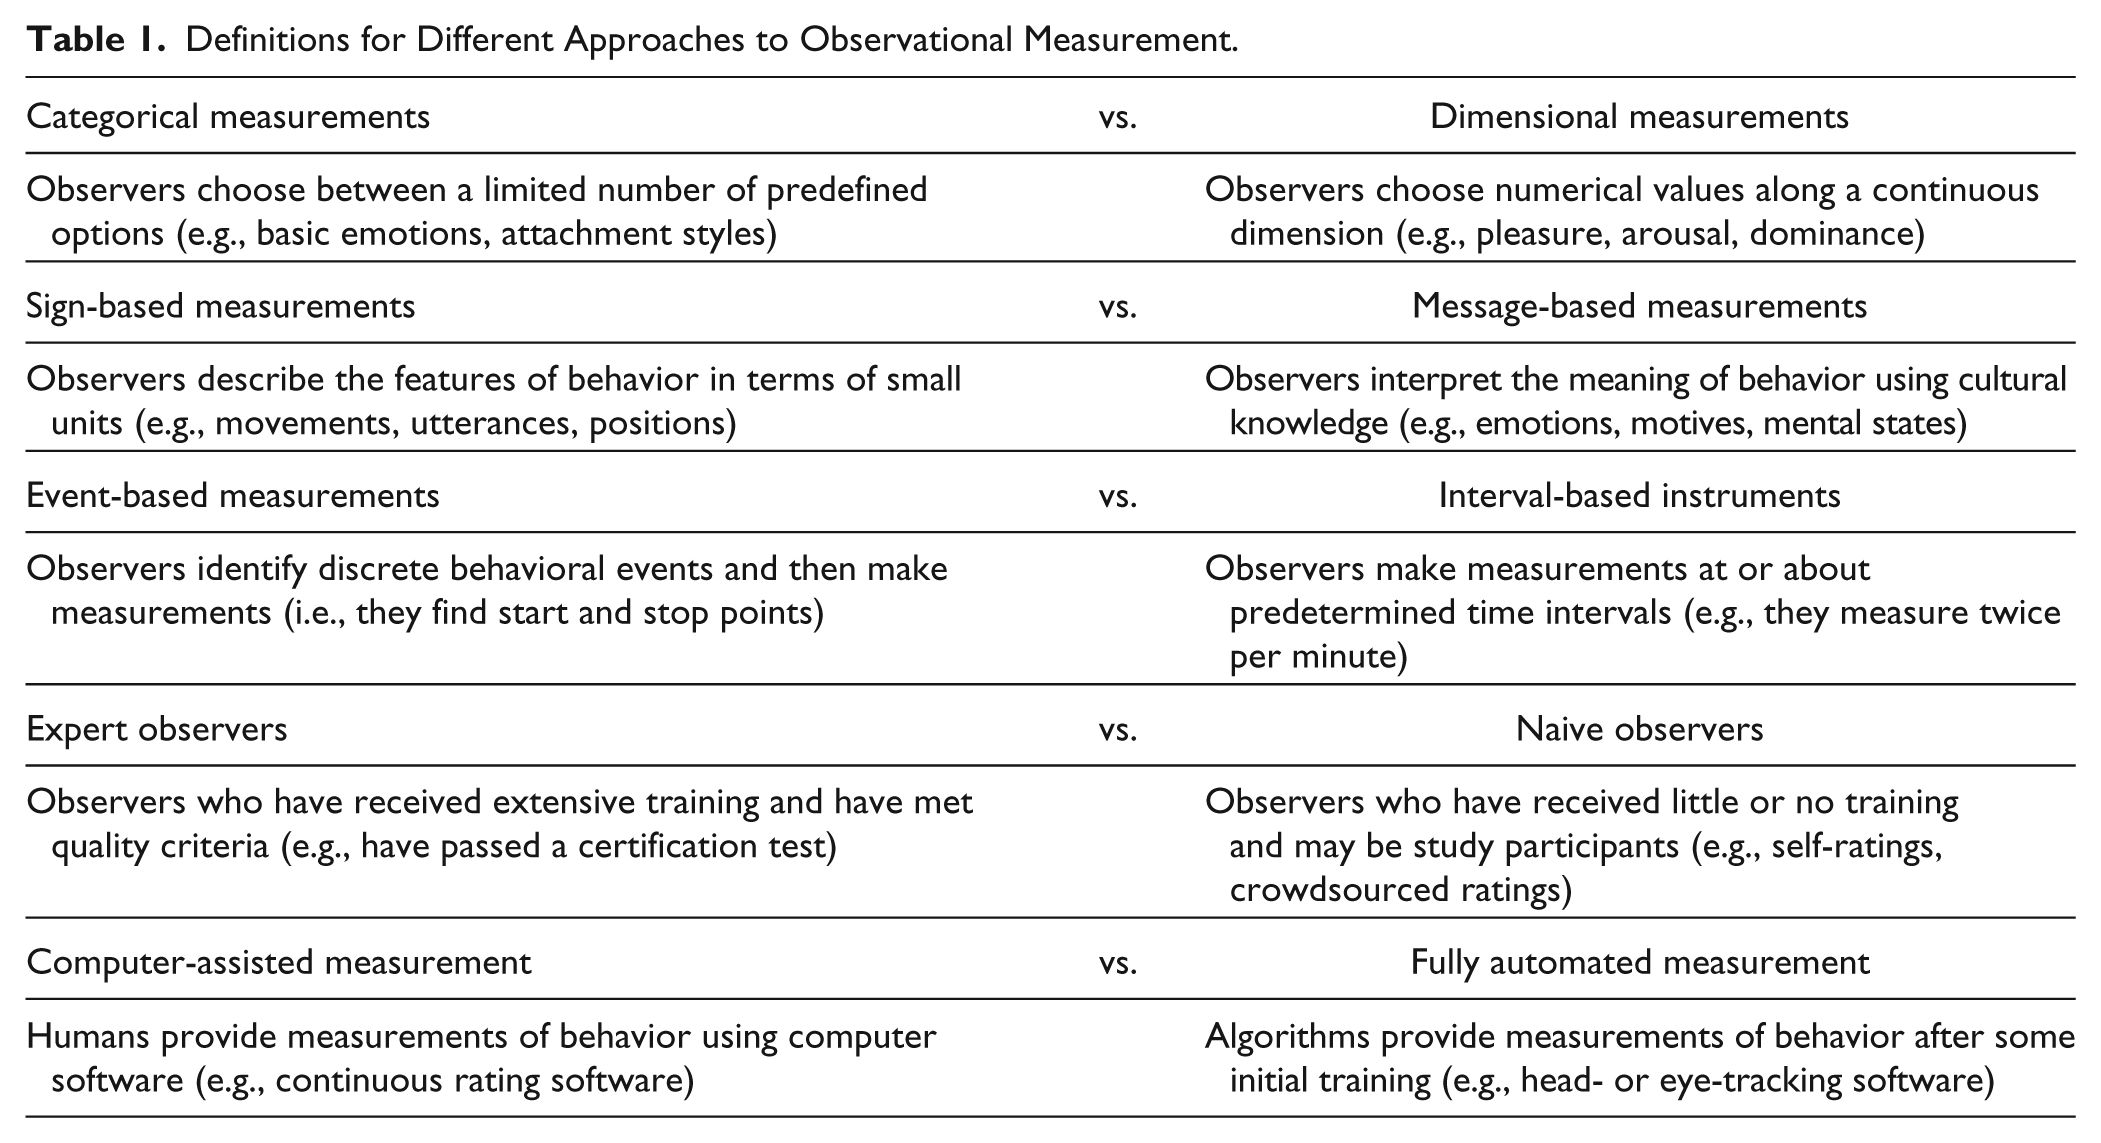
Categorical instruments require observers to choose between a limited number of predefined options, which are often called codes. Codes are grouped into sets that are often (but not always) considered mutually exclusive and exhaustive. Codes within a set may be treated as unordered or as existing on an ordered continuum. For example, a categorical instrument developed to assess teacher effectiveness might use a set of unordered codes to categorize a lesson’s subject matter (e.g., math, science, or history) and a set of ordered codes to categorize its pacing (e.g., slow, medium, or fast).
Dimensional instruments, on the other hand, require observers to choose numerical values along continuous dimensions; these values are often called ratings. Each dimension has an upper and a lower bound; typically, any number between these bounds may be chosen, although numerical restrictions may be enforced within this range (e.g., only integers or multiples of 5 may be chosen). The choice of upper and lower bound values can influence how observers think about the dimension (Schwarz, Knauper, Hippler, Noelle-Neumann, & Clark, 1991). Including zero within the range communicates that the absence of behavior is possible, while excluding it communicates that it is not. Additionally, including negative numbers communicates that the dimension is bipolar, whereas excluding negative numbers communicates that the dimension is unipolar. For example, a dimensional instrument developed to assess the effectiveness of video ads might have observers rate their brand loyalty before and after the ad on a dimension from −100 to 100 and their level of engagement during the ad on a dimension from 1 to 10.
The choice to use a categorical or dimensional instrument should be guided by theoretical consideration of the construct being measured. For instance, some researchers believe that emotion is best characterized using discrete categorical states, while others believe in measuring its underlying dimensions (Gunes & Schuller, 2013). It is also worth mentioning that the line between categorical and dimensional instruments can blur when a large set of ordered codes is used or when numerical restrictions reduce the number of possible ratings to several options. In such cases, the distinction becomes arbitrary.
Degree of Inference
Another fundamental characteristic of a measurement instrument is the degree of inference it requires. This characteristic can have important consequences for the validity of inferences drawn from its measurements. Instruments can be usefully categorized as either sign based or message based (Cohn & Ekman, 2005).
Sign-based instruments attempt to describe the features of behavior and require relatively low degrees of inference. Such instruments have also been termed “atomic” because they focus on small units of behavior, such as utterances and gestures. One quintessential example of a sign-based instrument is the Facial Action Coding System (FACS; Ekman, Friesen, & Hager, 2002), which provides codes to describe facial behavior in terms of muscle contractions. An observer trained in FACS might see an interviewer smile at an interviewee and measure this behavior as contraction of the zygomatic major muscle.
Message-based instruments, on the other hand, attempt to interpret the meaning of behavior and require relatively high degrees of inference. Such instruments rely on observers to be “cultural informants” who can see the distinctions delineated by their categories or dimensions (Bakeman & Quera, 2011). One quintessential example of a message-based instrument is the Specific Affect Coding System (Coan & Gottman, 2007), which provides codes to interpret facial behavior in terms of its affective and interpersonal meaning. To return to the previous example, an observer trained in the Specific Affect Coding System might view this same interviewer behavior and, based on context, measure it as affection or interest.
It is worth mentioning that sign-based instruments still require a degree of inference and that some message-based instruments require more inference than others. Thus, although the distinction between signs and messages is a useful one, this property of measurement instruments may be better characterized as a continuum from low to high inference.
Temporal Representation
Measurement instruments require observers to represent behaviors in time. This representation can be accomplished in several ways and with varying degrees of granularity. These characteristics can have important consequences for the datas’ temporal precision and for the types of statistical analysis that are possible. Instruments can be usefully categorized as either event based or interval based (Bakeman & Quera, 2011).
Event-based instruments require observers to identify behavioral events and assign measurements to them. Events are discrete occurrences of a behavior that have detectable starting and stopping (i.e., transition) points. Because of the need to specify transition points in addition to measurements, event-based methods can be time consuming and challenging for observers. However, the benefit to this approach is that event-based methods allow researchers to answer questions about the number, duration, and sequencing of events with high temporal precision. For example, an event-based instrument designed to measure parental involvement in children’s homework might require observers to identify discrete occurrences of children asking questions and parents providing answers. Research questions could be then be explored regarding the number and duration of these behaviors, and additional measurements could be obtained about the quality of the identified events (e.g., the interpersonal warmth or level of technical detail in a parent’s answer).
Interval-based instruments, on the other hand, prompt observers to provide measurements at predetermined time intervals. Measurements may be made either about the moment of each prompt (i.e., what is happening right now?) or about the period between prompts (i.e., what has happened since the last prompt?). Prompts can be configured to occur at intervals of any length. Shorter intervals provide higher temporal precision, but are typically more expensive. Longer intervals are less burdensome for observers, but might collapse distinct behaviors into a single observation or miss a fluctuation in behavior entirely. In the previous example, an interval-based instrument might prompt observers once per minute to indicate if the child has asked a question about the homework and if the parent has provided an answer. The same ratings (e.g., of warmth or level of detail) could also be collected at these moments.
Types of Observer
Earlier, we defined an observer as an individual trained in the use of a measurement instrument. Training is an iterative process and the length of training is largely determined by the complexity of both the instrument and the behavior of interest. Research on observational skills training has found that providing immediate feedback to trainees about their measurements improves their accuracy and reduces the development of response biases (Boice, 1983). It may also lead to deeper understanding to have trainees role-play behaviors that would receive different codes or ratings (Scheffler, 1977).
Measurements can be collected from several different types of observers. Observers may be researchers or staff members with extensive training (i.e., expert observers), or they may individuals or study participants with minimal training (i.e., naive observers). Furthermore, observers may be unrelated to the individuals whose behavior they are observing, or they may be observing recordings of their own or a loved one’s behavior. For example, Levenson and Ruef (1992) collected ratings of marital interactions from unrelated naive observers, while Gottman and Levenson (1985) collected similar ratings from the married couples themselves. Finally, a large number of naive observers may be recruited through crowdsourcing platforms such as Amazon’s Mechanical Turk (Mason & Suri, 2012).
The choice of observer type has important implications for the objectivity, reliability, feasibility, and usefulness of the resulting measurements. Expert observers are typically more likely to use measurement instruments as intended. However, expert observers are more difficult and costly to acquire. There are also reasons to prefer naive observers in some cases, such as when researchers want to capitalize on the privileged knowledge that naive observers have of their own or of loved ones’ behavior. For instance, evidence suggests that patients’ perspectives on the therapeutic alliance are more predictive of treatment outcome than observers’ perspectives (Horvath & Bedi, 2002).
Validity in Observational Measurement
Journal reviewers, policy makers, and instrument users require evidence that the inferences drawn from observational measurements (e.g., that a student has mastered a concept, that a patient is improving, or that a participant feels happy) are valid. It has even been argued that validity is “the most fundamental consideration in developing tests and evaluating tests” (American Educational Research Association [AERA], American Psychological Association, & National Council on Measurement in Education, 2014, p. 11). Validity is a multifaceted construct that has evolved in many ways since its inception (Geisinger, 1992). Contemporary validity theory emphasizes a single, unified construct that captures “the degree to which empirical evidence and theoretical rationales support the adequacy and appropriateness of inferences and actions based on test scores” (Messick, 1989; p. 13, italics in original). Thus, validity is a property of inferences made from measurements and not a property of the measurements themselves or of the instruments that yielded them. Validity is also importantly a dimensional and changeable property; an inference lies somewhere between the extremes of “wholly valid” and “wholly invalid,” and its specific position may shift over time as more evidence in favor of (or against) validity is gathered and as theoretical understanding of the focal construct evolves (Cizek, 2015).
Although extensive discussions of validity and the process of validation are beyond the scope of the current article, this section will provide an overview of the primary threats to validity and the sources of validity evidence that are most common in observational measurement. Readers interested in learning more about these topics are directed to the Standards for Educational and Psychological Testing (AERA et al., 2014).
Threats to Validity
Two major threats to validity come from construct underrepresentation and construct-irrelevant variance (Messick, 1989). When faced with either threat, an inference runs the risk of misrepresenting certain individuals and, as a result, inspiring actions that may lead to unfortunate individual, societal, and scientific consequences.
Construct underrepresentation occurs when an assessment is too narrow and fails to capture important aspects of the construct being measured. For example, the validity of conclusions drawn from an assessment of depression severity might be called into question if the assessment captured some aspects of depression (e.g., cognitive symptoms) but omitted other important aspects (e.g., social and appetitive symptoms).
Construct-irrelevant variance, on the other hand, occurs when an assessment is too broad and contains excess variance that is associated with other, distinct constructs or with extraneous characteristics of the measurement situation. For example, the validity of conclusions drawn from an assessment of depression severity might be called into question if the assessment inadvertently captured aspects of anxiety and psychosis or if its results varied significantly based on the ordering of the questions, the setting in which the assessment was administered, or the clinician who administered it.
Evidence of Validity
Evidence for validating inferences based on measurements can come from several different sources; three particularly important sources are test content, response processes, and hypothesized relationships among variables (Cizek, 2015). The responsibility for collecting and presenting such evidence is shared by both the test developer and the test user (AERA et al., 2014). The role of the test user is especially important when the test is applied in settings or for uses different than those intended by the test developer.
Evidence based on test content derives from analysis of the relationship between the content of a test and the construct it is meant to measure. In observational measurement, test content typically refers to the naming, description, and criteria for an instrument’s behavioral categories and dimensions, as well as the details of its implementation (e.g., temporal resolution and observer type). This form of evidence often involves logical and empirical analyses of the relationship between test content and theoretical construct, as well as expert judgments of test adequacy. The threats of construct underrepresentation and construct-irrelevance increase to the extent that content and construct fail to align.
Evidence based on response processes derives from analysis of the cognitive processes engaged in by test takers. In observational measurement, the response processes of the observers are of central importance. The validity of test content is inconsequential if observers do not use the appropriate criteria to assign their measurements or are unduly influenced by construct-irrelevant factors. This form of evidence often involves questioning test takers about their general response strategies and examining their responses to particular items using “think aloud” protocols (van Someren, Barnard, & Sandberg, 1994). Measurements of test taker behavior (e.g., response times and eye tracking on individual items) may also reveal information about their response processes.
Finally, evidence based on hypothesized relationships among variables derives from analysis of the internal structure of test variables and their relationships to external variables of interest. In observational measurement, the internal structure of test variables refers primarily to the relationships between behavioral categories and dimensions (as well as to the reliability of measurements, which will be discussed separately). Validity is supported to the extent that these internal relationships align with the hypotheses of accepted theories. External variables of interest often include measures of outcomes that the test is expected to predict, as well as the results of other tests hypothesized to measure similar or distinct constructs. Validity is supported to the extent that these variables predict what they are expected to, are related to accepted measures of similar constructs, and are unrelated to accepted measures of distinct constructs.
Interobserver Reliability
The most commonly provided evidence of validity in observational research comes from studies of interobserver reliability. Although validity and reliability are considered distinct constructs, contemporary validity theory recognizes that reliability has important implications for validity and can be considered a source of validity evidence based on hypothesized relationships among variables (Cizek, 2015). By quantifying the extent to which multiple observers assign similar measurements to the same items, these studies reveal whether or not observers are a problematic source of construct-irrelevant variance.
Estimating interobserver reliability with a categorical measurement instrument involves assessing the extent to which observers assign items to the same (or similar) categories. Many approaches to estimating interobserver reliability that “adjust” for random guessing by observers have been proposed and widely used. Two recent articles illuminate the advantages and disadvantages of existing approaches (Feng, 2013a; Zhao, Liu, & Deng, 2012). Both suggest that, although no ideal approach yet exists, Bennett, Alpert, and Goldstein’s (1954) S index 1 appears to be the least-biased option currently available, especially when the number of categories in each set of categories is relatively small.
Estimating interobserver reliability with a dimensional measurement instrument involves calculating the degree of association between the measurements of each observer. The intraclass correlation coefficient (ICC; Shrout & Fleiss, 1979) is typically used for this purpose. The ICC relies on partitioning the measurement variability into various components (e.g., variability due to items, observers, and measurement error). There are many different ICC formulations, but the general idea shared among them is that measurements can be considered reliable when the variability associated with error constitutes a relatively small proportion of the total variability. For a discussion of the ICC formulations, readers are referred to McGraw and Wong (1996).
Current Challenges
Observational researchers inevitably confront several challenges. One is drift or the fact that, over time and experience, observers’ measurements may vary in systematic or stochastic ways. Second is reactivity or the fact that observers’ response processes may change in response to overt evaluation. Third is the fact that estimating interobserver reliability is not always straightforward. Finally, there is the high cost of collecting observational measurements.
Drift may occur for a single observer due to fatigue, forgetting, a loss of motivation, or the accumulation of bad habits (Boice, 1983; Campbell & Stanley, 1966). It can also occur for a group of observers who, after working and training together, become more reliable with each other but less reliable with observers outside that group (O’Leary & Kent, 1973). Group drift is especially concerning when the same measurement instrument is used by multiple research groups, as it can prevent meaningful comparison between studies. Researchers can detect drift by periodically comparing observers’ measurements to external measurements that are accepted as “correct.” However, this solution is rarely used due to the difficulty of collecting (and the relative absence of) accepted measurements. Drift may also be exacerbated in group-specific (i.e., unshared) databases, which would not be detected by this approach. Instead, researchers sometimes detect drift from an initial baseline by having observers assign measurements to the same items over the course of time. Using these data, intraobserver reliability analyses can be performed to reveal changes in observers’ responses over time. However, without accepted measurements to compare with, it can be difficult to determine whether such changes are due to drift or whether the newer measurements are actually more accurate than the older ones.
Reactivity can be thought of as a specific case of the Hawthorne effect (Adair, 1984; Boice, 1983). It occurs when observers modify their response processes when they know they are being evaluated. Reactivity is a serious challenge when collecting evidence of validity based on response processes and reliability analyses. If observers use different response processes when they are being overtly and covertly evaluated, then evidence of validity based on their overtly measured response processes may not pertain to any measurements collected in the absence of overt evaluation. Similarly, if observers are more reliable during overt than covert evaluation, as previous research has found (Reid, 1970), then evidence of validity based on overt reliability analyses may not pertain to any measurements collected in the absence of overt evaluation. If reactivity is suspected, then researchers can devise covert means of assessing response processes and reliability. As a general rule, it seems worthwhile to keep observers blind to the items that will be included in reliability and response process analyses when possible. Furthermore, we recommend the use of frequent “observer meetings” where measurements are randomly selected from each observer to be viewed and discussed by the group. These meetings serve a didactic function and encourage observers to remain consistent in their response processes given that any of their measurements may be evaluated. Researchers must take care not to encourage group drift during such meetings however.
Interobserver reliability is an important source of validity evidence in observational measurement. However, researchers currently face several challenges pertaining to its use. First, a wide range of reliability indexes are used by different researchers and by different fields. This heterogeneity creates confusion and, in studies where a reliability index is the dependent variable, makes comparison between studies difficult or impossible. Second, reliability indexes are commonly applied and reported incorrectly (Feng, 2013b). These mistakes are understandable given the number of different options available, but are very problematic from a validity perspective. Third, although numerous criteria have been proposed (see Gwet, 2014, pp. 166-168), there is no agreed-on criterion for what constitutes an “acceptable” reliability score. For example, Fleiss (1981) suggested that chance-adjusted reliability scores above 0.40 are “intermediate to good” and scores above 0.75 are “excellent.” However, there is little consensus on such criteria and many researchers (e.g., Bakeman & Quera, 2011) have challenged the notion that any criteria could be universally applicable. This issue is complicated and deserves more attention. Finally, as mentioned previously, existing approaches to estimating reliability with categorical instruments are problematic. New categorical reliability indexes and widely adopted standards for their use, reporting, and evaluation are sorely needed.
Perhaps the most limiting challenge faced by observational researchers to date has been the sheer cost of training observers and collecting measurements. As an exemplar, training in FACS takes several months and coding a single minute of video with FACS can require an hour or more of observer time (Cohn & Ekman, 2005). While these estimates are likely greater than what is required for many measurement instruments, the temporal and financial burden of observational measurement is a serious obstacle. Crucially, this burden often imposes limits on the number of participants that can be included in an observational study, reducing its statistical power and generalizability. While no easy solution to this problem exists, advances in computer-assisted and fully automated measurement help mitigate its impact. The next section describes these and other recent advances.
Recent Advances
Computer-Assisted Measurement
The tools for recording observational measurements have greatly advanced in recent years. Early observers recorded measurements using paper-and-pencil forms that were typically organized as grids with time intervals represented as rows and behavioral categories or dimensions represented as columns, or vice versa (Bakeman & Quera, 2011). This intuitive and parsimonious grid-based format has been preserved in many of the more recent tools.
However, researchers have increasingly adopted computerized alternatives to paper-and-pencil forms. The benefits of computer-assisted measurement generally include increased ease of use, efficiency, and temporal accuracy. Nowadays, observers typically assign measurements to audiovisual records of participant behavior. This approach restricts observers to the information captured on the record (e.g., behavior occurring off camera would not be visible), but offers substantial benefits in exchange. Recordings enable multiple observers to view identical information, even if they are separated in time and space. Using computer-assisted measurement tools, observers can easily control playback of the record: playing it at various speeds, rewinding it, and pausing it when necessary. Well-designed tools also synchronize playback and the recording of measurements automatically, thereby increasing temporal accuracy and reducing clerical errors.
One relatively recent advance that bears mentioning is the development of continuous measurement systems. Inspired by Gottman and Levenson’s (1985) affect rating dial, these systems collect dimensional measurements continuously (i.e., with very short time-intervals) as observers view audiovisual records in real time. Observers typically adjust the numerical value of their measurements by manipulating a physical input device such as a dial, lever, or joystick. The primary benefits of such tools are their efficiency (e.g., 1 minute of video only requires 1 minute to measure) and that the distributions of such measurements tend to be far less skewed than those from most categorical coding systems. Such tools have been used to great effect in the study of affective and interpersonal processes (e.g., Baker, Haltigan, Brewster, Jaccard, & Messinger, 2010; Cowie, McKeown, & Douglas-Cowie, 2012; Lizdek, Sadler, Woody, Ethier, & Malet, 2012).
General purpose computer-assisted measurement systems are now widely available in both commercial and freeware models. Popular commercial tools include Noldus’ The Observer and Mangold’s INTERACT, while popular freeware tools include ELAN and ANVIL. More specialized software is also available that excels at certain tasks. For instance, the freely available ChronoViz was designed to enable easy synchronization and visualization of multiple data types including audio, video, digital pen, and geolocation data. For continuous measurement, one of the current authors developed two open source software packages: CARMA for measuring a single dimension and DARMA for measuring two dimensions simultaneously (Girard, 2014). These latter systems also include powerful options for analyzing interobserver reliability both quantitatively and qualitatively.
Fully Automated Measurement
Recent advances in computer science have yielded algorithms capable of performing certain observational measurement tasks without human intervention. While the majority of this work has focused on automatic detection of facial expressions, a growing body of literature is exploring fully automated measurement of other behavioral constructs, such as emotional and cognitive states, physical pain, and depression (for a review, see Cohn & De la Torre, 2014). Given the considerable cost of collecting observational measurements, fully automated measurement could represent an enormous increase in research efficiency. And with their promise of nearly infinite scalability and real-time analysis speeds, such tools also have the potential to open up entirely new avenues of research and application.
Although numerous approaches exist for fully automated measurement, most researchers have converged on the same basic structure of analysis. In this structure, an algorithm is trained using two types of information. First, trusted human observers provide categorical or dimensional measurements on a subset of items. Second, quantitative measurements of these items, called features, are extracted using computer vision and signal-processing techniques. The algorithm then attempts to learn a high-dimensional mapping between the features and the trusted measurements. For example, an algorithm might learn that items categorized as “smiles” tend to have certain combinations of features, while items categorized as “nonsmiles” tend to have different combinations. This learned mapping can then be used (i.e., extrapolated from) to generate predicted measurements for novel items.
While the majority of work on fully automated measurement has focused on visual sign-based instruments like FACS, subsets of work have focused on training algorithms to make message-based predictions (Gunes & Schuller, 2013) and to integrate features from multiple behavioral modalities (e.g., face, posture, and speech; Dibeklioglu, Hammal, Yang, & Cohn, 2015; Pantic & Rothkrantz, 2003). As message-based measurements are highly inferential and sensitive to context, it may be hard to imagine how an algorithm could perform this type of task (cf. Bakeman & Quera, 2011, pp. 20-21). However, as the field of computational behavioral science matures, its ability to measure such contextual information increases. Armed with such rich information, we believe that researchers will continue to close the gap between fully automated and human observers over time.
One of the exciting benefits of fully automated measurement is that algorithms are immune to drift and reactivity. They do not become fatigued, distracted, or self-conscious; once trained, they do not change their minds. However, this blessing can become a curse when its implications are not fully appreciated. Because current algorithms typically do not continue to learn over time, they are entirely dependent on their initial training.
Girard, Cohn, Jeni, Sayette, and De la Torre (2015) demonstrated that, when provided reliable and representative training data, current algorithms are able to perform well on even difficult observational tasks such as fully automated FACS coding of an unstructured social interaction. However, they also found that algorithms, like human observers, have a range of dependability beyond which their accuracy degrades. Specifically, they found that the accuracy of their algorithm was significantly degraded by extreme head pose (i.e., by participants turning away from the camera). It is thus imperative for researchers who develop or purchase fully automated measurement tools to gather evidence of validity using their own data sets.
Statistical Analysis
Analyzing the data from an observational study is relatively straightforward when measurements are assigned to a small number of time intervals per participant. Things become more complex, however, when behavioral events or a large number of time intervals are used. One common approach is to pool repeated measurements from each participant into summary scores such as the mean of each behavioral dimension or the proportion of items assigned to each behavioral category. Groups of participants (or conditions) can then be compared using mean summary scores. For example, Girard et al. (2014) compared depressed participants before and after treatment on the amount of time they contracted different facial muscles during a clinical interview. While this type of approach is simple and intuitive, a number of more sophisticated methods for statistical analysis have been developed and applied to observational data in recent years. Several notable methods are multilevel modeling, sequential analysis, and dynamic systems analysis.
Multilevel modeling (e.g., Kreft & de Leeuw, 1998; Raudenbush & Bryk, 2002) enables researchers to account for and ask research questions about the hierarchical structure of “nested data.” A hierarchy consists of lower level observations nested within one or more higher levels. Examples include students nested within classrooms and workers nested within departments; these classrooms and departments may, in turn, be nested within schools and within corporations. Hierarchies are very common in observational data and this structure must be taken into account if analyses are to be accurate; of particular importance here is the nesting of repeated measurements within individual participants. For example, Girard et al. (2015) used multilevel models nesting video frames within participants to examine the influence of frame-level (i.e., illumination and head pose) and participant-level (i.e., gender and ethnicity) variables on the accuracy of a fully automated facial expression analysis system.
Sequential analysis (Bakeman & Quera, 2011) enables researchers to ask questions about the temporal ordering and contingent relationships between behavioral categories. Importantly, these behavioral sequences may occur within or between individuals. As an early example, Bakeman and Brownlee (1980) found that children tended to transition from parallel activity to group play at rates greater than would be expected by chance, suggesting that children “size up” potential playmates before committing to group play. More recently, Knobloch-Fedders et al. (2014) examined behavioral sequences between romantic partners, finding that relationship quality was negatively associated with sequences of demanding behavior from one partner being met with either withdrawing or submissive behavior from the other partner. These important relationships between behaviors would have been missed by nonsequential analyses.
Finally, dynamic systems analyses (Salvatore & Tschacher, 2012) enable researchers to ask questions about the relationship of a behavioral process to time; these include analyses of periodicity (i.e., repeating cycles), nonlinear change over time, deterministic chaos (i.e., quasiperiodic cycles), and self-organization. Of particular interest in observational measurement are the “attractor states” that a dynamic behavioral system tends to return to when perturbed and the “phase transitions” that it goes through when reorganizing. Examples of dynamic systems analyses involving observation of one and two individuals are provided for illustration. Hayes and Yasinski (2015) found that more variability in patients’ thoughts, behaviors, emotions, and somatic functioning in the later phase of cognitive therapy for personality disorders predicted more symptom reduction at termination, suggesting that destabilization of old patterns may be necessary for new, healthier patterns to develop. Ramseyer and Tschacher (2011) used dynamic systems analyses to model the nonverbal interaction of patients and psychotherapists as a self-organizing system characterized by the emergence of body movement synchrony; overall, they found that more synchrony predicted higher relationship quality and symptom reduction.
Future Directions
We are entering an exciting new era of behavioral science in which computer-assisted and fully automated measurement tools are beginning to yield unprecedented increases in the efficiency and scalability of observational measurement. We would like to highlight several research directions that are particularly important to pursue in this new era.
First, observational researchers can improve the rigor and comprehensiveness of their validation methods by reaching beyond interobserver reliability. Although interobserver reliability is an important source of validity evidence, it is by no means sufficient. Evidence from content, response processes, and hypothesized relationships among variables is sorely needed. In particular, observational researchers can begin by demonstrating that their observational measurements of a given construct are related to accepted measures of similar constructs and are unrelated to accepted measures of distinct constructs. Ongoing validation is especially important for fully automated measurement tools, which may have a restricted range of dependability based on their training data.
Second, observational researchers can help standardize the use of popular measurement instruments and detect group drift by increasing the sharing and comparing of observational data (i.e., audiovisual records and measurements) across research groups. The facial expression analysis community has advanced several relevant practices that are worth replicating in other areas of observational research. One is the “certification test” (e.g., the FACS Final Test; Ekman & Friesen, 1978), which provides a standardized set of observational data for trainees to demonstrate their proficiency on. Another is the “community challenge” (e.g., the FERA Challenge; Valstar et al., 2015), which provides a standardized set of observational data for researchers to use in comparing the performance of their fully automated measurement tools.
Third, observational researchers can continue to improve fully automated measurement tools by increasing their range of dependability and leveraging contextual and multimodal information. Of particular importance is for researchers to demonstrate that a given algorithm can maintain its accuracy when applied to data sets very different from the one(s) it was trained on. Researchers can also use these tools to push the envelope of what’s possible in observational research. For instance, algorithms may be capable of quantifying subtle changes in behaviors that human observers struggle with, such as the amplitude and velocity of motion. In the facial expression analysis literature, such properties have already demonstrated utility in differentiating different types of smiles (Ambadar, Cohn, & Reed, 2009; Schmidt, Ambadar, Cohn, & Reed, 2006) and different mental health states (Juckel et al., 2008; Mergl, Mavrogiorgou, Hegerl, & Juckel, 2005). Hybrid tools that automate some but not all aspects of observational measurement are another promising avenue of research (e.g., De la Torre, Simon, Ambadar, & Cohn, 2011).
Finally, more research is needed to explore how specific behavioral signs (e.g., muscle movements, vocal qualities, and body/hand gestures) relate to intended and interpreted behavioral messages (e.g., affective and cognitive states). Of particular importance is establishing the specificity and generality of any identified relationships (Cacioppo & Tassinary, 1990). Research on how signs are interpreted by observers can be an excellent starting place, but studies of when (and why) signs are produced by participants are also necessary. Only through diligent measurement and careful examination of well-designed observational data can we decode the complex world of meaning contained in behavior.
Footnotes
Declaration of Conflicting Interests
The author(s) declared no potential conflicts of interest with respect to the research, authorship, and/or publication of this article.
Funding
The author(s) disclosed receipt of the following financial support for the research, authorship, and/or publication of this article: Preparation of this article was supported in part by the National Institute of Mental Health of the National Institutes of Health under Award Number MH096951 and Army Research Laboratory Collaborative Technology Alliance Program under Cooperative Agreement W911NF-10-2-0016.