
Abstract
The aims of this study were to culturally adapt the Reactions to Ageing Questionnaire (RAQ) for a non-Western (Malay) population, and explore attitudes to ageing in relation to age, gender, and education. Eight new culturally relevant items were generated by asking Malay-speaking participants about their reactions to ageing. A Malay version of the extended 35-item RAQ was then administered to 911 Malaysian participants aged 18 to 60 years. Exploratory factor analysis revealed four factors. Three of the factors were similar to those identified in the original RAQ, while “Family and Religion” emerged as a new factor. More negative attitudes to ageing were observed in younger and female respondents. There were no effects of education. This culturally adapted RAQ exhibits robust psychometric properties, and could be used to assess attitudes to ageing in Malaysia and other Southeast Asian countries. Moreover, we have identified a “core set” of RAQ items that could be applicable worldwide.
Attitudes to ageing can be defined as feelings, cognitions, and behaviors related to the process of ageing as a personal experience (Hess, 2006), including the views, interpretations, experiences, expectations, and concerns that an individual holds about their own ageing (Janeckova, Dragomirecka, Holmerova, & Vankova, 2013; Levy, 2003; Steverink, Westerhof, Bode, & Dittmann-Kohli, 2001). Attitudes to ageing can be held both by people who have already experienced ageing (e.g., those more than 60 years of age; United Nations, 2013), and by those who are younger (Kornadt & Rothermund, 2015). However, the nature and determinants of these attitudes are understood to differ in some important ways. In particular, as people get older, their attitudes may be informed by their personal experiences of age-related changes (O’Hanlon & Coleman, 2008), such as to their appearance (e.g., wrinkled skin and graying hair), functioning (e.g., reduced stamina), or health (Diehl, Wahl, Brothers, & Miche, 2015). In contrast, attitudes to ageing held in younger life are more likely to be informed by observations of other people’s ageing (Gilbert & Ricketts, 2008), or from cultural stereotypes of old age (Levy, 2009), and thus are composed of expectations, hopes, and fears about how the self and life will be in later life (Kornadt, Voss, & Rothermund, 2015).
Empirical studies have shown that negative attitudes to ageing held by adults in younger life can have important consequences for future health and well-being. For example, Klusmann, Sproesser, Wolff, and Renner (2019) showed that positive attitudes to ageing at baseline predicted healthier eating patterns over a 1-year follow-up period in both middle-aged (36-64 years) and younger (18-35 years) adults, even after controlling for participants’ gender and baseline eating behavior, health, and body mass index. More positive attitudes to ageing in middle-aged adults of good health have also been shown to be positively associated with levels of sporting activity 6 years later (Wurm, Tomasik, & Tesch-Römer, 2010). Such associations between attitudes to ageing and engagement in health behaviors highlight the importance of understanding the content and valence of attitudes to ageing held by people before they reach later life.
There is evidence that attitudes to ageing held before old age can be influenced by a range of demographic variables, including age, gender, and education level. For instance, previous studies have demonstrated that attitudes tend to be more negative at younger ages (Abramson & Silverstein, 2006; Draper, Gething, Fethney, & Winfield, 1999; Golden, Gammonley, Hunt, Olsen, & Issenberg, 2013; Mosher-Ashley & Ball, 1999; Unsworth, McKee, & Mulligan, 2001) and among women (Abramson & Silverstein, 2006; Barrett & Von Rohr, 2008; Cummings, Kropf, & De Weaver, 2000; Draper et al.,1999; Golden et al., 2013). These findings are consistent with the notion that anxiety toward an anticipated event (in this case ageing) is greater than when that event is actually experienced (Yan, Silverstein, & Wilber, 2011), and that the anticipation of ageing may be more negative for women due to cultural preferences for youthfulness (Armitage, 2016) and physical appearance (Barrett & Von Rohr, 2008). The influence of education in adults younger than 60 years is less clear; although studies with middle aged participants have shown higher levels of education to be associated with more positive attitudes to ageing (Joshi, Malhotra, Lim, Ostbye, & Wong, 2010), studies with a broader range of younger participants (e.g., aged 15-69 years) have found no effects of education on attitudes to ageing (Gething, 1994; Gething et al., 2002; Gething et al., 2004). One reason for this discrepancy in the effects of education could be that the younger populations in the studies by Gething (1994), Gething et al. (2002), and Gething et al. (2004) were health care workers, who are more likely than the general population to have higher levels of education.
Despite the importance of measuring attitudes to ageing in younger populations, most of the commonly used measures have been specifically developed for use with older adults (i.e., those aged over 60 years). For instance, the Attitudes to Ageing Questionnaire (Laidlaw, Power, & Schmidt, 2007) and the Aging Perception Questionnaire (Barker, O’Hanlon, McGee, Hickey, & Conroy, 2007) ask older participants to reflect on their own experiences of ageing, and so are not suitable for younger individuals who have yet to experience the ageing process. The Reactions to Ageing Questionnaire (RAQ) is one of the few measures of attitudes to ageing that has been designed to be administered to people aged younger than 70 years (Gething, 1994), and operationalizes attitudes to personal ageing in terms of an individual’s anticipations of their future characteristics when they are old (Koder & Helmes, 2008b). The RAQ was first developed from open-ended responses about how nurses felt about ageing, and then validated using a sample of 531 health care specialists and a general population sample aged 15 to 69 years. Psychometric analysis of this original 27-item version revealed six factors: anxiety about the future, physical well-being, psychological well-being, denial of ageing, isolation, and activity (Gething, 1994).
The RAQ has been validated for use in Australia (Gething et al., 2004; Koder & Helmes, 2006, 2008a, 2008b; Netz, Guthrie, Garamszegi, & Dennerstein, 2001), Canada (Helmes & Pachana, 2015), the United Kingdom (Gething et al., 2004; Unsworth, McKee, & Mulligan, 2001), and Sweden (Gething et al., 2004). However, there are inconsistencies in the numbers and content of the factors extracted, with some studies extracting as few as three factors (Gething et al., 2004; Koder & Helmes, 2006, 2008b; Wells, Foreman, Gething, & Petralia, 2004), and others identifying four (Koder & Helmes, 2008a) or five factors (Netz et al., 2001; Unsworth et al., 2001). Some items have also shown low factor loadings (Gething, 1994; Netz et al., 2001), and have been removed (Gething et al., 2004; Unsworth et al., 2001). Taken together, these inconsistencies in factor structure and weak factor loadings, suggest that more validation work is needed to refine the content of the scale.
To develop a full understanding of how attitudes to ageing form, develop, and influence future outcomes, it is important to look beyond Western populations (e.g., those in North America, Australasia, and Europe). It is therefore notable that the RAQ has not yet been tested in a non-Western country. Given that the original RAQ items were generated by Western participants, the content of the RAQ is also likely to be biased toward a Western understanding of ageing. This omission is important because research to date suggests that there may be key differences between Western and non-Western societies in the ways they perceive ageing and older people (Lockenhoff et al., 2015). For instance, Western populations, with more individualistic values, tend to value older adults less highly and attach greater importance to self-fulfillment, freedom, and individuality (Wang & Mallinckrodt, 2006). In contrast, Eastern populations (e.g., Southeast Asian and Middle Eastern) tend to hold more collectivistic values that play important roles in guiding intergenerational relations, in which adults are expected to be considerate, respectful, and supportive toward their parents (Kim, Cheng, Zarit, & Fingerman, 2015).
Malaysia can be considered representative of Southeast Asia, a region that has a land mass of 4.5 million km2 (10.5% of Asia), is home to 641.8 million people, and includes countries such as Singapore, Thailand, and Indonesia as well as Malaysia (United Nations, 2017). Malaysia is typical of this region in terms of gross domestic product per capita ($26,141 vs. mean $22,777 for the Southeast Asian region: International Monetary Fund, 2017) and subjective well-being (M = 7.13 vs. M = 7.21, for other Southeast Asian countries; World Values Survey, 2017). Moreover, consistent with the idea of “Eastern values” compared with “Western values,” Malaysian citizens strongly endorse collectivistic values (Kunhen et al., 2001), routinely practice values of filial piety (Damulak, Minhat, & Rahman, 2015), engage in high levels of caregiving (Minhat, Hamizah, & Nor Afiah, 2015a), show high levels of family support (Teh, Tey, & Ng, 2014), and a high proportion of them live with elderly relatives (Kooshiar, Yahaya, Hamid, Abu Samah, & Jou, 2012). Malaysian people are also more likely to hold conservative values, and are keener to teach values of thrift and hard work in their offspring, compared with people in the West (Bomhoff & Gu, 2012).
Given the cultural differences between Eastern and Western cultures, simple translation of the RAQ from English is unlikely to capture sufficiently the content of the attitudes held by a non-Western population (Schellingerhout et al., 2011). Instead, measures of attitudes to ageing will likely require some cultural adaptation to ensure that they fully capture the attitudes held by the population of interest. For this reason, the aims of the present study were to culturally adapt and validate a Malay version of the RAQ, and then explore the effects of key demographic variables (age, gender, and education, which are among the most frequently explored variables in Western populations) on attitudes to ageing. In order to achieve this aim, we first generated potential new items for the RAQ by asking Malay participants to report their thoughts and feelings about their own ageing. A Malay-language version of this culturally adapted scale was then administered to a large sample of Malay participants aged 18 to 60 years of age. Given the known relationships between attitudes to ageing and age and gender (Draper et al., 1999; Golden et al., 2013), we expected that older participants and men would have more positive attitudes to ageing. The effect of education was also explored.
Method
Participants
Participants in the present study were employees of public sector organizations around Kedah, the Northern region of Peninsular Malaysia. Public rather than private sector organizations were approached because the Ministry of Information was able to supply a list of all such organizations, making it possible to approach all organizations, and minimize the risk of selection bias. According to the Department of Statistics Malaysia (2016), about 1.65 million people (12.2%) work in this sector out of 13.5 million employees in Malaysia. Inclusion criteria for the present study were as follows: (a) to be an employee aged 18 to 60 years old and (b) to be fluent in the Malay language, with self-reported language proficiency at either Level 4 (full professional proficiency) or Level 5 (native proficiency; Interagency Language Roundtable, 2016).
Materials
Cultural-Adaptation of the RAQ
The original 27-item RAQ (Gething et al., 2004) was first translated into the Malay language using an English–Malay–English back translation procedure (Ozolins, 2009). Members of the research team compared the original and the back-translated English versions to identify any differences in the meanings of the items. Any problems were then resolved through discussions between a Malay–English bilingual linguistics scholar and members of the research team. As a final check for clarity, this revised translated version was then administered to 18 Malay-speaking participants living in the North West region of the United Kingdom. These participants were purposively recruited to ensure approximately equal numbers of women (n = 10) and men (n = 8); and a spread of age ranges, 18 to 29 years (n = 6), 30 to 39 years (n = 7), 40 to 49 years (n = 3), and 50 to 60 years (n = 2); and ethnicities, Malay (n = 14), Chinese (n = 3), and Indian (n = 1). All participants were native Malay speakers who were born in Malaysia and had spent fewer than 5 years in the United Kingdom.
Participants were asked to “think aloud” (Kaklamanou, Armitage, & Jones, 2013) when completing the questionnaire. This required the participants to complete the questionnaire while telling the researcher everything they were thinking as they did so. Any ambiguities or misunderstandings about the items arising from this procedure were then addressed through discussion within the research team.
Candidate new items for inclusion in the culturally adapted version of the Malay RAQ were identified by asking the same 18 participants to respond to an item in the Malay language that asked them to: “Imagine that you are over the age of 65. Tell me how you feel about your own ageing.” This open-ended question was based on that used by Gething (1994) when developing the original version of the RAQ. Although the precise question used to elicit participants’ responses was not reported, Gething (1994, p. 77) states that participants “were asked to write open-ended responses about how they felt about their own ageing.” This task was presented before participants completed the Malay translated RAQ to prevent their responses from being influenced by the contents of the RAQ.
Content Analysis of Open-Ended Responses
In line with the concept mapping of open-ended responses procedure described by Jackson and Trochim (2002), each response to the open-ended question was first split into single concept phrases. These phrases were then sorted into groups of similar statements (themes), and the frequency of responses within each theme calculated. This procedure produced eight themes relating to attitudes to ageing (Supplemental material [i], available in online version of the article]). The content of the themes was then compared with the existing items of the RAQ to identify any topics that were not sufficiently covered by the existing items, so that candidate new items could be developed, where necessary.
The content of one of these themes (death) was already represented in the original version of the RAQ (e.g., Item 7: I worry about dying and leaving behind those I love), and so no new items related to this theme were generated. An additional four themes (Themes 2-5) were already covered in the original RAQ, but the existing items did not capture the full breadth of participants’ responses. For example, although the physical appearance (Theme 2) theme was partly covered in the original RAQ (Item 21: I won’t like growing old), the item did not refer to physical appearance, and so a new item was generated to capture this (I won’t like looking old). Theme 3 (health) was covered by a number of items in the original RAQ (e.g., Item 2: I worry that I might become senile and lose my mind; Item 17: I worry about becoming frail), but none of these items related to the more general health worries reported by our participants, and so a new item was generated to capture this (I worry about my health getting worse). For Theme 4 (ability to do desirable things), Item 25 of the original RAQ (There is a lot to look forward to in regard to being old) was relevant, but very general, and did not specifically mention being able to undertake desirable activities. Therefore, a more specific new item (I will have more time to do things that I enjoy) was generated. Two new items were also developed to capture the content of Theme 5 (family relationships). This is because participants’ responses to this theme mainly focused on family or parent–child relationships, whereas existing relationship items in the RAQ were more general, and seemed to refer more to relationships with partners (e.g., Item 16: I look forward to growing old with someone I love). The final three themes (6-8: religion; acceptance of ageing; and financial concerns) were not represented in the original version of the RAQ, and so new items relating to these themes were generated to capture the meaning of participants’ responses. The results of content analyses, participants’ responses, and the candidate new items generated are presented in the Supplemental material (i).
The final questionnaire therefore comprised 27 translated items from the original RAQ and eight new items (see Supplemental material [ii] available in online version of the article). Participants were asked to indicate how much they agreed or disagreed with each statement in relation to how they might feel when they are older than age 65. Responses were given on a 5-point Likert-type scale ranging from strongly disagree (1) to strongly agree (5). This response scale differed slightly from the 6-point scale used by Gething (1994). This was because the RAQ was administered as part of a larger battery of questionnaires, and a consistent response style between questionnaires was used to minimize the potential for confusion. Eighteen of the 35 items (2, 4, 7, 8, 9, 11, 13, 17, 18, 19, 20, 21, 23, 26, 27, 29, 30, and 31) were reverse scored so that a higher score always indicated more positive attitudes. Total scores on the RAQ could therefore range from 35 to 175, with higher scores on all items indicating more positive attitudes to ageing.
Procedure
The study was approved by the University of Manchester Research Ethics Committee (Reference: 15223) and the Malaysian Economic Planning Unit. The data were collected between October and December 2015. Letters asking permission to conduct the study were sent to 68 organizations listed by the Ministry of Information, Kedah, including schools, the immigration department, and religious centers. Sixty-seven of these organizations agreed to be involved with the study. The researcher then provided packs of questionnaires to the managers of each of these organizations. Managers were asked to distribute the questionnaires to all employees in their organization, and ask them to complete and return them within the next 2 weeks. This approach was taken as using legitimate authority, such as management support, has been found to increase participant response rates, particularly in Asian countries (Krishnan & Poulose, 2016).
Each questionnaire pack contained a participant information sheet, the culturally adapted Malay RAQ, demographic questions (date of birth, gender, language proficiency, and levels of education, for which participants indicated which of four categories (high school, certificate/diploma, undergraduate, or postgraduate) best represented their highest level of education, plus a number of other measures of attitudes, health, and well-being that were collected as part of a larger study. The questionnaires were completed anonymously and the participants were asked to seal the opaque envelope provided after the completion of the questionnaire to ensure confidentiality. The researcher subsequently collected the envelopes from the manager.
Data Analysis
The analyses were carried out using IBM SPSS 23. We first used exploratory factor analysis to examine the basic structure of the culturally adapted RAQ, and to identify items with low factor loadings. Cronbach’s alpha coefficients were then calculated to evaluate internal consistency. The effects of sociodemographic variables (age, gender, level of education) on the full scale subscale scores of the RAQ were then tested using an alpha value of .05 (i.e., p < .05), using analysis of variance (ANOVA). To maximize comparability with the original RAQ validation by Gething (1994), four age groups (18-29, 30-39, 40-49, and 50-60 years) were used for these analyses. To minimize the number of small sample sizes within each cell of the factorial design (Tabachnick & Fidell, 1996), the four educational background categories were collapsed into two broader categories of lower (high school and certificate/diploma) and higher (undergraduate/postgraduate) education.
Results
Participant Characteristics
Overall, 1,731 questionnaire packs were distributed to the managers of the 67 participating organizations. Of these, employees returned 957 questionnaires to their managers. Thirty-one of these questionnaires contained at least one full scale that had not been completed, and so were excluded from subsequent analyses. Data from an additional nine participants were excluded because they had missed one or more items of the RAQ, and from one participant who was an extreme outlier (more than three interquartile ranges from the rest of the scores). The data from a further five participants were excluded for not meeting language inclusion criteria (i.e., indicating that their Malay proficiency was lower than full professional proficiency). The final sample therefore comprised 911 participants (Table 1). The sample size was considered appropriate on the basis of meeting the recommendation by Hair, Black, Babin, and Anderson (2014) of achieving a minimum participant: item ratio of 1:20 (i.e., 700 participants for a 35-item measure), and being close to the 1,000 participant level that is considered “excellent” (Comrey & Lee, 1992). Ten of these participants did not provide their year of birth. Data for these participants were included in the factor analysis, but not in the analyses involving age.
Demographic Information.
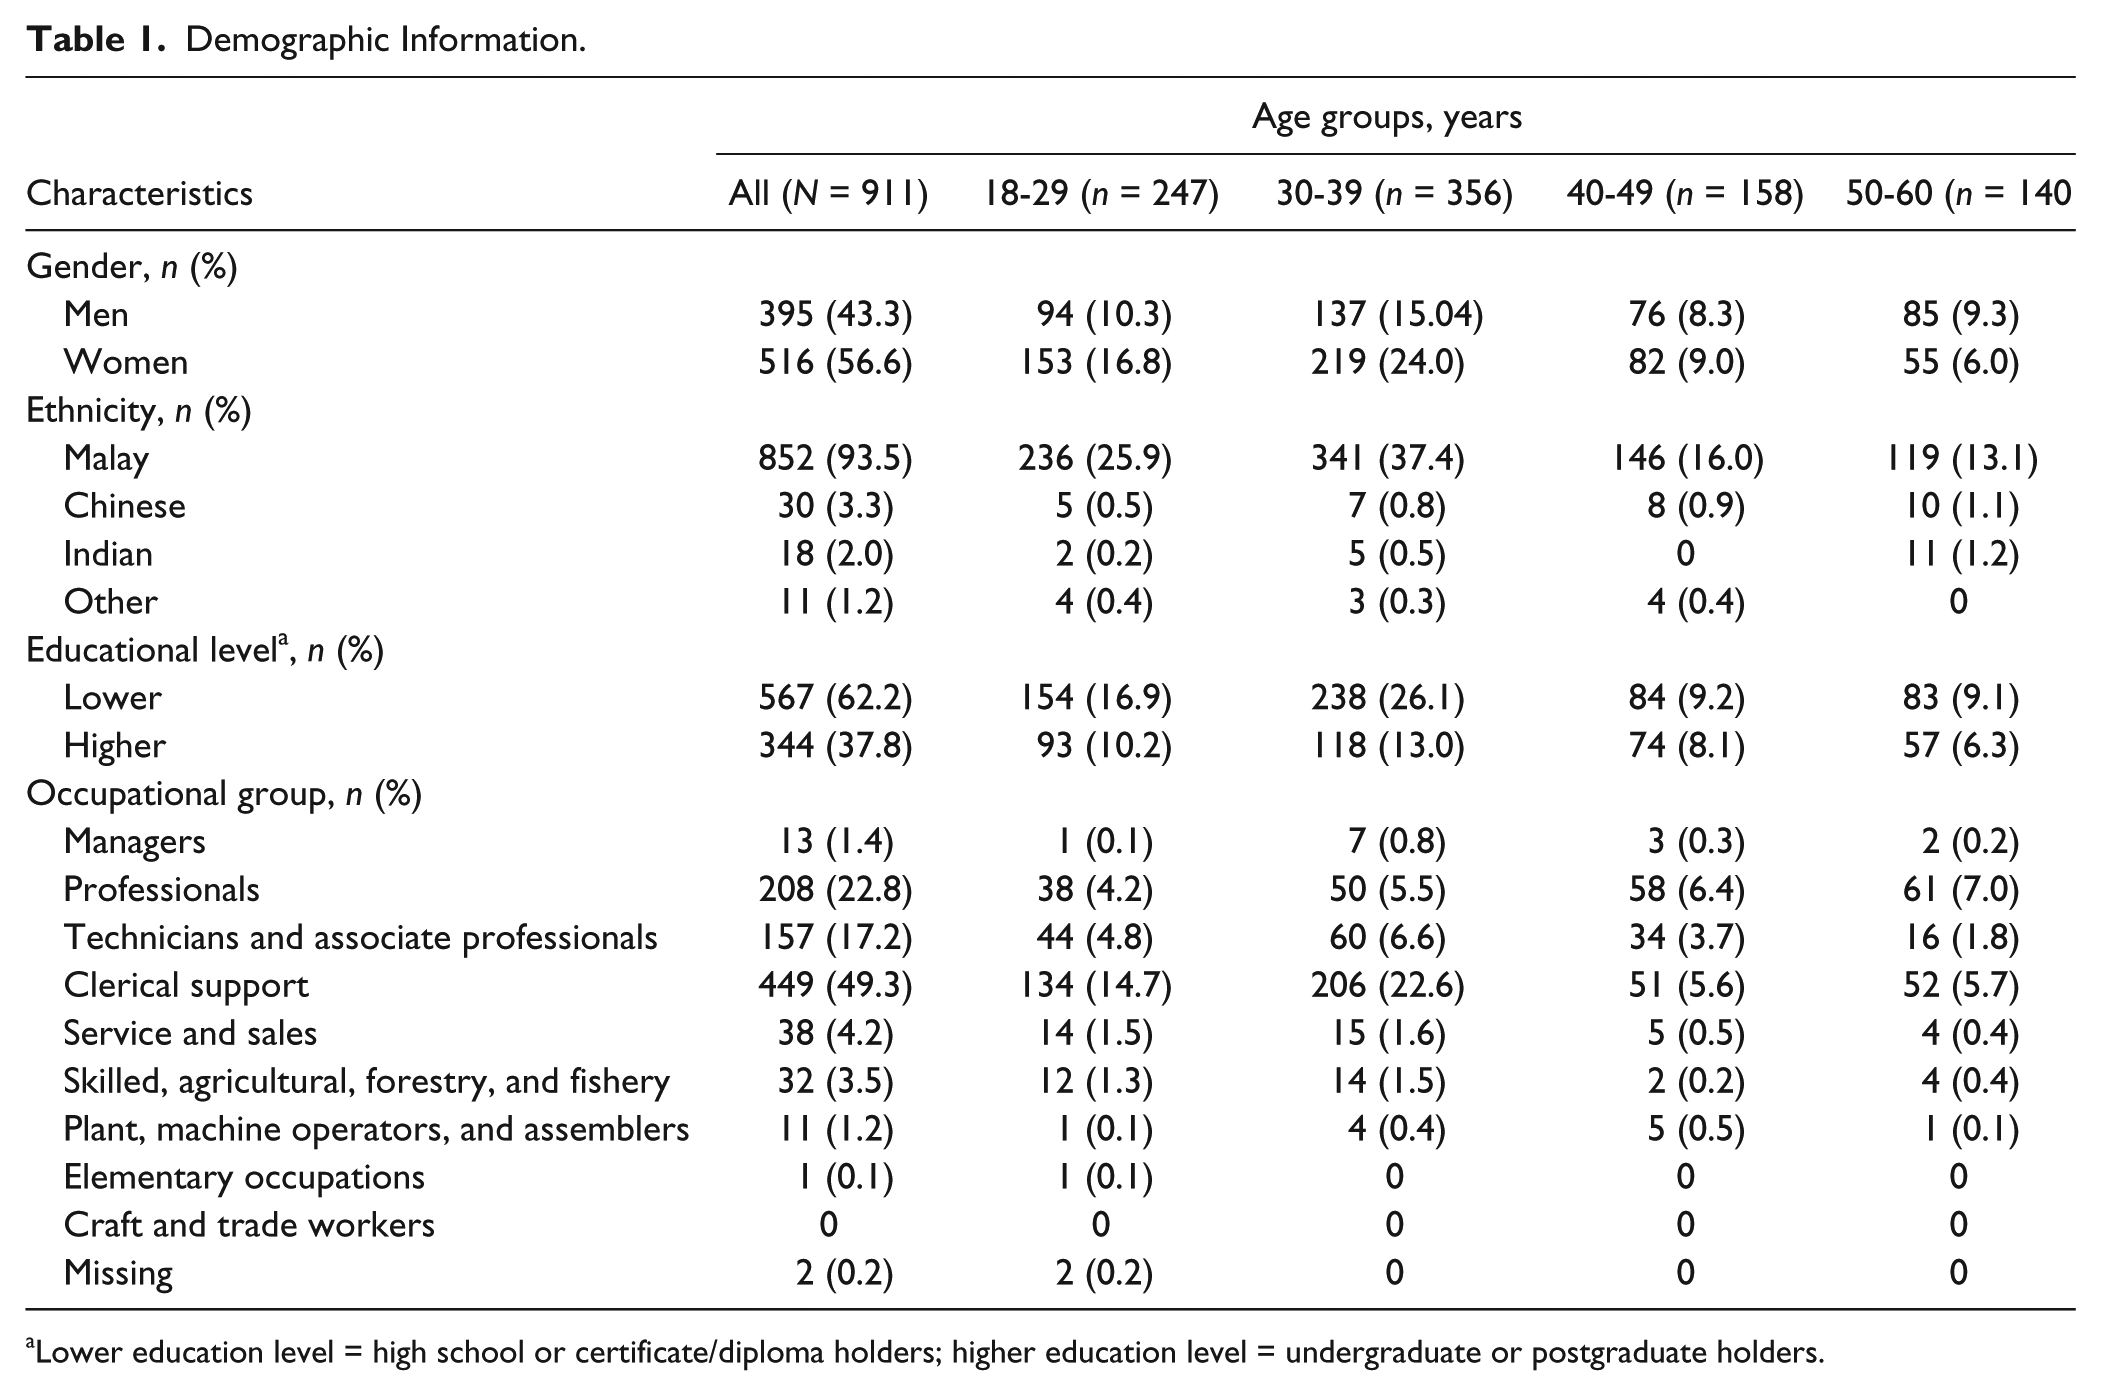
Lower education level = high school or certificate/diploma holders; higher education level = undergraduate or postgraduate holders.
More women (n = 516) than men (n = 395) participated in the research (Table 1), whereas national census data indicate that there are 0.84 million men and 0.81 million women employed in the public sector (Department of Statistics Malaysia, 2016). In the present study, the majority of participants (94%) were of Malay ethnicity, followed by Chinese (3.3%), Indian (2.0%), and others (1.2%). These proportions differ slightly from Malaysian population levels, which are reported as 68.6%, 23.4%, 7.0%, and 1.0% for Malay, Chinese, Indian, and others, respectively (Department of Statistics Malaysia, 2016). In terms of education levels, more participants had lower (n = 567) than higher levels of education (n = 344). Job types were classified into nine categories, as specified by the Ministry of Human Resources (2008). Almost half of the respondents (49.3%) were categorized as being clerical support workers (e.g., clerks or secretaries), 22.8% as professionals (e.g., lecturers or engineers), with technicians and associate professionals (e.g., nurses or laboratory assistants) making up the remaining 17.2%. The present sample differed from the general Malaysian population, with those in lower level occupations (e.g., cleaner, street vendor, machine operators) being underrepresented (Ministry of Human Resources, 2015).
Factorial Structure of the RAQ
An exploratory factor analysis was conducted on participants’ responses to the 35 items of the Malay RAQ. The coefficient value of the Kaiser–Meyer–Olkin test revealed an excellent level of sampling adequacy (0.91), and the Bartlett’s Test of Sphericity was statistically significant (p < .05), suggesting that the data were meaningful. The exploratory factor analysis produced six components with eigenvalues greater than one. However, the scree plot showed a sharp decrease after the fifth factor, suggesting that a four-factor model was more appropriate. This was confirmed by a Monte Carlo Parallel Analysis (Ladesma & Valero-Mora, 2007), which showed that random ordered eigenvalues were below the actual eigenvalues for only four factors.
As the data were normally distributed, and there are possible correlations among the factors tested, maximum likelihood extraction and oblique rotation methods were used (Costello & Osborne, 2005). These methods are consistent with previous analyses of the RAQ (Gething, 1994; Gething et al., 2004). In order to identify items that most clearly represent the four extracted factors, any items loading less than .45 were excluded. Comrey and Lee (1992) recommend this cut-off on the grounds that only items loading above this value can be considered to be fair descriptors of the underlying construct. Ten items were excluded using this criterion, only one of which was one of the new items generated for the present study (Item 32: I will accept the fact that I am old). The other seven new items were retained, indicating a broader relevance of the new items to participants’ attitudes to ageing. The final culturally adapted scale therefore comprised 25 items as shown in Table 2: 11 for “Negative Thoughts About Growing Older”; 3 for “Family and Religion”; 6 for “Positive Aspects of Ageing”; and 5 for the “Perceived Personal Attributes” factor. Supplemental material (iii [available in online version of the article]) provide results for the full 35-items.
Eigenvalues and Factor Loadings of the 25 Items Retained in the RAQ.
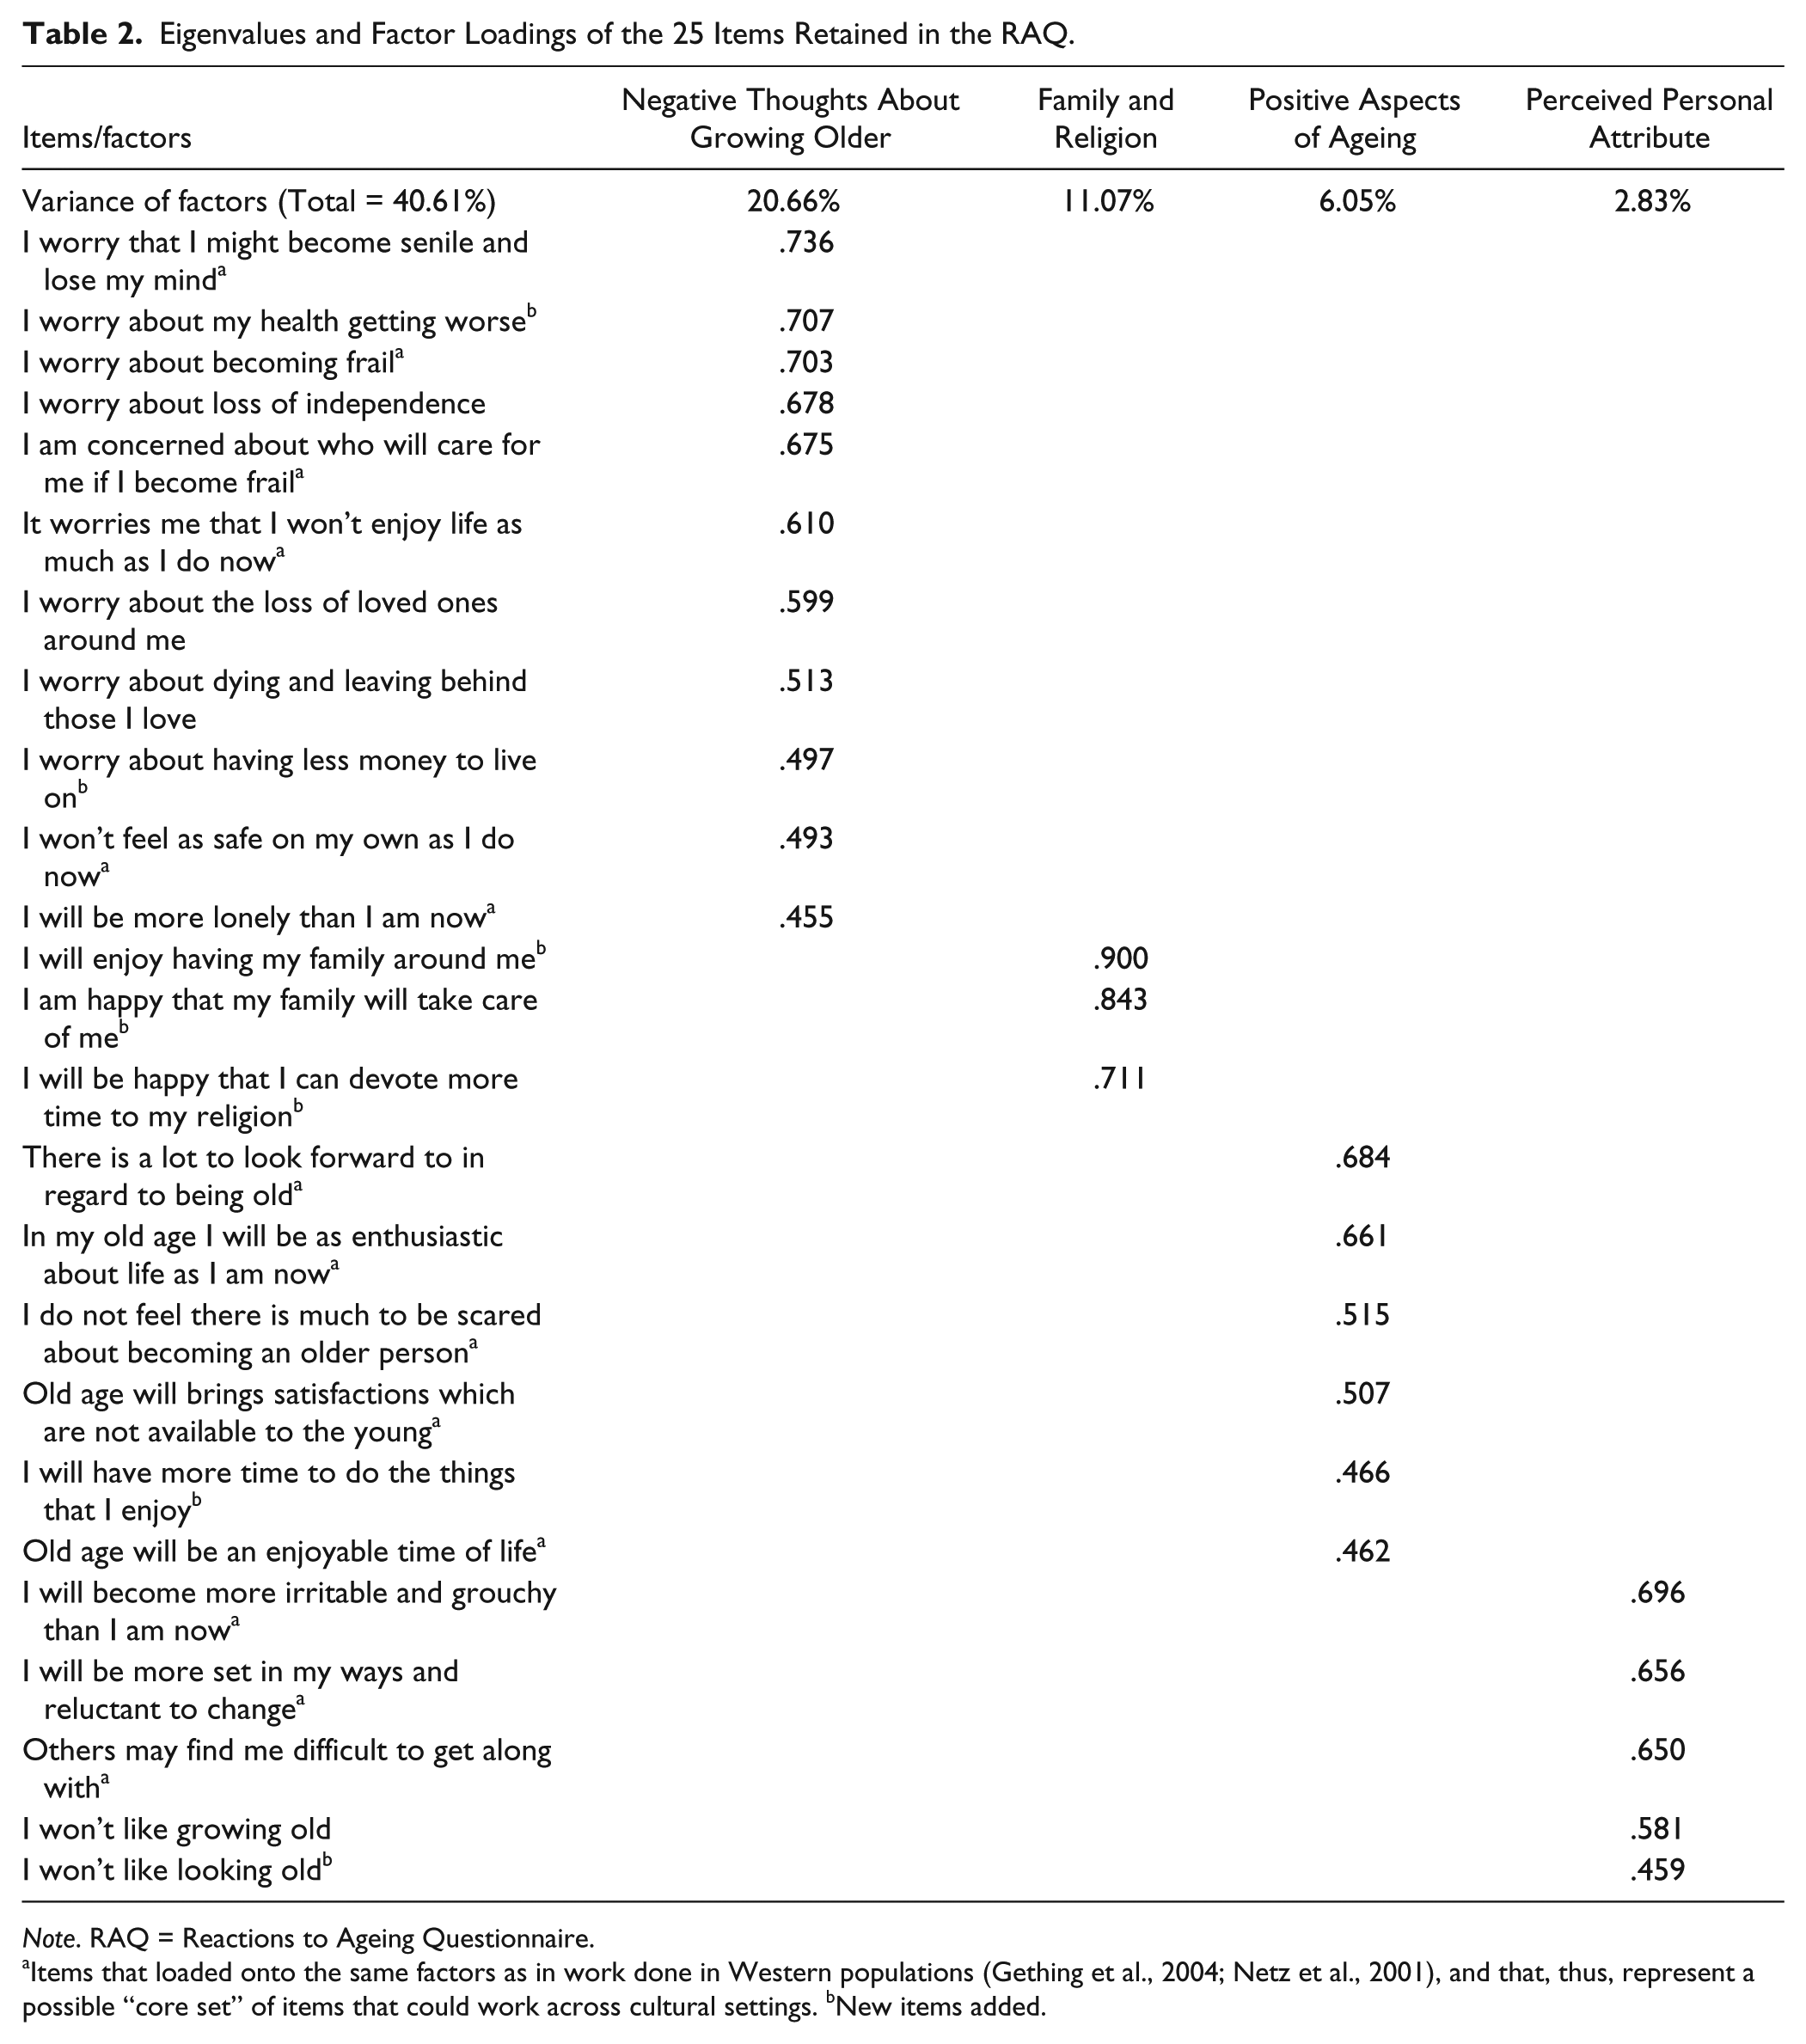
Note. RAQ = Reactions to Ageing Questionnaire.
Items that loaded onto the same factors as in work done in Western populations (Gething et al., 2004; Netz et al., 2001), and that, thus, represent a possible “core set” of items that could work across cultural settings. bNew items added.
As shown in Table 2, the first, third, and fourth factors were similar to those found by Gething et al. (2004), Netz et al. (2001), Koder and Helmes (2006, 2008a, 2008b), and Unsworth et al. (2001), namely, “Negative Thoughts About Growing Older” (Factor 1), “Positive Aspects of Ageing” (Factor 3), and “Perceived Personal Attributes” (Factor 4). In particular, 14 of the original items loaded onto the same factors as in previous work, thus representing a possible “core set” of items that may work well across cultures (Table 2). The second factor represented a novel dimension of attitudes to ageing, namely, “Family and Religion,” which comprised solely of new items generated by Malay participants.
Internal Consistency
Overall, the revised Malay version of the RAQ had an internal reliability of α = .88. The reliabilities of each subscale ranged from α = .73 to .89 (Table 3), indicating good internal consistency (Field, 2005). The “Negative Thoughts About Growing Older” factor and the “Perceived Personal Attitudes” factor were strongly correlated with the total RAQ score (r = .87 and .77, respectively), while the “Positive Aspects of Ageing” factor showed a moderate correlation (r = .55). The “Family and Religion” factor correlated less strongly with total RAQ scores (r = .21). This is probably due to the smaller number of items in this factor, and indicates that the factors may be best considered as separate variables that together form a meaningful construct, rather than interchangeable dimensions (Mokkink et al., 2012).
Internal Consistency and Correlation Matrix of the Malay Version of the RAQ.

Note. RAQ = Reactions to Ageing Questionnaire. Higher scores in all factors indicate more positive attitudes to ageing.
p ≤ .001.
Demographic Differences in Total Reactions to Ageing Scores
The effects of demographic variables on overall RAQ scores were analyzed using a 4 (age group: 18-29 years vs. 30-39 years vs. 40-49 years vs. 50-60 years) × 2 (gender: women vs. men) × 2 (education level: low vs. high) ANOVA. There was a significant main effect of age group, F(3, 885) = 6.413, p < .001, η p 2 = .021. Post hoc Scheffe tests revealed that attitudes to ageing were significantly (p < .05) more positive in the oldest age group (50-60 years: M = 83.97, SD = 1.04) compared with the two younger age groups (18-29 years: M = 78.53, SD = 0.74, d = 6.03; 30-39 years: M = 79.85, SD = 0.64, d = 4.77). However, there were no differences in scores between the 40 to 49 years (M = 80.91, SD = 0.89) and 50 to 60 years age groups, or between the 18 to 29 years and 30 to 39 years age group. There was also a significant main effect of gender, F(1, 885) = 4.192, p = .041, η p 2 = .005, with men reporting more positive attitudes (M = 81.67, SD = 0.58) than women (M = 79.95, SD = 0.61). There was no significant main effect of education levels, F(1, 885) = 1.421, p = .234, η p 2= .002, and no significant interactions. Mean scores for all levels of each factor are presented in Table 4.
Means (Standard Deviations) for Scores on the Total RAQ and Each Subscale.
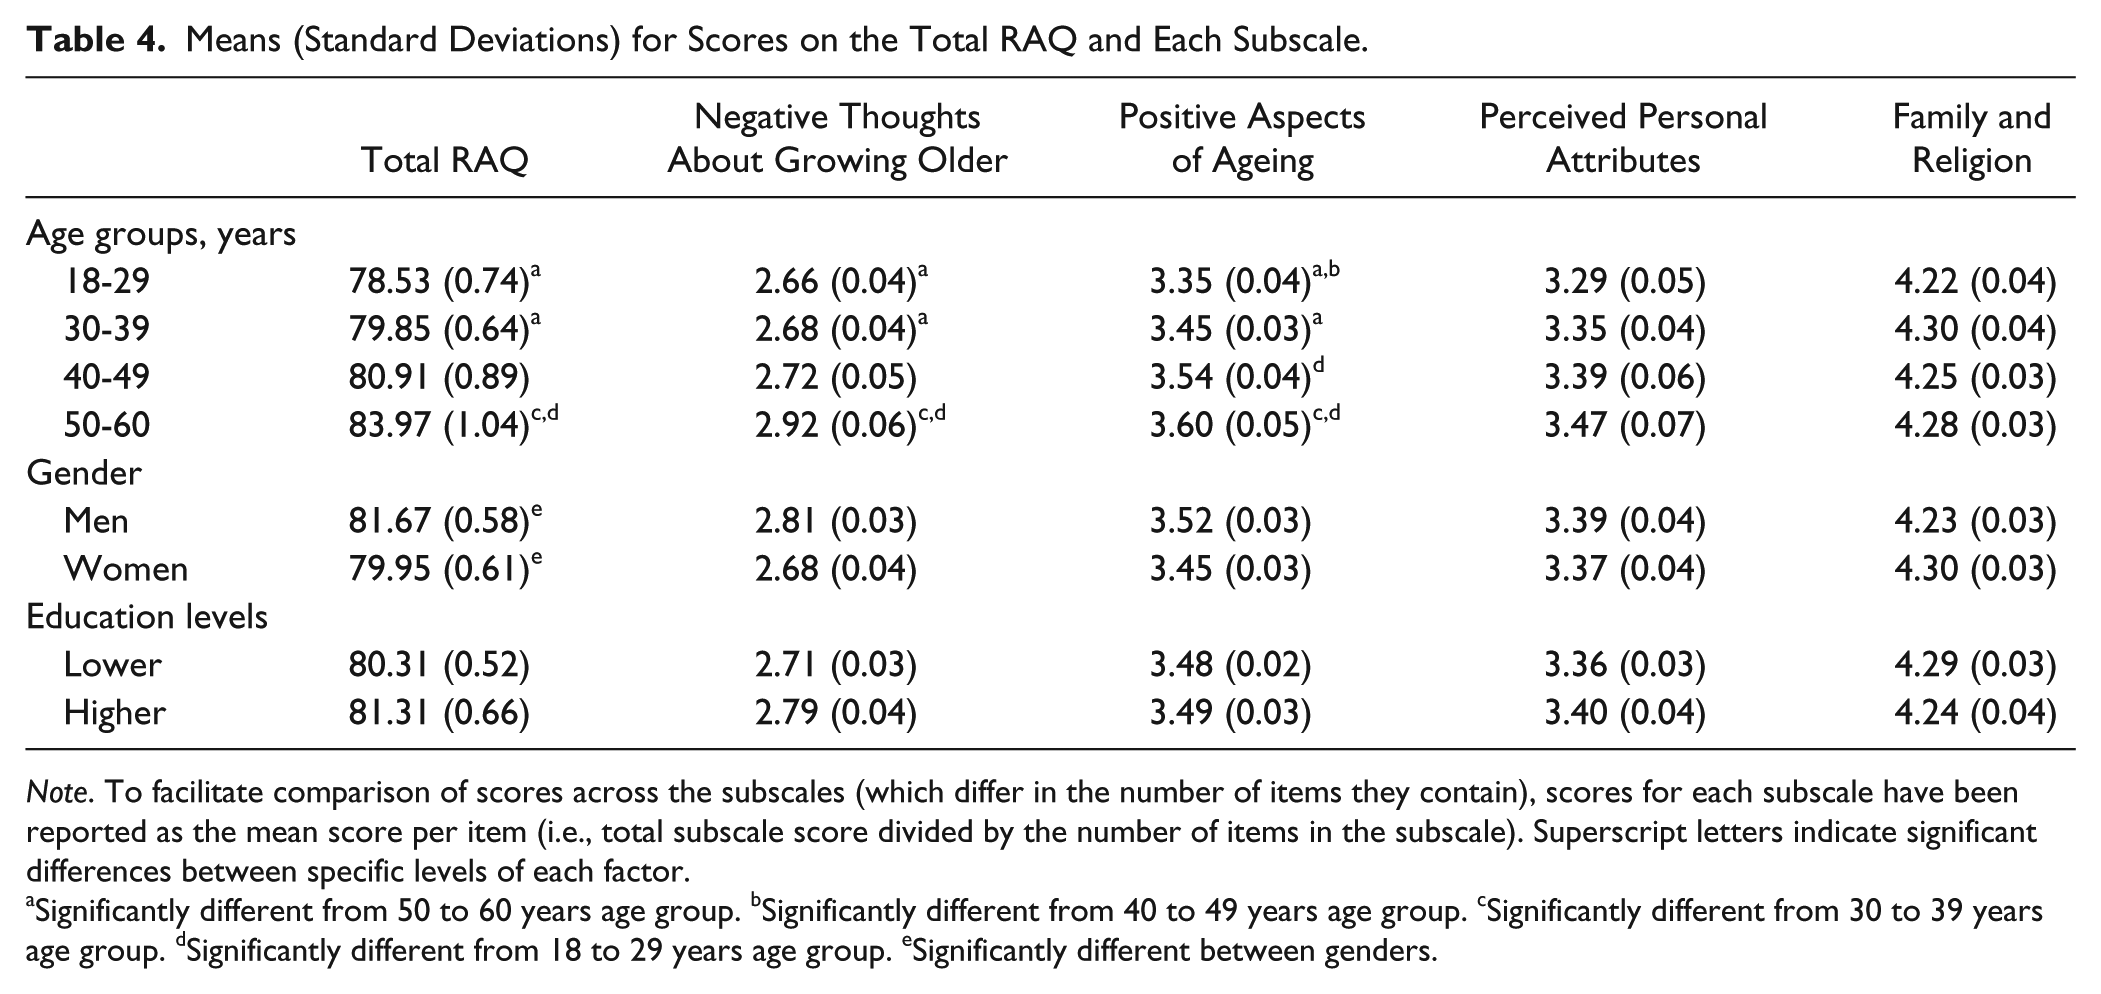
Note. To facilitate comparison of scores across the subscales (which differ in the number of items they contain), scores for each subscale have been reported as the mean score per item (i.e., total subscale score divided by the number of items in the subscale). Superscript letters indicate significant differences between specific levels of each factor.
Significantly different from 50 to 60 years age group. bSignificantly different from 40 to 49 years age group. cSignificantly different from 30 to 39 years age group. dSignificantly different from 18 to 29 years age group. eSignificantly different between genders.
Reactions to Ageing Subscales
A three-way univariate ANOVA was conducted for each of the four subscales of the Malay RAQ to observe the effects of age, gender, and education levels. To facilitate comparison between subscales with different numbers of items, mean scores for each subscale were calculated per item (i.e., out of a maximum of 5). Note that higher scores for each subscale indicate more positive attitudes to ageing.
Negative Thoughts About Growing Older
With regard to negative thoughts about growing older, there was a significant main effect of age group, F(3, 885) = 4.540, p = .004, η p 2 = .015. Post hoc Scheffe tests showed that scores in the oldest group (50-60 years: M = 2.92, SD = 0.06) were significantly higher (reflecting more positive attitudes to ageing) than the youngest two age groups (18-29 years: M = 2.66, SD = 0.04, d = 5.10; 30-39 years: M = 2.68, SD = 0.04, d = 4.71). There was also a significant main effect of gender, F(1, 885) = 6.429, p = .011, η p 2 = .007, with higher scores on this subscale in men (M = 2.81, SD = 0.03) compared with women (M = 2.68, SD = 0.04; Table 4). There was no main effect of education levels, F(1, 885) = 2.860, p = .091, η p 2 = .003, and no significant interactions between variables.
Positive Aspects of Ageing
For positive aspects of ageing, there was a significant main effect of age group F(1, 885) = 7.695, p < .001, η p 2 = .025. Scheffe tests showed that, as with the Negative Thoughts about Growing Older factor, positive aspects of ageing scores were significantly higher (indicating more positive attitudes to ageing) in the oldest group (50-60 years: M = 3.60, SD = 0.05) compared with people in the 18 to 29 years (M = 3.35, SD = 0.04, d = 5.52) and 30 to 39 years (M = 3.45, SD = 0.03, d = 3.31) age groups. Scores were also significantly higher in people aged 40 to 49 years (M = 3.54, SD = 0.04) compared with people aged 18 to 29 years (d = 4.75; Table 4). No other groups were significantly different from one another. There were no significant main effects of gender, F(1, 885) = 3.006, p = .083, η p 2 = .003; or education levels, F(1, 885) = 0.024, p = .876, η p 2 = .001; and no significant interactions.
Perceived Personal Attributes
For the Perceived Personal Attributes domain, there were no main effects of age group F(3, 885) = 1.603, p = .187, η p 2 = .005; gender F(1, 885) = 0.130, p = .719, η p 2 = .001; or education F(1, 885) = .557, p = .456, η p 2 = .001; and no significant interactions between them.
Family and Religion
For the Family and Religion factor, there were no significant main effects of age group F(3, 888) = 0.757, p = .518, η p 2 = .003; gender, F(3, 885) = 1.804, p = .180, η p 2 = .002; or education levels, F(1, 885) = 1.466, p = .226, η p 2 = .002; and no interactions between these variables.
Discussion
The aims of this study were to develop a culturally adapted Malay version of the RAQ, and to explore the effects of key demographic variables on RAQ scores in adults younger than 60 years of age. An exploratory factor analysis revealed four factors, including a “Family and Religion” factor that has not been identified in Western versions of the RAQ. Items with low factor loadings were deleted, resulting in high levels of internal consistency across the remaining scale and subscales. Overall, the total Malay RAQ scores were significantly affected by age and gender, in that men and older people had more positive attitudes to their ageing. Age and gender effects were also observed for some of the subscales, but no effects of education were seen for any subscale. Together, these results suggest that this culturally adapted Malay version of the RAQ provides a reliable measure of attitude to ageing that is differentially sensitive to age and gender.
Three of the four factors identified (Negative Thoughts About Growing Older, Perceived Personal Attributes, and Positive Aspects of Ageing) were conceptually similar to those found by Gething et al. (2004), Koder and Helmes (2006, 2008a, 2008b), Netz et al. (2001), and Unsworth et al. (2001) in Australian, British, and Swedish samples, although the precise contents of the scales differed for some factors. In particular, six items were identified in this study as loading on the “Perceived Personal Attributes” factor, whereas Gething et al. (2004) and Netz et al. (2004) only found three items, while Unsworth et al. (2001) found four items. Moreover, two of the six items that loaded onto the “Perceived Personal Attributes” factor in the current study (I find the thought of growing older is depressing and I won’t like growing old) loaded onto the “Negative Thoughts About Growing Older” by Gething et al. (2004) and Netz et al. (2004). Items loading on the “Positive Aspects of Ageing” factor were generally consistent with the findings from Gething et al. (2004), Netz et al. (2001), and Unsworth et al. (2001). The content of the “Negative Thoughts About Growing Older” factor was also similar to that reported by Gething et al. (2004), although it contained items that made up two different scales (Negative Thoughts About Growing Older and Fear of Becoming Frail) in data from Netz et al. (2001). In addition, of the nine original RAQ items that were removed in the current study, four of these (Items 6, 15, 16, and 22) were also removed due to their low factor loadings in validations with Australian, Swedish, and British participants (Gething et al., 2004), while a further five of the items were shown to load poorly onto factors in at least one other Western population (Gething et al., 2004; Unsworth et al., 2001). Taken together, these findings suggest that at least some of the original items of the RAQ show consistency across Eastern and Western populations, and that could be investigated as a potential “core set” of RAQ items that are applicable worldwide.
A new dimension of “Family and Religion” was identified in this culturally adapted scale. This factor reflects the concept of a strong family relationship that is traditionally embraced by Eastern cultural groups (Lockenhoff et al., 2015). Filial piety, for example, has become a basic principle of the family system in Malaysia (Ismail, Tan, & Ibrahim, 2009), where adults are expected to be attentive to, respectful toward, and supportive of, their parents (Kim et al., 2015). People in Malaysia also still emphasize the importance of family relationships (Minhat et al., 2015a; Teh et al., 2014). Consistent with this, Kooshiar et al. (2012) reported that about 70% of older Malaysians live with their adult children, providing companionship for the older people, and enabling interaction and contact across generations. Additionally, this factor reflects the significant role that religion plays in the Malaysian population (Abu Bakar, 2013), which is believed to facilitate adjustment to the ageing process (Jianbin & Mehta, 2003). The link between religious practice and family is also supported by the close relationships between them that often occur in day-to-day life. For instance, individuals often pray for a happy and healthy family, and for the well-being of their descendants (Tohit, Browning, & Radermacher, 2012). Elders in the family also play a central role in transmitting religious beliefs to their offspring, such as informing their children about religious rituals and traditions (Mehta, 1997).
Another contribution of the present study was the examination of the relationships between RAQ scores and demographic variables. The results are broadly in line with previous findings into the relationship between age and RAQ scores in Western populations (Draper et al., 1999; Golden et al., 2013; Unsworth et al., 2001), which indicate that attitudes to ageing are more positive among older people. In the current study, these effects of age were only seen in two of the four RAQ subscales (Negative Thoughts About Growing Older; Positive Aspects of Ageing), with attitudes toward “Perceived Personal Attributes” and the “Family and Religion” aspects of ageing being more consistent across age groups. This is consistent with previous findings suggesting that the effects of age may be limited to certain aspects of attitudes to ageing (Unsworth et al., 2001), and that younger people in Malaysia express concerns about being old that manifest as declining physical ability, health, and changes in physical appearances, as well as being more sensitive (Minhat, Hamizah, & Nor Afiah, 2015b). The lack of age effect in the Family and Religion factor may be due to the traditional cultural beliefs around filial piety (Damulak et al., 2015) and religion in Malaysia that are emphasized and transmitted in childhood, and reinforced in adulthood (Mehta, 1997), making the positive roles of family and religion similarly salient to people of different age groups.
Consistent with previous studies that have explored the RAQ (e.g., Draper et al., 1999; Golden et al., 2013), attitudes to ageing were also linked to gender in the present study, with men, overall, reporting more positive attitudes compared with women. However, in the current study, gender effects were only seen in the “Negative Thoughts About Growing Older” subscale, which focuses on age-related changes in cognitive and physical functioning, such as health status, frailty, safety, mortality, and independence. This is consistent with work reporting that men have fewer anxieties about declining cognitive and physical abilities than women (Barrett & Von Rohr, 2008). Similarly, women may find it more challenging to overcome the negative attitudes held about their ageing due to the increased emphasis that is placed on beauty and youth for women: a so-called “double standard of ageing” (Halliwell & Dittmar, 2003). Women may also have greater exposure to negative aspects of ageing due to their increased levels of experience in dealing with disabled older parents (Hequembourg & Brallier, 2005). Indeed, in Malaysia, women are traditionally more involved in caring for elderly parents (Alavi & Sail, 2010), and are highly concerned about their physical changes (Minhat et al., 2015a, 2015b). This may help explain why Malaysian women may feel more anxious about their personal ageing, and have more negative expectancies about their personal ageing process, compared with men. The finding that gender effects were limited to just one of the four RAQ subscales also highlights the importance of measuring attitudes at this more focused level of description. Education levels did not influence RAQ scores, which chimes with a broader picture of a lack of association between education and RAQ scores in other populations (Gething, 1994; Gething et al., 2002; Gething et al., 2004).
Although the present research takes the literature on attitudes to ageing forward in important respects, some limitations need to be acknowledged. First, the new items generated and added to the scale were based on responses from a relatively small number of participants, who were currently living in the United Kingdom, and so may not fully reflect attitudes to ageing held by people in Malaysia. However, these participants were purposefully sampled to be demographically diverse, ensuring at least some variety in the views expressed. Other limitations relate to the sample used to validate the Malay RAQ. For one thing, while asking managers of the organizations to distribute the surveys will likely have increased the response rate (Krishnan & Poulose, 2016), it may also have introduced some sampling or response biases, for instance due to managers purposefully targeting or avoiding certain employees. Furthermore, although the sample was large, it consisted almost exclusively of government employees, who were predominantly ethnically Malay. Although this homogeneity made it easier to determine the effects of age, gender, and education, it also limits the generalizability of our findings to other ethnicities, or to unemployed or self-employed individuals. In particular, as government employees in Malaysia have to achieve a minimum level of education of high school in order to take on these positions (Malaysia Public Service Department, 2017), participants with very low levels of formal education were not included, and so the full effect of education levels could not be examined. Our use of a categorical measure of education, rather than a continuous one, such as years of education, will also have reduced the sensitivity of our analyses involving educational level. The cross sectional nature of the data also means that it is not possible to establish the extent to which differences between age groups truly represent the effects of age, rather than generational differences. This is particularly important given that longitudinal studies assessing participants’ reflections on their experiences of ageing show a trend toward more negative attitudes to ageing with increasing age (Miche, Elsasser, Schilling, & Wahl, 2014), suggesting that similar effects could be present when assessing participants’ attitudes to their future ageing. Finally, the present study only investigated some of the factors that may be related to attitudes to ageing. Future studies that examine whether such responses are also dependent on other factors, such as personality or health, would now be beneficial in order to gain a more complete understanding of the factors that relate to attitudes to ageing in those aged younger than 60 years.
Conclusion
The present study identified an additional element of attitudes to ageing not currently captured in Western measures, namely, “Family and Religion”, and demonstrated that the culturally adapted Malay RAQ had good levels of reliability and validity among Malay adults aged younger than 60 years. In addition, the present study provides evidence that, as seen in other cultures, attitudes to ageing are influenced by age and gender, but that levels of education seem to be unrelated to attitudes to ageing in adults aged younger than 60 years. Perhaps more important, we identified a “core set” of RAQ items that seem to work across cultural settings and would be amenable to testing worldwide.
Supplemental Material
Supplemental_Materials_(1) – Supplemental material for Cultural Adaptations to the Measurement of Attitudes to Ageing: Psychometric Assessment of the Malay Reactions to Ageing Questionnaire
Supplemental material, Supplemental_Materials_(1) for Cultural Adaptations to the Measurement of Attitudes to Ageing: Psychometric Assessment of the Malay Reactions to Ageing Questionnaire by Farah Nadia M. Faudzi, Christopher J. Armitage, Christina Bryant, and Laura J. E. Brown in Assessment
Footnotes
Acknowledgements
We thank the study participants and the managers of the participating organizations for their contribution to this study.
Author’s Note
Farah Nadia M. Faudzi is currently affiliated with School of Applied Psychology, Social Work and Policy, Collefe of Arts and Sciences, Northern University of Malaysia, Malaysia.
Declaration of Conflicting Interests
The author(s) declared no potential conflicts of interest with respect to the research, authorship, and/or publication of this article.
Funding
The author(s) disclosed receipt of the following financial support for the research, authorship, and/or publication of this article: The research was supported by the NIHR Manchester Biomedical Research Centre and the NIHR Greater Manchester Patient Safety Translational Research Centre, and a PhD studentship from the Malaysian Ministry of Education awarded to FNMF.
References
Supplementary Material
Please find the following supplemental material available below.
For Open Access articles published under a Creative Commons License, all supplemental material carries the same license as the article it is associated with.
For non-Open Access articles published, all supplemental material carries a non-exclusive license, and permission requests for re-use of supplemental material or any part of supplemental material shall be sent directly to the copyright owner as specified in the copyright notice associated with the article.