
Abstract
Planned missing data (PMD) designs are an elegant way to incorporate expensive gold standard methods (e.g., biomarker) and cheaper but systematically biased methods (e.g., questionnaires) in research designs while ensuring high statistical power and low research costs. This article outlines a PMD design with one expensive gold standard and two cheap but biased methods (three-method measurement [3-MM] design). The cost effectiveness of different 3-MM-PMD designs is investigated and compared with the cost effectiveness of corresponding same-price two-method measurement designs using a simulation study. The results underline that PMD designs yield higher statistical power compared with complete data designs in a wide variety of conditions. Adding a second cheap method to the measurement model (i.e., using a 3-MM-PMD design) can increase the statistical power of the research design even further while keeping costs constant, when the additional measure is inexpensive, shares only small amounts of bias variance with the initial cheap measure, and when the gold standard measure is highly expensive compared with the cheap measures. Recommendations as well as a computer program for finding the optimal research design are provided.
Keywords
In recent years, many modern measurement methods, such as biomarker analysis, brain imaging, or ambulatory assessment, have been developed for a wide variety of psychological research domains. These methods are usually accepted as highly valid gold standard measures. Unfortunately, these modern methods typically have one significant drawback: They are generally very costly in terms of time, needed expertise, incentivizing participants, price of administration (Graham, 2012), and sometimes invasiveness. Thus, many studies still rely on fairly cheap and easily administered methods (e.g., self-report questionnaires). The problem with these cheap measurement methods, however, is that they generally lack construct validity and lead to biased estimations (Graham, 2012). When researchers are faced with a fixed research budget and the choice between a cheap but biased and an expensive gold standard measure, they traditionally have three options: (a) they assess a few participants using the expensive gold standard only, which can lead to power issues and large standard errors (SEs) due to a small sample size; or (b) they assess many participants using the cheaper method only, which can lead to biased estimates of the studied construct; or (c) they assess participants using the cheap and the expensive method in order to be able to study the relationship between two structurally different methods, which leads to an even greater reduction of sample size.
Two-Method Measurement Design
With the two-method measurement (2-MM) design introduced by Graham, Taylor, Olchowski, and Cumsille (2006) another approach utilizing the concept of planned missing data (PMD) has been proposed. In the 2-MM-PMD design, only a randomly chosen fraction of the participants is assessed using the cheap and the expensive method, whereas the rest of the participants are asked to provide data only on the cheap method. The major advantage of this design is that it can yield more statistical power than only using the expensive measure and to higher construct and criterion-related validity than using the cheap measure alone while having the exact same research costs (Graham et al., 2006). The basic rationale of the 2-MM-PMD design is that the subsample with data on all measures can be used to (a) validly define the studied construct and to (b) control for the systematic bias of the cheap method. Conversely, the participants with data only on the cheap measures help increase the statistical power (through increasing the total sample size) while simultaneously keeping the costs low (Garnier-Villarreal, Rhemtulla, & Little, 2014). Through the random assignment of participants, a predetermined pattern of missing data is created that meets the missing completely at random assumption (Garnier-Villarreal et al., 2014; Graham et al., 2006). This missing completely at random pattern allows unbiased parameter estimation using widely available procedures for handling missing data such as multiple imputation and full information maximum likelihood (Little, Jorgensen, Lang, & Moore, 2014).
Graham et al. (2006) illustrated the 2-MM-PMD model using the measurement of smoking behavior, where smoking behavior is measured using two scales of a self-report questionnaire as the cheap method and two biochemical indicators (carbon monoxide from a breath sample [CO] and cotinine from a saliva sample [Cotinine]) as the expensive gold standard measure. Latent variable structural equation modeling is used to mathematically define this measurement model. The resulting model can be classified as a variant of the correlated-trait-correlated-method-minus-1 [CT-C(M−1)] model introduced by Eid (2000) and Eid, Lischetzke, Nussbeck, and Trierweiler (2003), where the expensive method (i.e., biochemical indicators of smoking) is used as the reference method defining the latent construct (i.e., smoking behavior). To model the systematic bias of the cheap method (i.e., self-report), a latent bias or method factor on which the indicators of the cheap measures load is used (Graham et al., 2006). Such research designs have been widely used without the aspect of planned missingness in multitrait–multimethod research and can be considered a type of bias-correction model (Graham et al., 2006). The bias-correction property, however, only applies to the latent variable measuring the construct and not to the individual scores. Therefore, only group-level relationships can be studied with the 2-MM-PMD design (Rhemtulla & Little, 2012). Even though it is usually used in cross-sectional research, the 2-MM-PMD design can also be adapted for longitudinal research (see Garnier-Villarreal et al., 2014).
By varying the hypothetical prices for the cheap and the expensive measures as well as the underlying population model, Graham et al. (2006) studied the statistical properties of the 2-MM-PMD design in different conditions using a simulation study. To evaluate the 2-MM-PMD design they compared the statistical power of the 2-MM-PMD design with the power of the 2-MM design with complete data (CD), where all participants were assessed using both—the cheap and the expensive—measures. As their outcome measure, they used the SE of the latent regression coefficient between the Smoking factor and an outside criterion (i.e., general health). Thus, they specified a regression, in which the latent variable Smoking was used to predict the latent outcome variable Health, which was measured using four indicators. The full model using the 2-MM-PMD design for the measurement of smoking behavior is depicted in Figure 1. The results of Graham et al. (2006) reveal that in all tested conditions a PMD design could be found that yielded higher power (i.e., smaller SEs for the regression weight) than the corresponding CD design while having the exact same costs. The authors further showed that 2-MM-PMD designs are especially beneficial when the cheap method is highly valid, the cost differential between the expensive and the cheap methods is high and the latent regression coefficient is small (Graham et al., 2006).
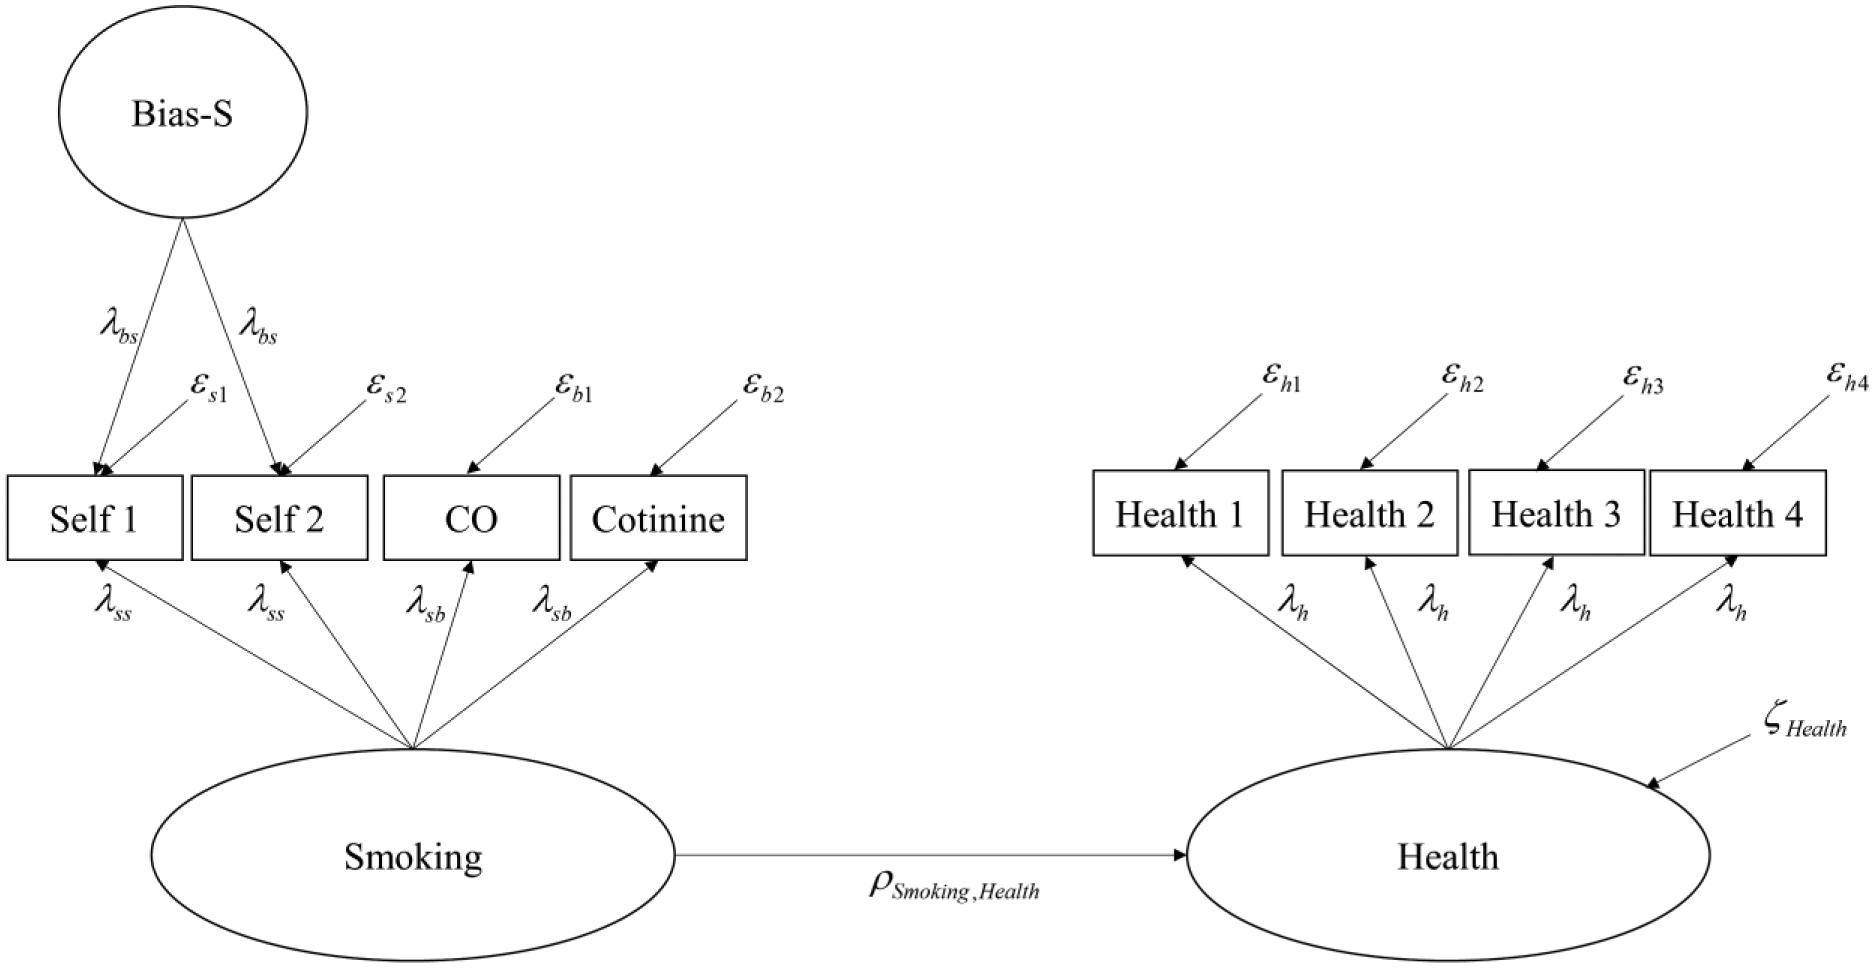
Two-method measurement design for the effect of smoking behavior on general health.
Limitations of the 2-MM Design
The article by Graham et al. (2006) laid important groundwork in investigating the properties of research designs incorporating planned missingness on the measurement methods used. Some issues, however, are not fully addressed in their work. First, Graham et al. (2006) used one expensive and one cheap method in their model. In some research contexts, it might, however, be of interest and beneficial to study the relationships between multiple assessment methods. For example, in a clinical study on autistic spectrum disorder (ASD), one could investigate to what extent the self-reported symptoms differ from symptoms described by parents or teachers (i.e., self-rating and informant rating as two cheap methods) and how these measures relate to an extensive test battery of ASD (for review on ASD assessments, see Falkmer, Anderson, Falkmer, & Horlin, 2013). Since gold standard measures of ASD are very costly, it might be interesting to see whether incorporating more than one cheap method might reduce the number of patients who have to be assessed with the expensive method even more. Hence, a PMD framework with a measurement model incorporating more than two methods is needed in order to be able to cost-efficiently investigate the relationship between the different ASD measures. Second, Graham et al. (2006) only investigated conditions in which the latent correlation of the cheap method (i.e., self-report) and the expensive method (i.e., biochemical markers) was fairly high. In reality, however, it is often not possible to find cheap measures with such high levels of convergent validity with the gold standard. Thus, it is important to investigate, whether PMD designs keep their beneficial properties when cheap methods are used that are not highly valid.
This article addresses these issues by introducing an extension of the 2-MM-PMD design, where a second cheap and systematically biased method is used in the measurement model. Adding another cheap method helps understand the interactions of the studied construct with the methods used as well as the relationships among the methods.
Three-Method Measurement Model
In research domains where an expensive gold standard method as well as at least two fairly valid, but systematically biased cheap methods (e.g., self-report and informant report) are available, it is possible to use a 3-MM-PMD design. The 3-MM-PMD design corresponds to a CT-C(M−1) measurement model for one trait considered (Eid et al., 2003; Eid, Geiser, & Koch, 2016). For each cheap method, at least two indicators, such as items or scales, must be obtained. Analogous to the 2-MM-PMD design, the expensive gold standard method is used as the reference method to define the construct and should thus be a highly valid measure of the construct. For each of the two cheap measures a latent bias factor is specified. These bias factors are by definition uncorrelated with the measured construct and can be interpreted as systematic deviations of the respective cheap method from the expensive method (Eid et al., 2003; Eid et al., 2016; Geiser, Eid, & Nussbeck, 2008). An individual score on the bias factor greater than zero illustrates that the score on the respective cheap method is higher than what would have been expected by the expensive method, negative factor scores indicate the opposite. The two bias factors can be correlated indicating shared systematic bias or method variance of the two cheap methods (Eid et al., 2003; Eid et al., 2016).
There are numerous potential applications of the 3-MM-PMD design in psychological research. Stress, for example, can be measured using self- and informant reports (e.g., parent and child versions of the Responses to Stress Questionnaire; Connor-Smith, Compas, Wadsworth, Thomsen, & Saltzman, 2000), which could be used as cheap but biased methods. As a valid (but expensive) biomarker of long-term stress, cortisol in human hair can be used (e.g., Groeneveld et al., 2013; Russell, Koren, Rieder, & Van Uum, 2012). Another potential application for the 3-MM-PMD design is the measurement of physical activity. In this field, the very expensive Doubly Labelled Water method is the gold standard for measuring energy expenditure in humans (Buchowski, 2014). There are, however, numerous cheaper but flawed self-report questionnaires available to assess physical activity (Sylvia, Bernstein, Hubbard, Keating, & Anderson, 2014). Such self-report measures can easily be adapted to be used as peer report measures (e.g., Chaumeton, Duncan, Duncan, & Strycker, 2011). In addition, 3-MM-PMD designs can be applied in the context of clinical studies. In depression research, many short and inexpensive screening instruments are available. For some of these instruments, corresponding informant versions have been developed (e.g., Geriatric Depression Scale; Brown & Schinka, 2005). A more valid (but also more expensive) structured clinical interview (e.g., SCID-5; First, Williams, Karg, & Spitzer, 2015) could be administered as a gold standard method to a smaller, randomly drawn subsample.
Referring to the example discussed by Graham et al. (2006), the 3-MM-PMD design will in this article be illustrated using the measurement of smoking behavior. In smoking research, several self- and peer report measures as well as highly valid biochemical indicators are available (e.g., Heath et al., 2003; Palmer, Dwyer, & Semmer, 1994; Stacy, Widaman, Hays, & DiMatteo, 1985). Two biochemical indicators (carbon monoxide from a breath sample [CO] and cotinine from a saliva sample [Cotinine]) can be used as a gold standard method to measure the Smoking factor. As cheap methods, two scales of a self-report smoking survey as well as two scales of a peer-report smoking survey can be used. Using the PMD approach, the biochemical measures are only administered to a random subsample of participants, whereas both of the cheap measures (i.e., self- and peer report) are administered to all participants. In the present simulation study, the latent Smoking variable was, analogously to Graham et al. (2006), used in a latent regression analysis to predict the outcome variable Health, which was measured by four manifest variables. The full model using the 3-MM-PMD design for the measurement of smoking behavior is depicted in Figure 2.

Three-method measurement design for the effect of smoking behavior on general health.
Aim of the Current Study
The aim of the current study is to investigate the statistical properties of 2-MM-PMD and 3-MM-PMD designs in a variety of different conditions and to examine in which conditions it is advisable to integrate a second cheap method in the assessment process.
Method
A simulation study was conducted to assess and compare the cost-effectiveness of the 2-MM-PMD and 3-MM-PMD designs. For comparison reasons, some simulation conditions correspond to those examined by Graham et al. (2006). In addition to Graham et al.’s (2006) study, we also investigated conditions in which the latent correlation of the cheap measure(s) with the expensive measure is only moderately high to examine whether the PMD approach can also be beneficial in cases where no highly valid cheap methods are available.
Population Models
Structurally, the investigated population models correspond to the models depicted in Figures 1 and 2. All variables—manifest and latent—were standardized in all population models. Table 1 depicts the population parameters used in the different conditions of the simulation. Factor loadings and residual variances for all indicators within each measure were assumed to be equal. In all population models the factor loadings λ h and λ sb were set to 0.7, which leads to an error variance of the indicators of the expensive method and the outcome measure of σεj = 0.51. The reliability of the indicators of the cheap methods was fixed to approximately 0.50 for all simulation cells, which lead to an error variance of approximately σεj = 0.5. For the 3-MM designs, three population models, differing in the construct validity of the cheap measures, were investigated: (a) either both cheap measures were valid measures of the construct (Valid) or (b) one cheap measure was valid and the other one rather biased (Mixed) or (c) both cheap measures were rather biased (Biased). The reliable variance of valid cheap measures was operationalized to be composed of 50% construct-relevant variance and 50% systematic bias. This condition resulted in the following factor loadings: λ sp = 0.5 and λ bp = 0.5; λ ss = 0.5 and λ bs = 0.5. The resulting manifest correlation between an indicator of a biased cheap method and an indicator of the gold standard is 0.35, the corresponding correlation at the latent level is 0.707, which resembles conditions also studied by Graham et al. (2006). The reliable variance of biased cheap methods was set to be composed of 25% construct-relevant variance and 75% systematic bias resulting in the following factor loadings: λ sp = 0.35 and λ bp = 0.61; λ ss = 0.35 and λ bs = 0.61. The resulting manifest correlation between an indicator of a biased cheap method and an expensive indicator is 0.245, the corresponding correlation at the latent level is 0.495. Thus, the effect of smaller convergent validity between the cheap and the expensive measure can be studied. Accounting for the fact that the two cheap measures can have common or unique systematic bias, two conditions for the latent correlations of the two bias factors (ρ Bias-P, Bias-S = 0.10 and 0.50) were examined. Also, two different values for the latent correlation of the Smoking factor and the Health variable (ρ Smoking, Health = −0.10 and −0.40) were investigated. Since all variables were standardized, this correlation is equal to the regression weight between the Smoking factor and the criterion variable Health. This resulted in 3 (valid, mixed, biased cheap indicators) × 2 (unique, common bias) × 2 (size of regression weight) = 12 population models for the 3-MM designs.
Population Parameters for the Investigated Conditions.

Note. The model names are composed of type of design (three-method measurement design [3M] vs. two-method measurement design [2M]), factor loadings of cheap measures (both cheap measures have high loadings on the Smoking factor [Valid] vs. only one of the cheap measures has high loadings on the Smoking factor [Mixed] vs. both cheap measures have small loadings on the Smoking factor [Biased]), correlation of bias factors (substantial correlation of Bias-P and Bias-S [Common] vs. small correlation of Bias-P and Bias-S [Unique]). The index references the absolute value of the population regression weight. λ sp , λ ss , λ bp , λ bs , λ sb , λ h , ρ Smoking, Health , and ρ Bias-P, Bias-S correspond to the parameters of the models depicted in Figures 1 and 2 for fully standardized manifest and latent variables.
For comparison, four 2-MM models with corresponding factor loadings and effect sizes were defined and analyzed (see Table 1).
Cost-Ratios and Missing Data
The assumed prices for the self-report and the biochemical markers were constructed based on the values used by Graham et al. (2006). The costs for the administration of the self-report was fixed to $7.30. The prices for the biochemical markers were varied, with costs of $16.78 (Condition A), $30 (Condition B), or $73 (Condition C). Thus, three cost-ratios labeled with A, B, C were used to study the 2-MM designs. For the 3-MM designs, the cost of the additional cheap measure, the peer report, was altered between costing just as much as the self-report (Condition 1: $7.30), half as much as the self-report (Condition 2: $3.65), being very cheap (Condition 3: $1.70), or being free (Condition 4: $0). This resulted in 3 (price of biochemical markers) × 4 (price of peer report) = 12 cost-ratios labeled A1 through A4, B1 through B4 and C1 through C4 for the 3-MM designs. In line with Graham et al. (2006), the available research budget was set to $15050. The possible sample size constellations for the different cost-ratios are depicted in Table 2. For cost-ratio “A,” for example, 625 people can be assessed in a complete data (CD) design, where all participants are assessed using the cheap and the expensive method (i.e., 2-MM-CD design) and for cost-ratio “A1,” 479 people can be assessed using the two cheap methods and the expensive method (i.e., 3-MM-CD design). For the planned missing data (PMD) designs, the sample size for the cheap measures was increased by increments of N = 100, the sample size for the expensive biochemical measure was subsequently reduced according to the cost-ratio to keep the research costs constant. For cost-ratio “A,” for example, with each increase of 100 self-reports, 43 fewer biochemical measures can be assessed in the 2-MM-PMD design. For the 3-MM-PMD, each increase of 100 self- and peer reports results in a drop of 87 biochemical measures in cost-ratio “A1.” However, when the peer report gets cheaper, this drop in sample size for the biochemical measures decreases. For cost-ratio “A3,” for example, with each increase of 100 self- and peer reports, only 54 biochemical measures have to be dropped to stay in the research budget.
Configurations of Sample Sizes in the Different Cost-Ratios for a Research Budget of Approximately $15,050.
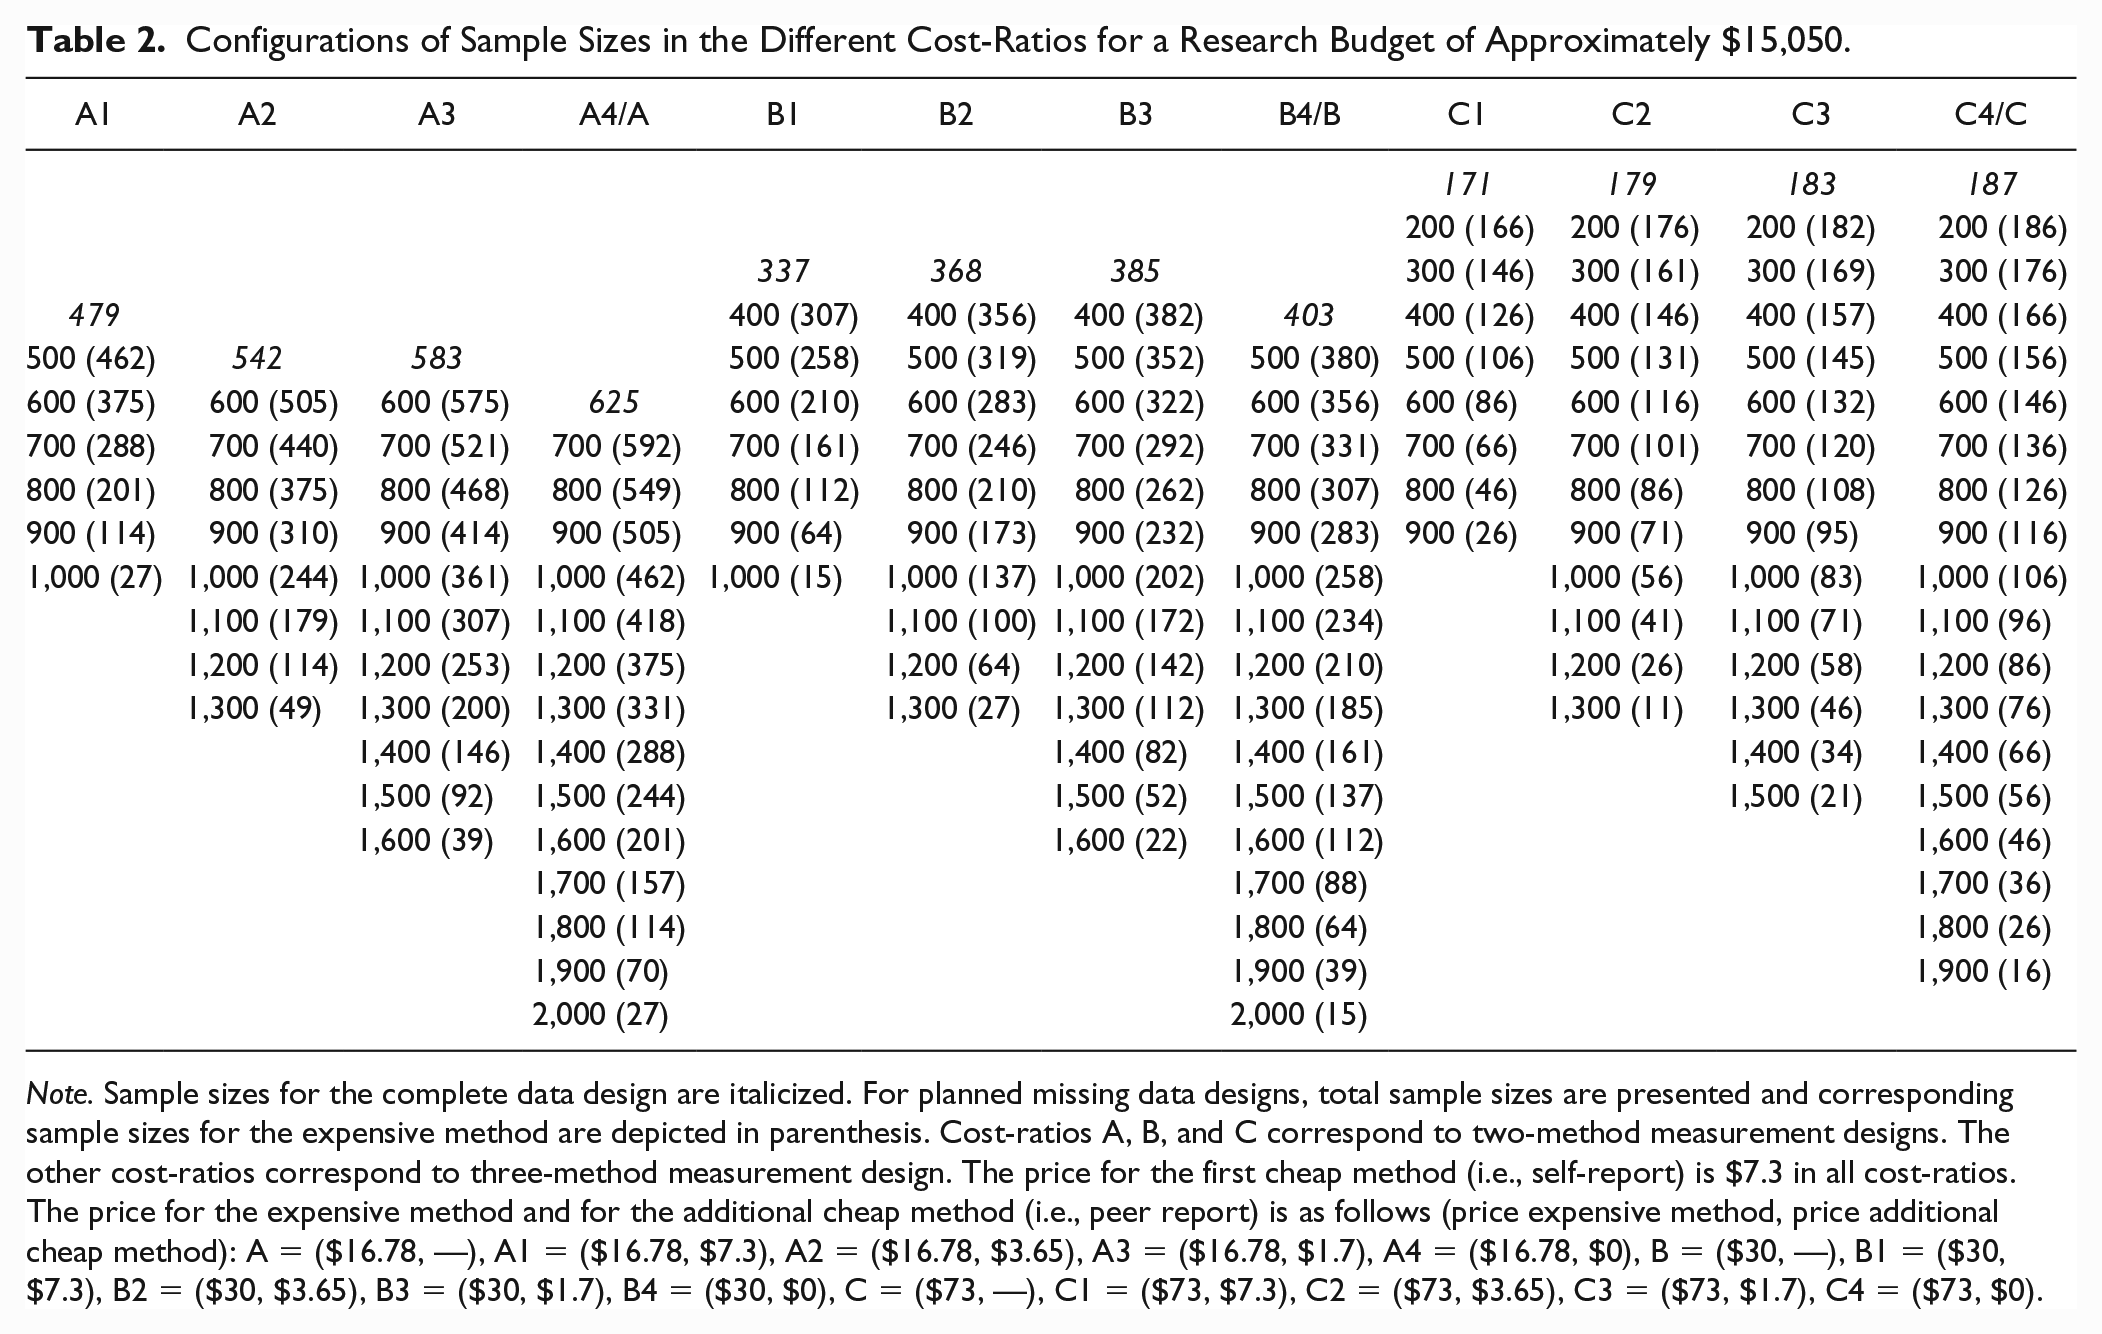
Note. Sample sizes for the complete data design are italicized. For planned missing data designs, total sample sizes are presented and corresponding sample sizes for the expensive method are depicted in parenthesis. Cost-ratios A, B, and C correspond to two-method measurement designs. The other cost-ratios correspond to three-method measurement design. The price for the first cheap method (i.e., self-report) is $7.3 in all cost-ratios. The price for the expensive method and for the additional cheap method (i.e., peer report) is as follows (price expensive method, price additional cheap method): A = ($16.78, —), A1 = ($16.78, $7.3), A2 = ($16.78, $3.65), A3 = ($16.78, $1.7), A4 = ($16.78, $0), B = ($30, —), B1 = ($30, $7.3), B2 = ($30, $3.65), B3 = ($30, $1.7), B4 = ($30, $0), C = ($73, —), C1 = ($73, $7.3), C2 = ($73, $3.65), C3 = ($73, $1.7), C4 = ($73, $0).
Through the combination of the 12 population models and the 12 different cost-ratios, 144 simulation cells for the 3-MM designs were defined and analyzed. On top of that, 3 (cost-ratio) × 4 (population models) = 12 2-MM designs were investigated.
Analysis Models
The simulation was carried out in R (version 3.4.1; R Core Team, 2017). For each simulation cell 1,000 data sets with the different sample size constallations depicted in Table 2 were created using the simsem package (version 0.5-13; Pornprasertmanit, Miller, & Schoemann, 2016). Each of these data sets were analyzed in lavaan (version 0.5-23.1097; Rosseel, 2012) using the implemented full information maximum likelihood algorithm. In order to compare the results with those from Graham et al. (2006), the Health variable was not standardized in the analysis model but rather defined by setting the factor loading of the first health item to 1 and freely estimating the variance of the Health variable. The full code for the simulation is provided as supplemental material (all supplemental materials are available in the online version of the article).
Outcomes
Rates of Convergence and Improper Solutions
First, the rates of convergence and proper solutions were examined. Nonconverged replications are those where the lavaan algorithm failed to find model estimates. Improper solutions are replications that resulted in implausible parameter estimates (e.g., negative residual variances). Those cases were removed before the subsequent analyses.
Standard Error Bias
To assess whether the estimated SEs of the regression weight between the Smoking factor and the outcome variable Health are accurate, the standard error bias (seb) was computed using the following formula (adapted from Bandalos & Leite, 2013):
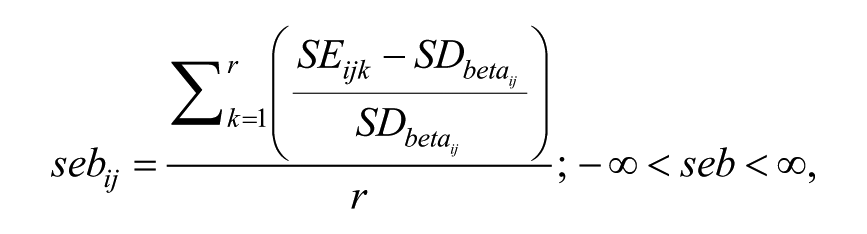
where
Power
The SE of the regression coefficient between the Smoking factor and the Health variable is inversely related to the statistical power for testing the regression coefficient. To get an estimate of this SE for each simulation cell, the SEs from all proper replications were averaged within each condition. The averaged SE quantifies the statistical power of the research design in the given condition. In each simulation cell, the sample size constellation returning the smallest averaged SE reveals the research design with the greatest power to test the regression coefficient. To compare the power of the different conditions, we plotted the averaged SEs in relation to the total sample size for all simulation cells. In order to get a numerical indicator about the potential statistical benefit (in terms of power) of the 2-MM-PMD and 3-MM-PMD designs in relation to the corresponding same-cost CD designs, we computed the relative design efficiency parameter RDEMiss, where
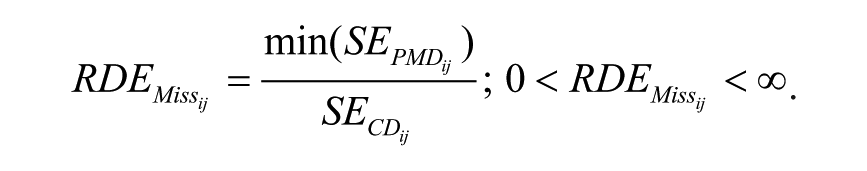
For each population model i and cost-ratio j, the proportion of missing data yielding the smallest average SE was determined for the PMD designs. This SE,
To address the question whether a 2-MM or a 3-MM design is superior (in terms of power) in the different conditions, the parameter RDE3-MM was computed, where
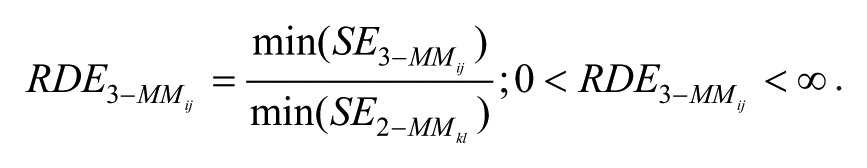
For each 3-MM population model i and cost-ratio j, the averaged SE of the sample size constellation yielding the greatest statistical power,
Results
Rates of Convergence and Improper Solutions
Convergence rates and the number of improper solutions were highly dependent on the sample size of complete-cases. Among the CD designs, overall 99.9% of the replications converged and 0.1% of replications lead to improper solutions. Of the 2-MM-PMD designs, 99.8% converged and 5.0% lead to improper results. Of the 3-MM-PMD designs, 98.9% converged and 5.5% lead to improper results. The replications of the models with those sample size constellations yielding the greatest power converged in 99.7% of the cases (range: 95.7% to 100%) and yielded proper solutions in 97.7% of the cases (range: 76% to 100%). Detailed convergence rates for all models are presented in the supplemental materials.
Standard Error Bias
For the CD designs, the seb values ranged from −0.084 to 0.021 (M = −0.031, SD = 0.019). For the 2-MM-PMD, designs the seb ranged from −0.480 to 0.04 (M = −0.077, SD = 0.103) and for the 3-MM-PMD designs, from −0.555 to 0.058 (M = −0.066, SD = 0.089). Figure 3 illustrates that the seb drastically decreases when the sample size of complete-cases gets small. Sample sizes of 125 or more for the complete-cases were sufficient to retain acceptable seb values within the described range, except for one case, where the complete-cases sample size was 137 (i.e., 2M-Biased(.1) in cost-ratio B1). The seb for the conditions with those sample size constellations yielding the greatest power in the different simulation cells ranged from −0.264 to 0.058 (M = −0.040, SD = 0.047). In 13 of those conditions, the seb was smaller than the critical threshold of −0.1. In all of these conditions, the sample size of complete-cases was smaller than 87.
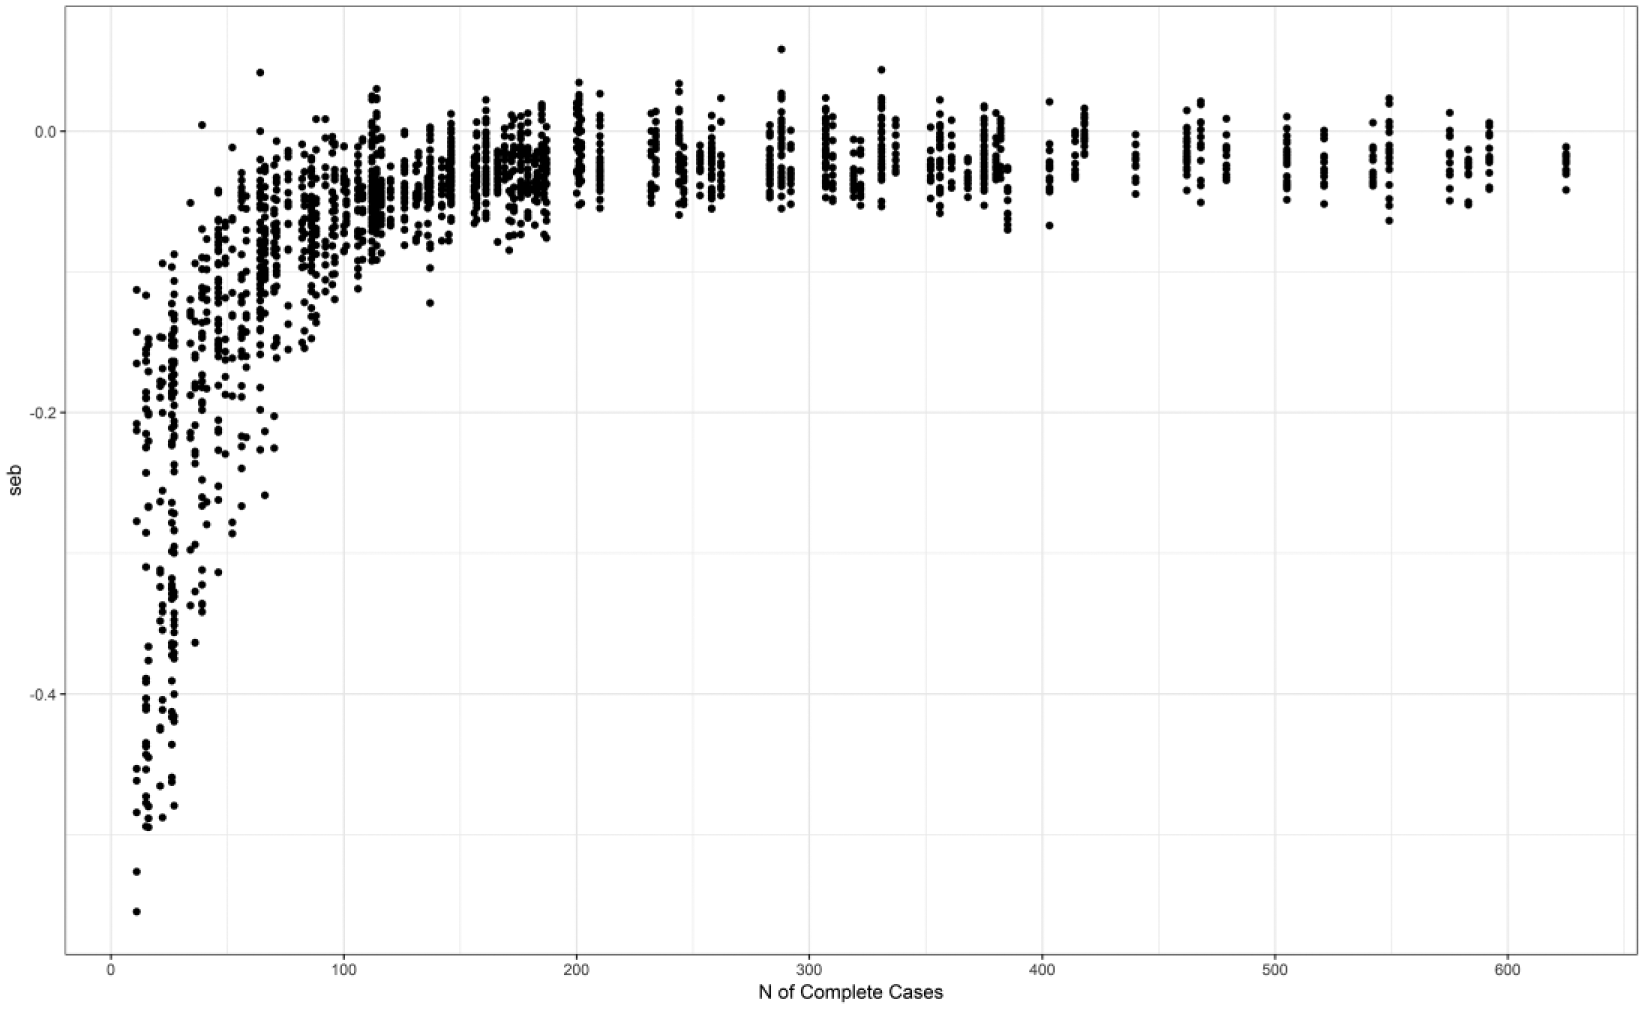
Seb values for all simulated conditions in relation to the complete-cases sample size.
Design Efficiency of PMD Designs
Figures 4 to 9 present the SEs of the regression coefficient of the Smoking factor predicting the Health factor averaged across all proper replication for the different simulation cells. For those models with high factor loadings of the self-report scales (i.e., λ ss = 0.5) the averaged SEs decrease at first with an increasing total sample size (or stated differently with a decreasing sample size of complete-cases). After reaching a minimum, the SEs then increase again once the sample size of complete-cases becomes rather small. Conversely, in some of the conditions with low-factor loadings of the self-report scales (i.e., λ ss = 0.35) the averaged SEs do not decrease initially with increasing total sample sizes. Table 3 illustrates the RDEMiss values for all conditions. With increasing costs of the biochemical indicators RDEMiss decreases. Furthermore, RDEMiss of 3-MM-PMD designs decreases when the cost of the peer report decreases and latent correlation of the two bias factors is small (i.e., unique method variance).
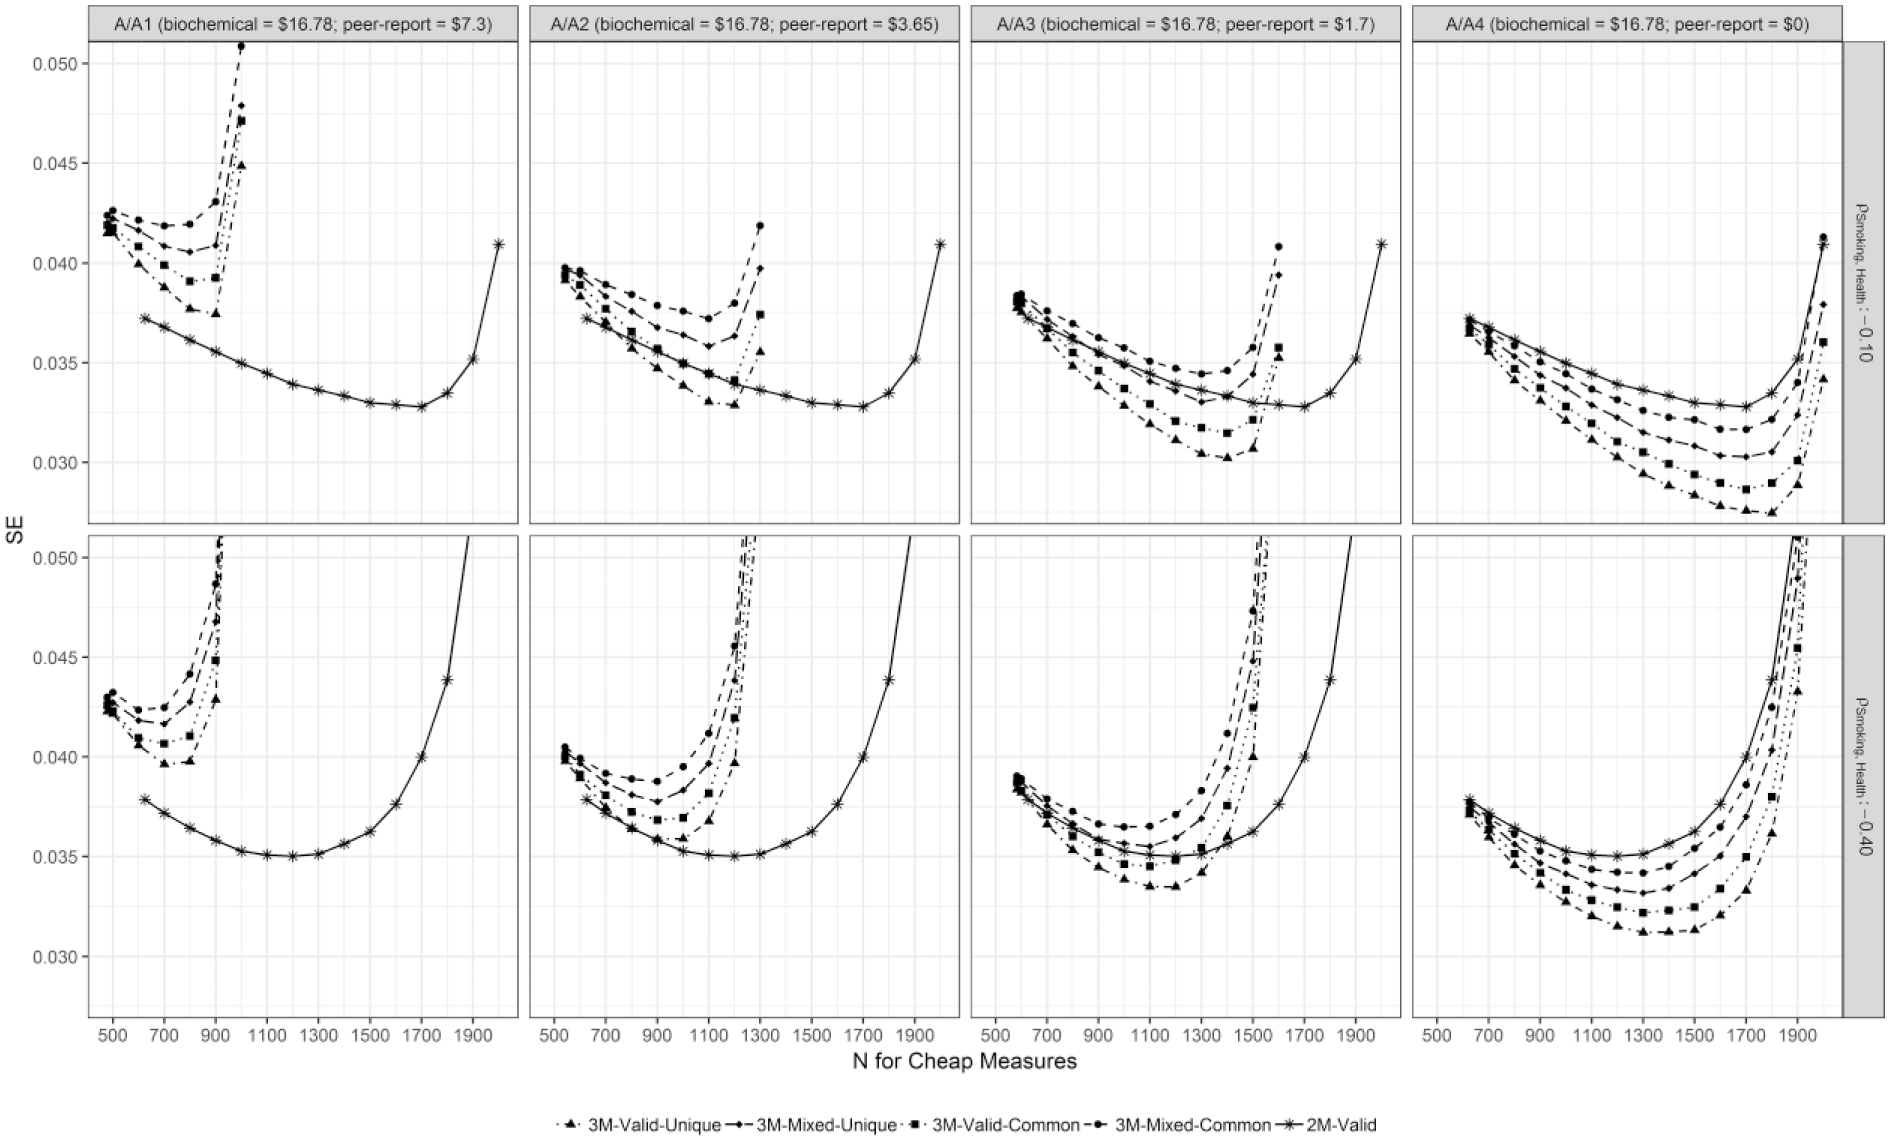
SEs for the regression weight of the Smoking factor predicting Health for all conditions with a highly valid initial cheap method (i.e., self-report) for cost-ratios A, A1, A2, A3, and A4.
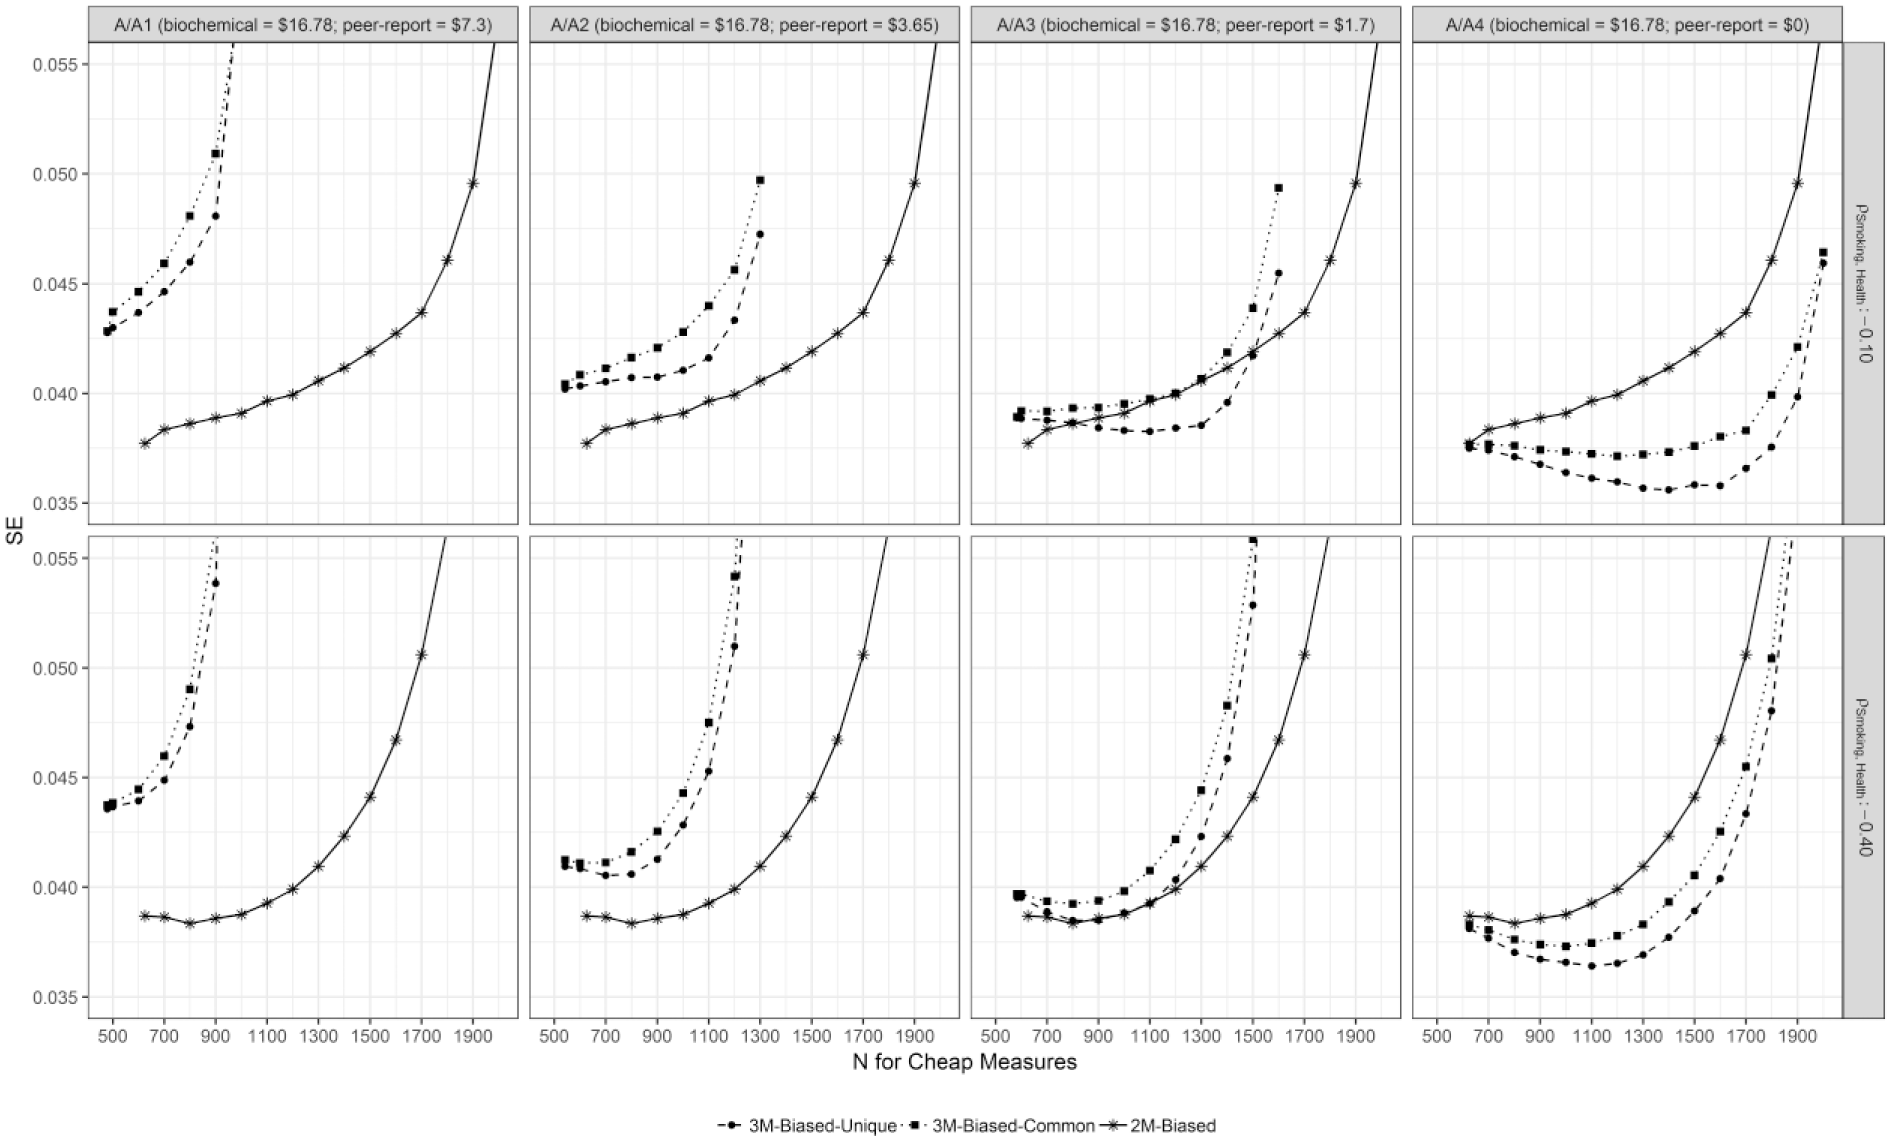
SEs for the regression weight of the Smoking factor predicting Health for all conditions with an only moderately valid initial cheap method (i.e., self-report) for cost-ratios A, A1, A2, A3, and A4.

SEs for the regression weight of the Smoking factor predicting Health for all conditions with a highly valid initial cheap method (i.e., self-report) for cost-ratios B, B1, B2, B3, and B4.
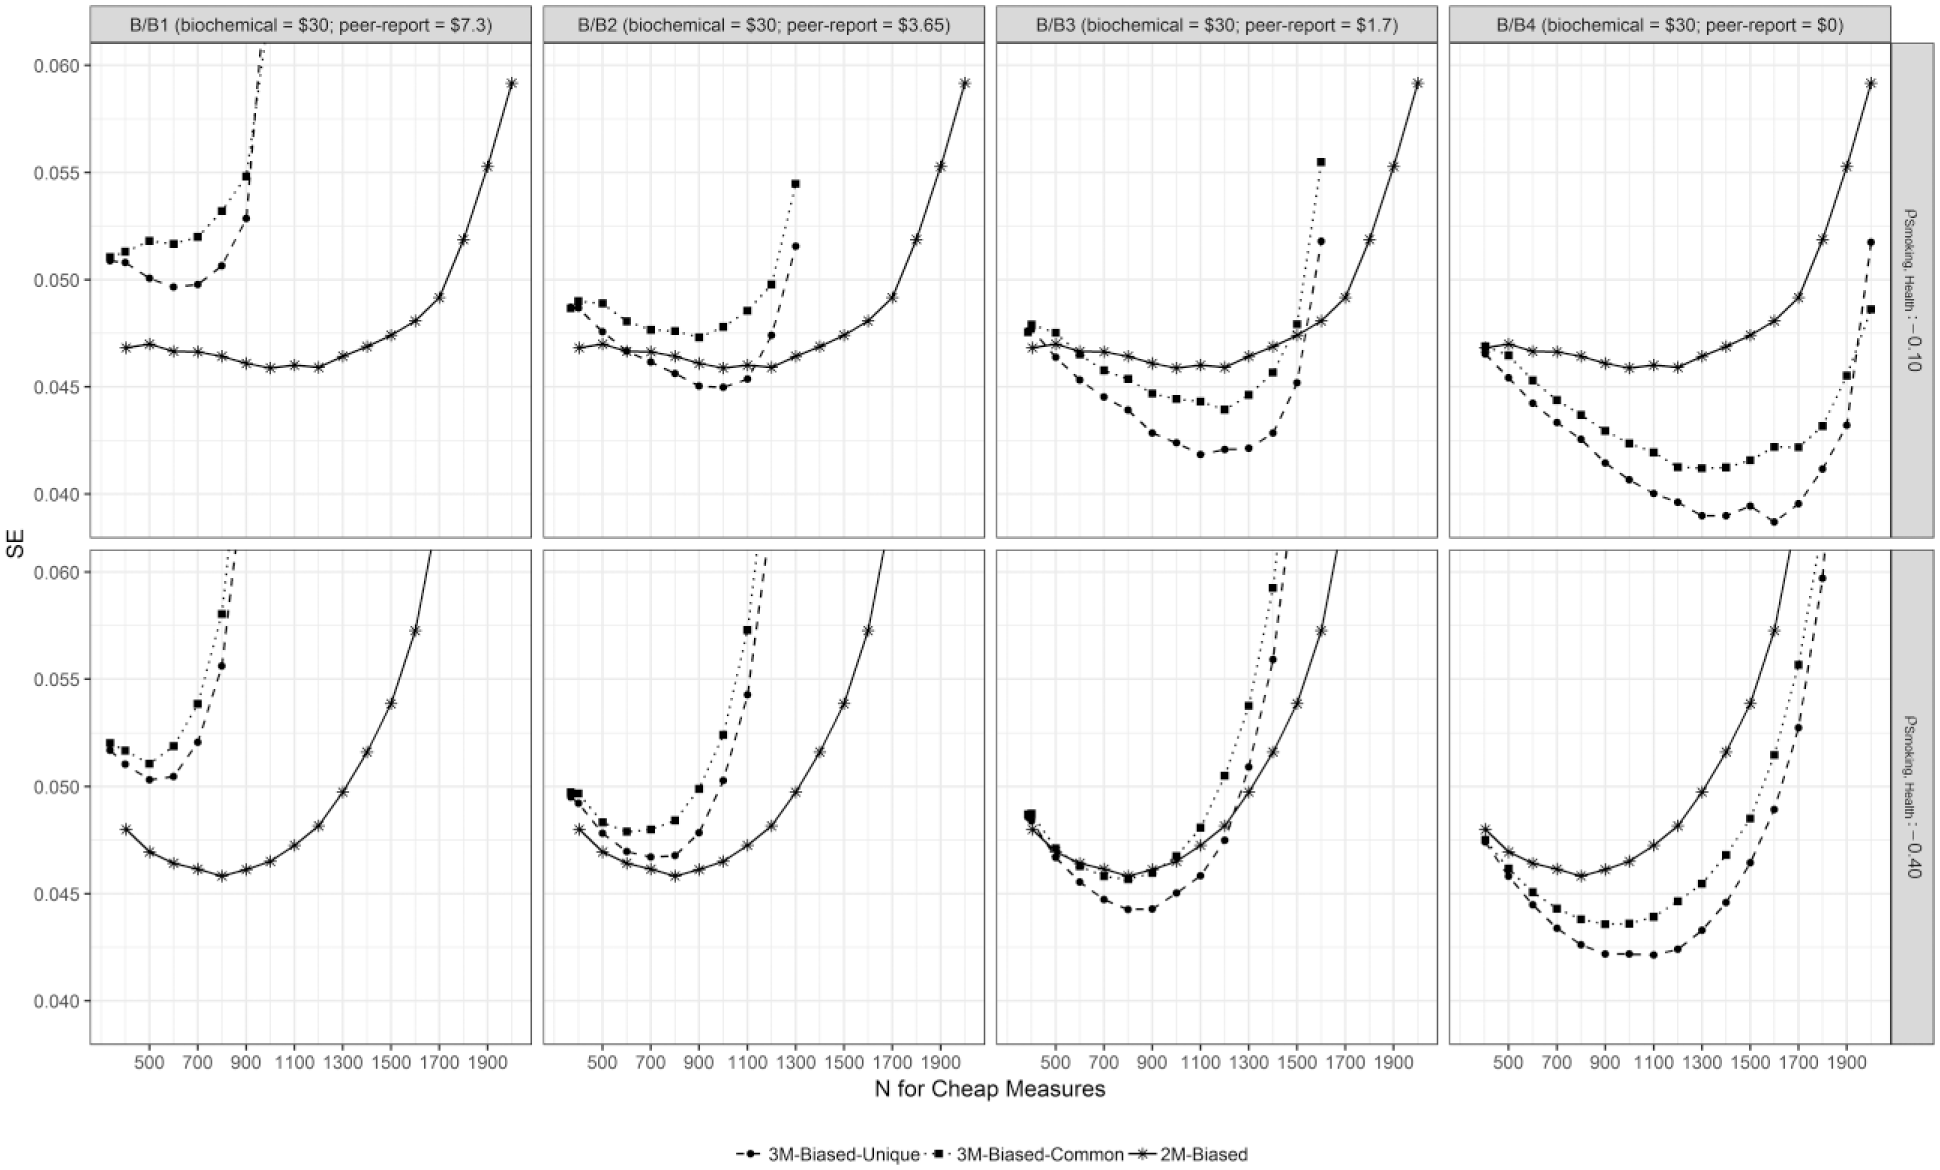
SEs for the regression weight of the Smoking factor predicting Health for all conditions with an only moderately valid initial cheap method (i.e., self-report) for cost-ratios B, B1, B2, B3, and B4.

SEs for the regression weight of the Smoking factor predicting Health for all conditions with a highly valid initial cheap method (i.e., self-report) for cost-ratios C, C1, C2, C3, and C4.

SEs for the regression weight of the Smoking factor predicting Health for all conditions with an only moderately valid initial cheap method (i.e., self-report) for cost-ratios C, C1, C2, C3, and C4.
Relative Design Efficiency of Planned Missing Data Designs Compared With Same-Price Complete Data Designs.

Note. The values in the table represent RDEMiss. The models correspond to the population models described in Table 1 and Figures 1 and 2. The price for the first cheap measure (i.e., self-report) is $7.3 in all cost-ratios. The price for the expensive measure and for the additional cheap measure (i.e., peer report) is as follows (price expensive measure, price additional cheap measure): A = ($16.78, —), A1 = ($16.78, $7.3), A2 = ($16.78, $3.65), A3 = ($16.78, $1.7), A4 = ($16.78, $0), B = ($30, —), B1 = ($30, $7.3), B2 = ($30, $3.65), B3 = ($30, $1.7), B4 = ($30, $0), C = ($73, —), C1 = ($73, $7.3), C2 = ($73, $3.65), C3 = ($73, $1.7), C4 = ($73, $0). All configurations cost approximately $15,050.
Relative Design Efficiency of the Optimal Three-Method Measurement Designs in Comparison With the Corresponding Optimal Same-Cost Two-Method Measurement Designs.
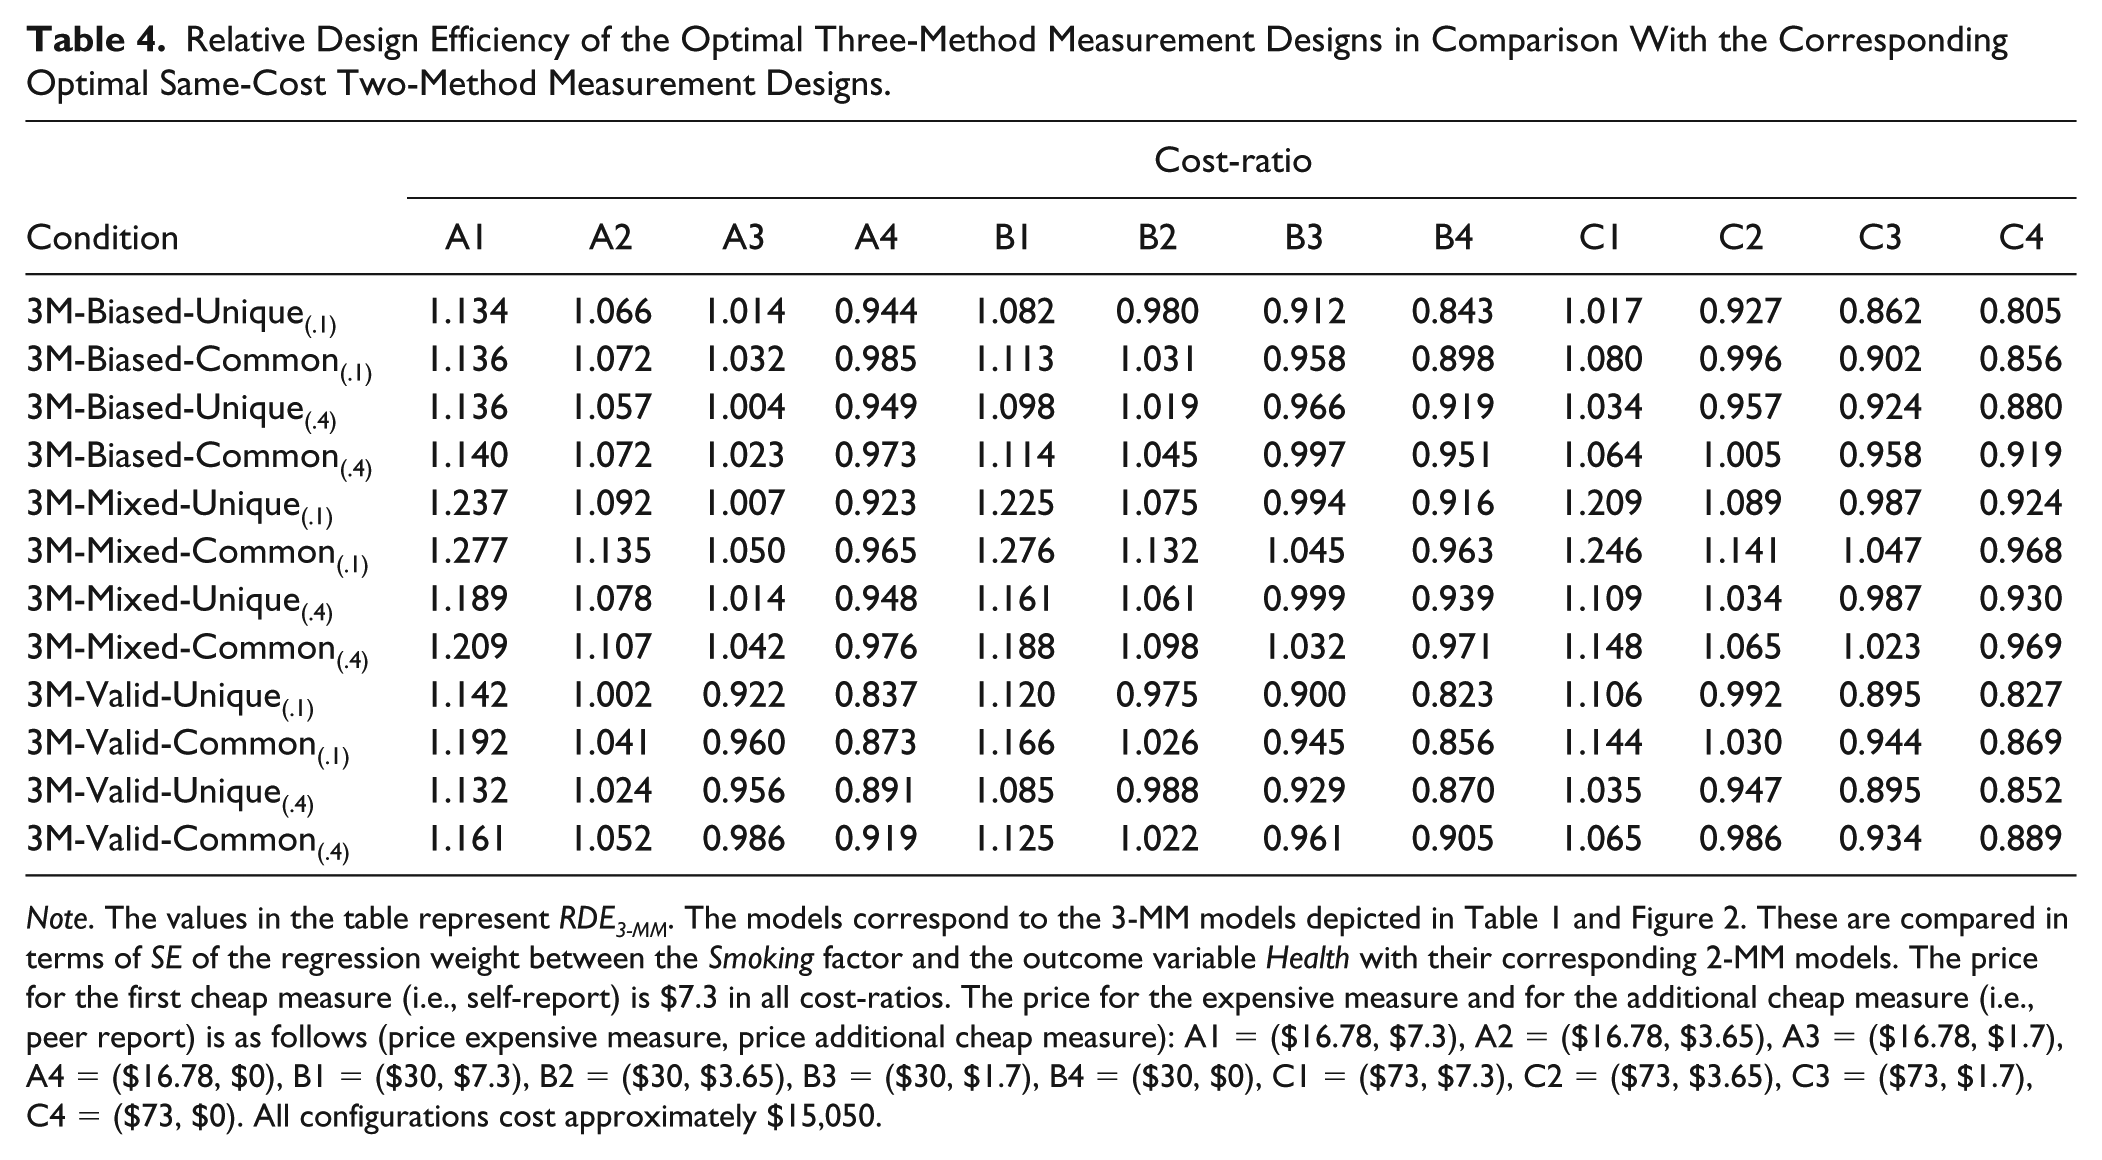
Note. The values in the table represent RDE3-MM. The models correspond to the 3-MM models depicted in Table 1 and Figure 2. These are compared in terms of SE of the regression weight between the Smoking factor and the outcome variable Health with their corresponding 2-MM models. The price for the first cheap measure (i.e., self-report) is $7.3 in all cost-ratios. The price for the expensive measure and for the additional cheap measure (i.e., peer report) is as follows (price expensive measure, price additional cheap measure): A1 = ($16.78, $7.3), A2 = ($16.78, $3.65), A3 = ($16.78, $1.7), A4 = ($16.78, $0), B1 = ($30, $7.3), B2 = ($30, $3.65), B3 = ($30, $1.7), B4 = ($30, $0), C1 = ($73, $7.3), C2 = ($73, $3.65), C3 = ($73, $1.7), C4 = ($73, $0). All configurations cost approximately $15,050.
High Factor Loadings of Self-Report
Figures 4, 6, and 8 illustrate the averaged SEs of the conditions with high factor loadings of the self-report scales on the Smoking factor (i.e., λ ss = 0.5). RDEMiss values range from 0.50 to 0.99. 3-MM-PMD models with two valid cheap measures (i.e., λss = λ sp = 0.5) have lower RDEMiss values than 3-MM-PMD models, in which the validity of the cheap measures is mixed (i.e., λ ss = 0.5; λ sp = 0.35). RDEMiss is smaller for models where the size of the standardized regression effect between the Smoking factor with the Health factor is −.10 rather than −.40.
Low Factor Loadings of Self-Report
Figures 5, 7, and 9 illustrate the averaged SEs of the conditions with low factor loadings of the self-report on the Smoking factor (i.e., λ ss = 0.35). RDEMiss values for these conditions range from 0.65 to 1.02. Generally, RDEMiss values become smaller, when the regression effect between the Smoking factor and the Health factor is −.10 rather than −.40. For cost-ratios A, A1, A2, and A3 (i.e., biochemical indicators are fairly cheap [$16.78]) as well as cost-ratio B1 (i.e., biochemical indicator: $30; peer report and self-report: $7.3) this relationship is reversed.
Design Efficiency of 3-MM Models
Figures 4 to 9 illustrate that the averaged SEs of the 3-MM models with optimal sample size constellations yield larger SEs (i.e., less power) than the corresponding optimal 2-MM designs, when the self-report costs as much as the peer report (i.e., cost-ratios A1, B1, and C1). When the peer report is cheaper (i.e., cost-ratios A3, A4, B2, B3, B4, C2, C3, and C4), the optimal 3-MM designs yield higher power than the corresponding optimal 2-MM designs in some of the population models investigated. Table 4 depicts all RDE3-MM values.
High Factor Loadings of Self-Report (Figures 4, 6, and 8)
For population models with high factor loadings of the self-report scales on the Smoking factor (i.e., λ ss = 0.5), RDE3-MM ranges from 0.82 to 1.28. RDE3-MM is smaller for models with two valid cheap measures (i.e., λ ss = λ sp = 0.5). For models with mixed validity of the cheap measures (i.e., λ ss = 0.5; λ sp = 0.35), RDE3-MM values are only smaller than 1 in cost-ratios A4, B3, B4, C3, and C4. Generally, RDE3-MM gets smaller when the peer report is cheap and the bias factors are not highly correlated.
Low Factor Loadings of Self-Report (Figures 5, 7, and 9)
For population models with low factor loadings of the self-report scales on the Smoking factor (i.e., λ ss = 0.35), RDE3-MM ranges from 0.805 to 1.143. For these conditions, models with smaller population regression weights generally yield smaller RDE3-MM. In cost-ratio B2, RDE3-MM is smaller than 1 for the model 3M-Biased-Unique(.1). In cost-ratios A4, B3, B4, C2, C3, and C4, RDE3-MM is smaller than 1 in all conditions except for model 3M-Biased-Common(.4) in cost-ratio C2.
Discussion
A PMD design incorporating two cheap but biased methods and one expensive gold standard method was outlined and illustrated using the example of the hypothetical measurement of smoking behavior. The performance (in terms of power for testing the regression coefficient between the measured construct and an outside criterion) of this 3-MM-PMD design was examined in numerous conditions using a simulation study. Corresponding 2-MM-PMD and CD designs with identical research costs were defined and contrasted with the 3-MM-PMD designs.
Estimation Issues
Convergence rates of the models were generally high, except for some sample size constellations where the number of complete-cases was very small (i.e., NCC < 125). The seb values indicate that the SEs were generally slightly underestimated in both the 2-MM-PMD and the 3-MM-PMD models. This effect grew when the number of complete-cases got smaller. For those sample size constellations yielding the greatest statistical power for testing the latent regression weight in each condition, the seb fell under the critical cutoff of −0.1 in 13 cases. In all of these instances, the design with the highest power had a rather small sample of complete-cases (i.e., NCC < 87). This shows that the sample of complete-cases needs to be sufficiently large (e.g., NCC > 125) to efficiently estimate the 2-MM-PMD and 3-MM-PMD designs. There were, however, no major differences in estimation efficiency between 2-MM-PMD and 3-MM-PMD designs.
Efficiency of PMD Designs
The comparison of the PMD and CD designs in terms of statistical power revealed that PMD designs could increase the cost-effectiveness in almost all simulation conditions compared with the corresponding same-cost CD designs. It is, however, important to differentiate between situations in which the validity of cheap measures is high and when it is rather low.
Cheap Measure(s) Are Highly Valid
In all studied conditions, where at least one of the cheap measures was highly valid (i.e., λ ss = 0.5), a PMD design could be found that yielded higher statistical power for testing the regression weight than the corresponding same-cost CD design. Higher costs for the expensive gold standard method increased the power benefit of 2-MM-PMD and 3-MM-PMD designs. A small regression weight in the population increased the power benefit even more. Hence, these results replicate the findings by Graham et al. (2006). 3-MM-PMD designs become more cost effective, when the price of the second cheap measure is low, when the second cheap measure is highly correlated with the expensive gold measure and when the two cheap measures share little bias variance. In the most extreme case of the simulation conditions with highly valid cheap measures, the SE of the PMD design with the optimal sample size constellation was roughly half the size of the SE in the corresponding same-price CD design.
Cheap Measures Have Poor Validity
The simulation revealed that using a PMD design in situations in which the cheap measures have poor validity can be statistically harmful in terms of power, when the cost-differential between the expensive measure and the cheap measures is rather small (i.e., cost-ratios A, A1, A2, A3, and B1). However, with an increasing cost differential of the expensive method and the cheap method(s), PMD designs were found that yield smaller SEs (i.e., higher power) compared with the corresponding same-price CD designs. In the most extreme case of the simulation conditions, where the cheap measures had rather poor validity, the SE of the PMD design with a statistically optimal sample size constellation was 65% of the size of the SE in the corresponding same-price CD design. Again, 3-MM-PMD designs yielded more power when the two cheap measures did not share a high amount of bias-related variance and the price of the additional cheap measure was low.
Efficiency of 3-MM Designs
In a second step, we compared the 2-MM and the 3-MM designs among each other in terms of statistical power.
Additional Cheap Method Is Equally Expensive to the Initial Cheap Method
When the additional cheap method in the 3-MM design costs as much as the initial cheap method, the 2-MM design is statistically superior to the 3-MM design in terms of power. With increasing costs of the expensive method, however, this statistical advantage of the 2-MM over the 3-MM design becomes smaller, in some conditions even ignorable. This is especially the case, when the systematic bias variances of cheap methods are unique in the 3-MM design and the additional cheap method is a highly valid measure of the construct.
Additional Cheap Method Is Less Expensive Than the Initial Cheap Method
When an additional cheap measure can be found that has a significantly lower cost of administration than the initial cheap method, 3-MM designs yield higher statistical power than corresponding same-price 2-MM designs, when the two cheap methods are highly valid measures of the construct and only share little amounts of bias variance. This was true for all simulated conditions except for those conditions, in which the administration of the additional cheap method was half as expensive as the administration of the initial cheap method and the price of the expensive measure was fairly low (i.e., cost-ratio A2). Furthermore, 3-MM designs even increased the statistical power relative to the corresponding same-cost 2-MM design when the additional cheap measure was only moderately valid (i.e., λ sp = 0.35) and the initial cheap measure was highly valid (i.e., λ ss = 0.5). In our simulation this was, however, only possible, when the two cheap measures did not share a lot of systematic bias variance and the additional cheap measure was very cheap (i.e., 3M-Mixed-Unique(.1) and 3M-Mixed-Unique(.4) in cost-ratios B3 and C3) or if the additional cheap measure did not add any additional costs to the research design (i.e., all “Mixed” models in cost-ratio A4, B4, and C4). When both cheap methods had poor validity, 3-MM designs were statistically superior to 2-MM designs, when either the additional cheap measure was very cheap or the gold standard method was rather expensive (i.e., cost-ratio A4, B3, B4, C2, C3, and C4).
Recommendations
This article underlines that utilizing a PMD design can help increase the statistical power of a study. For the first time, however, it was also shown that 2-MM-PMD and 3-MM-PMD designs can yield lead less power compared with corresponding CD designs, when the cheap methods used are not highly valid and the cost-differential between the cheap and the expensive methods is small. It is, therefore, important to keep the following recommendations in mind when planning a study with PMD:
2-MM-PMD and 3-MM-PMD designs should only be used when a highly valid gold standard method for measuring the construct of interest is available. Using a systematically biased measure as the reference method would lead to a more difficult interpretation of the construct and the bias factor(s). How the construct and the bias factors can be interpreted is neatly explained by Geiser et al. (2008).
In order for the 2-MM-PMD and 3-MM-PMD models to be identified, at least two observed indicators of the cheap measures (that are systematically biased) and at least one manifest indicator of the expensive measure are needed (Garnier-Villarreal et al., 2014).
The cheap method(s) used should have substantial construct validity (i.e., convergent validity with the gold standard). Highly biased cheap measures can lead to reduced statistical power of the PMD designs compared with same-price CD designs.
High cost differentials between the cheap and the expensive methods as well as a rather small correlation of the construct with the outcome variable increase the statistical benefits of PMD designs.
Sample sizes must be sufficiently large to get stable and efficient model estimates. Our findings underline Rhemtulla and Little’s (2012) suggestion of a minimum of 125 complete-cases.
The present simulation study revealed that incorporating an additional cheap method in a 3-MM-PMD design rather than using a 2-MM-PMD design is recommended, when
the additional cheap measure has high levels of construct validity and can be administered with rather low additional costs.
the gold-standard method is very expensive and the two cheap methods do not share high amounts of method variance.
Finding the Optimal Study Design
The presented findings reveal a complex picture with respect to the properties of 2-MM-PMD and 3-MM-PMD designs and emphasize the importance of the costs and validity of the measures used, the population effect size and the available research budget. Thus, prior to conducting a study, intensive planning is essential to make an informed decision about which research design and sample size constellation to use.
Statistical Considerations
In order to find the research design with the highest power for a given research budget and known assessment methods, it is highly advised to conduct a simulation similar to the one presented in this article. Using shiny (version 1.0.5; Chang, Cheng, Allaire, Xie, & McPherson, 2017), we have developed a program to conduct such calculations for the measurement models used in this article (see Figures 1 and 2). In a first step, the user specifies the model type (2-MM vs. 3-MM), the costs of the methods used and the available research budget using the graphical interface. The program then returns the different sample size constellations. In a second step, the user can run simulations for 2-MM and 3-MM designs to find the research design yielding the greatest power for testing the regression coefficient. For doing so, the population parameters (e.g., factor loadings, latent correlations) need to be specified. When the parameters are chosen reasonably, the program should conduct the simulation in less than 5 minutes. The averaged SEs for the different sample size constellations are graphically illustrated and the design with the best statistical properties in terms of power for testing the regression coefficient is returned. Also, the result tables are available for download in different file types (.Rdata or .csv). The program can be downloaded from https://github.com/MarioLawes/PMD-Simulator or accessed online under https://mariolawes.shinyapps.io/r-shiny-app/. Screenshots of the program are depicted in the supplemental materials.
Practical Considerations
When deciding on which research design to use, the needed sample sizes can be an important factor for the researcher as well. If the expensive method is, for example, rather invasive or has potential negative side effects, PMD designs with a low sample size for the expensive and invasive method (and a high total sample size) can help limit the potentially harmful consequences of a study. However, if recruiting participants is an issue, sample size constellation with rather small total sample sizes (and high amounts of complete-cases) can be beneficial from a practical standpoint. In all cases, at least 125 complete-cases should be available to obtain stable and trustworthy estimates. Thus, depending on the conditions it is important to consider the statistical as well as practical features of the research design.
Conclusions
In this article a range of psychological research domains have been described where highly valid self-report and informant report measures as well as gold standard measures are available. Self- and informant reports are very suitable for 3-MM-PMD designs since they are usually prone to different kinds of response biases and thus share only small amounts of systematic method variance (Paunonen & O’Neill, 2010). Furthermore, the additional assessment of informant reports does not significantly increase recruitment cost for each participant; thus, the administration costs of informant reports is usually pretty low (Vazire, 2006). Also, the costs of modern “objective” gold standard methods are usually very high. For example, from our own research, we know that the analysis of hair cortisol costs around $35 per participant. The administration and scoring of a clinical interview takes at least 2.5 hours and needs to be done by trained interviewers (thus costing at least $50 per participant). The Doubly Labeled Water method even cost around £500 ($680) per participant (Bluck, 2008). Thus, there are many research areas in which the 3-MM-PMD design can be applied effectively.
Limitations and Future Research
Future studies should examine why 3-MM-PMD designs seem to be less cost-effective than 2-MM-PMD design in conditions where the additional cheap measure costs as much as the other cheap measure. This finding could exclusively be due to a reduced sample size for estimating the latent outcome variable (i.e., health) and does not necessarily need to be linked to a less accurate estimation of the construct of interest (i.e., smoking behavior). To investigate this idea, the outcome variable could also be measured using multiple methods (e.g., self- and peer report). Furthermore, to be in line with Graham et al. (2006), the reliabilities of the manifest variables in the presented simulation were assumed to be rather low (Reliability = 0.5). Through systematically varying the reliabilities of the manifest indicators, the effect of the reliability on the cost-effectiveness of the designs could be examined. In addition, the performance of a less restrictive model where the bias factors can correlate with the outcome could be tested. Graham (2012) investigated the performance of such a full bias-correction model for the 2-MM-PMD design and concluded that such a model increases the statistical power in comparison to the same-price CD design only in some (rather extreme) conditions. Similar analyses should be conducted for the 3-MM-PMD design. Also, most of the research on 2-MM-PMD and 3-MM-PMD designs focuses on the SEs of the regression coefficient. Future studies could use different outcomes to get a more complete understanding of the 2-MM-PMD and 3-MM-PMD designs.
In the conducted simulation, the designs have been examined under optimal conditions where the analysis models were equivalent to the population model and no unplanned missing data were present. Thus, it would be worthwhile to study the influence of unplanned missing data in future simulations. Especially when the optimal research design for a fixed budget only has very few complete-cases, the additional unplanned missingness could lead to estimation problems.
Even more important is, however, to examine the performance of the 2-MM-PMD and 3-MM-PMD designs in real-world data sets. To our knowledge, only very few researchers have applied the cross-sectional 2-MM-PMD design to real data (e.g., Zawadzki, Graham, & Gerin, 2012) and only one group of authors have used the 2-MM-PMD design in the data collection process (i.e., Drake et al., 2013). This lack of usage probably resembles the fact that many authors do not know about the benefits of PMD designs or have preconceptions about increased analytical efforts. Also in some research areas, it can be difficult to find an unbiased gold standard, which is essential for the 2-MM-PMD and 3-MM-PMD designs. Still many applications for the 2-MM-PMD design have been proposed (Graham, 2012; Graham et al., 2006; Rhemtulla & Little, 2012). This article additionally presented several hypothetical applications for the 3-MM-PMD design. Additionally, the shiny app accompanying this article provides an easy-to-use tool for planning a study with PMD and may help make 2-MM-PMD and 3-MM-PMD designs more accessible for applied researchers so that they can start to make the most of their research budgets.
Supplemental Material
supplementary_material – Supplemental material for Making the Most of Your Research Budget: Efficiency of a Three-Method Measurement Design With Planned Missing Data
Supplemental material, supplementary_material for Making the Most of Your Research Budget: Efficiency of a Three-Method Measurement Design With Planned Missing Data by Mario Lawes, Martin Schultze and Michael Eid in Assessment
Supplemental Material
Supplementary_Materials – Supplemental material for Making the Most of Your Research Budget: Efficiency of a Three-Method Measurement Design With Planned Missing Data
Supplemental material, Supplementary_Materials for Making the Most of Your Research Budget: Efficiency of a Three-Method Measurement Design With Planned Missing Data by Mario Lawes, Martin Schultze and Michael Eid in Assessment
Footnotes
Acknowledgements
We thank Maximilian Bee and Sören Brähmer for helping to code the shiny app.
Declaration of Conflicting Interests
The author(s) declared no potential conflicts of interest with respect to the research, authorship, and/or publication of this article.
Funding
The author(s) received no financial support for the research, authorship, and/or publication of this article.
References
Supplementary Material
Please find the following supplemental material available below.
For Open Access articles published under a Creative Commons License, all supplemental material carries the same license as the article it is associated with.
For non-Open Access articles published, all supplemental material carries a non-exclusive license, and permission requests for re-use of supplemental material or any part of supplemental material shall be sent directly to the copyright owner as specified in the copyright notice associated with the article.