
Abstract
The factor structure of an initial item pool of 207 positive parenting items was investigated (Manila; n = 520, 538) to develop the Positive Parenting Schema Inventory. Single group and multigroup confirmatory factor analyses of the Positive Parenting Schema Inventory showed invariance of the factor structure in six out of the seven levels on two other independent samples (Eastern, Indonesia; n = 366, 383; Western, the United States; n = 204, 214). Good values for reliability were obtained for its seven subscales (50 items) using coefficient omegas (.71 to .95). Evidence of validity based on test content, response processes (item responses to desired inferences), internal structure (exploratory and confirmatory factor analyses), relations to other variables (correlations with other instruments), and consequences of testing (correlations with positive schemas) were demonstrated. A core tenet of schema therapy theory was supported in that recall of past positive parenting patterns were associated with current levels of positive schemas.
There is growing evidence that schema therapy (ST) is a highly effective form of psychotherapy for patients with borderline personality disorders (BPD; Giesen-Bloo et al., 2006; Hawke, Provencher, & Parikh, 2013; Sempertegui, Karreman, Arntz, & Bekker, 2013; Taylor & Arntz, 2016). Young, Klosko, and Weishaar (2003) hypothesized that early maladaptive schemas (EMSs) are the driving force behind this disorder, and that they also play an important role in the origin and maintenance of a number of other disorders. Research has documented a link between EMSs and other disorders such as obsessive–compulsive disorders (Young et al., 2003), chronic depression and anxiety (Malogiannis et al., 2014), eating disorders (Leung, Waller, & Thomas, 1999), alcohol dependency (Decouvelaere, Graziani, Gackiere-Eraldi, Rusinek, & Hautekeete, 2002), and depersonalization disorder (Braitman, 2002). Thus, ST and its underlying conceptualization of psychopathology increasingly demonstrate an explanatory value for clinical disorders, emotional distress, and general well-being.
Central to the initial phase of ST is an effort to clearly understand the links between early parenting experiences and the EMSs that make up these disorders. EMSs are defined as broad, pervasive themes comprising emotions, cognitions, memories, bodily sensations, and distorted beliefs about one’s self and others. It is believed that as parents fall short in their effort to meet a child’s core emotional needs, these experiences, in interaction with the child’s temperament, are major factors in the development of these EMSs (Lockwood & Perris, 2012; Louis & Louis, 2015; Young et al., 2003).
The use of self-report measures of parenting is a core part of the treatment protocol for ST to aid case conceptualization. These self-report measures assesses the precise parenting conditions that relate to the EMSs. There is only currently one such measure, the Young Parenting Inventory (YPI; Young et al., 2003), which focuses exclusively on negative parenting experiences. This measure is already widely used within the ST community. However, the theory underlying ST, consistent with Positive Clinical Psychology (PCP; Taylor & Arntz, 2016), has recently been expanded to put as much importance on early positive parenting experiences as negative ones (Lockwood & Perris, 2012; Young et al., 2003). This has led to a need for a corresponding measure of positive parenting to complement the existing YPI. This article reports on the development of such a measure, to be called the Positive Parenting Schema Inventory (PPSI).
Theoretical Basis of ST
Early adaptive schemas (EASs), in contrast to EMSs, are hypothesized to develop when the core emotional needs of a child are met early in life by primary caregivers. As an outgrowth of this effort to introduce positive constructs, the theoretical specification has been published (Lockwood & Perris, 2012), and the Young Positive Schema Questionnaire (YPSQ), which measures EASs, has just been validated (Louis, Wood, Lockwood, Ho, & Ferguson, 2018).
The EASs mentioned above have also been hypothesized to fall under four broad categories associated with fulfilled core emotional needs, and are labeled Connection and Acceptance, Healthy Autonomy and Performance, Reasonable Limits, and Healthy and Realistic Standards, respectively (see supplemental Table S1[All supplemental tables are available in online version of the article.]; Lockwood & Perris, 2012; Louis & Louis, 2015; Young et al., 2003). These four adaptive categories are counterparts to the four higher order maladaptive categories for EMSs associated with unmet core emotional needs categories and are labeled Disconnection and Rejection, Impaired Autonomy and Performance, Impaired Limits, and Exaggerated Expectations. The four maladaptive categories were empirically derived (e.g., Hoffart et al., 2005; see supplemental material, Table S2) by the results of factor analytic investigations of the EMSs that have been conducted over the past two decades and thus provide a strong starting point from which to understand these new positive constructs.
The link between needs, parenting, and the development of EMSs and EASs can be illustrated through the example of the need for warmth, affection, guidance, and the mutual sharing of personal experience. If a child has a parent who is warm, affectionate, and attuned, this is believed to lead to the development of the EAS known as Emotional Fulfillment; a need making up the Connection and Acceptance category. If the child’s parent is cold, distant, and lacks empathy, this is seen as leading to the development of the EMS known as Emotional Deprivation; a pattern falling within the Disconnection and Rejection category. The latter child is likely to be more prone to anxiety, depression, and feelings of loneliness or emptiness. The child is likely to cope with this EMS by surrendering, avoiding, or overcompensating, or some combination of these three. For example, she or he might surrender to this EMS by feeling and acting as if this is what she or he deserves. Avoidance of this EMS could take the form of distancing from the associated painful feelings by numbing or distraction or staying away from the depriving parent by, for example, spending time in his or her room or out with friends. Finally, overcompensating for this EMS could take the form of pushing to be noticed by the parent or denying any need for emotional nurturance. Children (and later adults) often alternate between surrender, avoidance, and overcompensation depending on internal processes and the environmental demands and potential for action. Each of these three coping styles, while often helping support the individual psychologically in the short run, ultimately serves to perpetuate the EMS into adulthood. The EMSs and their associated copying styles become pathological when they become fixed ways of viewing and acting within the world that are not amenable to later environmental changes or disconfirming evidence of the underlying beliefs. An interaction between the degrees to which these core emotional needs are not met, a child’s temperament, cultural influences, environment, and the quality of the parents’ (or primary caregivers’) relationships with each other are believed to determine the severity of the EMSs (Louis & Louis, 2015; Young et al., 2003). Therefore, early parenting patterns that either meet or do not meet these core emotional needs adequately are believed to contribute significantly to the development of a broad range of EASs and EMSs, respectively (Lockwood & Perris, 2012).
Although the negative parenting patterns, as measured by the YPI, are believed to contribute to the development of EMSs and presumably also impede the development of EASs, there is currently no measure for the positive parenting patterns that are believed (from the vantage point of ST) to help prevent the development of the EMSs and facilitate the development of EASs.
In the 1960s, Baumrind (1966) developed a parenting model consisting of one positive parenting construct known as Authoritative and two negative ones known as Authoritarian and Permissive. Maccoby and Martin (1983) later added a fourth negative construct called Neglectful. All four parenting constructs were based on the two dimensions of warmth and control. This model has been used extensively until today, evidenced from an influential meta-analysis conducted by Pinquart (2017) that used 1,435 studies on associations of parenting dimensions with externalizing symptoms in children and adolescents. However, the restricted range of only four parenting constructs was cited as a limitation in this study and others (Gardner, Collishaw, Maughan, & Scott, 2009; Hudson & Rapee, 2002; Pinquart & Kauser, 2018). Over the years, Baumrind’s model also drew criticisms from Grolnick (2003) and Greenspan (2007), who disagreed with her view that high control was part of her Authoritative parenting construct on the grounds of Attribution theory (Heider, 1958), which suggested that high control from parents would prevent children from experiencing their behavior as being a result of their own internal desires. It seems that early observations may have been limited by the cultural paradigms within which these investigators operated and this, as a consequence, both shaped perceptions of what was seen as adaptive or optimal and put constraints on the range of variables included in the Authoritative parenting construct. It seems also to have limited consideration of positive dimensions of parenting falling outside of this Authoritative construct. While there have been a few positive dimensions added over time such as autonomy (Robinson, Mandleco, Olsen, & Hart, 1995), this still falls short of a comprehensive coverage of the domain of positive patterns of parenting.
Much of the above was developed within the context of Western culture. An understanding of the influences that both Western and Eastern cultural paradigms have on parenting will be important to more fully transcend the associated biases. For example, from a Western perspective, Eastern parenting practices may be viewed as restrictive and harsh with potentially long-term damaging effects for children (Sorkhabi, 2005). From an Eastern parenting perspective, stern parenting is exercised within a context of love and concern and, therefore, is not seen as having negative ramifications for a child’s development (Chao, 1994). Despite these differences, studies such as Pomerantz and Wang (2009) have shown that some parenting practices undermine children’s psychological development, both in Eastern and Western cultures. It will be important to find out which cultural differences are valid within their own context and which parenting practices are optimal regardless of the context.
Parenting Model From ST
In ST, rather than building on the work of previous parenting models, Young developed a unique framework of 17 theoretical negative parenting constructs in the YPI paralleling the 17 EMSs measured by the Young Schema Questionnaire–Short form version 3 (YSQ-S3). A one-to-one mapping between each subscale in the YPI and a specific EMS in the YSQ-S3 was hypothesized. Working backward, the EMSs were used as a starting point for the development of the parenting constructs. Each of the 17 EMSs were assumed to be a reflection of an unmet need by early primary caregivers. Items were developed operationalizing the types of interactions that would lead to a need being thwarted by parents. These items were grouped according to the theme associated with the EMS it was linked to. For example, one of the five sample items that represent the EMS of Defectiveness in the YSQ-S3 is: “No man or woman could love me once he or she saw my defects or flaws.” The need reflected here was for unconditional acceptance of, and love for, one’s private and public self, along with regular praise and the absence of ongoing criticism or rejection. Items for a maladaptive parenting construct that thwarted this need were created in the YPI such as, “He and/or she made me feel unloved or rejected.” Using the same approach for all the other EMSs, a corresponding set of maladaptive parenting constructs for the YPI were devised. For the purposes of developing a much more nuanced set of positive parenting constructs, as set out in this study, adaptive counterparts to these maladaptive parenting constructs were constructed which formed part of the initial item pool of the 17 theoretical parenting constructs of the PPSI. Even if half of these 17 parenting constructs can form a reliable factor structure, it would still contain more adaptive parenting constructs than are found in other established parenting instruments. For example, the s-EMBU (Swedish acronym for “My memories of upbringing”) has three subscales: Parental Rejection, Emotional Warmth, and Overprotection (Aluja, Del Barrio, & García, 2006). Of these three, only one (Emotional Warmth) is positive. The Childhood Trauma Questionnaire (CTQ) has five negative subscales (Bernstein & Fink, 1998) and no positive subscales. The Parental Acceptance–Rejection Questionnaire (PARQ) Adult version has one positive subscale called Warmth (Rohner & Khaleque, 2005). The Alabama Parenting Questionnaire (Essau, Sasagawa, & Frick, 2006) has two positive subscales out of five, Involvement and Positive Parenting. The Parental Bonding Instrument which has three parenting constructs, one adaptive subscale called Care, and the other two maladaptive ones called Overprotection and Authoritarianism (Kendler, 1996). The Parenting Authority Questionnaire based on Baumrind’s (1967) model has three subscales with one positive subscale labeled Authoritative. The Parenting Style and Dimensions Questionnaire (Robinson, Mandleco, Olsen, & Hart, 2001) was a further elaboration on Baumrind’s early model where the Authoritative construct was divided into four subdimensions (Warmth/Involvement, Reasoning/Induction, Democratic Participation, and Good Nature/Easygoing). However, these four subdimensions do not form separate positive constructs but are part of the one broad Authoritative construct.
The development of such additional positive nuances was an important step forward in advancing our understanding of a wider range of positive parenting patterns. However, given the complexity of childhood development, it seems likely that parents and caretakers may be better helped with a model with a more precise and empirically grounded understanding of the origin of a patient’s EASs. Its utility can be tested empirically such that if this measure assesses aspects of positive parenting not represented within current common measures, then it should be able to predict important outcomes above and beyond what can be predicted by those existing measures (Smith, Fischer, & Fister, 2003).
The Present Research
This article reports on a two-phase research program that aimed to develop and provide evidence of validity of a scale to measure past positive parenting patterns using established psychometric principles as stated in the Standards for Educational and Psychological Testing (American Educational Research Association, American Psychological Association, & National Council on Measurement in Education, 2014). The first aim (Phase 1) was to develop a comprehensive item pool, using Likert-type scales, which measured past positive parenting patterns. One way in which evidence of validity based on response processes was assessed was from the size of missing values.
Evidence based on internal structure was done through exploratory factor analysis (EFA). From this EFA, only the most robust items were selected to form a shorter and final version of the PPSI giving evidence of validity based on test content, and internal structure. The second aim (Phase 2) was to provide further evidence of internal structure by conducting single group confirmatory factor analyses (CFA) and multigroup confirmatory factor analyses (MGCFA) on two other independent samples, an Eastern sample and a Western one. Reliability of the subscales of the PPSI was also investigated through coefficient omega and Cronbach’s alpha values. The third aim (Phase 2) was to provide evidence of validity based on relations to other variables using four other established parenting instruments. Some of the subscales of these instruments were determined a priori to be more strongly linked theoretically with the expected subscales of the PPSI. Specifically, we tested whether the subscales of the PPSI that were less concordant with subscales of the YPI correlated significantly less strongly than those that were more concordant.
The fourth aim (Phase 2) was to provide further evidence of validity based on the relations of the PPSI scores to other variables by correlating them with measures of emotional distress, psychological well-being, and gratitude, since studies have shown that the quality of the relationship between parents and offspring shape their personality development and contribute to their well-being (Arrindell et al., 1999; Pomerantz & Wang, 2009; Rohner & Khaleque, 2005; Thimm, 2010). Hierarchical multiple regression analyses were conducted to see if the PPSI predicted psychological well-being, emotional distress, personality disposition, and positive trait gratitude, above and beyond that predicted by all the other established parenting scales. This was to be expected since the PPSI assesses a significantly different set of constructs than those covered by existing scales including a greater degree of specificity for a broader range of positive parenting patterns.
The fifth and final aim (Phase 2) of this study was to provide evidence of validity for consequences of testing by investigating the links between the positive parenting constructs making up this newly developed PPSI scale and EASs as measured by the recently validated YPSQ (Louis et al., 2018). Furthermore, since the theory underpinning ST suggests that EMSs are related to negative parenting as well as the absence of positive parenting patterns, we expected positive correlations between the subscales of the PPSI with those from the EASs as measured by the YPSQ (Louis et al., 2018). This would allow for a preliminary test of a central although often overlooked aspect of ST, namely, that healthy patterns of parenting are linked to the development of EASs. This would be an important addition to the associations that have been demonstrated between negative parenting patterns and EMSs (Sheffield, Waller, Emanuelli, Murray, & Meyer, 2005; Thimm, 2010).
Method
Initial Item Pool Development
The development of an initial item pool for the PPSI involved four individuals who were experts in their respective fields. The first was an American schema therapist whose decades of experience included helping to develop the theoretical EAS Questionnaire (Lockwood & Perris, 2012) and who collaborated with Young in developing ST. The second was a Singapore-based schema therapist and author of a parenting book. The third was a chaired professor of psychology in Australia who has published research on the YSQ. Completing the team was a chaired professor of psychology in Scotland who has published over a 100 papers in the field of well-being, including several on scale development. Three of the team members belong to the International Society for Schema Therapy (ISST), and two of these have served on the ISST Board. The fourth team member was familiar with the therapeutic antecedents to ST but had no association with ISST or any prior training in ST and was, therefore, an external and independent member.
The item pool for the PPSI drew on the original YPI with 72 items (Young et al., 2003) as a starting point. The YPI is a measure of 17 maladaptive parenting patterns, each of which is theoretically linked to an EMS to which it is believed to contribute. Positive counterparts for all 72 items were developed, involving varying degrees of transposition (see supplemental Table S1). However, an additional 135 new items with clinical relevance were also added, totaling 207 items to safeguard the development of this instrument from becoming merely a reverse image of the YPI. These included 11 items for Social Alienation/Isolation EMS that were not part of the original YPI. The current team, drawing on extensive clinical experience, conceptualized parenting patterns believed to be associated with this EMS and developed items to assess these patterns as well as its adaptive counterparts. Over the course of a month, 207 items were finalized. Each item employed the same Likert-type scale used in the YPI, ranging from 1 (completely untrue) to 6 (describes him or her perfectly).
Samples
English speakers in five cities were sampled in this study: Jakarta, Indonesia; Manila, Philippines; Fairfax, North Virginia; Stafford North Virginia; and Manchester, New Hampshire. The latter three, all within the United States, formed what was labeled the U.S. sample, while former two were independent Southeast Asian samples. Supplemental material, Table S3, presents the demographic details of the nonclinical, community respondents (professionals, students, parents, and nonparents) by locale and gender. The mean age for the Manila sample (n = 556) was 41.60 years (SD = 11.90); the mean age of the Jakarta sample (n = 394) was 37.10 years (SD = 11.80); and the mean age for the U.S. sample (n = 214) was 43.40 years (SD = 22.60). The data collection were part of a wider project to develop and refine tools for ST; further details of sampling are available in Louis et al. (2018).
Instruments
All instruments below (unless otherwise stated) were used to provide evidence based on relations to other variables.
s-EMBU (Short EMBU)
The EMBU is an acronym for “Egna Minnen Beträffande Uppfostran,” which is Swedish for “My memories of upbringing.” It comprises 23 items, each measuring past parenting experiences (Arrindell et al., 1999), organized into three subscales: Rejection (e.g., “It happened that my parents were sour or angry with me without letting me know the cause”), Warmth (e.g., “If things went badly for me, I then felt that my parents tried to comfort me and encourage me”), and (Over) Protection (e.g., “When I came home, I then had to account for what I had been doing to my parents”). Each item presented two 4-point scales ranging from 1 (no, never) to 4 (yes, most of the time), one regarding the mother and the other regarding the father. Reliability values have been reported to range from α = .72 to .85 for both parents (Arrindell et al., 1999). The correlation of at least one subscale of the s-EMBU with scales of the Eysenck Personality Questionnaire Revised–Abbreviated (Eysenck & Eysenck, 1991) was above, r = .30.
Childhood Trauma Questionnaire
The CTQ is a self-reported inventory of 28 items measuring past parenting experiences. Each item presents a 5-point Likert-type scale ranging from 1 (never true) to 5 (very often true) with separate ratings for father and mother with five subscales: Emotional Abuse (e.g., “I thought my parents wished I had never been born”), Physical Abuse (e.g., “I got hit so hard by someone in my family that I had to see a doctor or go to the hospital”), Sexual Abuse (e.g., “Someone molested me”), Emotional Neglect (reverse score example, “I felt loved”), and Physical Neglect (e.g., “My parents were too drunk or high to take care of the family”), and an optional category called Minimization/Denial (e.g., “I had the perfect childhood). The CTQ scales have established reliability values ranging from α = .79 to .94, with good test–retest reliability over a 2- to 6-month interval (intraclass correlation r = .88). This instrument has repeatedly been found to be psychometrically valid (Bernstein & Fink, 1998).
Parental Acceptance–Rejection Questionnaire (Adult version PARQ)
The PARQ is a self-reported inventory of 24 items assessing perceptions of parents’ past behaviors (Rohner & Khaleque, 2005). Each item presents a 4-point Likert-type scale ranging from 1 (almost always true) to 4 (almost never true) with separate ratings for fathers and mothers with four subscales: Warmth/Affection (e.g., “Said nice things about me), Hostility/Aggression (e.g., “Said many unkind things to me”), Indifference/Neglect item (e.g., “Was too busy to answer my questions”), and Undifferentiated/Rejection item (e.g., “Made me feel unloved if I misbehaved”). Reliability coefficients have been reported to range from α = .86 to .95. Significant correlations with three subscales of the Parent Behavior Inventory (Children’s report)—those labeled Acceptance, Hostility, and Rejection (r ⩾ .81)—provided evidence of validity based on the relations to other variables (Schaefer, 1965). The PARQ is often used jointly with the Personality Assessment Questionnaire (PAQ) to explore how parenting affects personality dispositions. The mean effect size of statistically significant correlations of maternal and paternal acceptance with at least one of the PAQ subscale was r = .39.
YPI-R
The original YPI with 72 items measures perceived parenting experiences of an adult’s father and mother separately. Participants rate statements about their parents, to which they indicate their agreement on a 6-point Likert-type scale that ranges from a score of 1 (completely untrue of me) to a score of 6 (describes me perfectly). Scores on each subscale are provided separately for ratings of fathers and mothers, or those whom the participants considered as having assumed a paternal or maternal role (grandparent, stepmother or father, or much older sibling), as different patterns of correlations may emerge depending on the gender of the parent who is adopting a particular parenting pattern. This allows participants who grew up with only one parent or caregiver to also be included.
Subsequent empirical work suggested a different factor structure emerging from participant’s responses (Sheffield et al., 2005; Slenders, 2014). This study used the shorter 37-item version, known as YPI-R, with nine subscales labeled: Emotionally Depriving, Overprotective, Belittling, Perfectionist, Pessimistic/Fearful, Controlling, Emotionally Inhibited, Punitive, and Conditional/Narcissistic. See supplemental Table S1 for item examples of the YPI. Cronbach’s alpha for the subscales ranged from .67 to .92. All nine subscales demonstrated acceptable test–retest reliability, and correlations ranged from .53 to .85.
Adult Version of the Personality Assessment Questionnaire
The PAQ is a self-reported inventory of seven personality disposition subscales comprising 63 items. Each item presents a 4-point Likert-type scale ranging from 1 (almost always true) to 4 (almost never true). These subscales assess respondents’ perceptions of themselves in terms of the traits of seven personality dispositions: Hostility/Aggression item (e.g., “I feel resentment against people”), Dependency (e.g., “I like my friends to feel sorry for me when I am ill”), Negative Self-Esteem (e.g., “I get disgusted with myself”), Negative Self-Adequacy (e.g., “I am overcome by feelings of inadequacy”), Emotional Unresponsiveness (e.g., “I feel I have trouble making and keeping close, intimate friends”), Emotional Instability (e.g., “I get upset easily when I meet difficult problems”), and Negative Worldview (e.g., “I see life, by its very nature, as being insecure and threatening”). The PAQ subscales constitute a measure of overall psychological adjustment that has been found to correspond with experiences of acceptance or rejection by parents as measured by the PARQ for Asian and Western samples (Munaf, Hussain, & Kamrani, 2012). Correlation with a number of other established scales measuring similar constructs ranged from r = −.50 to −.83 (Rohner & Khaleque, 2005).
Ryff’s Scales of Psychological Well-Being
This instrument is a self-report inventory measuring positive psychological well-being comprising 18 items (three items per scale), each of which presents a 5-point Likert-type scale ranging from 1 (strongly disagree) to 5 (strongly agree). Items are arranged into six subscales (see Table 3). The six-factor model showed factor validity and was recommended by van Dierendonck, Díaz, Rodríguez-Carvajal, Blanco, & Moreno-Jiménez (2008). Studies also demonstrated that psychological well-being and subjective well-being loaded separately as two independent but related factors that did not vary with gender, age, or ethnicity (Linley, Maltby, Wood, Osborne, & Hurling, 2009), and reliability values ranged from α = .69 to .81.
Depression, Anxiety, and Stress Subscales (DASS-21)
The DASS-21 contains 21 items with three subscales of emotional distress: Depression, “I couldn’t seem to experience any positive feeling at all”; Anxiety, “I experienced trembling (e.g., in the hands)”; and Stress, “I found it hard to wind down.” Responses are measured on a 5-point Likert-type scale, from 0 (did not apply to me at all) to 4 (applied to me very much or most of the time). Antony, Bieling, Cox, Enns, and Swinson (1998) have demonstrated that the DASS-21 showed moderate correlations (r > .50) with other similar variables also measuring depression and anxiety.
The Gratitude Questionnaire–6 (GQ-6)
The GQ-6 with six-items measures the disposition to experience gratitude using a Likert-type scale, from 1 (strongly disagree) to a score of 7 (strongly agree). An item example is, “When I look at the world, I don’t see much to be grateful for.” The GQ-6 scale correlated significantly and negatively with several measures of impaired sleep quality (r = −.11 to −.29), positively with presleep cognitions (r = .21; Wood, Joseph, Lloyd, & Atkins, 2009) and other measures of well-being (Wood & Joseph, 2010).
Young Positive Schema Questionnaire
The YPSQ measures EASs, or more colloquially, “positive schemas” in adults. It comprises 14 subscales and 56 items (see supplemental Table S1 for sample items). Each item presents a 6-point Likert-type scale that ranges from a score of 1 (completely untrue of me) to a score of 6 (describes me perfectly). The YPSQ was recently validated by Louis et al. (2018). In this study, the YPSQ scales demonstrated evidence of validity based on their relations to other variables as evidenced by significant correlations with a range of personality and distress measures. Furthermore, evidence of this was demonstrated by the 14 subscales of the YPSQ which accounted for additional significant variance over and above that contributed by the 18 negative YSQ-S3 scales with many of the outcome scales and subscales aforementioned. The reliability values were tested in two Eastern samples and one Western samples. For 12 out of the 14 scales, the values ranged from .76 to .93, and for two others the values ranged from .62 and .68. The subscales of the PPSI were expected to show evidence of validity based on consequences of testing through positive correlations with the subscales of the YPSQ as shown by the YPI-R with the YSQ’s 15 measured EMSs (Sheffield et al., 2005).
Procedure and Statistical Analyses
The sample from Manila was used for the EFA in Phase 1 (Aim 1) and Phase 2 (Aims 3 and 4). The samples from Jakarta and the United States were used to test the invariance of the factor structure in Phase 2 (Aim 2). The U.S. sample was also used in Phase 2 to investigate the associations between EASs and the subscales of the PPSI (Aim 5).
Missing data analyses, EFA, Pearson’s correlations, Cronbach’s alpha values, and hierarchical multiple regression were conducted using IBM SPSS Statistics 23 software (IBM Corp, 2015). For single and multigroup CFA, and for determining the coefficient omega values, Mplus 8 software was used (Muthén & Muthén, 1998-2017). Missing data analyses were performed on all three samples to assess percentages of missing values as well as whether missing patterns were random, using the Missing Completely at Random (Little, 1988) test. To determine the impact of missing values on the data, a robustness check was done by conducting EFA using ratings of fathers from data of the Manila sample. The Exclude Case Pairwise option of the SPSS software was the first check. The second was the replacement of missing data values with the average value. The final check was Multiple Imputation, using the 5th imputed data set. If results from the EFA were identical, then the second test of using “average” values would be used. The normality of data was done by inspecting values of kurtosis and skewness, although for sample size > 200, CFA and EFA appear to be robust against such violations (200+; Tabachnick & Fidell, 2012). For regression analysis, the primary concern was the distribution of nonnormality of the dependent variables, not the independent variables, so the distributions of the former were also inspected. According to Hair, Black, Babin, and Anderson (2010), and Byrne (2010), data for the dependent variables can be considered to be normal if skewness is between −2 and +2 and kurtosis is between −7 and +7.
The Bartlett’s test was then conducted to see if the data, based on this criterion, was suitable for EFA. Its suitability was assessed by whether the test was statistically significant (p < .001). The Kaiser–Meyer–Olkin (KMO) measure was also taken to determine if data were adequate for this specific EFA analysis. The decision on how many factors to extract was based on Parallel Analysis, since studies have shown this to be the most effective procedure (Zwick & Velicer, 1986). The type of rotation method to be used was based on the recommendation of Tabachnick and Fidell (2012), in which an oblique method (promax) rather than an orthogonal rotation would be used if values of the factor correlations matrix were .32 and above. Factor correlations were also inspected to see if there was an overlap between factors. In EFA, items that did not have a loading higher than .40 were excluded (Floyd & Widaman, 1995) since it is likely that items below this value will be over interpreted.
The following item selection criteria were established for selecting the most robust items from the two EFAs (ratings for fathers and mothers) in Phase 1 for the development of a shorter version of the PPSI scale. First, at least three to eight robust items were selected per factor (Floyd & Widaman, 1995). Factors with two items or fewer were rejected. Second, items with high loadings in both fathers and mothers factor structures were given the highest priority and were retained (Arrindell et al., 1999). Third, if a lower loading item was very similar in content to a higher loading item, then the lower loading item would be deemed redundant and removed. Fourth, a lower loading item would be retained in place of a somewhat higher loading one if it had greater clinical significance and contributed variability in content. Therefore statistical rigor was balanced with clinical meaning and utility.
The internal consistency for each factor was assessed by values of coefficient omega, and Cronbach’s alpha. The former can provide more accurate measurements of reliability if conditions of tau equilvalence (the same true score for all test items, or equal factor loadings of all items in a factorial model) are violated which is usually the case in practice (Green & Yang, 2009; McDonald, 1999; Raykov & Marcoulides, 2011). According to Nunnally (1978), reliability values ⩾ .65 are acceptable for newly developed instruments, particularly where a broad construct is represented rather than a narrowly represented construct based on several similarly worded items. The final scales representing ratings for fathers and mothers were named PPSI (Fathers) and PPSI (Mothers), respectively, and the final combined scales formed the PPSI. To test for the stability of the PPSI factor structure in two other independent samples, goodness of fit was assessed in Phase 2 using both single group CFA and MGCFA. This was done using a weighted least squares means and variance adjusted estimation to take into account the ordered categorical nature of the response scales (Wirth & Edwards, 2007). The single group CFA was conducted on the two independent samples from Jakarta and the United States. Analyses followed the guidelines in which a close fit is indicated by the normed chi-square (χ2/degrees of freedom [df]) < 4 (Kline, 2005); the root mean square error of approximation (RMSEA) < 0.06, a reasonable fit by 0.05 < RMSEA < 0.08, a mediocre fit by 0.08 < RMSEA < 0.10, and an unacceptable fit by RMSEA > 0.10 (Browne & Cudeck, 1993); one comparative fit index (CFI), and one nonnormed fit index, known as the Tucker–Lewis index (TLI), with values ⩾ .90 for a reasonable fit (Hu & Bentler, 1999).
For MGCFA, the following measurements of invariance (Milfont & Fischer, 2010) were used for the same two independent samples (Jakarta and the United States): (a) configural invariance (same factor structure across groups), (b) metric invariance (same factor loadings across groups), (c) scalar invariance (same item intercepts across groups), (d) error invariance (same error variance across groups), (e) factor variance invariance (same factor variance across groups), (f) factor covariance (same factor covariance across groups), and (g) factor mean invariance (same factor mean across groups).
Evidence of validity based on relations to other variables was first assessed in the Manila sample in Phase 2 using Pearson’s correlations. Conventional guidelines as to what are thresholds for small (r = .10), medium (r = .30), and large effect size (r = .50) were adopted (Cohen, 1992). Given the theoretical belief that positive and negative parenting measures are separate but related constructs, it was expected that the correlations would be of medium strength, with a range consistent with there being an overlap between the subscales but each remaining multiply determined (r = .30 to .60; Cohen, 1992). For correlations between parenting scales with other psychological measures, small to medium size correlations were expected as demonstrated by other studies (Arrindell et al., 1999; Thimm, 2010).
Second, the z test proposed by Steiger (1980) was also used as evidence of validity based on relations to other variables between subscales of the PPSI that were most concordant with those of YPI-R and those that were less so. Finally, evidence of this validity was further demonstrated using hierarchical multiple regression with guidelines by Hunsley and Meyer (2003), where a minimum of, ΔR2 = .0225 (or 2.25%, equivalent to r = .15) must be achieved from the second to the third step of a hierarchical regression analysis. The predictor variables were entered in the following three steps: (a) gender; (b) the subscales of ratings of fathers from the three established parenting (i.e., the PARQ, s-EMBU and CTQ) instruments, as well as nine subscales of YPI-R; (c) the subscales of ratings of fathers of the PPSI. The same steps were repeated for the ratings of mothers of the PPSI subscales.
Results
Missing Data and Evidence of Validity Based on Response Processes
For the Manila, Jakarta, and U.S. samples, the percentages of missing data were very low. For ratings of fathers, Manila = 0.63%, Jakarta = 0.80%, the United States = 0.09%; ratings of mothers, Manila = 0.67%, Jakarta = 3.24%, the United States = 0.11%. The low missing values showed that participants were mostly engaged and that the items were able to be comprehended by them, and this gave some evidence of validity based on response processes.
Results from Missing Completely at Random test for ratings of fathers: Manila, χ2 = 93941.60, df = 92353, p = .00; Jakarta, χ2 = 53151.83, df = 57157, p = 1.00; the United States, χ2 = 1611.86, df = 1479, p = .009. For ratings of mothers: Manila, χ2 = 106090, df = 103911, p = .00; Jakarta, χ2 = 64794.25, df = 67389, p = 1.00; the United States, χ2 = 2010.44, df = 1902, p = .04. This showed that some of the patterns of missing data were not at random. However, no variables had an unusually high number of missing values in comparison with the rest. All three methods for imputing missing data (see Procedures and Statistical Analyses), using the Manila ratings of fathers sample, yielded almost identical EFA results with the same 10 factors, as well as almost identical items under each factor, thus showing impact of missing data was negligible. As a result, the average value of all responses from other subjects was chosen to impute the missing values in all the samples.
Phase 1: EFA, Reliability Values, and Evidence of Validity Based on Test Content
Using the sample from Manila, for ratings of fathers, the KMO index was .97 and Bartlett’s test of sphericity was statistically significant, χ2 (21321, n = 520) = 80639.49, p < .001. For the ratings of mothers, the KMO index was also .97, and Bartlett’s test of sphericity was also statistically significant, χ2 (21321, n = 538) = 77914.94, p < .001. Based on these two criteria, the data were deemed suitable for factor analysis.
Parallel Analysis suggested 10 factors each be extracted for the ratings of fathers and mothers. Results of the EFA of the ratings of fathers using oblique (promax) rotation resulted in a factor solution that accounted for 47.9% of the total variability. There were two items or fewer in the eighth, ninth, and tenth factor, so these three factors were removed and the remaining seven subjected to further analysis. For the ratings of mothers, the 10 factors accounted for 45.40% of the total variability. The fifth, eight, ninth, and tenth factor had two items or fewer, so these four factors were rejected and the other six retained for further analysis. Results of both of these EFAs for Manila are shown in supplemental material, Table S4. Interfactor correlations revealed that the highest correlations for both ratings of fathers and mothers were .72 and .70, respectively. Since these values were <.85, there were no serious concerns about redundancy among these factors or problems associated with multicollinearity (Clark & Watson, 1995). The average statistically significant interfactor correlation was .47 and .54 for ratings of fathers and mothers, respectively (see supplemental material, Tables S5 and S6, for factor correlations of both samples). While positive parenting constructs have been reported to have limited range of dimensions (Power, 2013), perhaps from high correlations among its constructs, these average factor correlations of <.85 showed that the items that represented the PPSI subscales were separate constructs showing multidimensional characteristic of this scale.
The PPSI began with an initial item pool of 207 items. Since many items had high loadings on some of these factors, using the item selection criteria (see Procedure and Statistical Analysis), the more robust factors (with three to eight items) were selected for a shorter version of the PPSI for both fathers and mothers. Item selection based on greater clinical significance was determined by expert judgment. Two items (Item 375 and 92; see supplemental material, Table S4) with lower factor loadings in the ratings of the fathers under the first factor labeled, Emotional Nurturance and Unconditional Love, were selected in preference to higher loading items (e.g., Items 175, 144, and 206) as they provided variability in content and captured a different and negative facet of this nurturing construct: “Was patient even when things weren’t done properly or quickly enough,” and, “Always spoke to me in a respectful way, even when she or he was angry with me.” However, the items that were rejected captured a much more positive facet of nurturance that were similar to other higher loading items that were selected.
This resulted in seven factors for the fathers’ ratings, comprising 42 items with factor loadings that ranged from the cutoff point of .40 to .98. These factors were named Autonomy Granting, Autonomy Support, Dependability, Emotional Nurturance and Unconditional Love, Intrinsic Worth, Playfulness and Emotional Openness, and Confidence and Competence. For the ratings of the mothers, one of the six factors with four items, labeled Realistic Expectations, had a low Cronbach’s alpha reliability value of .54 and a coefficient omega value of .45 in the Jakarta sample and was therefore rejected, leaving five factors with 32 items with factor loadings that ranged from the cutoff point of .40 to .82. These were labeled as Autonomy Support, Dependability, Emotional Nurturance and Unconditional Love, Intrinsic Worth, Playfulness and Emotional Openness. Items in both scales showed good representation of the constructs they measured and this provided evidence based on test content. Thus, from Phase 1, a final factor structure was established for the PPSI (Fathers) and PPSI (Mothers), and these were used for further analyses in Phase 2 (see supplemental Table S4 for EFA results with factor loading cutoff points of >.4).
The coefficient omegas were generally higher (fathers from .71 to .95; mothers from .72 to .94) than the Cronbach’s alpha values (fathers from .67 to .93; mothers from .70 to .92) for all the seven subscales which indicated that the assumption of tau equivalence was violated (Green & Yang, 2009). Therefore, the use of coefficient omega values was preferred. Regardless, for each subscale their values were acceptable, ⩾ .65 (Nunnally, 1978). Both these reliability values along with the mean and standard deviation in all three samples are shown in supplemental material, Table S7.
Phase 2: Evidence of Validity Based on Internal Structure
The factor structure that had emerged from the Manila sample from Phase 1 consisted of seven factors comprising 42 items for ratings of fathers, and five factors comprising 32 items for ratings of mothers. A single group CFA was run using the same model for both the Jakarta and the United States samples, respectively. Results indicated that an adequate fit was obtained for the normed chi-square, RMSEA, CFI, and TLI. For the ratings of fathers: Jakarta (χ2 = 1637.14, df = 798, χ2/df = 2.05, RMSEA = 0.05, CFI = 0.94, TLI = 0.93) and the United States East samples (χ2 = 1844.77, df = 798, χ2/df = 2.31, RMSEA = 0.08, CFI = 0.92, TLI = 0.91). For the ratings of mothers, an adequate fit was also achieved: Jakarta (χ2 = 1152.64, df = 454, χ2/df = 2.54, RMSEA = 0.06, CFI = 0.94, TLI = 0.93) and the United States East samples (χ2 = 1028.99, df = 454, χ2/df = 2.27, RMSEA = 0.08, CFI = 0.94, TLI = 0.93). A MGCFA was also conducted, as shown in Tables 1 and 2. In the MGCFA, Models 1 to 4 (known as measurement invariance) were organized in a hierarchy with increasing constraints, with each model nested within the previous; so if invariance failed in Model 1, it could not be assessed separately in Models 2, 3, or 4. However, Models 5 to 7 (known as structural invariance) were not hierarchical or sequential; so Models 6 and 7 could be assessed independently, regardless of whether invariance was demonstrated in Model 5 (Milfont & Fischer, 2010). Therefore, invariance was achieved in six out of the seven tests for both samples (an Eastern and a Western). When combined, the PPSI (Fathers) and PPSI (Mothers) scales formed a measure comprising seven adaptive parenting subscales with a total of 50 items.
Fit Indices From Multigroup CFA for PPSI (Fathers) With Seven Factors 42 Items Using Jakarta (n = 366) and the U.S. (n = 204) Samples.
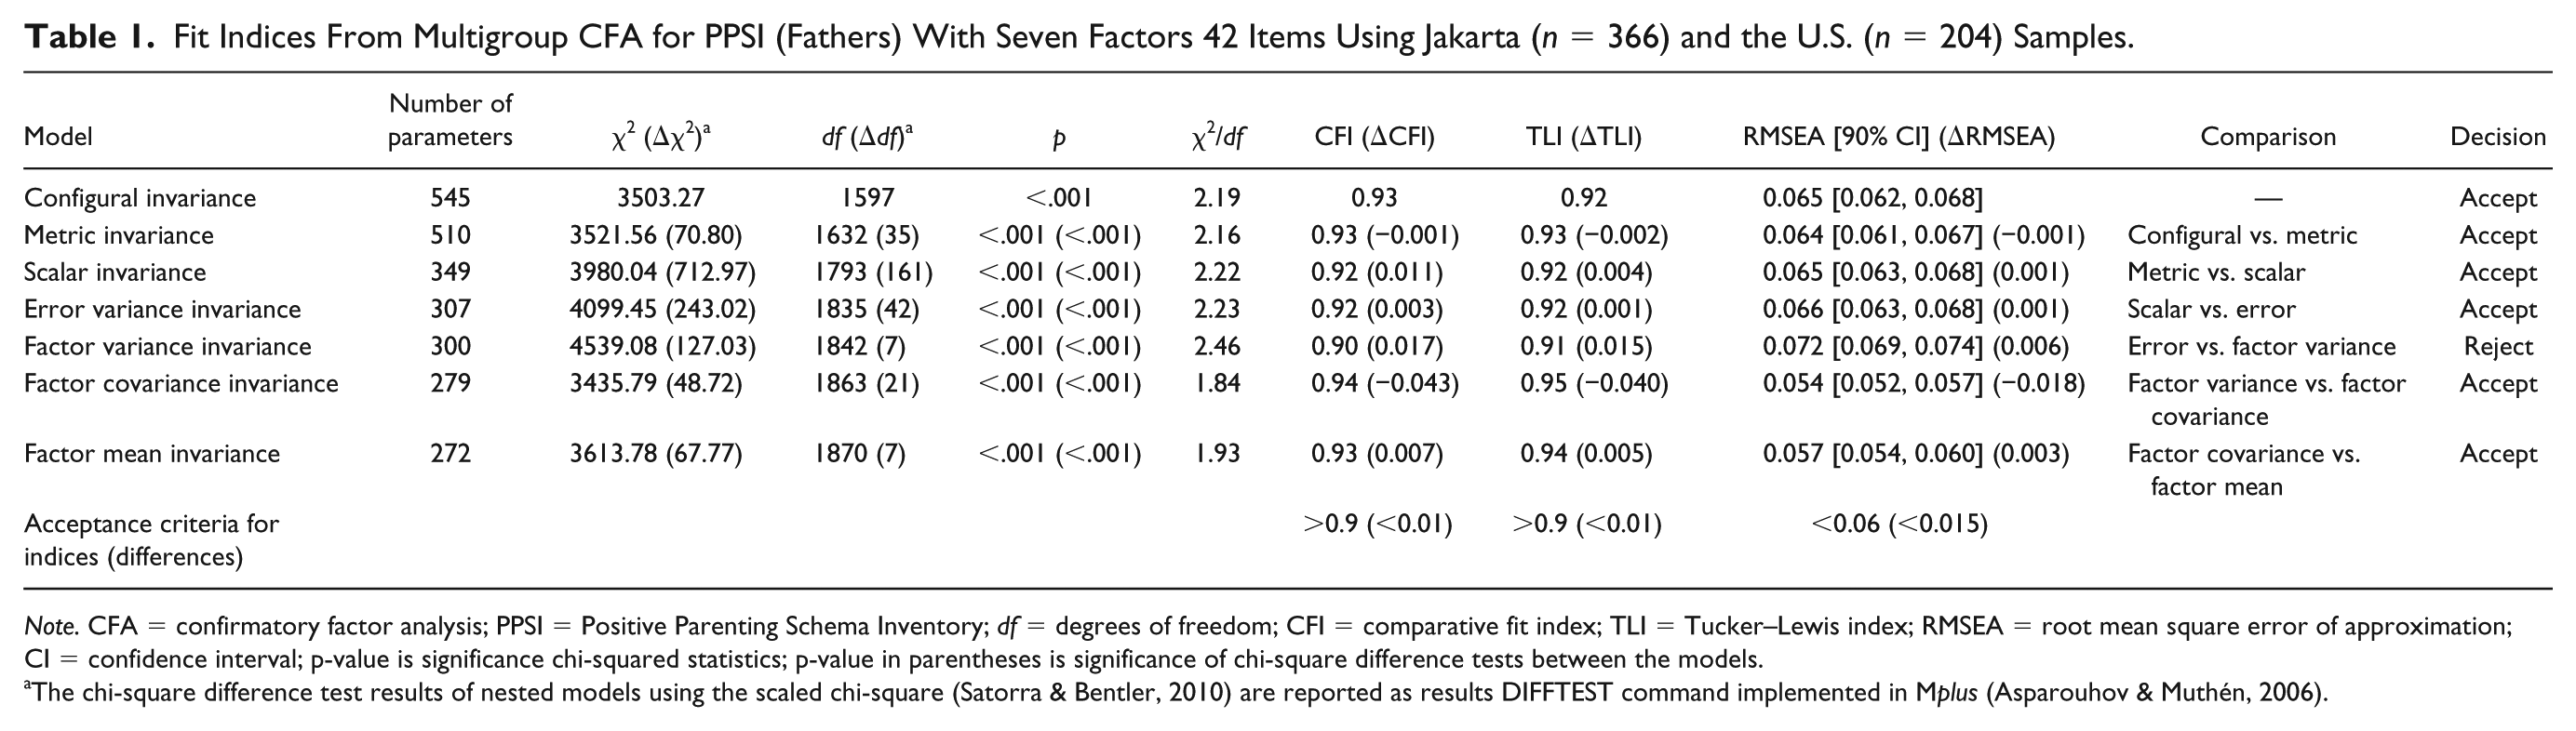
Note. CFA = confirmatory factor analysis; PPSI = Positive Parenting Schema Inventory; df = degrees of freedom; CFI = comparative fit index; TLI = Tucker–Lewis index; RMSEA = root mean square error of approximation; CI = confidence interval; p-value is significance chi-squared statistics; p-value in parentheses is significance of chi-square difference tests between the models.
The chi-square difference test results of nested models using the scaled chi-square (Satorra & Bentler, 2010) are reported as results DIFFTEST command implemented in Mplus (Asparouhov & Muthén, 2006).
Fit Indices From Multigroup CFA for PPSI (Mothers) With Five Factors 32 Items Using Jakarta (n = 383) and the U.S. (n = 214) Samples.
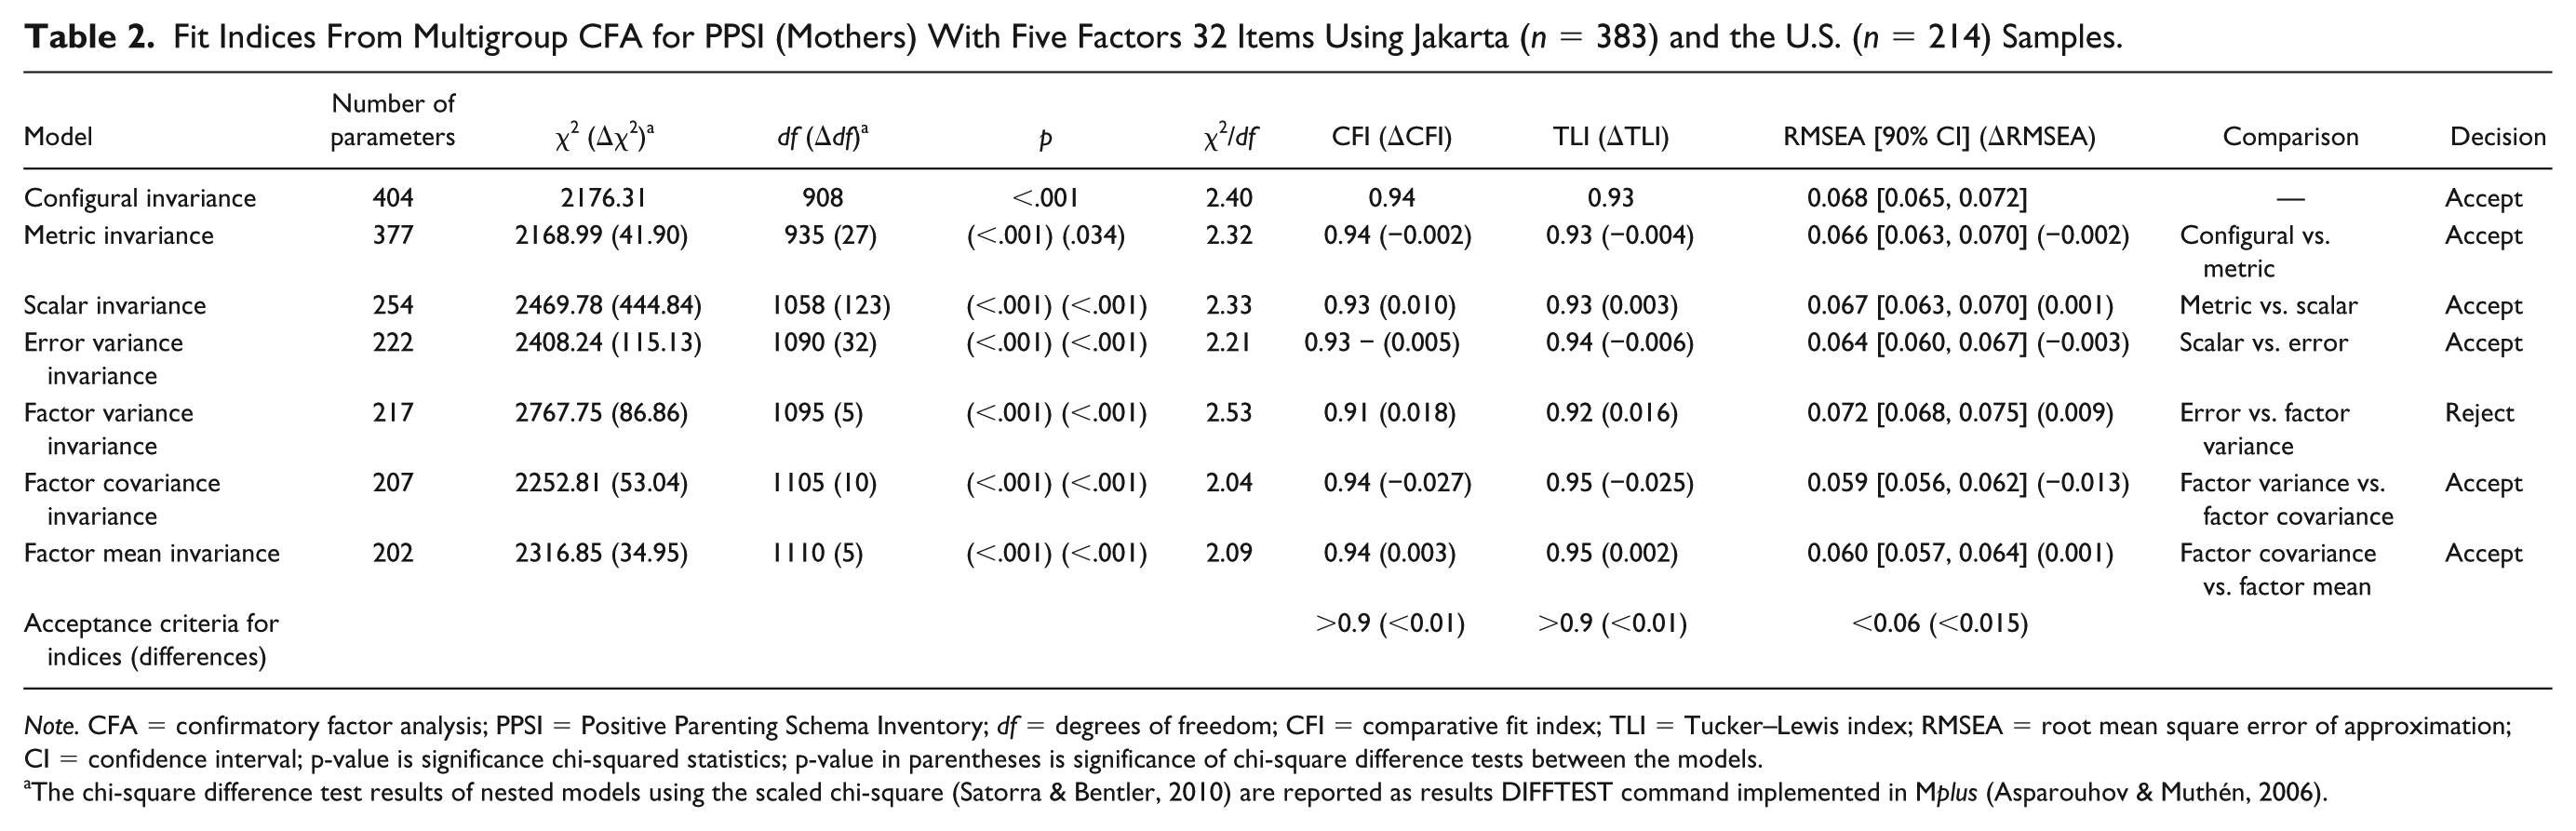
Note. CFA = confirmatory factor analysis; PPSI = Positive Parenting Schema Inventory; df = degrees of freedom; CFI = comparative fit index; TLI = Tucker–Lewis index; RMSEA = root mean square error of approximation; CI = confidence interval; p-value is significance chi-squared statistics; p-value in parentheses is significance of chi-square difference tests between the models.
The chi-square difference test results of nested models using the scaled chi-square (Satorra & Bentler, 2010) are reported as results DIFFTEST command implemented in Mplus (Asparouhov & Muthén, 2006).
Pearson’s Correlation Matrix of the PPSI (Fathers) and PPSI (Mothers) With s-EMBU, CTQ-28, PARQ, YPI-R, PAQ, GQ-6, DASS-21, and Ryff’s Well-Being Using Manila Sample (n = 520, 538).
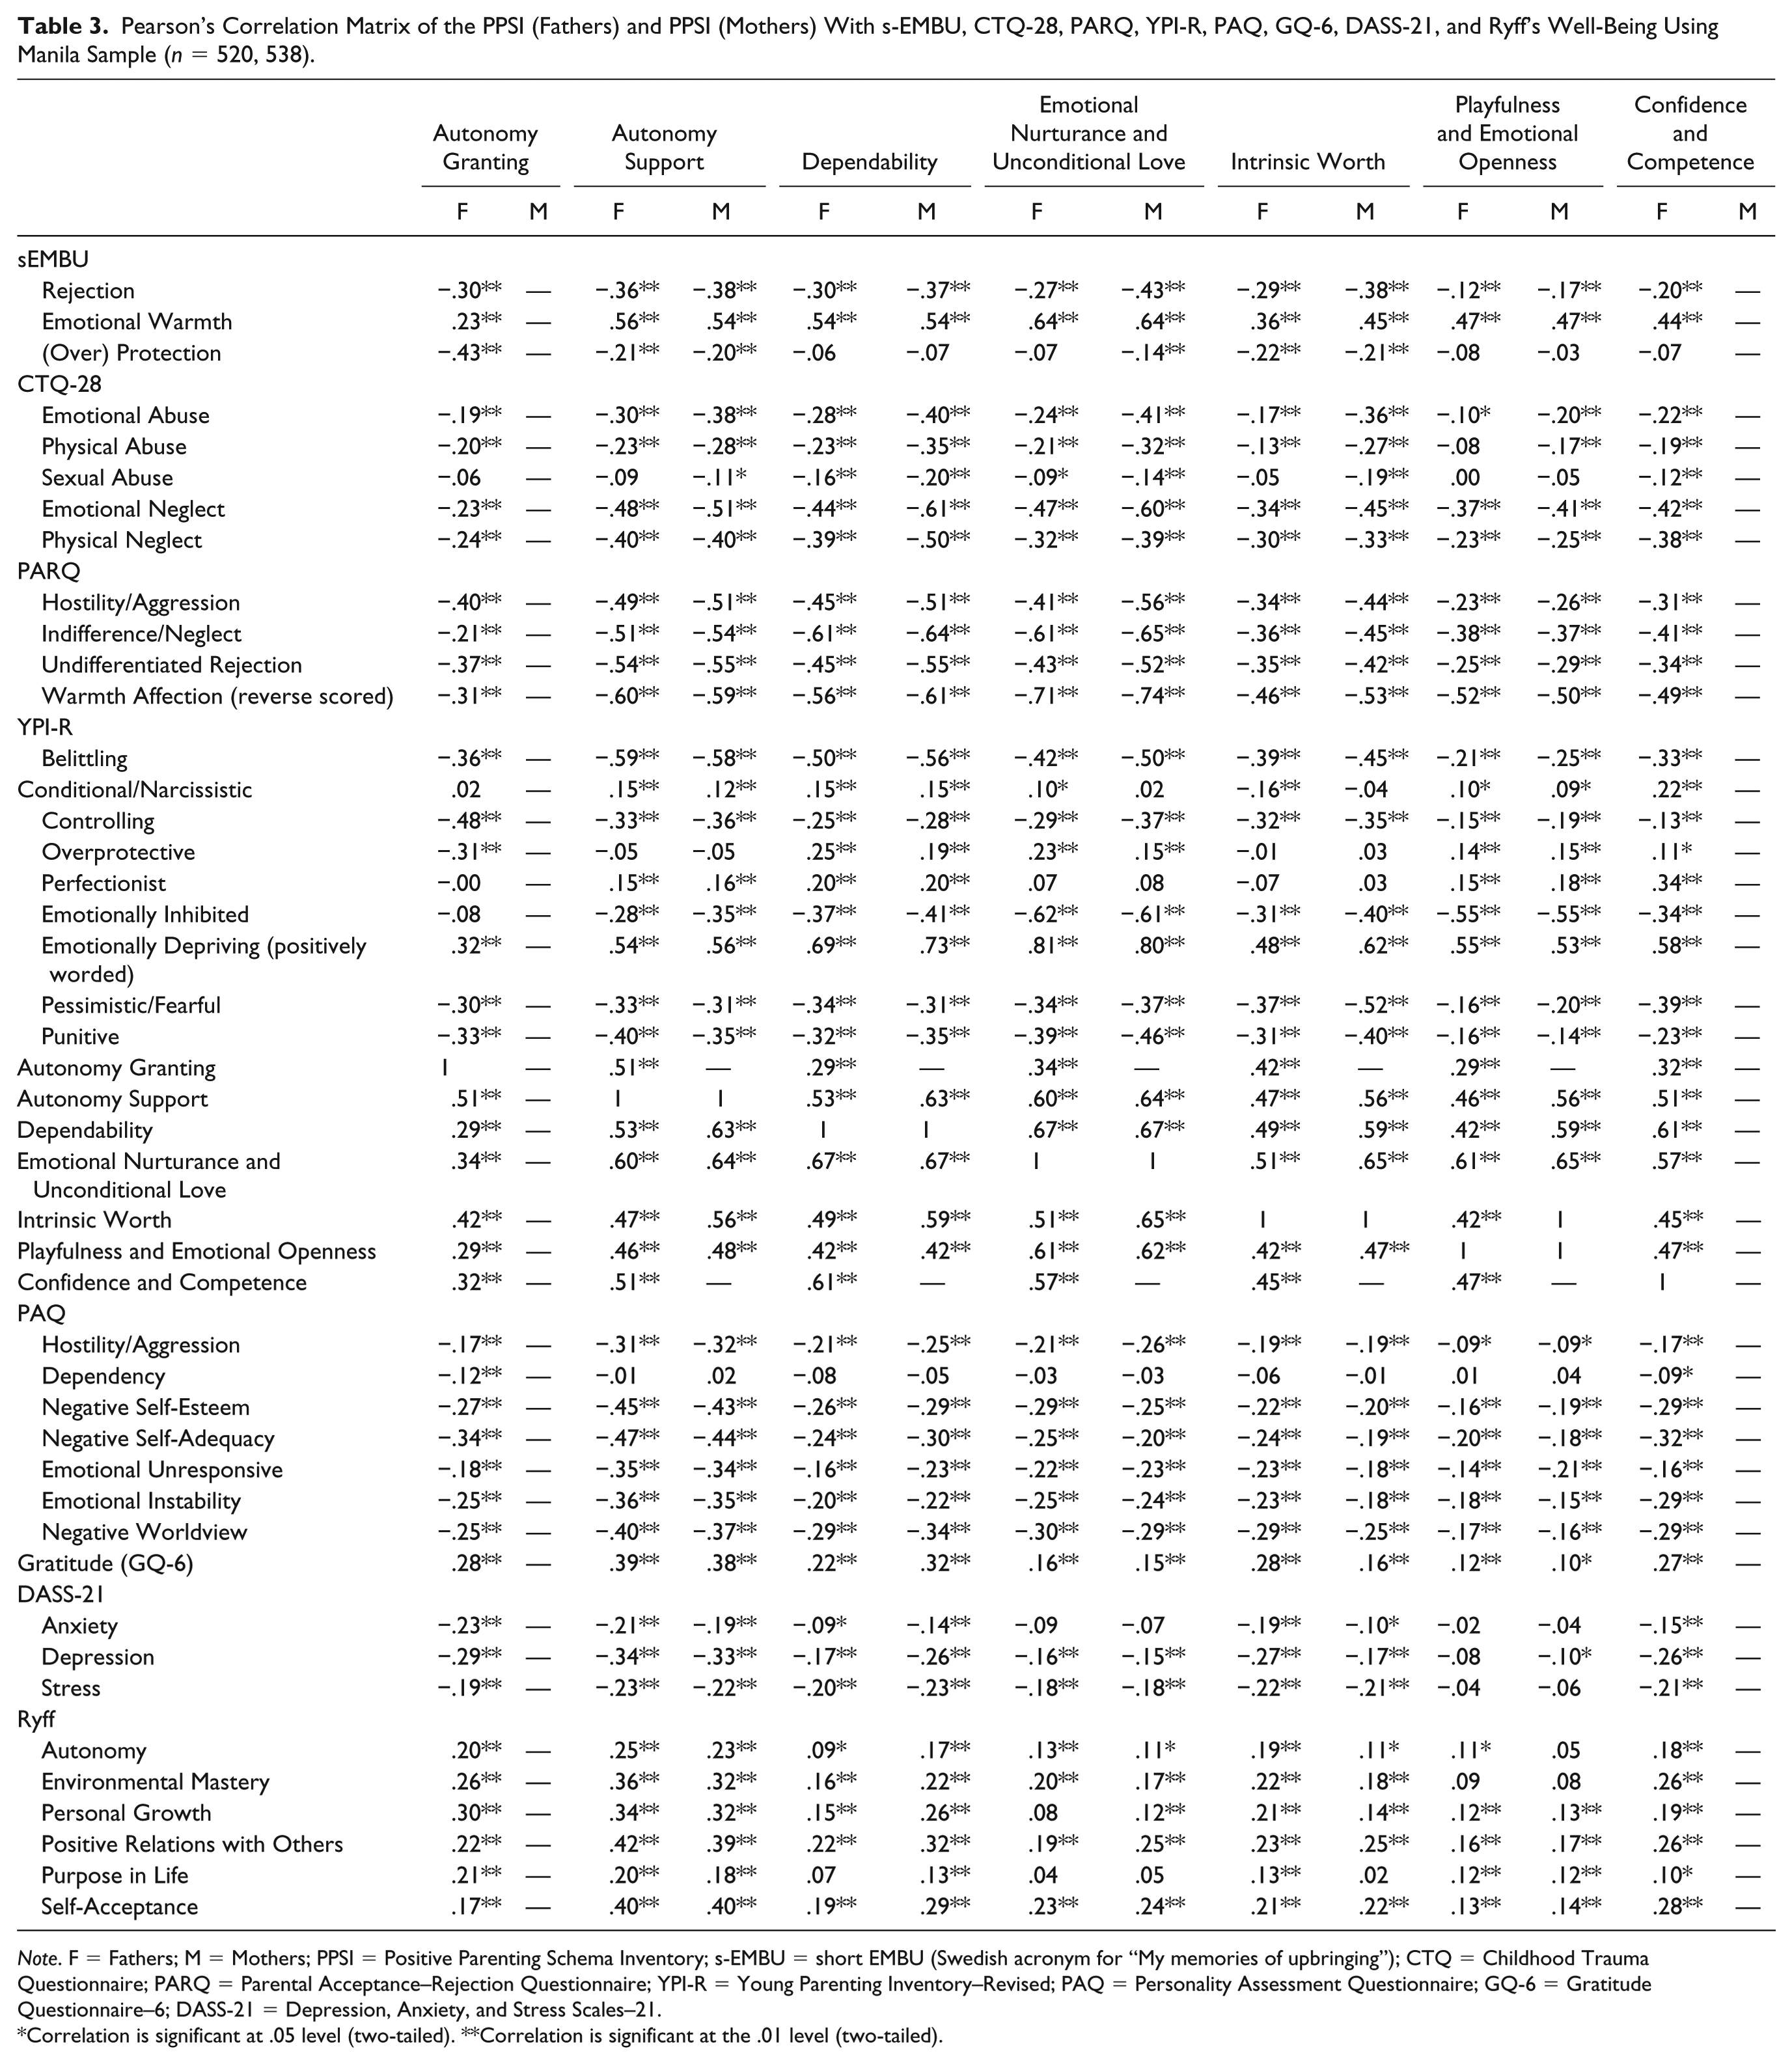
Note. F = Fathers; M = Mothers; PPSI = Positive Parenting Schema Inventory; s-EMBU = short EMBU (Swedish acronym for “My memories of upbringing”); CTQ = Childhood Trauma Questionnaire; PARQ = Parental Acceptance–Rejection Questionnaire; YPI-R = Young Parenting Inventory–Revised; PAQ = Personality Assessment Questionnaire; GQ-6 = Gratitude Questionnaire–6; DASS-21 = Depression, Anxiety, and Stress Scales–21.
Correlation is significant at .05 level (two-tailed). **Correlation is significant at the .01 level (two-tailed).
Evidence of Validity Based on Relations to Other Variables
The average statistically significant correlation values of the PPSI scale with the s-EMBU, CTQ, and PARQ were, |r| = .40, .31, and .47, respectively. As expected (see Table 3), subscales of Emotionally Nurturing and Unconditional Love from the ratings of both the fathers and mothers of the PPSI positively correlated with the Emotional Warmth scale of the s-EMBU, as well as negatively with the Warmth scale of the PARQ (reversed scored). Also as expected, the PPSI subscale of Autonomy Support that measures the dimension of “believe” had the highest negative correlations of moderate strength with subscales of Rejection and Warmth (reversed scored) from the PARQ, and Emotional Neglect with the CTQ, but positively with Warmth from the s-EMBU scale. Similarly, the Overprotection subscale of the s-EMBU correlated the highest and negatively in moderate strength with its most concordant subscale of Autonomy Granting of the PPSI (Fathers). Negative correlations with the nine YPI-R subscales were also shown in Table 3. As expected, the PPSI subscale of Autonomy Granting (PPSI) correlated most strongly with its most corresponding subscale of Controlling in the YPI-R. Likewise, the most concordant subscales of the PPSI correlated the strongest with their corresponding subscales of the YPI-R. We expected positive correlations between the Emotionally Nurturing subscales of the PPSI with Emotionally Depriving subscale of the YPI-R, and for this correlation to be >.8, as items for the latter were positively worded in the YPI-R, which meant it was essentially measuring a very similar construct to Emotional Nurturance and Unconditional Love in the PPSI. Confirming the expectations aforementioned, strong evidence of this validity was demonstrated by the PPSI (Fathers) and PPSI (Mothers) with these established parenting scales.
The average correlation values of the PPSI with PAQ, GQ-6, DASS-21, and Ryff’s scale were |r| = .26, .25, .21, and .22, respectively. All scales of the PPSI (Fathers) and PPSI (Mothers) had significant positive correlations with the GQ-6 and Ryff’s subscales and, as expected, had significant negative correlations with a measure of psychopathology (Emotional distress of the DASS-21) and the Negative Personality Dispositions subscales of the PAQ (see Table 3). Effect sizes for established parenting scales with other measures, such as depression, self-esteem, or personality constructs, are usually small. For example, results from the study by Arrindell et al. (1999) that validated the sEMBU resulted in average statistically significant effect sizes, |r| = .20, .19 and .22, for measures of neuroticism, extraversion and self-esteem, respectively. A recent study correlating the PARQ with internalizing measures in children (Putnick et al., 2015) again resulted in even smaller statistically significant effect sizes ranging from r = .06 to .14. Significant correlations between s-EMBU and measures of personality disorder symptoms and depression found by Thimm (2010) yielded r = .26, and .22, respectively. Furthermore, the effect sizes obtained for the PPSI scale with PAQ, DASS-21, and GQ-6 were similar to those from the established past parenting measures of the s-EMBU, CTQ, and PARQ.
We also chose to compare the PPSI with the YPI-R. Specifically, subscales of the PPSI that were less concordant with the theoretically associated subscales of the YPI-R correlated significantly less strongly than the correlations between the corresponding PPSI with YPI-R subscales that were most concordant. Given that for the most part, the differences were statistically significant, further evidence of this validity was demonstrated (see supplemental material, Tables S8 and S9). The average correlation (absolute values) for ratings of the fathers between subscales of the PPSI and those of the YPI-R2 that were most concordant was .58, and .24 for those that were less so. For the ratings of the mothers, the values were .65 and .26, respectively (see supplemental material, Table S10).
The values of skewness and kurtosis, and inspection of the Q–Q plot, showed that data for some of the dependent variables deviated from normality. However, given the large sample size over 200 (n = 520, 538 for this study) and a conservative p value (p < .001) for the regression models, the effects of nonnormality were not particularly serious (Statistics Solutions, 2013). Multiple hierarchical regression was conducted for 17 outcome variables: Gratitude, three subscales of DASS-21, all seven subscales of the PAQ, and all six subscales of the Ryff’s Scale of Psychological Well-Being. Results of this multiple hierarchical regression are shown in Table 4. For the PPSI (Fathers) and PPSI (Mothers), out of the 17 dependent variables, further evidence of validity in relations to other variables was demonstrated in 12 of them, since a minimum ΔR2 = .0225 (or 2.25%) that was statistically significant was achieved from the second to the third step of a regression analysis (Hunsley & Meyer, 2003). Out of the 12 dependent variables, 8 were highly statistically significant for PPSI (Fathers) and 9 for PPSI (Mothers).
Hierarchical Regression Analysis of the PPSI (Fathers) and PPSI (Mothers) Scales Predicting GQ-6, DASS-21, PAQ, and Ryff’s Well-Being Using Manila Sample (n = 520, 538).
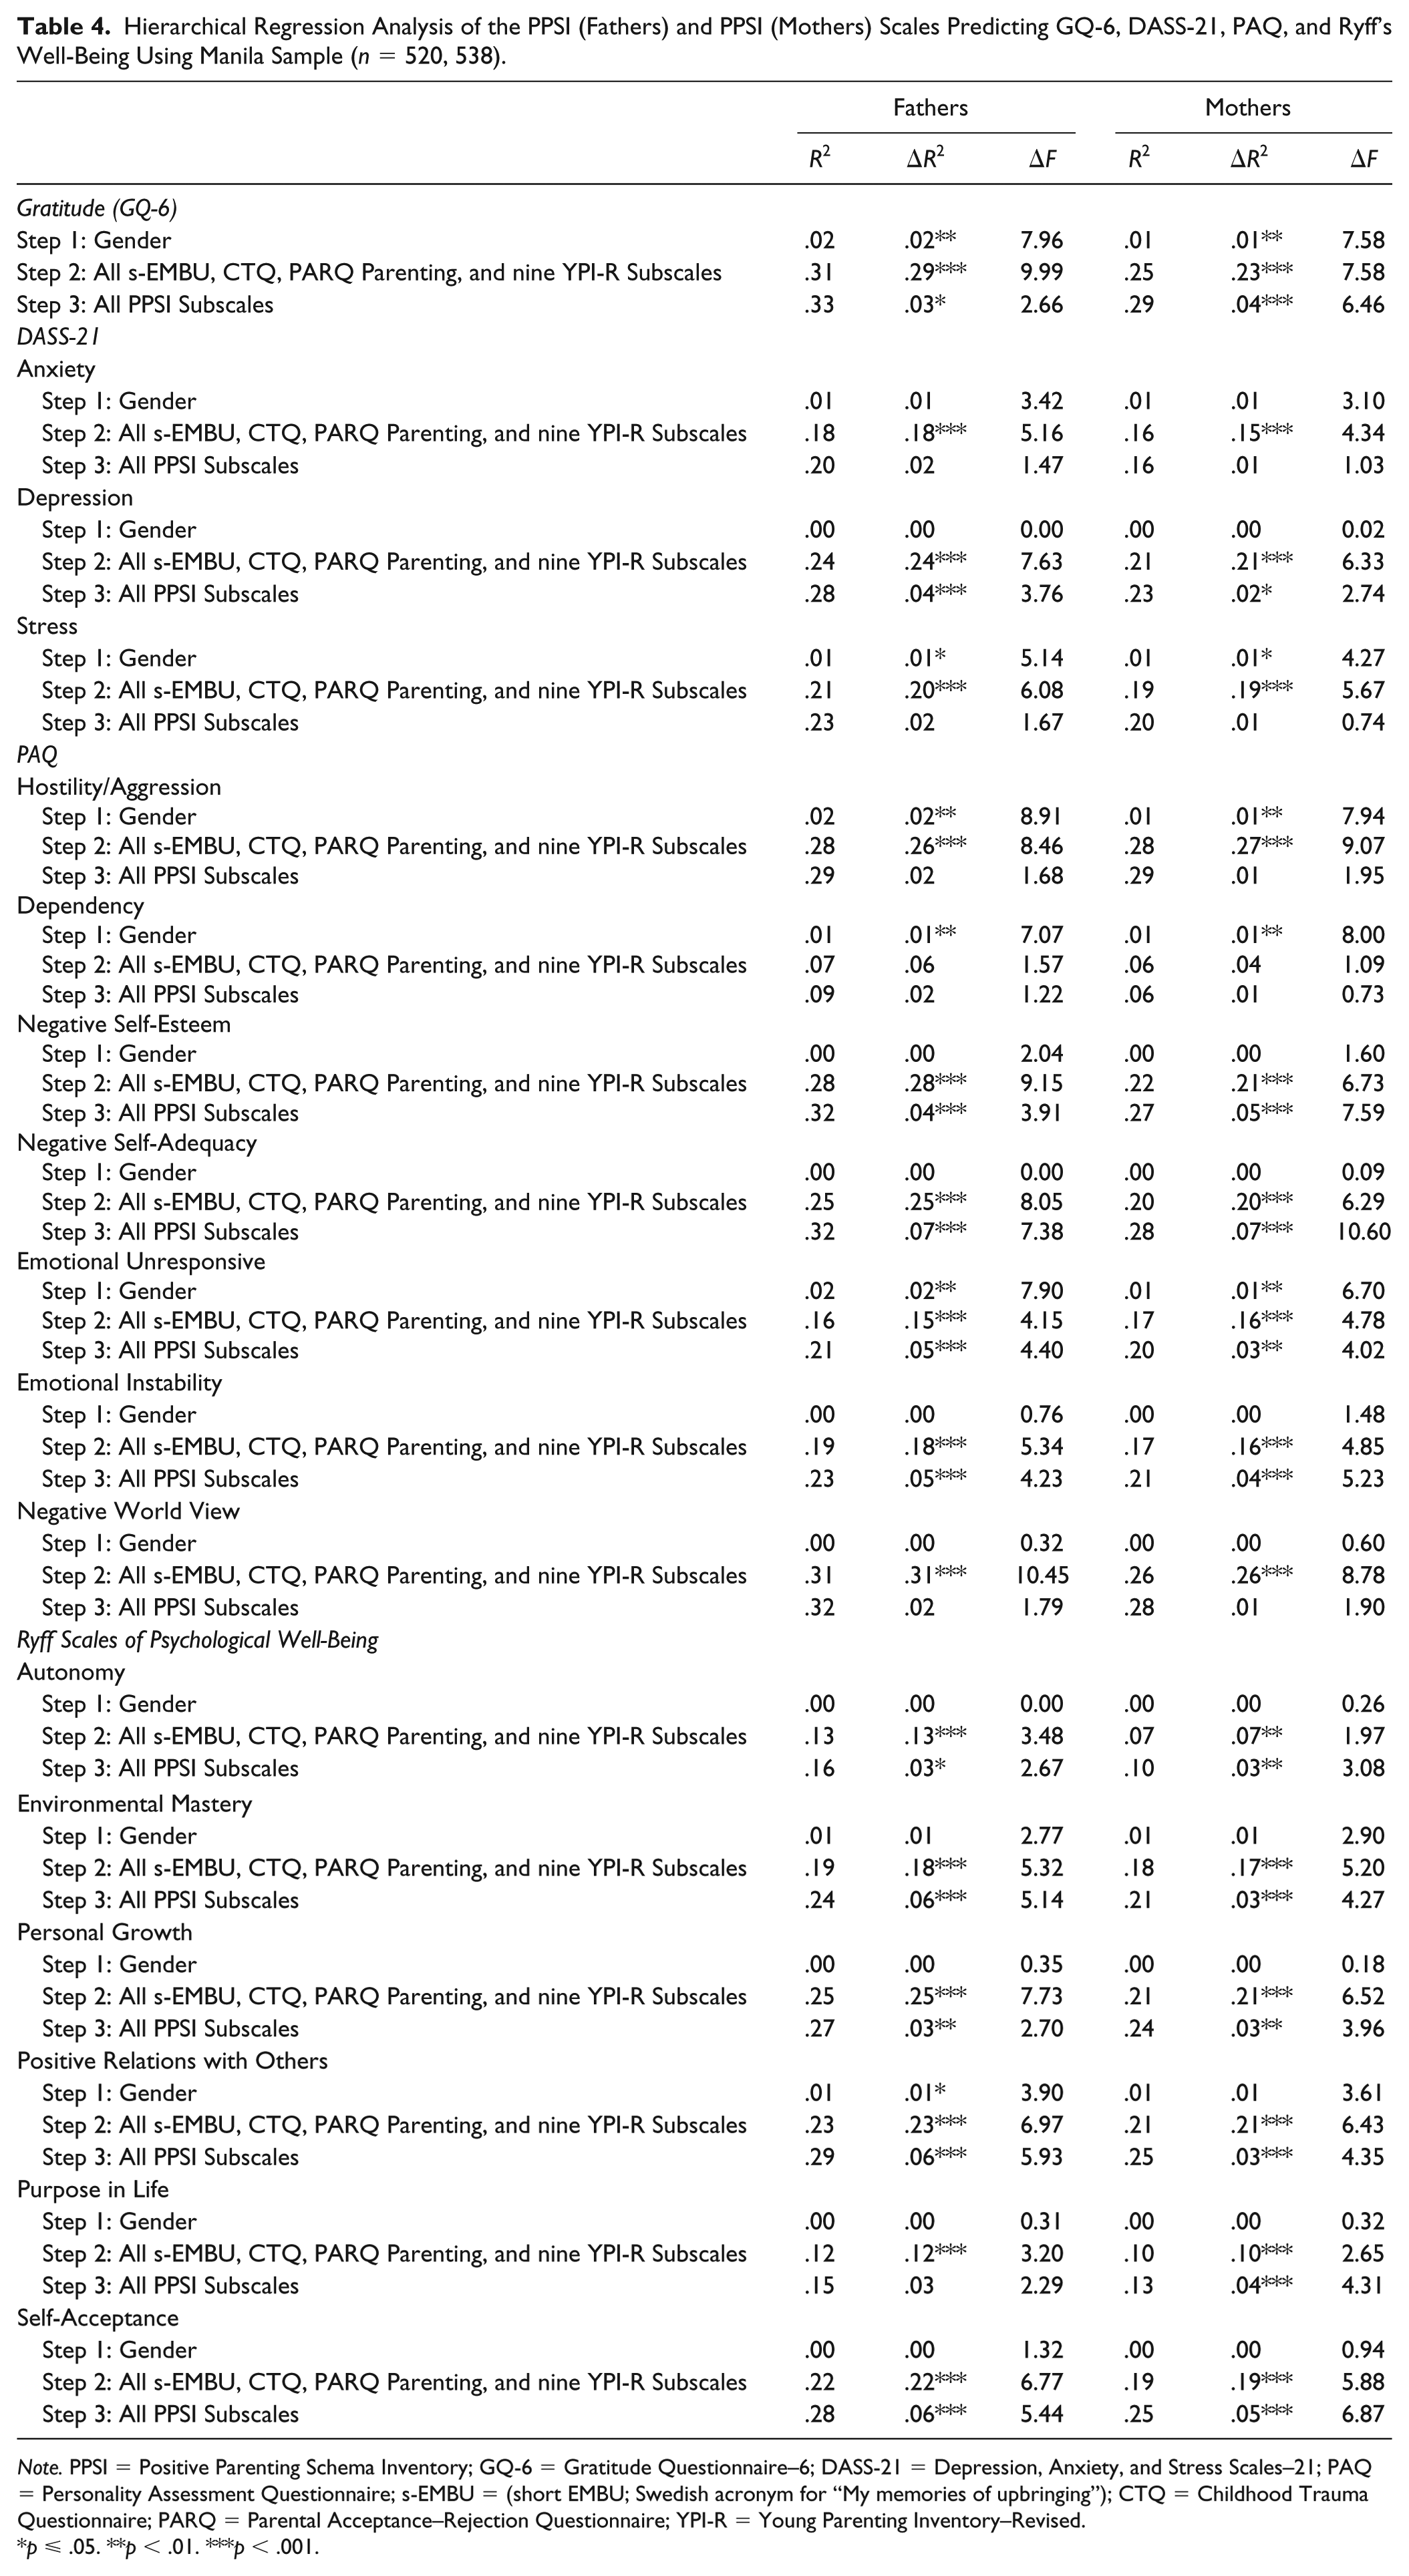
Note. PPSI = Positive Parenting Schema Inventory; GQ-6 = Gratitude Questionnaire–6; DASS-21 = Depression, Anxiety, and Stress Scales–21; PAQ = Personality Assessment Questionnaire; s-EMBU = (short EMBU; Swedish acronym for “My memories of upbringing”); CTQ = Childhood Trauma Questionnaire; PARQ = Parental Acceptance–Rejection Questionnaire; YPI-R = Young Parenting Inventory–Revised.
p ⩽ .05. **p < .01. ***p < .001.
Evidence of Validity for Consequences of Testing
Meaningful and significant positive correlations were found between the subscales of the PPSI (Fathers) and PPSI (Mothers) and EASs (positive schemas) measured by the YPSQ, with effect sizes from small to medium (see Table 5). For example, the PPSI Autonomy Granting subscale correlated most strongly with the EASs of Stable Attachment, Healthy Self-Reliance/Competence, Emotional Fulfillment, and Healthy Boundaries and Developed Self; the PPSI Autonomy Support subscale correlated most strongly with the EASs of Emotional Fulfillment, Stable Attachment, Social Belonging, Self-Directedness, Healthy Self-Reliance/Competence, and Self Compassion; the PPSI Dependability subscale correlated most strongly with the EASs of Stable Attachment, and Emotional Fulfillment; the PPSI Emotional Nurturance and Unconditional Love subscale correlated with the EASs of Emotional Fulfillment, and Social Belonging; the PPSI Intrinsic Worth subscale correlated most strongly with the EASs of Self Directedness, Stable Attachment, and Emotional Fulfillment; the PPSI Playfulness and Emotional Openness subscale correlated most strongly with the EAS of Emotional Openness and Spontaneity; and the PPSI Confidence and Competence subscale correlated most strongly with the EASs of Stable Attachment, Emotional Fulfillment, Basic Health and Safety/Optimism, and Healthy Self-Interest/Self-Care. Thus, evidence of this validity was demonstrated between PPSI (Fathers) and PPSI (Mothers) with EASs measured by the YPSQ. These effect sizes were similar to those from previous studies of past parenting patterns and EMSs (Sheffield et al., 2005; Thimm, 2010). It is also noteworthy that each PPSI subscale was statistically and significantly associated with several EASs, as was the case with negative parenting subscales of the YPI-R and EMSs (Sheffield et al., 2005). No one-to-one mapping was evident between each EAS and a corresponding PPSI subscale as hypothesized by Young (2005). Rather, several EASs were associated significantly with each subscale of the PPSI.
Pearson’s Correlation Matrix of the PPSI (Fathers) and PPSI (Mothers) With YPSQ (EASs, or Positive Schemas) Using the U.S. Sample (n = 204, 214).

Note. F = Fathers; M = Mothers; PPSI = Positive Parenting Schema Inventory; YPSQ = Young Positive Schema Questionnaire; EAS = Early Adaptive Schema.
Correlation is significant at .05 level (two-tailed). **Correlation is significant at the .01 level (2-tailed).
Discussion
The field of PCP has been developed to address both a longstanding imbalance within clinical psychology and a current lack of integration between the fields of clinical and positive psychology (Wood & Johnson, 2016; Wood & Tarrier, 2010). Clinical psychology has maintained a nearly exclusive focus on the amelioration of dysfunction. Although the field of positive psychology was developed as a counter to this, it has led to a discipline almost exclusively focused on the development of well-being for those who are functioning normally, or with relatively mild impairment, to the near exclusion of positive principles (Wood & Johnson, 2016). PCP makes an effort to draw equally and integratively from the vantage points of clinical and positive psychology in developing constructs and strategies that most effectively address suffering along the full spectrum of dysfunction (Johnson & Wood, 2017).
In line with the general focus of clinical psychology, numerous studies have shown the impact of negative parenting on children (e.g., Hasebe, Nucci, & Nucci, 2004; Pomerantz & Wang, 2009). It has only been more recently that research has begun to explore the processes and outcomes associated with positive parenting (Clark & Ladd, 2000; Dallaire et al., 2006). Somewhat surprisingly, these studies suggest that negative and positive parenting constructs are orthogonal, with each making its own unique contribution to a child’s development (Dallaire et al., 2006; Keyfitz, Lumley, Hennig, & Dozois, 2013). This further underscores the need for inclusion of positive constructs, since their presence is not implied, as many have assumed, by the absence of negative constructs. Over the past 70 years, positive parenting constructs in established instruments were generally centered on the dimensions of warmth and control. The development of the PPSI, in contrast, was based on a unique theoretical model from ST in which seven positive parenting constructs emerged to complement its counterpart, the YPI. Given the complexity of childhood development at different developmental phases, it seems likely that a model such as this that goes beyond the few broad dimensions, and provides a more complete and nuanced framework, would also help both therapists and parents.
The very low missing values showed that the vast majority of the participants in all three samples were engaged and that they comprehended the meaning of these questions and responded appropriately. This provided some evidence of validity based on response processes. Evidence of validity based on test content was shown by the 50 items for each of the seven subscales. Items under each subscale showed variability but also measured the same construct evidenced by the good reliability values of coefficient omega and Cronbach’s alpha. The PPSI demonstrated evidence of validity based on the relations to other variables through statistically significant moderate correlations with other established parenting scales. A moderate level of strength showed that although constructs were similar, they also measured different facets of the broader dimensions under consideration. For further evidence based on the relations to other variables, all of the scales of the PPSI (Fathers) and PPSI (Mothers) correlated significantly and in the negative direction with three subscales of emotional distress (DASS-21), and negative personality dispositions (PAQ). Most of the PPSI (Fathers) and PPSI (Mothers) also correlated positively with subscales measuring positive well-being (Ryff’s Psychological Scale) and the positive trait of gratitude (GQ-6 scale). As expected, correlations were from low to moderate. Evidence of this validity was also demonstrated, for the most part, of statistically significant differences between subscales of PPSI and YPI-R (both Fathers and Mothers) that correlated the highest with ones that correlated less strongly. The unique contribution of the PPSI, from multiple hierarchical regressions, also supported evidence of this validity, considering that the YPI-R with nine subscales was used, in addition to three other established parenting measures (s-EMBU, CTQ, and PARQ). This also showed that the more nuanced PPSI subscales were able to measure statistically significant variance over and above that measured by the more broader parenting constructs from these established parenting measures.
As for evidence of validity for consequences of testing, significant and meaningful correlations were also shown between positive schemas measured by the YPSQ and subscales of the PPSI for ratings of fathers and mothers in the U.S. sample. As with EMSs (Sheffield et al., 2005; Thimm, 2010), this association with EASs in adults suggests that past positive parenting patterns play a significant role and are associated with EASs. MGCFA analysis, considered the most powerful approach for testing invariance (Milfont & Fischer, 2010), showed invariance of the factor structure of the PPSI across Eastern and Western samples, giving evidence of validity based on internal structure. This testing is significant because it showed that participants of different samples, both Eastern and Western, ascribe the same meanings to scale items and that the same psychological constructs were measured in both samples. This provided some cross-cultural support for positive parenting patterns, and provided further evidence based on response processes. Therefore, the five types of validity evidence outlined in the Standards for Educational and Psychological Testing (American Educational Research Association, American Psychological Association, & National Council on Measurement in Education, 2014) were demonstrated. The PPSI can now be used in tandem with the negative version of this scale, the YPI-R or YPI, to provide a means of measuring the full spectrum of past parenting behavior, especially to those practicing ST.
One of the limitations of this study was that, as is the case with all regression-based tests to demonstrate evidence of validity in relations to other variables, the amount of extra variance explained in our models would represent a mixture of unique variance and error (scale method effects). Incorporating future multitrait multi measurement designs (Eid et al., 2008) into future studies would be optimum, although this would be difficult to implement in practice due to only one measure being available for most constructs and the difficulty assessing the constructs in ways other than self-report. Another limitation was that the incentive of a workshop likely drew those who had an interest in this subject, which may have limited generalizability to this population.
A measure of well-being is often thought of in terms of the reduction of unhealthy parent–child dynamics. While negative effects of unhealthy parenting patterns affects children in both Eastern and Western cultures (Amato & Fowler, 2004; Hasebe et al., 2004; Pomerantz & Wang, 2009), results from this study showed that early positive parenting patterns, regardless of culture, are associated with positive outcomes that also carry into adulthood. Furthermore, results underscore that the absence of negative parenting patterns does not necessarily imply the presence of positive ones. The lack of positive patterns in families that are relatively void of negative ones can also inflict harm and impair healthy development, as seen by the correlations of the PPSI from this study with measures of emotional distress and well-being. These results show the need for positive parenting patterns to be emphasized in families from both the West and the East. Many of the positive patterns that were identified in this study seem to transcend culture. Eastern cultures being less supportive of positive verbal expression and more supportive of silence than Western ones has often been viewed as culturally relative to the point that this practice could be seen as serving a child well in the East but not in the West. Although there may be ways in which this is true, from the vantage point of the measures used in this study, parenting that encourages affection, warmth, and openness, and that does not discourage freedom of expression, correlates positively to developmental outcomes in both cultures. Another important emphasis is the contribution made by fathers. For many years, mothers were seen as the most crucial primary caregiver, and fathers took a back seat when it came to parenting. The need for fathers’ involvement is an ongoing issue and has been the target for intervention by many initiatives. The results of this present study confirm that of others (e.g., McBride, Schoppe, & Rane, 2004; Yogman, Garfield, & Committee on Psychosocial Aspects of Child and Family Health, 2016) in underscoring the role of fathers, as subscales derived from the PPSI for the ratings of fathers correlated with psychopathology just as they did for mothers. This suggests that the role of fathers is as important as that of mothers. The PPSI scale is, therefore, an important step toward increasing the depth and breadth of our understanding of aspects of adaptive parenting that may prove to be universal and holds promise as a significant contribution to the repertoire of available positive parenting measures.
Supplemental Material
0825_FINAL_ASMNT_SUPP_Devt_Validation_of_PPSI – Supplemental material for Development and Validation of the Positive Parenting Schema Inventory (PPSI) to Complement the Young Parenting Inventory (YPI) for Schema Therapy (ST)
Supplemental material, 0825_FINAL_ASMNT_SUPP_Devt_Validation_of_PPSI for Development and Validation of the Positive Parenting Schema Inventory (PPSI) to Complement the Young Parenting Inventory (YPI) for Schema Therapy (ST) by John P. Louis, Alex M. Wood and George Lockwood in Assessment
Footnotes
Declaration of Conflicting Interests
The author(s) declared the following potential conflicts of interest with respect to the research, authorship, and/or publication of this article: John P. Louis receives revenues from his parenting program that is taught, and books sold, worldwide. Alex M. Wood and George Lockwood declare that they have no conflict of interest.
Funding
The author(s) received no financial support for the research, authorship, and/or publication of this article.
References
Supplementary Material
Please find the following supplemental material available below.
For Open Access articles published under a Creative Commons License, all supplemental material carries the same license as the article it is associated with.
For non-Open Access articles published, all supplemental material carries a non-exclusive license, and permission requests for re-use of supplemental material or any part of supplemental material shall be sent directly to the copyright owner as specified in the copyright notice associated with the article.