
Abstract
Psychometrically sound tests of intellectual ability are indispensable for research and assessment of children with autism spectrum disorder (ASD), yet few tests have been validated for use with this population. The Merrill–Palmer–Revised Scales of Development (M-P-R) is a standardized test of intellectual ability that was validated for use with typically developing preschoolers. The current study’s aim was to investigate the criterion validity of the M-P-R for assessing cognitive skills in preschoolers with ASD (N = 180). Good concurrent validity was demonstrated, with a large positive correlation between the M-P-R Receptive Language domain and the PLS-4 Auditory Comprehension subscale. The Cognitive domain of the M-P-R showed a medium positive correlation with later WISC-4 scores, showing acceptable predictive validity. Cognitive strengths and weaknesses assessed using the M-P-R mirrored those described for other measures, with most children obtaining higher standard scores on the Cognitive than the Receptive Language domain. An exploratory factor analysis suggested that one factor accounted for the majority of variability in M-P-R domains.
Autism spectrum disorder (ASD) is a neurodevelopmental disorder characterized by differences in social communication skills and the presence of repetitive or inflexible patterns of behavior or interests (American Psychiatric Association [APA], 2013). The rate of community-based diagnoses of ASD is increasing, now exceeding 1% of the population (APA, 2013; Elsabbagh et al., 2012). Cognitive assessments are part of best practice diagnostic evaluation for children suspected of having ASD (APA, 2013). Such tests provide important prognostic information (Howlin, Savage, Moss, Tempier, & Rutter, 2014) and allow for the evaluation of possible concurrent intellectual disability (present in as many as one third of people with ASD; Centers for Disease Control and Prevention, 2014; Flanagan et al., 2015). Assessing cognition in children with ASD may also help with aspects of service planning (e.g., eligibility for services for individuals with developmental disabilities). Despite the important uses of cognitive tests for young children with ASD, however, few tests have been validated for use with this population (Klinger, O’Kelley, & Mussey, 2009).
The Merrill–Palmer–Revised Scales of Development
The Merrill–Palmer–Revised Scales of Development (M-P-R) is a standardized measure designed to assess cognitive skills in children between 1 and 78 months of age (Roid & Sampers, 2004). It contains concrete test stimuli (i.e., toys, puzzles) that are appealing to many young children with ASD. Unlike some broadly used measures of cognition for preschool-aged children (e.g., Wechsler Preschool and Primary Scale of Intelligence–Fourth Edition [WPPSI-IV], Wechsler, 2012; Stanford–Binet Intelligence Scales, Fifth Edition, SB-5, Roid, 2003), the M-P-R relies minimally on children’s language skills when assessing nonverbal intelligence quotient (IQ) (i.e., language-reduced IQ estimates), such that use of the M-P-R could help obviate the common underestimation of nonverbal IQ in preschoolers with ASD (Klinger et al., 2009). Furthermore, unlike many commonly used cognitive tests (e.g., WPPSI-III; SB-5) the M-P-R relies on cumulative rather than consecutive errors to determine when to end testing, thereby shortening testing time and potentially minimizing frustration among test-takers.
Other measures of cognition that do not require advanced language skills (e.g., Bayley Scales of Infant Development–Third Edition [BSID], Bayley, 2005; Differential Ability Scales, Second Edition [DAS-2], Elliot, 2007; Mullen Scales of Early Learning [MSEL], Mullen, 1995; Leiter International Performance Scale–Third Edition [Leiter-3], Roid, Miller, Pomplun, & Koch, 2013) may fall short of assessing the span of intellectual functioning that characterizes preschool-aged children with ASD (Klinger et al., 2009). For example, many children with ASD achieve the lowest possible standard score on the MSEL (49 vs. 10 on the M-P-R; Akshoomoff, 2006); the BSID does not offer norms for children older than 3 years; the DAS-2 was not standardized for children younger than 30 months; and the Leiter-3 was not standardized with children younger than 36 months.
The M-P-R was validated by its developers in a small sample of 14 children with ASD from 36 to 75 months old who were compared with children with cognitive, speech, and motor delays as well as with premature infants and children with auditory impairments (ns ranged from 14 to 39). The mean Developmental Index (DI; analogous to IQ) for children with ASD was lower than scores in all groups other than children with cognitive delays (Roid & Sampers, 2004).
Steiman, Tsonis, Lazoff, Tidmarsh, and Fombonne (2007) tested 41 2- to 3-year-olds with ASD using the MSEL and the M-P-R. Scores on the MSEL were higher on average than on the M-P-R, perhaps because the lowest possible standard score on the M-P-R is 10, whereas the lowest score on the MSEL is 49. Despite this difference, 66% of children (27/41) received the same cognitive classification (i.e., M-P-R classification categories: below average, mild delay, moderate to severe delay) on each measure.
Peters (2013) compared scores on the M-P-R for a group of 50 children with ASD (aged 40-78 months) to an age-matched group of 80 typically developing children. Children with Asperger’s disorder (APA, 2000) were excluded; thus, this study does not span the full range of symptomatology or functioning of children with ASD as currently defined (APA, 2013). To assess construct validity, Peters (2013) calculated a 2 (age: younger versus older children) × 2 (clinical diagnosis: ASD vs. typically developing) × 7 (domains and indices of the M-P-R) multivariate factorial analysis of variance. Children with ASD scored lower on average than typically developing controls on all M-P-R subtests. Peters’s (2013) study also provides preliminary evidence supporting the internal consistency of the scales (Cronbach’s alpha coefficients ranged from .95 to .99). Notable limitations of the use of Cronbach’s alpha coefficients, especially when analyzing internal consistency within large item sets, are beyond the scope of this article, but see Raykov (1997) and Raykov, Dimitrov, and Asparouhov (2010) for more details. To assess discriminant validity of the M-P-R, correlations among domains were calculated (Peters, 2013). Domains were more strongly correlated in children with ASD than in typically developing children, suggesting lower discriminant validity between M-P-R domains when assessing children with ASD than typically developing children. Steiman et al. (2007) also calculated correlations among M-P-R domains in younger preschoolers with ASD, and found that most correlations were weaker than those reported by Peters (2013).
Peters (2013) and Steiman et al. (2007) offered initial evidence in support of the validity and reliability of the M-P-R for assessing cognition in preschoolers with ASD. The M-P-R also has face validity for assessing cognition in this population, given its minimal reliance on verbal skills, appealing concrete test materials, and cumulative stop rules. Further examination of the instrument is therefore warranted to validate it for assessing cognition in preschoolers with ASD.
The current study builds on previous research by examining the psychometric properties of the M-P-R in a larger, more representative sample of children with ASD. Furthermore, to the authors’ knowledge, this is the first study to assess the predictive validity of the M-P-R DI among children with ASD (see Alcantud & Alonso, 2016, for evidence of the M-P-R’s predictive validity in typically developing children). Finally, our approach to psychometric analysis using Bayesian statistical methods is novel and allowed us to model missing data in our analysis.
Discriminant Validity
Past research with relatively small samples remains inconclusive about the discriminant validity of the M-P-R domains. The current study assessed the strength of correlations among M-P-R domains in a larger number of preschoolers with ASD.
Concurrent Validity
We predicted that standard scores of children with ASD would be lower than those of the normative typically developing sample given the high comorbidity of intellectual disability and ASD. Furthermore, we predicted that the M-P-R Receptive Language scale scores would show large positive correlations with the Auditory Comprehension subscale of the Preschool Language Scale–Fourth Edition (PLS-4; Zimmerman, Steiner, & Pond, 2002). Given that M-P-R Receptive Language scale scores have a lower floor than PLS-4 Auditory Comprehension scores, we predicted weaker correlations between the two measures for children with lower M-P-R DIs than for children with higher DIs.
Predictive Validity
We predicted that M-P-R DIs would be positively correlated with Wechsler Intelligence Scale for Children–Fourth Edition (WISC-IV; Wechsler, 2003) IQs measured 6 years later. However, we did not expect this correlation to be large, given the variable trajectories of cognitive skills among preschoolers with ASD (Charman, Taylor, Drew, Cockerill, & Baird, 2005).
Cognitive Profiles
The concurrent validity of the M-P-R scales can be further evidenced if the profiles of cognitive strengths and weaknesses of children with ASD measured using the M-P-R mirror those obtained with other validated measures. Coolican, Bryson, and Zwaigenbaum (2008) investigated cognitive profiles on the SB-5 (Roid, 2003) in a sample of 63 3- to 16-year-olds with ASD. Overall, nonverbal IQ was greater than verbal IQ at the group level. A nonverbal IQ advantage has also been found in preschoolers with ASD when measured with the MSEL, the DAS (Elliott, Murray, & Pearson, 1990), and the WISC-III (Mouga et al., 2016). Mayes and Calhoun (2003) also found a nonverbal advantage on the WISC-III in a sample of 164 3- to 15-year-olds with Diagnostic and Statistical Manual of Mental Disorders–Fourth Edition (DSM-IV) diagnoses of autistic disorder. In that study, the mean difference between verbal IQ and nonverbal IQ was lower in older children. Finally, Volden et al. (2011) compared receptive versus expressive language skills measured using the PLS-4 in a large cohort of preschoolers with ASD that included the current sample. The researchers showed that, whereas expressive language skills exceeded receptive language skills in preschoolers with ASD with relatively low mental ages (measured using the M-P-R), the discrepancy between the two skills narrowed in children with greater mental ages, suggesting higher receptive language skills at higher levels of nonverbal cognitive functioning.
With its emphasis on assessing young children and those with limited expressive language skills, the M-P-R does not include a verbal IQ domain. The Receptive Language domain, which we used as a limited proxy for verbal IQ, measures the ability to understand and follow spoken directions and provide nonverbal responses to verbal questions. The Cognitive domain of the M-P-R offers a metric of nonverbal IQ. We predicted that children with ASD in our sample would have higher nonverbal IQ (M-P-R Cognitive domain) than Receptive Language scores (M-P-R Receptive Language domain) at the group level. Older children with ASD and children with relatively high DIs were expected to have relatively higher Receptive Language than nonverbal IQ, compared with younger children and children with lower DIs, who were expected to have relatively higher non-verbal IQ than Receptive Language scores (Volden et al., 2011).
Method
Sample
We examined the psychometric properties of the M-P-R using multicohort accelerated longitudinal data from a large, well-characterized sample of children with ASD (n = 421; mean age = 39.87 months, SD = 9.00 months; 85% boys; Pathways in ASD study; Szatmari et al., 2015). Models using all children failed posterior predictive checks, and investigation revealed that this failure was attributable to children with missing WISC-IV scores differing from the remainder. As such, our final model included only children for whom WISC-IV scores were available. For these children (n = 180), mean age at study entry was 41.00 months (SD = 8.58 months, ranging from 24.20 to 60.00 months); mean age when completing the M-P-R was 42.20 months (SD = 8.99 months, ranging from 24.10 to 61.70 months). Our final sample consisted of 86% boys. Mean autism symptom severity at study entry, measured using the Social Responsiveness Scale (Constantino & Gruber, 2002), was in the moderate range (75.10, SD = 13.14; range: 49-106).
Participants were recruited through five regional ASD referral centers across Canada. Inclusion criteria were the following: (1) diagnosis of ASD within the preceding 4 months; (2) chronological age between 2 years, 0 months and 5 years, 0 months; (3) absence of cerebral palsy or other neuromotor disorders; and (4) absence of known genetic or chromosomal abnormalities or severe visual or hearing impairment. Assessments typically took place in university clinics, hospitals, or research centers, with some in children’s homes or childcare centers. Cognitive measures were administered as part of a larger battery by trained and supervised research psychometrists or graduate students.
Measures
Merrill–Palmer–Revised Scales of Development
The M-P-R is an individually administered cognitive assessment instrument (Roid & Sampers, 2004). The M-P-R item set was standardized based on a representative sample of over 1,000 1- to 78-month-old American children. The M-P-R provides a DI (similar to full-scale IQ [FSIQ]) composed of domains measuring cognition, receptive language, and fine motor skills, with supplementary scores for memory, processing speed, and visual-motor ability. Additional domains assessing self-help and social emotional skills were not administered. The Pathways in ASD study investigators made several a priori decisions to accommodate the administration of the M-P-R for young children with a range of ASD symptom severity; see Appendix A for a summary of these protocols.
Preschool Language Scale–Fourth Edition
The PLS-4 (Zimmerman et al., 2002) was used to assess language abilities. This test is a widely used, individually administered measure designed to detect language delays in young children. It is also norm-referenced and provides standard scores. This test has demonstrated high interrater reliability (average 99% agreement between pairs of trained raters; Zimmerman & Castilleja, 2005). It also has high content (Zimmerman et al., 2002) and criterion validity (Zimmerman & Castilleja, 2005), and has been validated for use with children with ASD (Volden et al., 2011).
Wechsler Intelligence Scale for Children–Fourth Edition
The WISC-IV (Wechsler, 2003) was used to assess participants’ intellectual abilities at age 8 to 9 years. The WISC-IV is a widely used, individually administered, standardized measure designed to assess cognitive abilities in children aged 6 to 16 years. It is norm-referenced and provides standard scores for FSIQ and four core indices (Verbal Comprehension Index, Perceptual Reasoning Index, Working Memory Index, and Processing Speed Index). It has excellent interrater reliability for FSIQ (r = .97; Wechsler, 2003), and good construct validity (Weiss, Keith, Zhu, & Chen, 2013). The WISC-IV has been widely used and validated with children with ASD (Montgomery, Dyke, & Schwean, 2008).
Data Analysis
Bayesian parameter estimation methods were employed using R (R Development Core Team, 2016) and Stan (Stan Development Team, 2017a, 2017b, 2017c). See Supplementary Appendices A and B for R syntax and Supplementary Appendices C and D for Stan syntax (available in the online version of the article). Bayesian methods provide several advantages in analysis of psychometric measurement data; for example, helping obviate reliance on the sampling distribution and to define the distribution of parameter estimates based on the posterior distribution (Dienes, 2011; Kruschke, 2011; see review by Van De Schoot, Winter, Ryan, Zondervan-Zwijnenburg, & Depaoli, 2017.) We were also motivated by advantages of Bayesian credible intervals over frequentist confidence intervals (Kruschke & Liddell, 2017). Frequentist confidence intervals offer a range expected to include the population parameter in a set proportion of replications. In contrast, Bayesian credible intervals provide a range of probable values of a parameter given the data and prior beliefs about the parameter. It follows that credible intervals permit probabilistic statements regarding relative degrees of plausibility of a range of values for a population parameter. From a more practical perspective, Bayesian models can accommodate missing data (Gelman et al., 2014), which allowed us to maximize information from our present data used in parameter estimation.
Missing Data
Missing M-P-R data (n = 30) were due to (a) behavioral challenges or noncompliance (n = 5); (b) families who withdrew from the study or missed an assessment session (n = 21); (c) cognitive ability that was too low to establish a basal (n = 2); or (d) cognitive ability that was too high to establish a ceiling (n = 2). WISC-IV FSIQ data were missing due to similar reasons (n = 235). Data were unavailable on the PLS-4 for 34 children for similar reasons, as well as the unmet need for a French version (n = 5). All participants who were missing WISC-IV scores were omitted from analysis due to poor posterior predictive checks when these data were included in models. Missing PLS and M-P-R data were imputed as described below.
Preliminary Analyses
Means and standard deviations of standard scores were calculated for each domain of the M-P-R Cognitive Battery (i.e., DI, Cognitive, Fine Motor, Receptive Language, Memory, Speed, and Visual Motor domains) and for the PLS-4 Auditory Comprehension subscale. Means and standard deviations of WISC-IV standard scores when the children were aged 8 to 9 years are reported. For descriptive purposes, cognitive advantage groups (nonverbal, verbal, no advantage) were derived using the M-P-R manual’s criteria for significant differences between domains.
Main Analyses
Standard scores were used in all cases because of their clinical relevance and interpretability. Standard scores from all scales were modeled as multivariate normal, permitting missing data imputation on both truly missing scores as well as those scores reflecting the minimum measurable score for a given subscale. Truly missing scores were provided a broad prior distribution (normal with a mean of 100 and standard deviation of 100), whereas minimum measurable scores were provided the same prior bounded with a maximum of the corresponding scale’s minimum measurable value. By this bounded imputation, we provide the model with the information that participants achieving the minimum measurable score might actually have a lower true score if the corresponding scale were able to measure even lower scores. Prior distributions for the population mean score for each scale were similarly broad (normal with a mean of 100 and standard deviation of 100) as were priors for the population standard deviation for each scale (Weibull with a mode of 30 and scale of 40); a uniform prior was used for the correlations among the scales. We used broad priors because of unknown population parameters, conveying great enough uncertainty that small shifts in the modes would be unlikely to change our results. Following procedures outlined by Depaoli and van de Schoot (2017), we tested the sensitivity of our model’s priors by adding greater uncertainty and found only minor shifts in our results that did not alter our conclusions. See Supplementary Appendix E (available in the online version of the article) for Stan code for our sensitivity check.
To assess the hypothesis that M-P-R scores would be lower than those of children in the typically developing normative sample, we report estimated credible intervals and medians of the posterior distributions of the means for each M-P-R domain and the DI. To assess the discriminant validity of the M-P-R, we report correlations among M-P-R domains. To assess our predictive validity hypothesis, we report the correlation between the M-P-R DI and WISC FSIQ scores at age 8 to 9 years. We compared the value of the standard scores ascertained using the respective instruments by computing the difference between the posterior distribution means of the M-P-R DI and WISC-IV FSIQ.
A linear regression model was used to ascertain how M-P-R DI, PLS-4 Auditory Comprehension subscale, and their interaction might predict M-P-R Receptive language (M-P-R Receptive language ~ intercept + PLS-4 Auditory Comprehension + M-P-R DI + PLS-4 Auditory Comprehension × M-P-R DI). We assessed the difference in scores ascertained using these two measures by computing the difference between the posterior distribution means of the Receptive Language domain M-P-R and the Auditory Comprehension subscale of the PLS-4.
We also used linear regression to ascertain how M-P-R DI, age, and their interaction might predict the difference between the M-P-R Receptive Language scale and the M-P-R Cognitive domain scale (M-P-R Receptive Language domain minus M-P-R Cognitive domain ~ intercept + age + M-P-R DI + age x M-P-R DI). Higher difference values indicate a receptive language advantage and lower values suggest a nonverbal IQ advantage. All regression coefficients were provided broad priors (normal with mean of 0 and standard deviation of 10), as were noise terms in both regressions (Weibull with a mode of 30 and scale of 40) and intercepts (normal with mean of 0 and standard deviation of 100).
Sampling was achieved by four independent chains of 2,000 iterations, with the first 1,000 iterations acting as a warm-up period. Chain convergence was confirmed using the R-hat statistic; the model we used produced R-hat statistics for parameters of interest that equaled approximately 1 with NEffective greater than 1,000 (Gelman et al., 2014). No divergent transitions were detected. Posterior predictive checks, whereby capacity of the model to produce simulated data similar to the observed data is evaluated, were achieved by estimating the univariate density of both the data and each of 1,000 simulated data sets, each generated from a unique sample from the posterior. As shown in Supplementary Figure S1, the observed densities generally matched the model-simulated densities, with 56.6% of the observed data densities falling within the 50% quantile intervals of the simulated.
Our model was also used to compute an exploratory factor analysis on the domains of the M-P-R from the posterior distribution. First, we computed credible intervals for the proportion of variance of the data explained by each of six potential factors. We next calculated Pearson’s r correlation coefficients between each variable and factor. For the purposes of exploring the latent factors, we plotted the correlations between domains and latent factors.
We report credible intervals from the posterior distribution indicating the values deemed credible for a parameter. Values excluded from the credible interval are considered unlikely. Importantly, if zero is not an estimate that falls within the credible interval, it may be provisionally rejected.
In interpreting Pearson’s r correlations, we adopted Cohen’s (1992) conventional effect size classifications (i.e., small, r ≥ .10; medium, r ≥ .30; large, r ≥ .50).
Results
Missing Data
Age at study entry and autism symptom severity did not differ between children for whom data were and were not available for the WISC-IV (see Appendix B). However, children who completed the WISC-IV at age 8 or 9 years had higher M-P-R DIs at study entry on average than children who completed the WISC-IV, as would be expected. Despite this difference, our analysis contained participants with DIs ranging from ~10 to ~110, ages ~20 months to ~60 months, and Social Responsiveness Scale Total scores ranging from ~50 to ~110, suggesting a more representative sample of preschoolers with ASD than those used previously to explore the psychometrics of the M-P-R (Peters, 2013; Steiman et al., 2007). Missing values for children who were included in the analysis were: M-P-R Cognitive domain (n = 2); M-P-R Memory domain (n = 1); M-P-R Receptive Language domain (n = 12); and PLS-4 Auditory Comprehension subscale (n = 8). Treating M-P-R basal scores as missing resulted in additional missing values: M-P-R Fine Motor domain (n = 1); M-P-R Receptive Language domain (n = 2); PLS-4 Auditory Comprehension subscale (n = 35).
Descriptive Statistics
See Table 1 for means and standard deviations of standard scores and age equivalent scores for each domain and the DI of the M-P-R and the PLS-4. Standard scores of the WISC-IV FSIQs are also summarized in Table 1.
Means (SDs) of Measures of Cognition and Language in Preschool-Aged Children with Autism Spectrum Disorder (n = 180).

Note. M-P-R = Merrill–Palmer–Revised Scales of Development; PLS-4 = Preschool Language Scale–Fourth Edition; WISC-IV FSIQ = Wechsler Intelligence Scale for Children, Full Scale Intelligence Quotient.
Comparison With Norms
Children in our sample scored at least one standard deviation lower than the norms sample on all domains and the DI of the M-P-R except for the Processing Speed domain. See Table 2 for credible values and of standard scores for each domain and DI of the M-P-R.
Medians and CrI95% (Credible Interval) of the Bayesian Posterior Distribution of Means of Index and Domain Scores of the Merrill–Palmer–Revised Scales of Development in Preschoolers With Autism Spectrum Disorder.

Discriminant Validity
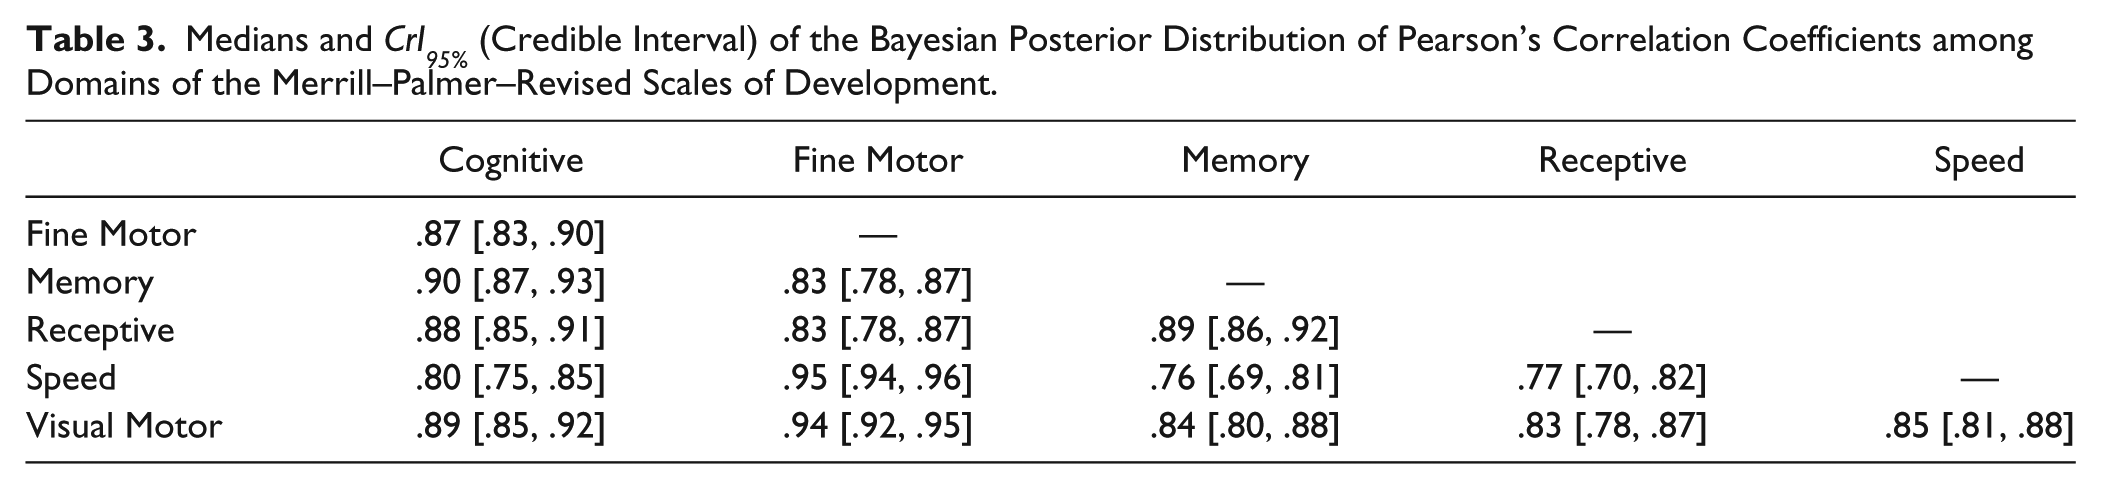
Large (r = .75-.95) positive correlations were found among all domains (see Table 3).
Medians and CrI95% (Credible Interval) of the Bayesian Posterior Distribution of Pearson’s Correlation Coefficients among Domains of the Merrill–Palmer–Revised Scales of Development.
Concurrent Validity
Based on the Bayesian posterior distribution of our model, the mean M-P-R Receptive Language standard score was lower than PLS-4 Auditory Comprehension subscale standard score: mean difference = 7.27, credible interval [CrI95%] [4.23, 10.36]. The correlation between the M-P-R Receptive Language domain and the PLS-4 Auditory Comprehension subscale was large: r = .63, CrI95% [.52, .71]. We used a regression model to ascertain whether DI influenced the correlation between the PLS-4 Auditory Comprehension subscale and the M-P-R Receptive Language domain, given the difference in lowest possible standard scores on the two tests. The intercept of the model was −29 CrI95% [−43, −15]. When controlling for DI, which was a credible predictor of the M-P-R Receptive Language score (b = 1.25, CrI95% [1.03, 1.47], the PLS-4 Auditory Comprehension subscale was not a credible predictor of Receptive Language on the M-P-R (b = 0.04, CrI95% [−0.16, 0.25]). The interaction between M-P-R DI and PLS-4 Auditory Comprehension was not credible (b = −0.0002, CrI95% [−0.003, 0.002]).
Predictive Validity
The posterior distribution showed that, on average, M-P-R DIs were lower than later WISC-IV FSIQs, with a mean difference of 12.55 CrI95% [8.36, 16.61]. A medium positive correlation between the measures was observed, r = .35, CrI95% [.17, .51].
Cognitive Profiles
The posterior distribution showed that, on average, Cognitive domain scores were greater than Receptive Language standard scores, with the difference between the two estimated at 5.4 CrI95% [3.4, 7.3]. The intercept of this regression model was −77, CrI95% [−105, −48]. There were main effects of age b = 1.30; CrI95% [0.65, 1.94], and DI: b = 0.80; CrI95% [0.39, 1.23], and a two-way interaction among age and DI: b = −0.01; CrI95% [−0.02, −0.004]. This interaction suggests that Cognitive scores tend to surpass Receptive Language scores (i.e., a nonverbal advantage) in younger children and those with lower DIs. Older children and those with higher DIs tended to display a mix of profiles including nonverbal IQ advantage, no advantage, and Receptive Language advantage (see Table 4). See Figure 1 for a graphical depiction of the two-way interaction.
Descriptive Statistics by Nonverbal/Receptive Language Advantage using the Merrill–Palmer–Revised Scales of Development (M-P-R).
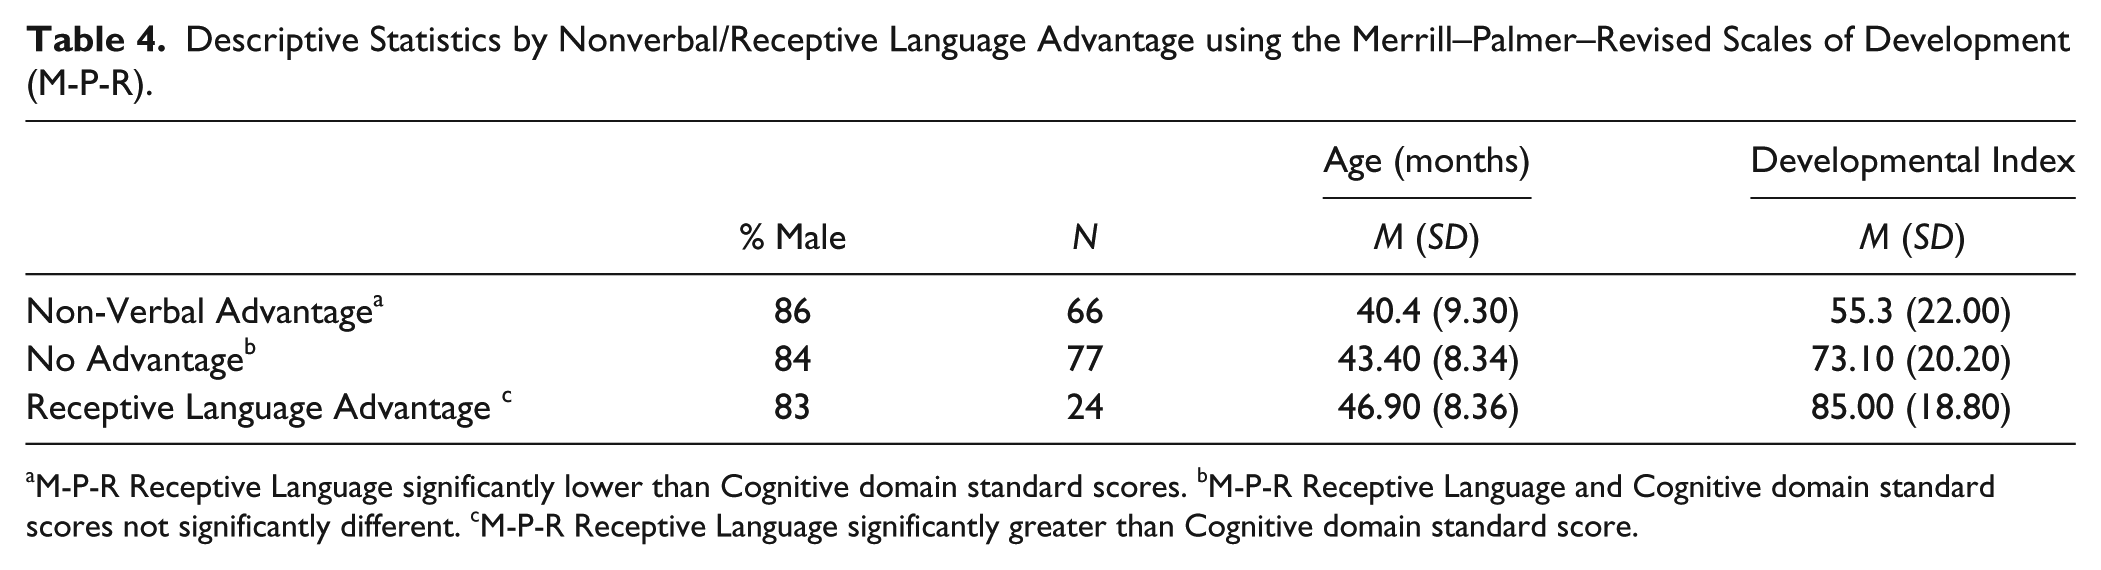
M-P-R Receptive Language significantly lower than Cognitive domain standard scores. bM-P-R Receptive Language and Cognitive domain standard scores not significantly different. cM-P-R Receptive Language significantly greater than Cognitive domain standard score.
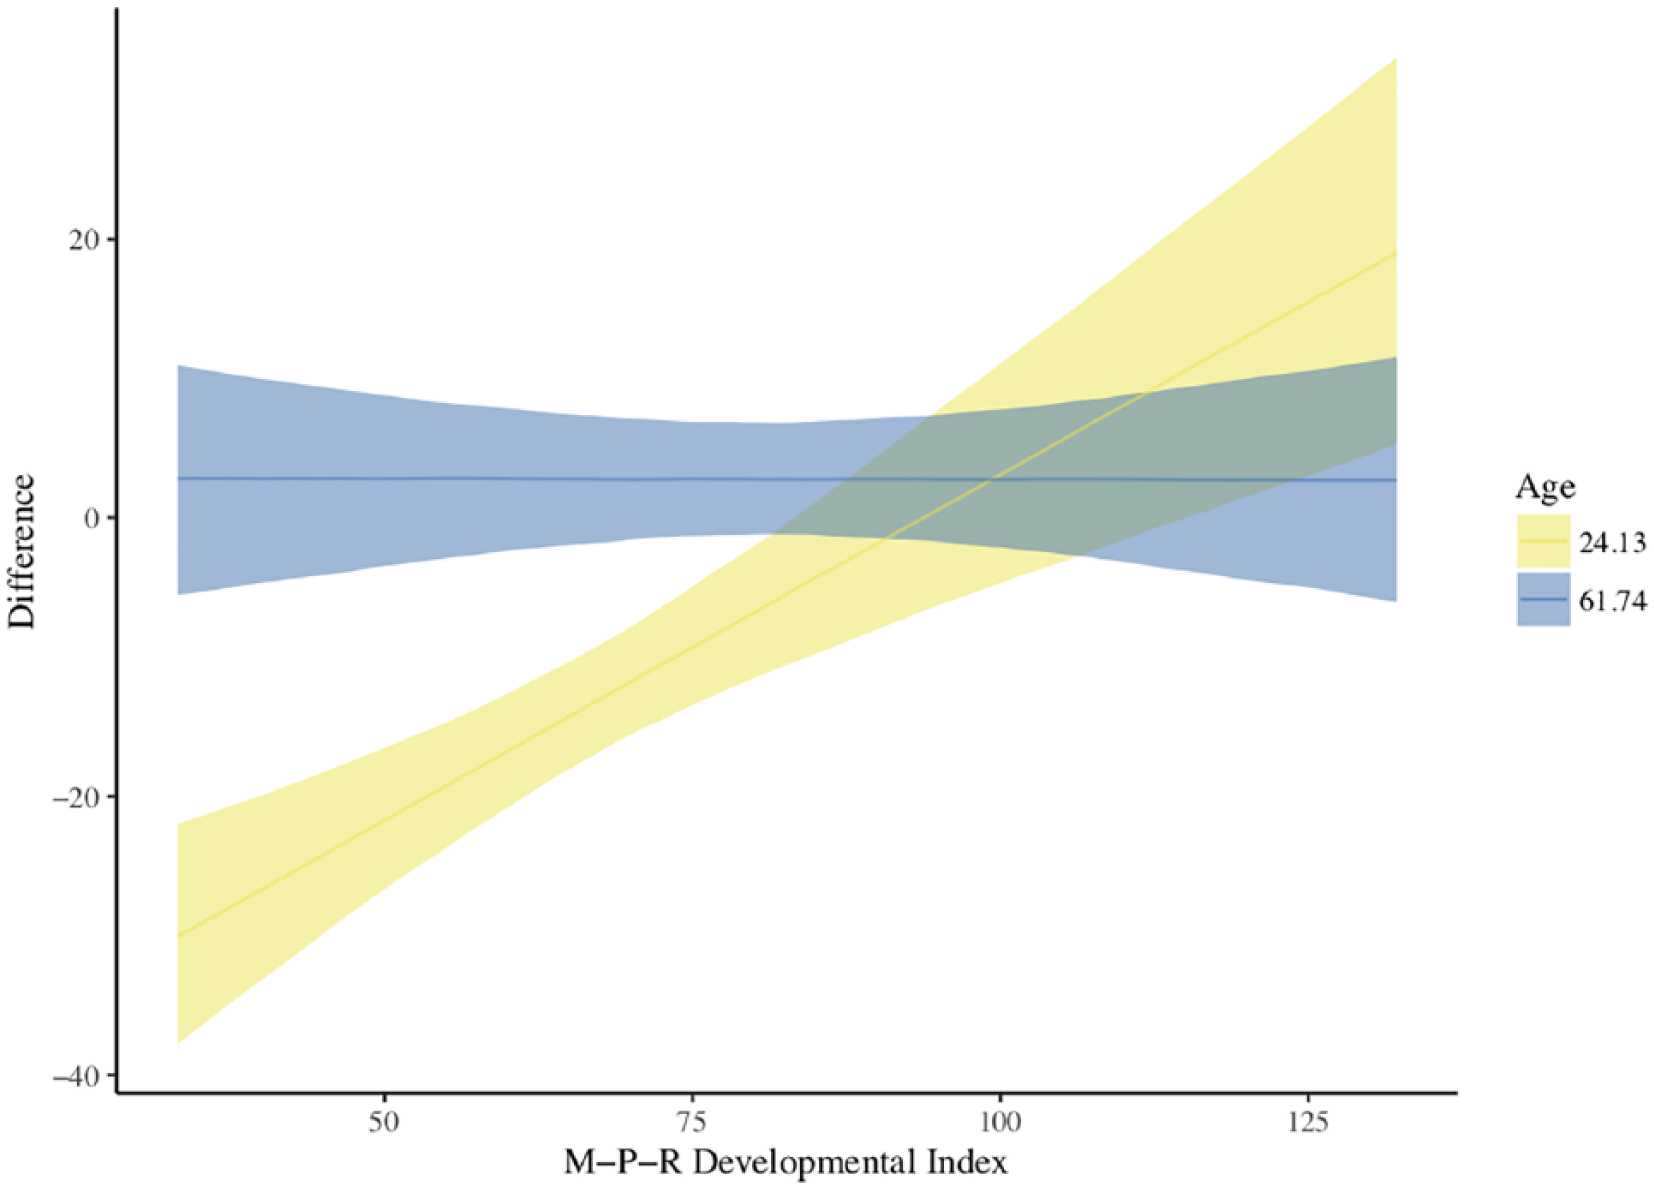
Posterior distribution of two-way interaction among age and cognitive ability predicting the difference between Cognitive and Receptive Language domain standard scores in preschoolers with autism spectrum disorder.
Exploratory Factor Analysis
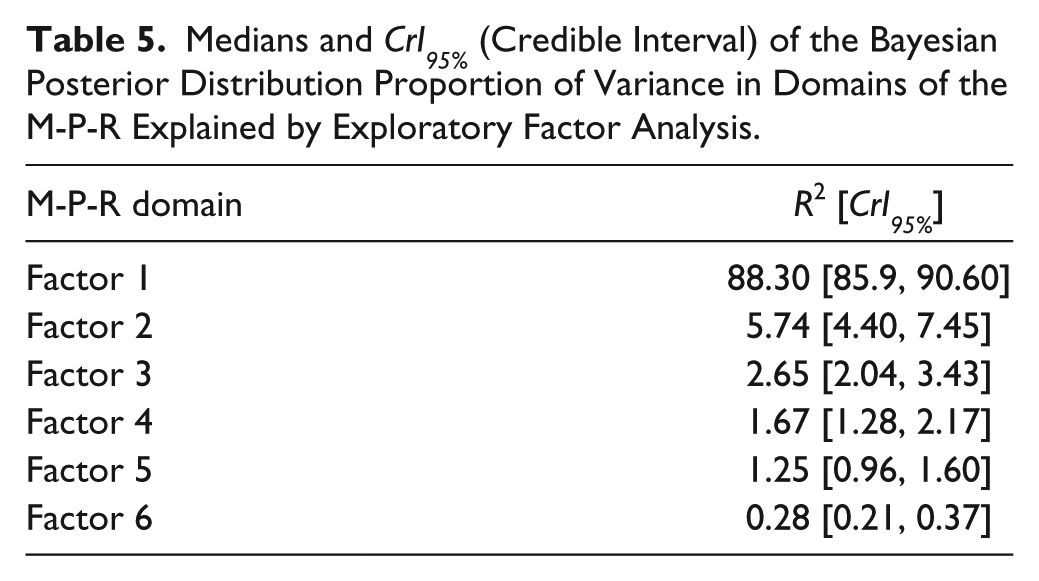
Our exploratory factor analysis showed that one latent variable accounted for 88.4%; CrI95% [86.1, 90.6] of the variance in the M-P-R domain standard scores. The remaining five factors accounted for ~0% to ~6% of the variance of M-P-R domains, respectively (see Table 5). Figure 2 shows the correlations between each M-P-R domain and each latent factor.
Medians and CrI95% (Credible Interval) of the Bayesian Posterior Distribution Proportion of Variance in Domains of the M-P-R Explained by Exploratory Factor Analysis.
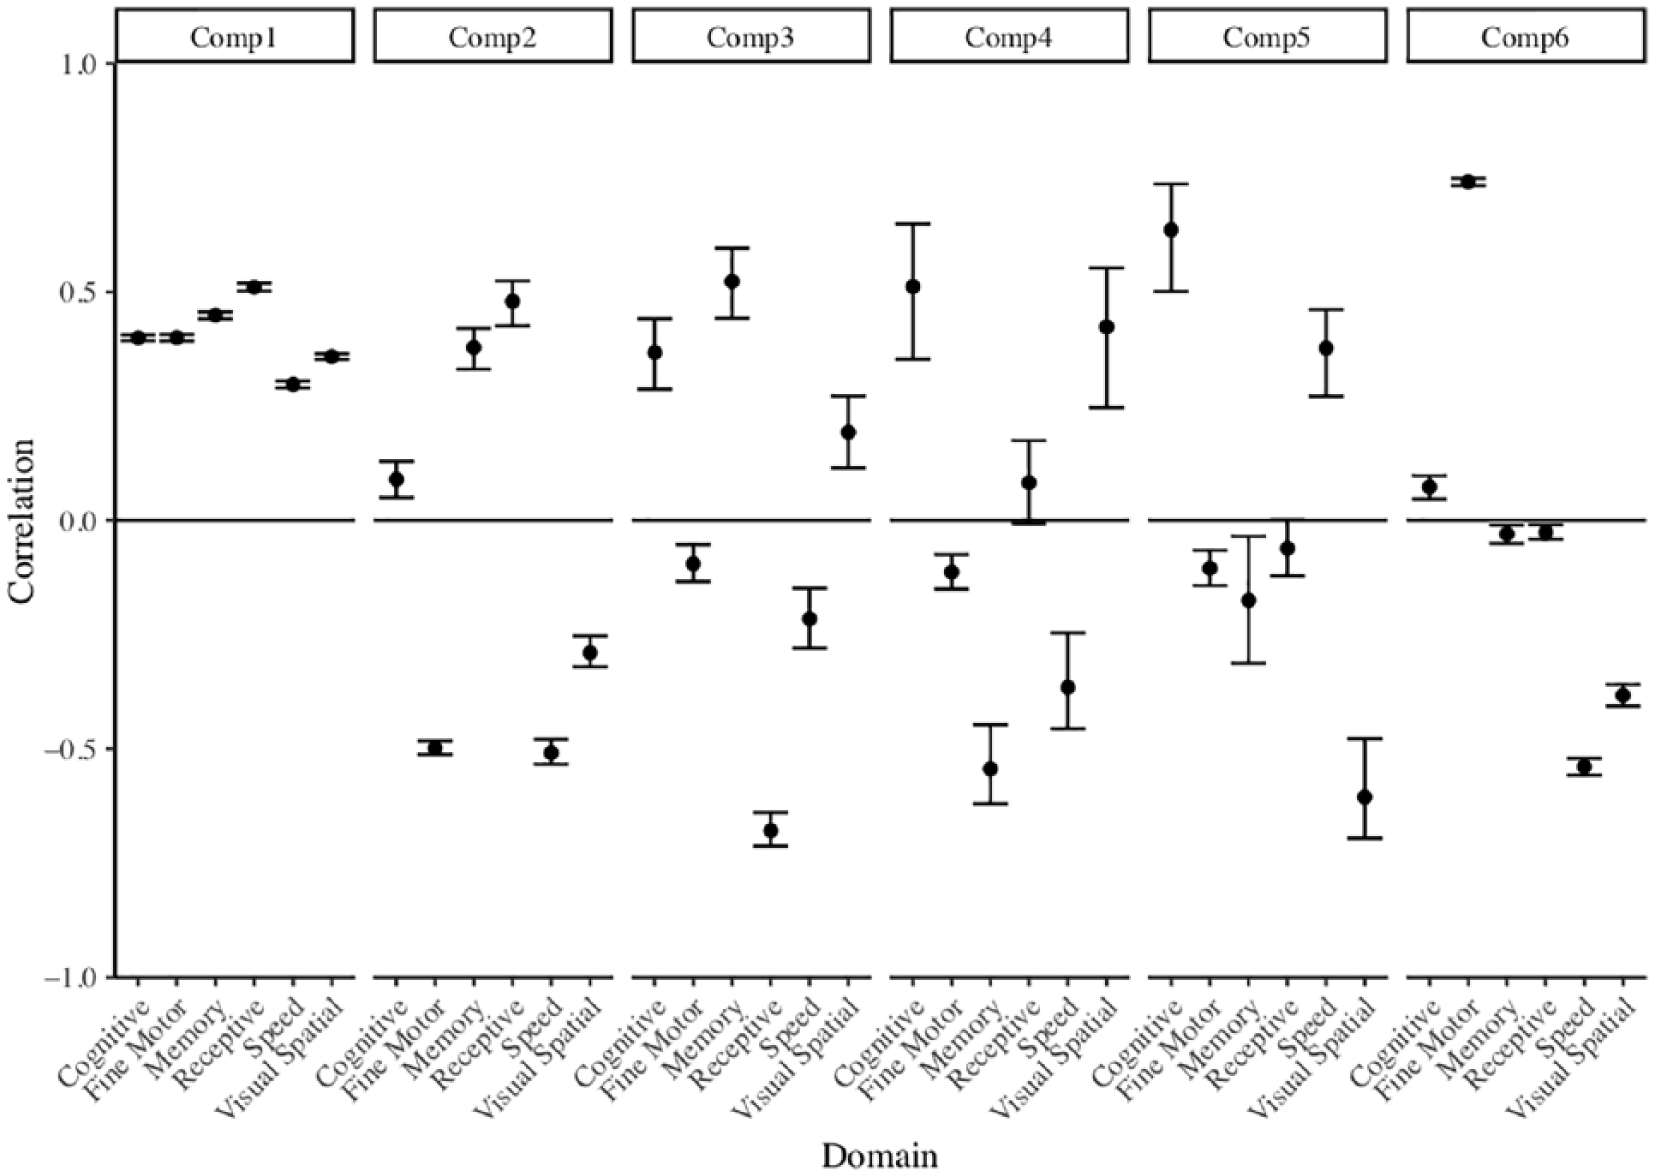
Correlations between each domain of the Merrill–Palmer–Revised Scales of Development and exploratory factor analysis components. Comp = component.
Discussion
Cognitive measures are indispensable for informing diagnosis (APA, 2013), prognosis (Howlin et al., 2014), and research with preschoolers with ASD (e.g., Flanagan et al., 2015). Yet few psychometrically strong measures have been available that are appropriate for assessing the range of intellectual abilities of this population (Klinger et al., 2009). The M-P-R (Roid & Sampers, 2004) has face validity for assessing cognitive skills, but had not been adequately validated for this purpose. We therefore examined the psychometric properties of the M-P-R in a large, representative sample of children with ASD. Our use of Bayesian analytic methods allows us to make probabilistic statements about our findings, and to use missing data to further strengthen our predictions.
As with past research (Peters, 2013; Steiman et al., 2007), children with ASD in our sample scored lower than typically developing children in the normative sample on most M-P-R domains and the DI, with zero difference between the groups being implausible. Our findings suggest that the M-P-R’s estimates of cognitive abilities in preschoolers with ASD capture differences in intellectual functioning between that group and the normative sample.
The average Processing Speed domain scores in our sample were estimated to be within one standard deviation of the norms sample. These scores are somewhat surprising in light of previous findings that Processing Speed scores on the WISC-III were lower than Perceptual Organization and Verbal Comprehension scores among children with ASD aged 6 to 16 years (Calhoun & Dickerson Mayes, 2005). Furthermore, among adolescents with ASD, processing speed scores on the WISC-IV tend not to surpass scores on other subscales (Baum, Shear, Howe, & Bishop, 2015). However, Peters (2013) also found processing speed to be a relative strength in her sample of preschoolers with ASD assessed using the M-P-R. One explanation is that timed tasks on the M-P-R are less cognitively taxing, or perhaps even tap strengths of children with ASD (i.e., perceptually rather than cognitively demanding tasks) compared with those on the Wechsler scales, leading to relatively high estimates of processing speed on the M-P-R among preschoolers with ASD. A second possibility is that the processing speed of children with ASD declines relative to other cognitive skills as they age.
Interdomain correlations (r) in our sample were large, ranging from .76 to .95. This suggests greater discriminant validity in preschoolers with ASD than in Peters’s analysis but lower discriminant validity than found by Steiman et al. (2007), whose sample overlapped with our own.
As hypothesized, standard scores on the Receptive Language domain of the M-P-R were lower on average at the group level than scores on the Auditory Comprehension subscale of the PLS-4. We further explored this difference by adding DI as a predictor of M-P-R Receptive Language domain scores. Our analysis showed that when controlling for DI, the PLS-4 Auditory Comprehension subscale does not predict variance in Receptive Language scores. This is likely due to the fact that the Receptive Language domain contributes to the calculation of DI scores, so the two are highly correlated.
A medium positive correlation (r = .35) between the preschool M-P-R DI and WISC FSIQ standard scores when the participants were approximately 8 to 9 years old demonstrates acceptable predictive validity of the M-P-R (Barker, Pistrang, & Eliott, 2015). The relative weakness of this correlation was expected given instability in cognitive standard scores between preschool and school-age. For instance, Charman et al. (2005) found that nonverbal IQ scores of 2-year-olds with ASD did not predict intelligence measured at 7 years. Mayes and Calhoun (2003) found significantly greater mean IQ in school-aged than in preschool-aged children with ASD cross-sectionally (measured using the Bayley, the SB-IV, or the WISC-III, depending on the ability level of the child). In keeping with these findings, non-overlapping credible intervals showed that WISC-IV FSIQ scores at age 8 to 9 were greater on average than earlier M-P-R DIs in our sample. See Flanagan et al. (2015) for a discussion of age-related gains in cognitive ability in children with ASD.
A further novel element of our study is the exploration of nonverbal cognition versus receptive language strengths and weaknesses among preschoolers with ASD assessed by the M-P-R. We hypothesized that patterns of strengths and weaknesses among children with ASD would be consistent with results from other validated measures of cognitive ability. Our hypothesis that nonverbal IQ (measured using the M-P-R’s Cognitive domain) would be greater than Receptive Language domain scores at the group level was supported by nonoverlapping credible intervals for the estimated value of the two domains, such that Cognitive scores were on average 5.4 points greater than Receptive Language scores. Patterns of nonverbal IQ versus receptive language advantage were expected to differ depending on age and cognitive abilities, such that children with a nonverbal IQ advantage would be on average younger and show lower DIs than children for whom Receptive Language scores were an advantage. Our hypothesis was supported using regression analysis. We found that the interaction between age and DI was associated with variability in the difference between the Cognitive and Receptive Language domains. This two-way interaction suggests that cognitive scores are more likely to be higher than Receptive Language scores in younger children with lower DIs. Our findings are consistent with those of Coolican et al. (2008), who found that children with higher IQs measured using the SB-5 were more likely to display a verbal IQ advantage and children with lower IQs were more likely to show a nonverbal IQ advantage. In contrast, Coolican et al. (2008) did not find an effect of age on these nonverbal versus verbal IQ differences. Our contrasting main effect of age could result from our younger sample (Coolican et al.’s sample included children aged 6-16 years). Supporting this notion, Mayes and Calhoun (2003) found that as children with ASD reached 8 years, discrepancies between nonverbal and verbal IQ measured using the SB-IV narrowed and stabilized. Complementary to our results, Mayes and Calhoun (2003) also found that the discrepancy between nonverbal and verbal IQ decreased earlier (i.e., when younger) for children with greater cognitive abilities. As such, cognitive strengths and weaknesses assessed using the M-P-R are consistent with those found using the SB-4, the SB-5, the Wechsler scales (Mouga et al., 2016; Nader, Jelenic, & Soulières, 2015), the MSEL, and the DAS (Bishop, Guthrie, Coffing, & Lord, 2011), promoting the validity of M-P-R for assessing cognitive strengths and weaknesses in preschoolers with ASD.
Our exploratory factor analysis suggested that most of the variability in M-P-R domain scores is explained by a single latent factor. This finding is consistent with the theoretical underpinnings of the M-P-R, the Cattell–Horn–Carroll theory of intelligence, which posits that generalized intellectual ability (i.e., g) underlies higher order cognitive skills tested at the domain level (McGrew, 2005). Domain scores of preschoolers with ASD in our sample all showed medium to large positive correlations with this factor.
Limitations
Although we found that children with ASD scored lower on average than the normative sample on all domains and indices of the M-P-R measured, the comparison must be interpreted cautiously. An age-matched typically developing control group was not available, so intellectual abilities were considered relative to M-P-R norms. The invariance or equivalence of the M-P-R’s measurement of intellectual abilities when assessing typically developing children versus children with ASD has not been investigated. Therefore, the mere observation of score differences does not ensure that the discrepancy results from differences in abilities (Van De Schoot, Schmidt, De Beuckelaer, Lek, & Zondervan-Zwijnenburg, 2015). Rather, differences could derive from challenges associated with testing children with ASD using standardized measures (i.e., communication difficulties; repetitive/stereotyped behavior; off-task behavior; Akshoomoff, 2006). To minimize this limitation, the Pathways in ASD study assessors noted when off-task behavior was judged to compromise test results; data from those assessments were not included in the current analysis. Furthermore, the examiners observed that children were generally engaged and motivated by the toy-like test stimuli of the M-P-R. Frustration was also minimized by the low receptive and nonexistent expressive language requirements for children during testing.
Another limitation of our analysis is that the M-P-R was standardized with a group of American preschoolers, yet it cannot be assumed that measurement of cognition in Canadian versus American preschoolers is invariant (Babcock, Miller, Saklofske, & Zhu, 2018). As such, our analysis did not focus on classification of preschoolers into ability categories, but rather sought to describe patterns and connections between tests (i.e., PLS-4; WISC-IV; though note that our data were gathered prior to the publication of the most recent versions of these tests). Furthermore, our exploratory factor analysis suggested that the M-P-R may assess a g factor underlying the cognitive scales among preschoolers with ASD, supporting the notion that it assesses cognition based on the Cattell–Horn–Carroll theory of intelligence (McGrew, 2005).
A limitation of our nonverbal IQ versus Receptive Language profile analysis is that we used the M-P-R Receptive Language domain as a proxy for verbal IQ. However, our use of the M-P-R’s Receptive Language domain, which lacks a verbal reasoning component, in this way is not unprecedented. For instance, Bishop et al. (2011) combined the receptive and expressive language subtests of the MSEL, neither of which contains a verbal reasoning component, to provide a proxy for verbal IQ in preschoolers with ASD. A second important limitation to this analysis is the reliance on domains of the M-P-R, the independence of which has not been validated previously among preschoolers with ASD. Our profile analysis must therefore be interpreted with caution, especially given high intercorrelations among domains, and the results of our factor analysis. Despite limited evidence of domain independence, the current profile analysis mirrors patterns shown in previous studies using more widely used cognitive tests. This suggests that ascertainment of cognitive abilities in preschoolers with ASD by M-P-R may yield clinically useful information, for example, to guide recommendations for instructional methods.
Conclusions
The current study provided evidence of the criterion validity of the M-P-R for assessing cognitive abilities in preschoolers with ASD. Our analyses also offered evidence for good concurrent and predictive validity of the M-P-R compared with widely used, well-validated measures of cognition and receptive language. Our results suggested, further, that standard scores of the PLS-4 Auditory Comprehension subscale and the M-P-R Receptive Language domain were comparable among preschoolers with ASD. When compared with the WISC-IV at ages of 8 to 9 years, cognition assessed using the M-P-R during the preschool years showed good predictive validity, with the caveat that individual scores may be unstable, especially in very young children or those with cognitive delays (e.g., Charman et al., 2005). Cognitive strengths and weaknesses assessed using the M-P-R were similar to those described using other measures, such that on average children obtained higher standard scores on the Cognitive than the Receptive Language domain. An exploratory factor analysis suggested that one factor accounts for the majority of variation in M-P-R domains, consistent with the Cattell–Horn–Carroll theory of intelligence.
Future studies should further investigate the validity of the M-P-R in preschoolers with ASD by comparing M-P-R results with those from other concurrent measures of intellectual ability. Profiles of strengths and weaknesses should also be compared with results from typically developing children to ensure that the unique profiles of children with ASD are not sample-dependent artefacts. Finally, test–retest and interrater reliability of the M-P-R in children with ASD should be investigated by administering the test to the same individuals in close succession and by multiple examiners. Results from these studies would build on the current analysis to provide guidance to clinicians who seek cognitive tests that can be reliably administered at multiple time points to children with ASD with a broad range of cognitive abilities.
Cognitive testing of preschoolers with ASD is crucial for diagnostic and prognostic information and is indispensable for researching trajectories and outcomes for individuals with ASD. Our findings are important given the paucity of psychometrically sound cognitive tests that are valid for use among the full age and cognitive ability range of preschoolers with ASD. Given our analyses, we conclude that the M-P-R is a valuable measure for assessing cognition in preschoolers with ASD for clinical or research purposes.
Supplemental Material
supplementary_appendix_A – Supplemental material for Psychometric Properties of the Merrill–Palmer–Revised Scales of Development in Preschool Children With Autism Spectrum Disorder
Supplemental material, supplementary_appendix_A for Psychometric Properties of the Merrill–Palmer–Revised Scales of Development in Preschool Children With Autism Spectrum Disorder by Erin E. Dempsey, Isabel M. Smith, Helen E. Flanagan, Eric Duku, Michael A. Lawrence, Peter Szatmari, Lonnie Zwaigenbaum, Tracy Vaillancourt, Joanne Volden, Pat Mirenda, Charlotte Wadell, Stelios Georgiades, Mayada Elsabbagh, Wendy J. Ungar and Teresa Bennett in Assessment
Supplemental Material
Supplementary_Appendix_B – Supplemental material for Psychometric Properties of the Merrill–Palmer–Revised Scales of Development in Preschool Children With Autism Spectrum Disorder
Supplemental material, Supplementary_Appendix_B for Psychometric Properties of the Merrill–Palmer–Revised Scales of Development in Preschool Children With Autism Spectrum Disorder by Erin E. Dempsey, Isabel M. Smith, Helen E. Flanagan, Eric Duku, Michael A. Lawrence, Peter Szatmari, Lonnie Zwaigenbaum, Tracy Vaillancourt, Joanne Volden, Pat Mirenda, Charlotte Wadell, Stelios Georgiades, Mayada Elsabbagh, Wendy J. Ungar and Teresa Bennett in Assessment
Supplemental Material
Supplementary_Appendix_C – Supplemental material for Psychometric Properties of the Merrill–Palmer–Revised Scales of Development in Preschool Children With Autism Spectrum Disorder
Supplemental material, Supplementary_Appendix_C for Psychometric Properties of the Merrill–Palmer–Revised Scales of Development in Preschool Children With Autism Spectrum Disorder by Erin E. Dempsey, Isabel M. Smith, Helen E. Flanagan, Eric Duku, Michael A. Lawrence, Peter Szatmari, Lonnie Zwaigenbaum, Tracy Vaillancourt, Joanne Volden, Pat Mirenda, Charlotte Wadell, Stelios Georgiades, Mayada Elsabbagh, Wendy J. Ungar and Teresa Bennett in Assessment
Supplemental Material
Supplementary_Appendix_D – Supplemental material for Psychometric Properties of the Merrill–Palmer–Revised Scales of Development in Preschool Children With Autism Spectrum Disorder
Supplemental material, Supplementary_Appendix_D for Psychometric Properties of the Merrill–Palmer–Revised Scales of Development in Preschool Children With Autism Spectrum Disorder by Erin E. Dempsey, Isabel M. Smith, Helen E. Flanagan, Eric Duku, Michael A. Lawrence, Peter Szatmari, Lonnie Zwaigenbaum, Tracy Vaillancourt, Joanne Volden, Pat Mirenda, Charlotte Wadell, Stelios Georgiades, Mayada Elsabbagh, Wendy J. Ungar and Teresa Bennett in Assessment
Supplemental Material
supplementary_appendix_E – Supplemental material for Psychometric Properties of the Merrill–Palmer–Revised Scales of Development in Preschool Children With Autism Spectrum Disorder
Supplemental material, supplementary_appendix_E for Psychometric Properties of the Merrill–Palmer–Revised Scales of Development in Preschool Children With Autism Spectrum Disorder by Erin E. Dempsey, Isabel M. Smith, Helen E. Flanagan, Eric Duku, Michael A. Lawrence, Peter Szatmari, Lonnie Zwaigenbaum, Tracy Vaillancourt, Joanne Volden, Pat Mirenda, Charlotte Wadell, Stelios Georgiades, Mayada Elsabbagh, Wendy J. Ungar and Teresa Bennett in Assessment
Footnotes
Appendix A
Appendix B
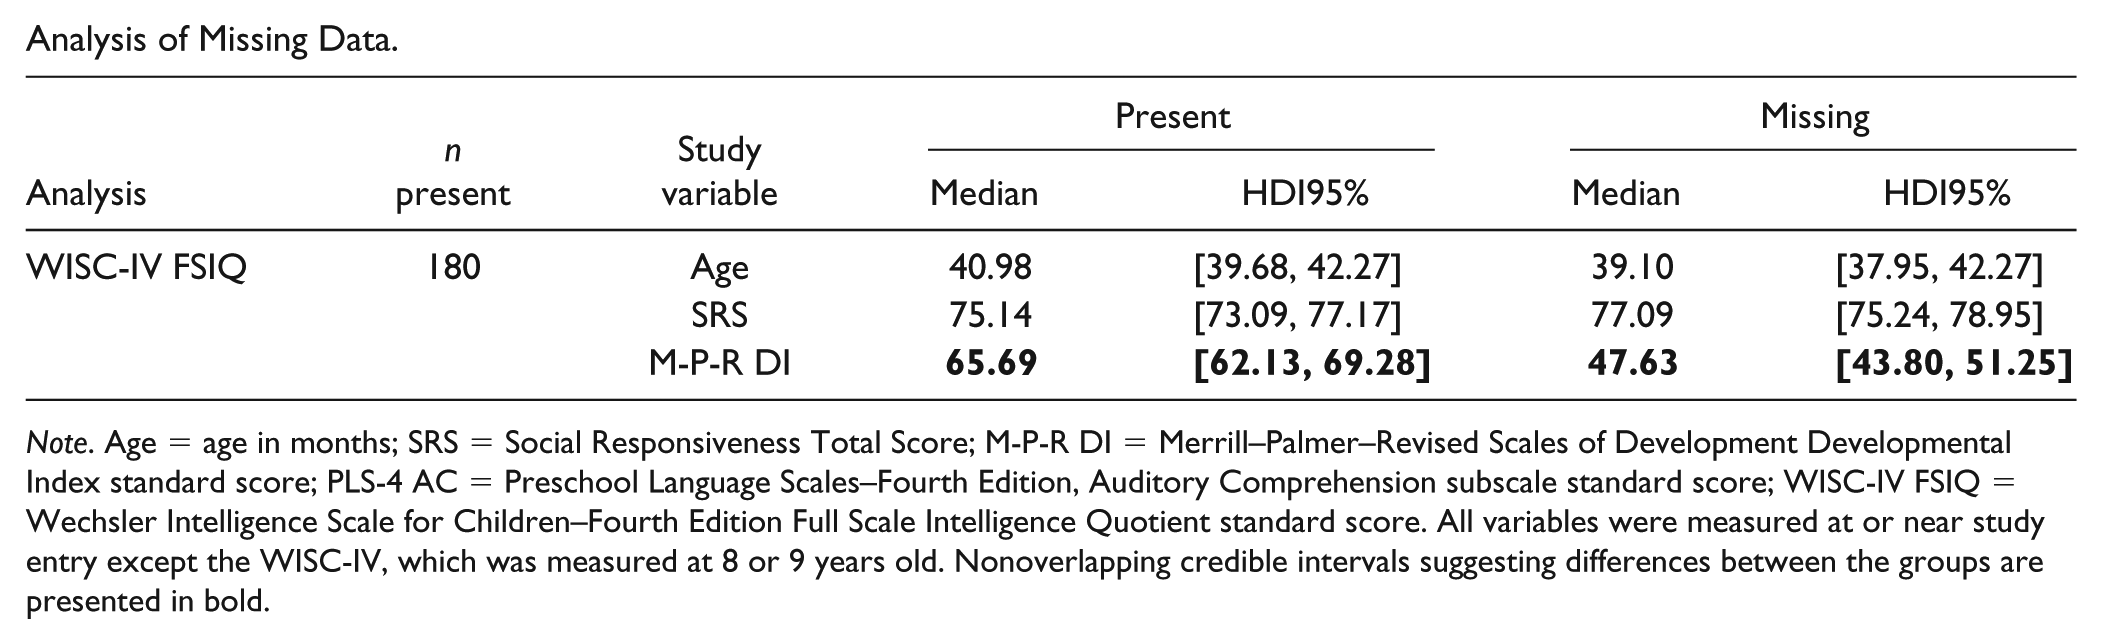
Analysis of Missing Data.
| Analysis | n present |
Study variable | Present | Missing |
||
|---|---|---|---|---|---|---|
| Median | HDI95% | Median | HDI95% | |||
| WISC-IV FSIQ | 180 | Age | 40.98 | [39.68, 42.27] | 39.10 | [37.95, 42.27] |
| SRS | 75.14 | [73.09, 77.17] | 77.09 | [75.24, 78.95] | ||
| M-P-R DI |
|
|
|
|
||
Note. Age = age in months; SRS = Social Responsiveness Total Score; M-P-R DI = Merrill–Palmer–Revised Scales of Development Developmental Index standard score; PLS-4 AC = Preschool Language Scales–Fourth Edition, Auditory Comprehension subscale standard score; WISC-IV FSIQ = Wechsler Intelligence Scale for Children–Fourth Edition Full Scale Intelligence Quotient standard score. All variables were measured at or near study entry except the WISC-IV, which was measured at 8 or 9 years old. Nonoverlapping credible intervals suggesting differences between the groups are presented in bold.
Acknowledgements
The authors thank all the children and families who have participated in the Pathways in ASD study. The authors also acknowledge the Pathways in ASD Study Team (research staff members and trainees) who have contributed to this study.
Authors’ Note
The opinions, results, and conclusions reported in this article are those of the authors and are independent from the funding sources. No endorsement by the Maritime SPOR Support Unit (MSSU) or the named funding partners is intended or should be inferred.
Declaration of Conflicting Interests
The author(s) declared no potential conflicts of interest with respect to the research, authorship, and/or publication of this article.
Funding
The author(s) disclosed receipt of the following financial support for the research, authorship, and/or publication of this article: This study was supported by the Canadian Institutes of Health Research, Autism Speaks, Government of British Columbia, Alberta Innovates Health Solutions, NeuroDevNet, and the Sinneave Family Foundation. E. E. Dempsey is supported by the Maritime SPOR Support Unit (MSSU), which receives financial support from the Canadian Institutes of Health Research (CIHR), the Nova Scotia Department of Health and Wellness, the New Brunswick Department of Health, the Nova Scotia Health Research Foundation (NSHRF), and the New Brunswick Health Research Foundation (NBHRF). I. M. Smith is supported by the Joan & Jack Craig Chair in Autism Research. P. Szatmari is supported by the Patsy and Jamie Anderson Chair in Child and Youth Mental Health. L. Zwaigenbaum is supported by the Stollery Children’s Hospital Foundation Chair in Autism. T. Vaillancourt is supported by the Canada Research Chair in Children’s Mental Health and Violence Prevention. C. Waddell is supported by a Canada Research Chair. T. Bennett and S. Georgiades are supported by Early Career Awards from the Hamilton Health Sciences Foundation.
Supplemental Material
Supplemental material for this article is available online.
References
Supplementary Material
Please find the following supplemental material available below.
For Open Access articles published under a Creative Commons License, all supplemental material carries the same license as the article it is associated with.
For non-Open Access articles published, all supplemental material carries a non-exclusive license, and permission requests for re-use of supplemental material or any part of supplemental material shall be sent directly to the copyright owner as specified in the copyright notice associated with the article.