




Abstract
How positively or negatively people generally view others is key for understanding personality, social behavior, and psychopathology. Previous research has measured generalized other-perceptions by relying on either explicit self-reports or judgments made in group settings. With the current research, we overcome the limitations of these past approaches by introducing a novel measurement instrument for generalized other-perceptions: the Online-Tool for Assessing Perceiver Effects (O-TAPE). By assessing perceivers’ first impressions of a standardized set of target people displayed in social network profiles or short video sequences, the O-TAPE captures individual differences in the positivity of other-perceptions. In Study 1 (n = 219), the instrument demonstrated good psychometric properties and correlations with related constructs. Study 2 (n = 142) replicated these findings and also showed that the O-TAPE predicted other-perceptions in a naturalistic group setting. Study 3 (n = 200) refined the nomological network of the construct and demonstrated that the O-TAPE is invulnerable to effects of social desirability.
Keywords
In order to understand people’s feelings, behaviors, and social relationships, it is of key importance to know which general view they hold about others. If we know that Peter generally thinks very highly of others, whereas Neil does not, this might explain why the two behave differently in social interactions, evoke different reactions in their interaction partners, and maintain different kinds of relationships. How individuals see others in a given situation determines which behavioral options appear appropriate or affordable to them (Campbell et al., 1964; Rau et al., 2019) and as such, other-perceptions play a pivotal role in shaping the behavioral outcomes commonly studied by psychologists. Furthermore, generalized other-perceptions occur in classic theories on psychosocial development (Erikson, 1959, 1968) and attachment (Bowlby, 1988; Fraley, 2002) such that they reflect a stable set of learned assumptions about “the other,” and these assumptions crucially shape social relationships.
In line with this general notion, generalized beliefs about the intentions that underlie others’ behaviors are a core feature of interpersonal accounts of personality dynamics (Hopwood, 2018; Hopwood et al., 2013) and of cognitive accounts of personality pathology (Fournier et al., 2012). In fact, generalized other-perceptions are defining features of many personality disorders. For instance, narcissistic personality disorder is characterized by condescendence toward others, schizoid personality disorder by general doubts about the loyalty and fidelity of others, and obsessive–compulsive personality disorder by a preoccupation with flaws and imperfections in others’ performances (American Psychiatric Association, 2013).
Despite the importance of generalized other-perceptions, an adequate measure for capturing them has yet to be established. Building on recent findings from the interpersonal perception literature, the current research seeks to close this gap by introducing an objective, reliable, valid, and economical tool for their assessment.
Perceiver Effects as Generalized Other-Perceptions
In principle, it would be possible to assess generalized other-perceptions in a straightforward way by explicitly asking individuals about their general view of other people. In fact, assessments of personality constructs, such as humanity-esteem (Luke & Maio, 2009) or philosophies of human nature (Wrightsman, 1992) contain people’s self-reports of how they view other people in general. However, given that it is presumably highly undesirable to generally maintain negative views of other people, an important downside of this approach is that such self-reports may be heavily affected by self-presentation concerns.
A more direct and at the same time less obvious approach is to extract the information of interest from ratings that perceivers provide about actual other people. This approach is typically taken in the person perception literature. It is a well-established finding that different perceivers who rate the same set of target people usually arrive at somewhat different mean judgments across these targets. Some perceivers systematically give higher ratings than others. This implies that a single interpersonal judgment reflects not only actual target characteristics but also the perceiver’s judgmental bias for other-perceptions. Notably, in such a setting, other-perceptions are extracted from ratings that perceivers provide without being aware that diagnostic information about themselves (rather than information about the target people) is being collected. This renders them unsusceptible to concerns of self-presentation and has led some authors to compare them with projective tests (Wood et al., 2010).
These individual judgmental biases in other-perceptions are termed perceiver effects (Kenny, 1994). Perceiver effects have been documented for many traits and in a variety of social contexts (Dufner et al., 2016; Hehman et al., 2017; Rau et al., 2019; Srivastava et al., 2010; Vazire, 2010; Wood et al., 2010) and they typically account for 20% to 30% of the total variance in interpersonal impressions (Hehman et al., 2017; Kenny, 1994; Xie et al., 2019). Furthermore, perceivers who judge others positively on one trait often also tend to judge others positively on other traits, which implies that perceivers have differential tendencies to form positively (vs. negatively) biased other-perceptions regardless of the particular trait that is being rated (Rau et al., 2019; Srivastava et al., 2010; Wood et al., 2010). In other words, the bias is to some extent domain-general. Finally, generalized other-perceptions are a rather stable characteristic of the perceiver as indicated by considerable rank-order stability in perceiver effects over time (Srivastava et al., 2010; Wood et al., 2010). Overall then, individual differences in the positivity of other-perceptions occur ubiquitously, and they are reliably detectable and temporally stable.
Operationalizing Generalized Other-Perceptions
Interpersonal perception scholars have traditionally assessed mutual impressions in social groups whose members act as perceivers (who provide ratings) and as targets (who are rated), which allows them to extract not only perceiver effects but also target effects (consensually perceived characteristics of targets) and relationship effects (dyad-specific perceptions; Kenny, 1994). Such a decomposition is quite appealing because it enables researchers to address a variety of questions both on the level of individuals and on the level of dyads.
However, if the goal is to obtain a measure of generalized other-perceptions, drawing on perceiver effects measured in social groups is nonoptimal for two reasons. First, conducting group studies is very time consuming and requires a lot of resources. This practical problem has been a major hindrance in research on generalized other-perceptions.
Second, perceiver effects in group studies are not exclusively composed of perceivers’ generalized other-perceptions but also by influences that are unique to the particular social context they were captured in. For example, if charismatic Peter is more popular in the group than unpopular Neil, Peter is also likely to evaluate his group members more favorably for the simple reason that people are in fact friendlier toward him. In this case, Peter’s positive perceiver effect does not reflect an idiosyncratic judgment bias but a description of the group’s social reality. Beyond that, perceiver effects in group studies might be influenced by other unique influences such as personal group-stereotypes or differential social identification.
In the present research, we introduce a measurement approach that can be applied to overcome the problems described above, that is, an approach researchers can use to assess the positivity of generalized other-perceptions without conducting a group study. Because the approach requires no personal interaction between perceivers and targets, ratings also cannot be influenced by the social reality within groups. Instead of having perceivers judge other people they have actually met in person, they are asked to judge a set of target people they have never met but have instead viewed on social network sites or in short video sequences. The positivity of generalized other-perceptions is then computed in a straightforward way by aggregating perceivers’ judgments across all targets and traits.
Correlates of Generalized Other-Perceptions
Assuming that the measurements are valid, what would be the psychological footprint of a positively or negatively biased perceiver effect? Which correlates would be suitable for describing the nomological network of generalized other-perceptions? Four classes of such individual difference variables are relevant. The first class includes basic demographic and physical information about the perceiver including gender, height, education, age, and income. Women have repeatedly been found to evaluate other people more positively than men do (Srivastava et al., 2010; Winquist et al., 1998; Wood et al., 2010), and some evidence has suggested that the same could be true for shorter people (controlling for gender differences) and for students with better grades (Wood et al., 2010). Associations with age and income have not been reported in the literature, but it is conceivable that perceivers might mellow with increasing age or become more discerning with increasing income.
The second class of variables includes explicitly expressed anthropologic beliefs. People with a more positive perceiver effect should express a more positive attitude toward humanity in general and believe in the existence of true altruism, given that positive generalized other-perceptions are key components of these beliefs.
The third class of variables includes personality traits. At the broadest level, personality differences can be described on the dimensions of agency (assertiveness, competence) and communion (warmth, morality; Abele et al., 2016). Whereas agency is profitable to the self, communion is profitable to others (Abele & Wojciszke, 2007), and as such, highly communal people might have more positive generalized other-perceptions in comparison with uncommunal people. Another well-established taxonomy of personality differences is the Big Five framework (Goldberg, 1990; John & Srivastava, 1999). Within this framework, the domain of agreeableness refers to the tendency to behave cooperatively and politely toward others and should be related to more positive generalized other-perceptions.
Zooming in on narrower personality traits, grandiose narcissism is an interesting construct in the context of other-perceptions. Narcissism is characterized by the overarching need to maintain a grandiose self, and narcissistic admiration and narcissistic rivalry have been described as two distinct pathways for fulfilling this need (Back et al., 2013). Whereas admiration involves grandiose fantasies, striving for uniqueness, and charmingness and is thus primarily focused on the self, rivalry involves devaluating others, striving for supremacy, and aggressiveness and is focused on enhancing the self in relation to others. Thus, rivalry might be related to more negative generalized other-perceptions. Finally, dispositional contempt has been described as the tendency to “look down on, feel cold toward, and derogate or distance others” (Schriber et al., 2017, p. 280) and thus reflects a rather narrow personality construct that should be associated with more negative generalized other-perceptions.
The fourth and final class includes measures of psychological adjustment. The ability to have basic trust and to give affection to others has been described as a signature of the psychologically healthy person (Erikson, 1959, 1968; Rogers, 1963), and it is therefore conceivable that more positive generalized other-perceptions are positively related to psychological adjustment. The instantiations of psychological adjustment we considered in our research are self-esteem, attachment security, and life satisfaction.
The Present Research
In the present research, we introduce an instrument that measures generalized other-perceptions by assessing perceivers’ first impressions of a standardized set of targets displayed in social network profiles or in video sequences. Thus, the instrument is easy to implement in online or laboratory studies and eliminates influences of social contexts. Furthermore, the current research dealt with a problem that has largely been neglected in past research on generalized other-perceptions, namely, response sets or scale-use bias (Kenny, 1994). For example, if Peter was highly responsive to evaluative scales in general, he would provide very positive judgments of other people, but at the same time, he would probably also provide very positive judgments of himself and also of many other things such as furniture, everyday commodities, and the like. If scale-use bias was the only systematic source of perceiver effects, a correlation between a perceiver effect and any self-reported criterion variable would be a pure technical artifact and would be conceptually meaningless. To index scale-use bias, we assessed perceivers’ judgments not only of target people but also of nonsocial objects (e.g., pieces of furniture). In this way, we could gauge the overlap between generalized other-perceptions and scale-use bias and test whether the relations between generalized other-perceptions and other constructs would hold once scale-use bias was controlled for.
We conducted three studies (total N = 561) and report how we determined sample sizes and all data exclusions for each of them. We examined how much of the overall variance in personality impressions was due to perceiver effects, how perceiver effects were structured across different rating dimensions, and how reliably they could be captured. In addition, we qualified the measure’s nomological network by testing its associations with basic demographic and physical variables, explicit anthropologic beliefs, personality traits, and psychological adjustment. Finally, we tested whether the new measure would predict perceiver effects in a real-life group setting (Study 2) and to what extent it was susceptible to socially desirable responding (Study 3). Despite their exploratory nature, Studies 1 and 2 were preregistered to provide a transparent picture of the entire research process (https://osf.io/43p7k/). Furthermore, we provide the original data and R-scripts that can be used to reproduce the results of all analyses online (https://osf.io/6wuf8/).
Study 1
In Study 1, we developed the measurement instrument and examined its psychometric properties. We developed two versions of the Online-Tool for Assessing Perceiver Effects (O-TAPE), each of which features a different type of stimuli. The first version displays 10 target people’s screenshots of social network profiles (SoN-TAPE), and the other version displays 10 targets in short video sequences (ViS-TAPE). After viewing a target person’s profile or video, perceivers are asked to indicate their impression of the target on several rating dimensions. Whereas the ViS-TAPE reveals more information about a target and should be more closely related to face-to-face contexts in real life, the SoN-TAPE has the benefit of being easier to implement for researchers. As such, one goal of the current research was to evaluate whether a valid measurement of generalized other-perceptions requires video stimuli or whether it might suffice to present social network profiles. Furthermore, we created parallel forms for both versions of the O-TAPE so that test–retest correlations with novel stimuli could be examined.
Development of the O-TAPE
Social Network Stimuli
For the SoN-TAPE, we generated screenshots of profiles from the online social network site Facebook as stimuli. We initially selected 42 pictures from the license free image website (http://freeimages.com) showing men and women in varying poses and settings that are typical of profile pictures from online social network sites. To obtain two parallel versions, the targets were matched in pairs of people of the same sex who were similar in age, ethnicity, gesture intensity, and physical attractiveness. Next, we added images that were displayed in the background of the profiles (i.e., cover photos) as is commonly done by Facebook users to customize their profiles. Specifically, we selected 42 images showing nonhuman motives (e.g., landscapes, monuments, or abstract patterns) that were matched in pairs of the same motive type and used as the cover photos of matched targets. Moreover, we estimated the ages of the 42 target people and randomly selected dates of birth that corresponded to the estimated ages. We then randomly chose one of the 20 most commonly used first names in the respective birth cohort (see https://www.beliebte-vornamen.de/) for each target and combined it with a randomly selected common German family name (https://de.wikipedia.org/wiki/Liste_der_häufigsten_Familiennamen_in_Deutschland). Finally, we randomly chose German cities that were used for the “lives in” sections of the Facebook pages. The selection of cities was balanced across the German federal provinces and constrained to cities with a minimum of 50,000 inhabitants, a threshold that typically safeguards common basic knowledge about a city’s geographical location. Matched pairs of targets were assigned cities from the same federal province. For each target person, the profile and cover picture, name, date of birth, and city were added to a template showing the layout of Facebook’s “about” page (August 2017) and saved as a jpeg file.
This initial set of stimuli was pretested with 42 undergraduate students who participated for course credit. On the basis of the pretest data, we discarded profiles that had yielded insufficient perceiver variance (i.e., a lack of consistent perceiver differences across targets) or low item-total correlations and made a final selection of 10 reasonably heterogeneous pairs of profiles. Specifically, the final selection of target people had a balanced sex ratio and ages that ranged from 21 to 38 years with the majority being young adults, thus mirroring the composition of German Facebook users (cf. Wiese, 2017). Two out of the 10 targets had a non-White ethnicity, mirroring the current composition of the German population (Bundeszentrale für Politische Bildung, 2018). Because we made all selection decisions for the matched pairs of profiles rather than for single profiles, the procedure resulted in two parallel test forms each consisting of 10 profiles. Sample stimuli are displayed in Figure 1a. The full host of stimuli can be retrieved from the supplemental materials (S1; available online).
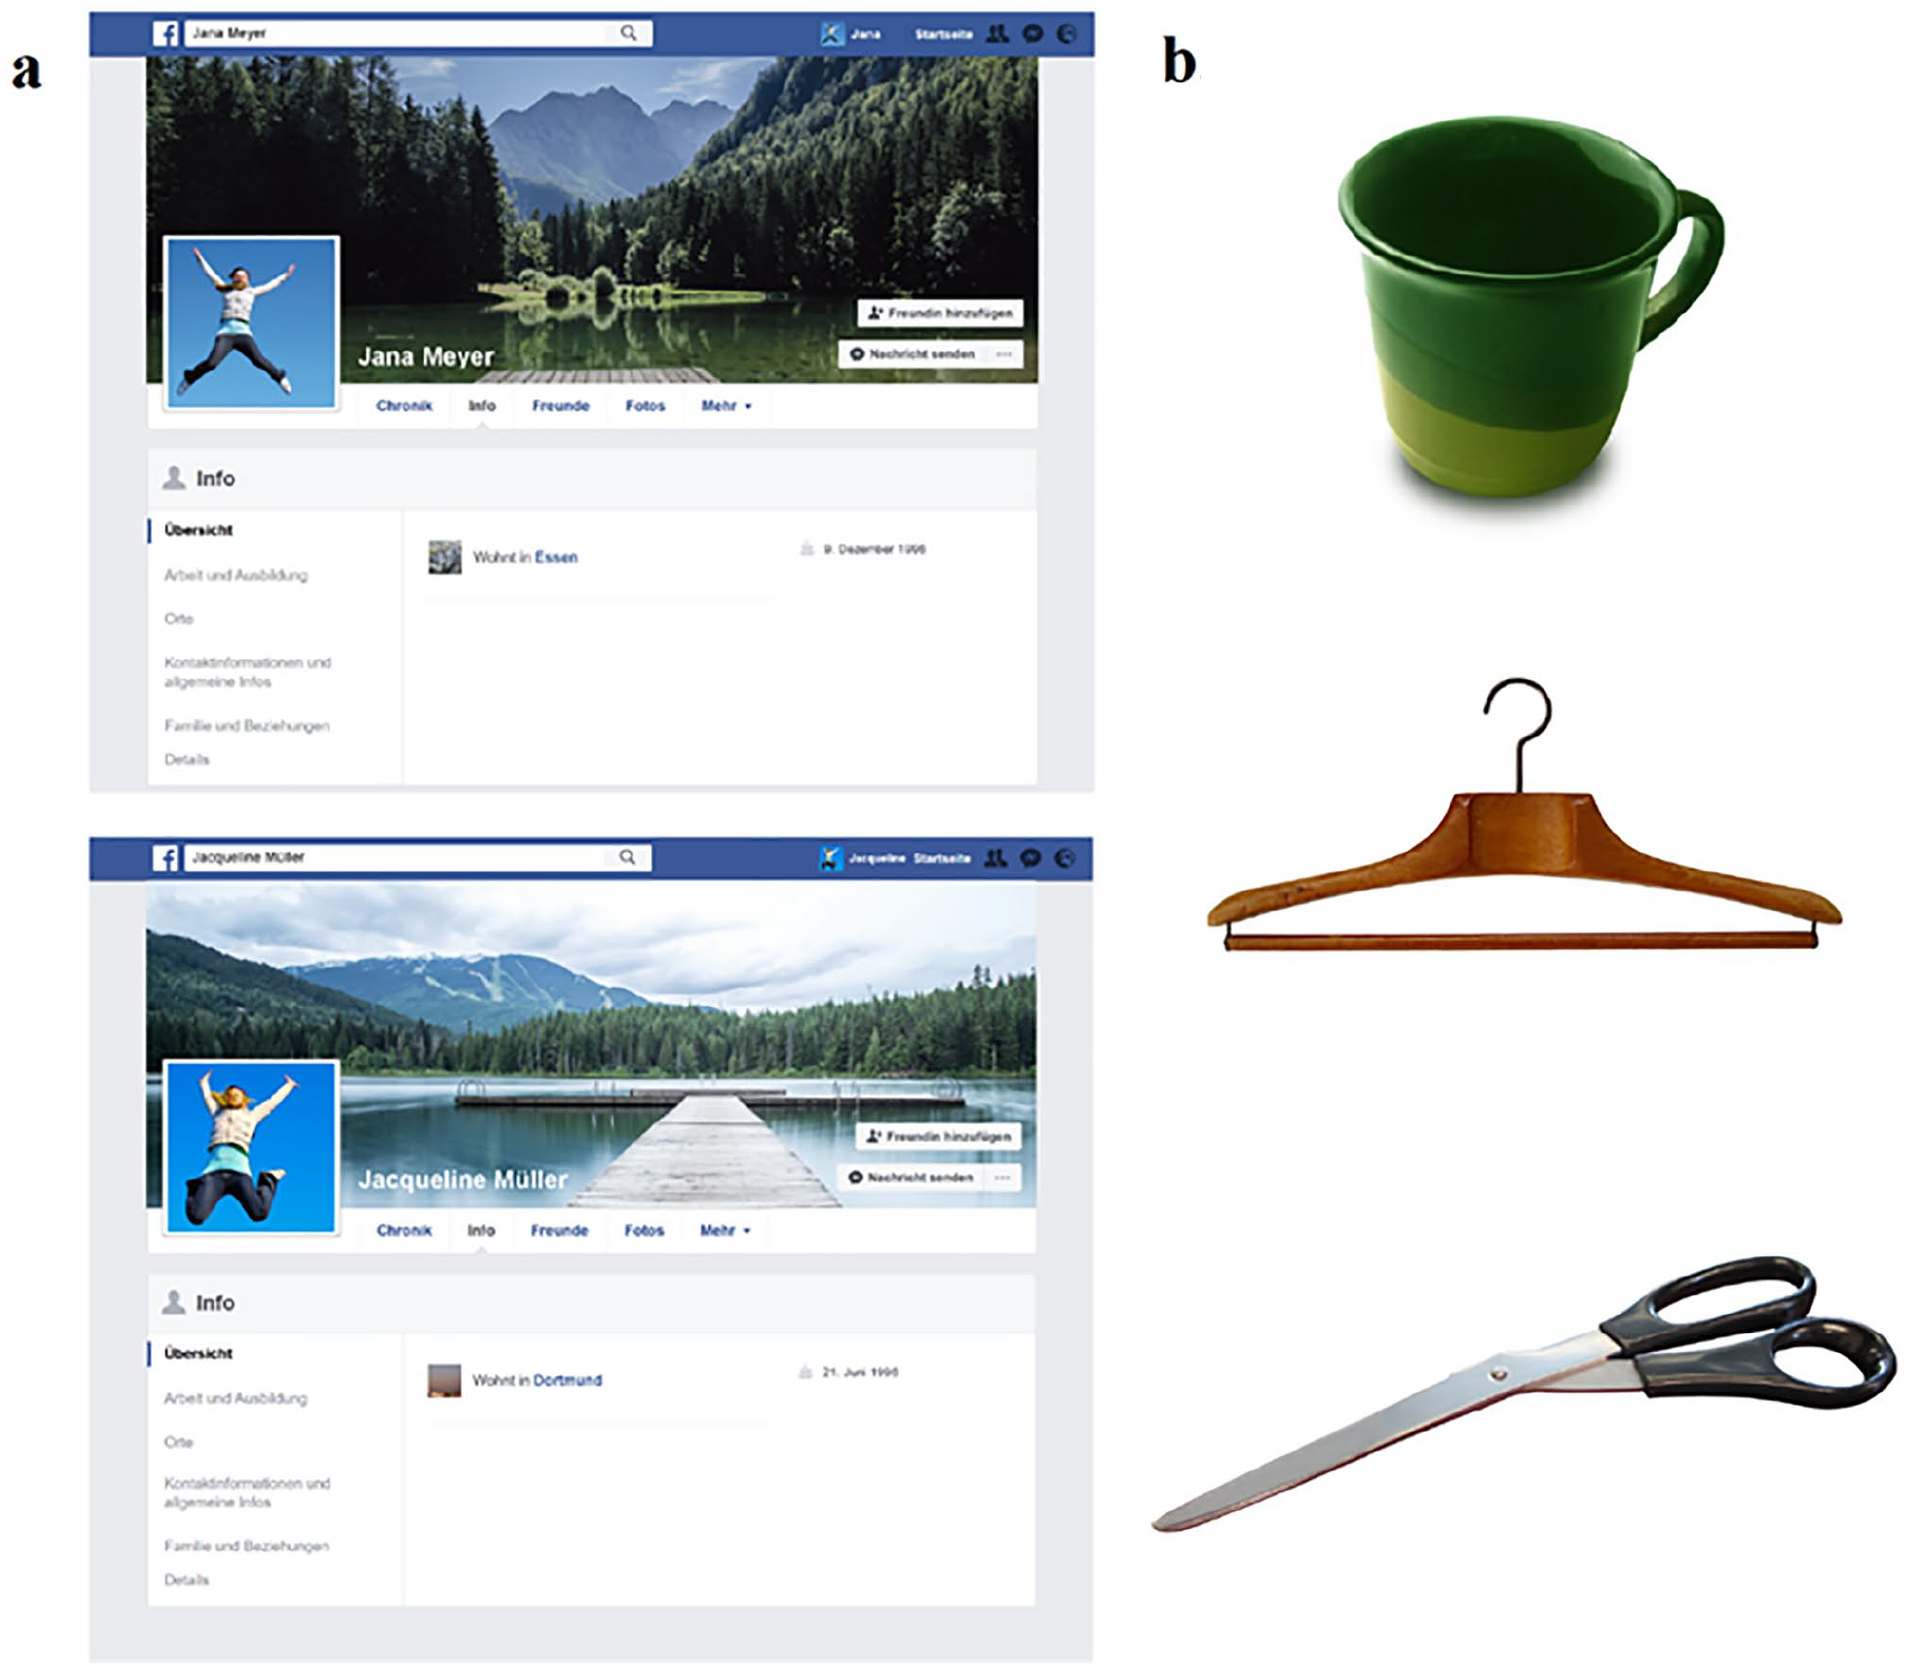
(a) Matched sample stimuli from the parallel SoN-TAPE forms and (b) sample stimuli from the ORT.
Video Stimuli
In the ViS-TAPE, we used video recordings that had been made in the context of another study (Wieck et al., 2020) displaying people who described a nonemotional, daily situation that they had actually experienced (i.e., traveling from their work place or home to a specific location in the city). All recordings were made in a video laboratory with standardized camera settings and were cut to a length of 25 to 30 seconds.
Out of the sample that completed the SoN-TAPE pretest, 30 participants also completed a pretest of 36 ViS-TAPE stimuli in exchange for course credit. As before, we matched pairs of targets who were similar in age, physical attractiveness, expressiveness, and sex and excluded videos that had yielded low perceiver variance or low item-total correlations. The final compilation of targets had a balanced sex ratio, covered an age range of 26 to 51 years, and were all White. As before, there were two parallel forms.
Object Rating Task
We implemented an object rating task (ORT) that allowed us to quantify the degree to which perceivers generally respond positively on evaluative scales. For this purpose, participants were shown photographs of 10 nonsocial objects (e.g., a mug, a hanger, scissors) in front of a white background and were asked to provide three ratings for each object (“I like this object,” “I find this object interesting,” “This object is aesthetically appealing to me”) on a scale ranging from 1 (does not apply at all) to 8 (applies perfectly). Assuming that there is no substantive reason for why, for example, people who are interested in mugs might also find hangers aesthetically appealing, average scores can be used as a measure of scale-use bias. Sample stimuli are displayed in Figure 1b. The full host of stimuli can be retrieved from the supplemental materials (S2; available online).
Method
Two hundred and twenty-six participants were recruited from various online platforms and completed an online survey involving both versions of the O-TAPE, the ORT, and a questionnaire containing self-report measures. As an incentive, participants took part in a lottery for six 10€ online shopping vouchers and were offered individualized personality feedback. Seven participants were excluded because they completed the survey in less than 15 minutes, thus indicating careless responding. The remaining 219 participants worked on the survey for an average of M = 37.24 minutes (SD = 13.13). The final sample ranged from age 18 to 71 years (M = 31.91, SD = 12.87) and consisted of 152 women (69%), 64 men (29%), and 3 participants who did not identify their gender (1%). One week after completing the first survey, participants were invited to take part in a follow-up survey featuring the parallel forms of the O-TAPE. Data were matched using a personal code generated by the participants. Participants who completed the follow-up more than 3 weeks after the first survey or whose codes could not be matched were excluded which resulted in a retest sample of n = 51 for the SoN-TAPE and n = 43 for the ViS-TAPE. 1
Person Judgments
In both versions of the O-TAPE, participants were asked to judge each target on nine dimensions using a scale ranging from 1 (does not apply at all) to 8 (applies perfectly). Ratings referred to likability (“I like this person”), physical attractiveness (“I think this person is good looking”), agency, communion, and the Big Five. Due to our need for using brief measurements, we used single items to assess the broad constructs of agency, communion and the Big Five, with each item capturing two core aspects of each construct (cf. Gosling et al., 2003). In line with the facet model of agency and communion (Abele et al., 2016), assertiveness and competence were used as indicators of agency (“This person seems assertive, competent”) and morality and warmth were used as indicators of communion (“This person seems trustworthy, empathetic”). Impressions of the Big Five were captured with the positively worded items from the German version of the Ten Item Personality Inventory (sample item: “This person seems dependable, self-disciplined.”; Gosling et al., 2003; Muck et al., 2007). 2
Basic Demographic and Physical Information
Participants’ level of education was assessed on a 5-point scale (1 = no graduation [<1%]; 2 = graduated after eighth grade [1%]; 3 = graduated after 10th grade [9%]; 4 = graduated from senior high school [32%]; 5 = college degree or higher [58%]). Income was reported on an 9-point scale (1 = no income [25%]; 2 = less than 500€ per month [16%]; 3 = between 500 and 1,000€ per month [12%]; 4 = between 1,000 and 1,500€ per month [16%]; 5 = between 1,500 and 2,000€ per month [12%]; 6 = between 2,000 and 2,500€ per month [7%]; 7 = between 2,500 and 3,000€ per month [7%]; 8 = between 3,000 and 3,500€ per month [2%]; 9 = more than 3,500€ per month [3%]). In addition, participants reported their grade point average (in reference to their highest academic degree) and physical height.
Explicit Anthropologic Beliefs
We assessed two constructs that capture explicit anthropologic beliefs. Humanity-esteem describes “the valence of a person’s evaluation of humanity” (Luke & Maio, 2009, p. 587). Participants completed an adapted and translated four-item version of the Humanity-Esteem Scale (Luke & Maio, 2009; sample item: “I take a positive attitude toward humanity”). All items were assessed on a scale ranging from 1 (does not apply at all) to 6 (applies perfectly) and were averaged after the negatively worded items were recoded (α = .72). Philosophies of human nature describe people’s assumptions about human nature regarding trustworthiness, altruism, independence, and strength of will, all of which are supposed to have a common core that reflects an evaluative nature (Wrightsman, 1992). The original measure consists of 120 items and was too lengthy to be applied in the current study. We therefore created a short measure that is inspired by the original model and assesses each attribute with a single item. For each attribute, short descriptions were used as two opposite anchors (e.g., for altruism: “In some situations, humans act completely selflessly and are solely concerned with benefitting others” and “Eventually, humans always act in their own interest, and they are never exclusively concerned with benefitting others”), and participants were asked to report how much they endorsed these statements on a scale ranging from 1 (perfect agreement with the statement on the left) to 6 (perfect agreement with the statement on the right). Responses were averaged to index global positivity in philosophies about human nature (α = .55). The original questionnaire also contains the additional subscales complexity and diversity (assessing whether others are viewed as simple vs. complex and as similar vs. diverse). We included items from these subscales for the sake of completeness, but given that they do not tap into global positivity (Wrightsman, 1992), they were not considered in the remainder of the article.
Personality Traits
We assessed participants’ agency, communion, and Big Five traits using a self-report version (item stem: “I am . . . ”) of the person judgment items used in the O-TAPE. In addition, we assessed narcissism with the Narcissistic Admiration and Rivalry Questionnaire Short Scale (Leckelt et al., 2018), which captures narcissistic admiration and narcissistic rivalry separately. Ratings were made on a scale ranging from 1 (does not apply at all) to 6 (applies perfectly), and responses were averaged within each scale (αadmiration = .70; αrivalry = .73). Dispositional contempt was measured with an adapted and translated three-item version of the Dispositional Contempt Scale (Schriber et al., 2017; sample item: “I often feel contempt for others”). All items were assessed on a scale ranging from 1 (does not apply at all) to 6 (applies perfectly) and averaged (α = .75).
Psychological Adjustment
Self-esteem was measured with six items from the German version of the Rosenberg Self-Esteem Scale (Rosenberg, 1965; von Collani & Herzberg, 2003). All items were assessed on a scale ranging from 1 (does not apply at all) to 4 (applies perfectly) and averaged after the negatively worded items were recoded (α = .86). Attachment styles were assessed using a German translation of Bartholomew and Horowitz’s (1991) measure, which gives a brief description of each attachment style prototype (e.g., for secure attachment: “It is easy for me to become emotionally close to others. I am comfortable depending on others and having others depend on me. I don’t worry about being alone or having others not accept me.”) and assesses the endorsement of each description on a scale ranging from 1 (does not apply at all) to 6 (applies perfectly). Life satisfaction was assessed with the German version of the Satisfaction With Life Scale (Diener et al., 1985; Glaesmer et al., 2011). All items were assessed on a scale ranging from 1 (does not apply at all) to 6 (applies perfectly) and averaged (α = .89).
Additional Measures
We also assessed participants’ attitudes toward unconditional basic income with a single item. The measure was included to test a hypothesis unrelated to the current research question and is therefore not considered in the remainder of the article. The measure was not correlated with the O-TAPE (rs < .08, ps >.05).
Results and Discussion
Variance Components
To quantify the relative contributions of perceiver and target effects, we estimated a two-way random effects model with random intercepts for perceivers (accounting for systematic perceiver differences across targets) and for targets (accounting for systematic target differences across perceivers). Intraclass correlations (ICCs) from this model reflect the percentage of variance attributable to characteristics of the perceiver or the target relative to the total variance in a given rating. All ICCs are displayed in Table 1.
Between-Perceiver and Between-Target Intraclass Correlation Coefficients (ICCs) for Different Trait Ratings Made for the SoN-TAPE and the ViS-TAPE.
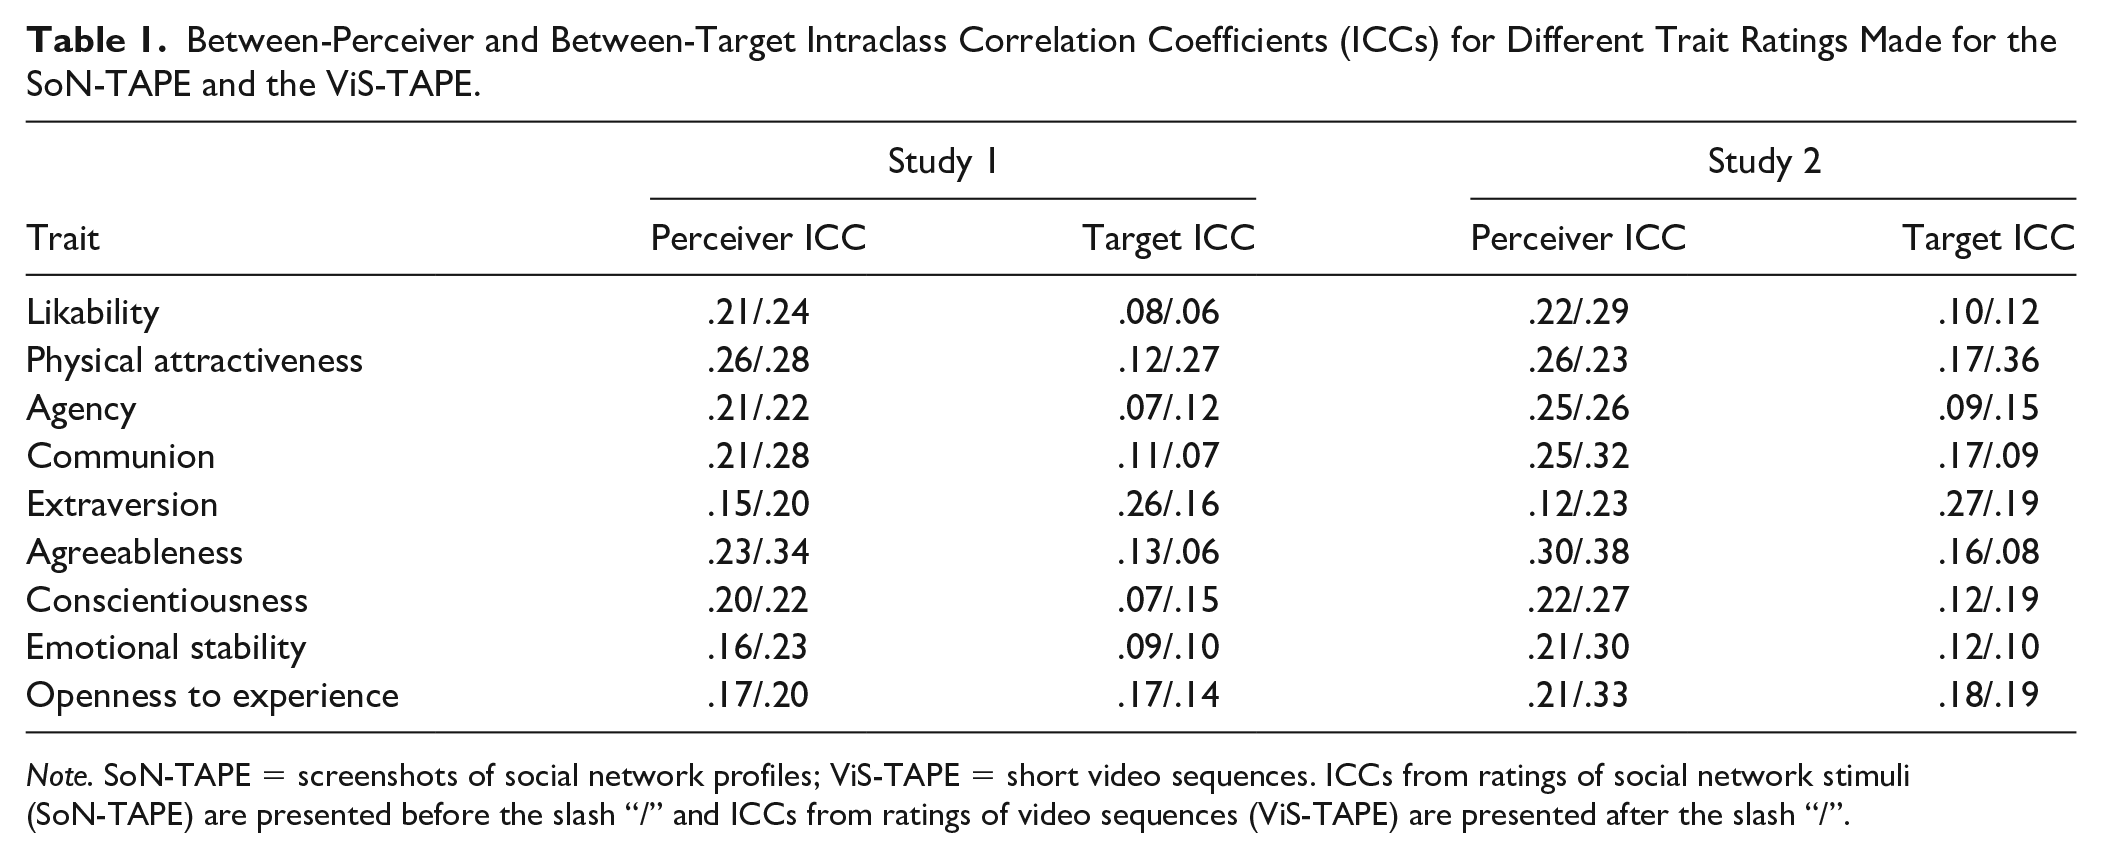
Note. SoN-TAPE = screenshots of social network profiles; ViS-TAPE = short video sequences. ICCs from ratings of social network stimuli (SoN-TAPE) are presented before the slash “/” and ICCs from ratings of video sequences (ViS-TAPE) are presented after the slash “/”.
Perceiver ICCs were substantially larger than zero, indicating that judgments were indeed driven by consistent differences between perceivers’ general judgment tendencies (i.e., perceiver effects). Furthermore, target ICCs were also considerably larger than zero, indicating that judgments were also driven by consensually perceived differences between targets (i.e., target effects). In line with findings in person perception research, perceiver variance was mostly around 20% to 30% and was somewhat larger than target variance (Hehman et al., 2017; Kenny, 1994; Xie et al., 2019).
The Structure of Perceiver Effects
We then examined whether perceivers’ tendency to view others as high or low on one trait was associated with their tendency to also view others as high or low on other traits. To do so, we first obtained perceiver effect scores by aggregating the ratings that came from the same perceiver and pertained to the same trait across targets (all internal consistencies were between α = .68 and α = .86). We then correlated these trait-level perceiver effect scores (see Table 2).
Correlations Among Perceiver Effects for Different Traits in Study 1 (Lower Triangle) and Study 2 (Upper Triangle).
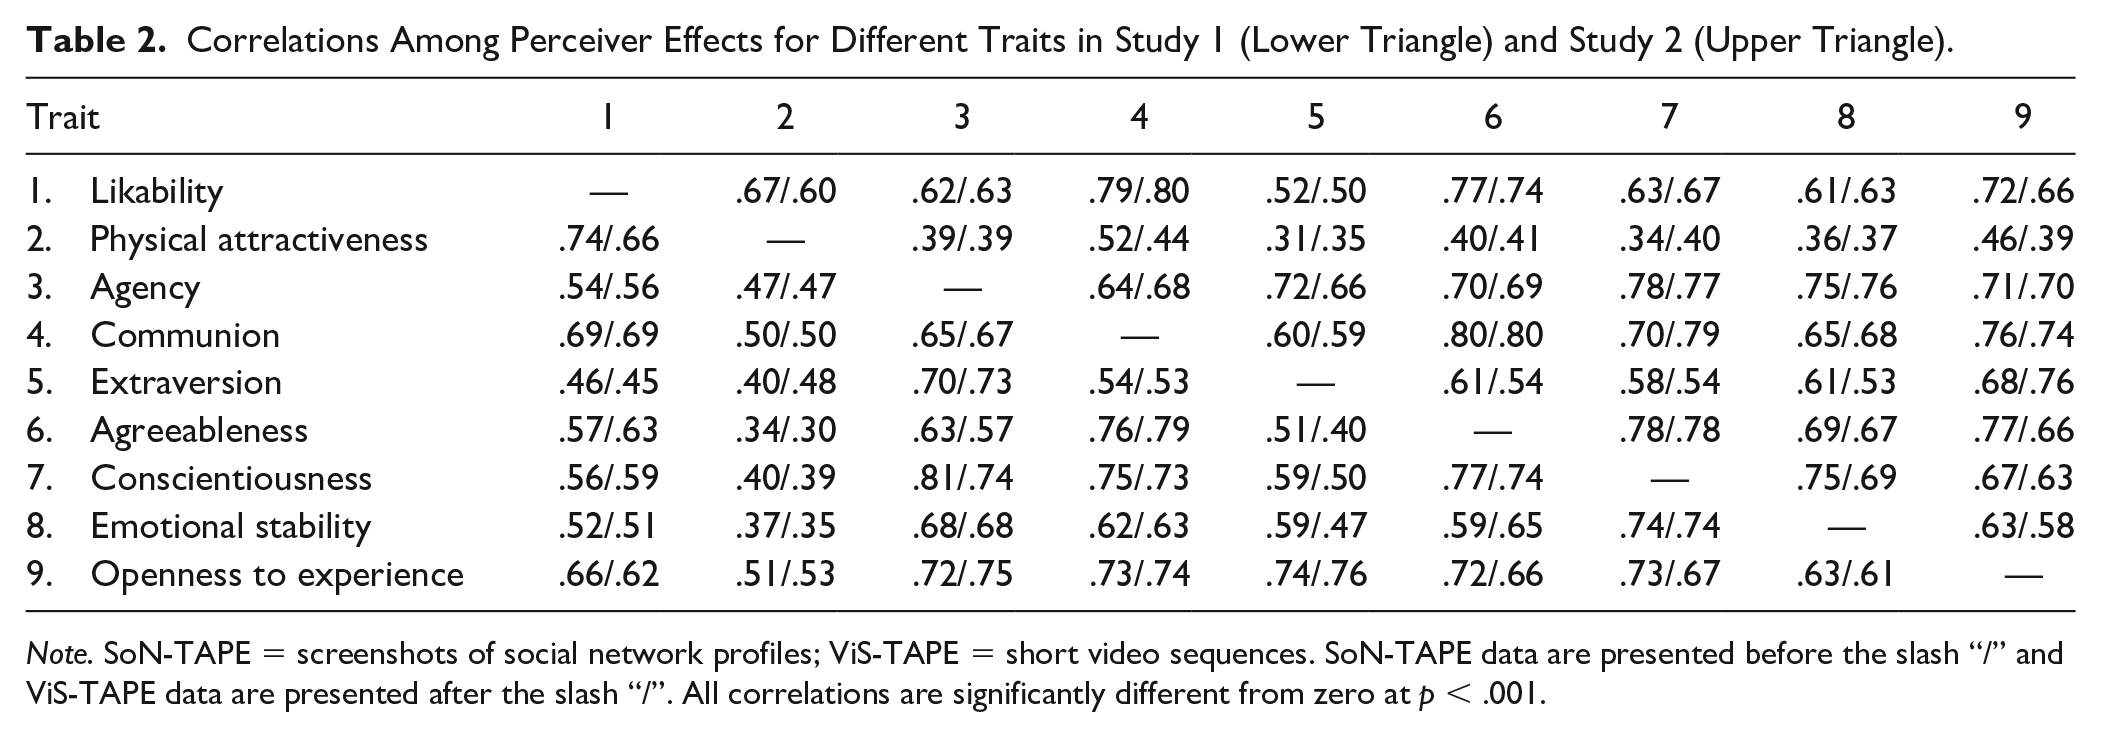
Note. SoN-TAPE = screenshots of social network profiles; ViS-TAPE = short video sequences. SoN-TAPE data are presented before the slash “/” and ViS-TAPE data are presented after the slash “/”. All correlations are significantly different from zero at p < .001.
All correlations were positive and quite large in size. Because all items were coded in the same direction with respect to social desirability, this correlational pattern suggests that perceivers who judged others as more favorable on one trait tended to do so on other traits as well. Correspondingly, a principle component analysis (PCA) confirmed that perceiver effects could adequately be described by a single component (eigenvalues for the SoN-TAPE: 5.93, 0.96, 0.63, 0.44, etc.; eigenvalues for the ViS-TAPE: 5.82, 0.95, 0.77, 0.45, etc.) capturing perceivers’ tendencies toward making globally positive versus negative judgments (all factor loadings were between λ = .63 and λ = .89). For the remaining analyses, we extracted this component’s factor scores and refer to them as generalized other-perceptions. In light of the homogenous factor loadings, we also computed simple mean scores across trait-level perceiver effects and examined if these scores could serve as a viable (and more convenient) alternative to factor scores. Mean scores were strongly correlated with factor scores (r > .99 for both types of stimuli).
Reliability and Convergent Validity
To learn how reliably the O-TAPE captured generalized other-perceptions, we computed coefficient alpha across the nine trait perceiver effects, which suggested excellent reliability (α = .93 for both types of stimuli). Furthermore, we computed the correlation between the O-TAPE scores captured with parallel forms of the SoN-TAPE and ViS-TAPE over a time interval of 2 weeks. The correlations were substantial (rSoN = .69, 95% confidence interval [CI: .52, .81]; rViS = .82, 95% CI [.69, .90]) which highlights that both instruments measured perceiver effects with high precision across different time points and with different sets of stimuli. Finally, convergence between the scores from the SoN-TAPE and the ViS-TAPE was high, r = .72, 95% CI [.65, .78].
Overlap With Scale-Use Bias
To learn whether the ORT reliably captured differential evaluative tendencies in judgments of nonsocial stimuli, we ran the same analyses as for the O-TAPE. Perceiver differences accounted for a substantial amount of the overall variance in ratings (ICCliking = .15; ICCinteresting = .18; ICCaesthetic = .11). Once again, perceiver effects were highly correlated across the three rating dimensions (all rs ≥ .65) and could be explained by a single component (eigenvalue = 2.38; α = .87). We extracted factor scores and used them as a measure of scale-use bias. Overlap between scale-use bias and generalized other-perceptions was statistically significant but modest in size (SoN-TAPE: r = .30, 95% CI [.18, .42]; ViS-TAPE: r = .29, 95% CI [.17, .41]). This suggests that perceiver effects in person impressions partly reflect response tendencies and that this might be a threat to internal validity when perceiver effects are correlated with self-reported criterion variables. Thus, we regressed generalized other-perceptions on scale-use bias and used the residual variable as an unconfounded measure of generalized other-perceptions in all remaining analyses.
Nomological Network
To learn about the psychological meaning of generalized other-perceptions as measured with the SoN-TAPE and ViS-TAPE, we examined their relations with basic demographic and physical variables, explicit anthropologic beliefs, personality traits, and indicators of psychological adjustment (Table 3).
Nomological Network of Generalized Other-Perceptions Measured With the O-TAPE (Controlling for Scale-Use Bias).

Note. O-TAPE = Online-Tool for Assessing Perceiver Effects; SoN-TAPE = screenshots of social network profiles; ViS-TAPE = short video sequences. nStudy 1 = 191 to 219; nStudy 2 = 137 to 142 (varying due to selectively missing data). Pearson correlations with the SoN-TAPE are presented before the slash “/” and correlations with the ViS-TAPE are presented after the slash “/”. Coefficients in bold are significantly different from zero (p < .05).
Kendall’s correlation coefficient was used because the data were ordinal.
Concerning basic demographic variables, the finding of greater positivity in ratings made by women compared with ratings made by men was replicated for both measures. Furthermore, higher education was consistently associated with less positive other-perceptions, whereas no substantial associations existed with income and grade point average. This suggests a more discerning judgment style among perceivers who belong to social classes with high formal education but not among those with high monetary or concrete academic achievements. Furthermore, age and height were not consistently associated with generalized other-perceptions. Concerning explicit anthropologic beliefs, perceivers whose person impressions were positively biased did not indicate a particularly positive affective attitude toward the human species in general (humanity-esteem), but they believed more strongly in the existence of trustworthiness, altruism, independence, and strength of will (philosophies of human nature) compared with negatively biased perceivers. With regard to personality traits, communion and agreeableness were consistently positively correlated with positivity in other-perceptions, whereas narcissistic rivalry and dispositional contempt were consistently negatively correlated with positivity in other-perceptions, a finding that fits in well with the substantive qualities of these constructs. Furthermore, extraversion and openness to experience were correlated with positive generalized other-perceptions, but these associations were more modest in size. Concerning psychological adjustment, there were no consistent relations that suggested that a positive value on generalized other-perception was not a strong indicator of psychological functioning.
Finally, we ran several additional analyses (see Appendix A): We checked whether a different nomological network would be obtained when we used raw scores that were not adjusted for scale-use bias. However, the result pattern was very similar when we did not control for the ORT scores. In line with this, ORT scores were not correlated with any of the validation variables. Finally, the nomological network was essentially identical when mean scores instead of factor scores were used.
Study 2
In Study 2, we aimed to directly replicate the findings from Study 1 in an independent sample. In addition, we designed Study 2 to overcome two shortcomings of Study 1. First, in Study 1, the Big Five and Big Two personality traits were assessed with single items and thus had unknown reliability. In Study 2, we included multi-item scales to measure the personality traits so that we could estimate their reliabilities. Second, it remained unclear from Study 1 whether generalized other-perceptions measured with the O-TAPE could be used to predict people’s perceptions of other people in a real-life group setting. Therefore, Study 2 featured mutual first impressions captured in a naturalistic face-to-face setting, thus allowing a direct test of ecological validity.
Method
In Study 2, we analyzed data from n = 142 participants who completed both versions of the O-TAPE as well as the ORT in exchange for course credit and monetary compensation. Participants were psychology students from three different cohorts (n1 = 19, n2 = 51, n3 = 72). The sample size was not determined by consideration about statistical power but by the sizes of the available cohorts. The obtained sample size yielded 70% power to detect effects of ρ = .20 at an alpha level of .05 in a two-sided test.
For each cohort, there was a welcoming event on the first day of the semester that involved the assessment of mutual first impressions. On arriving on campus, participants were requested not to talk to each other, were guided to a lecture hall, and were randomly seated. After being welcomed and providing informed consent, each student in turn gave a brief self-introduction, while the others made judgments about him or her using a rating sheet (for a similar procedure, see Back et al., 2010; Rau et al., 2019).
Two weeks after the initial group meeting, all participants completed both versions of the O-TAPE as well as the ORT. In addition, the first cohort also completed the same self-report questionnaires that were used in Study 1. The second and third cohorts completed a more comprehensive self-report questionnaire 1 week after the initial group meeting. 3 In addition, the third cohort completed the aforementioned parallel forms of both versions of the O-TAPE 4 weeks after the initial group meeting. In the total sample, participants ranged in age from 18 to 42 years (M = 20.84, SD = 3.51); 115 were women (81%), 23 were men (16%), and 3 did not identify their gender (2%).
Validation Measures
We did not include assessments related to education or income given that these variables tend to be largely invariant across participants from the same college cohort. Measures of explicit anthropologic beliefs, narcissism, dispositional contempt, and psychological adjustment were the same as in Study 1. The internal consistencies of the scales were comparable (humanity-esteem: α = .62; philosophies of human nature: α = .46; narcissism: αadmiration = .75, αrivalry = .57; dispositional contempt: α = .80; self-esteem: α = .86; life satisfaction: α = .85).
Broad personality traits
Agency and communion were measured with an adapted version of the Self-Attributes Questionnaire (Pelham & Swann, 1989) that incorporated items from the Interpersonal Adjective List (Jacobs & Scholl, 2005) in the second and third cohorts. Participants were asked to indicate their relative standing on agentic attributes (“assertive,” “independent,” “dominant,” “leadership ability,” and “insecure” [reverse keyed]) and communal attributes (“helpful,” “sensitive,” “trustworthy,” “affectionate,” and “cold-hearted” [reverse keyed]) on 10 response options referring to the lower or upper 50%, 30%, 20%, 10%, or 5% of a normal distribution. Responses were averaged to index agency (α = .82) and communion (α = .80; see Rau et al., 2019). The Big Five personality traits were assessed with a 15-item Big Five Inventory originally developed for the German Socioeconomic Panel (BFI-S; Schupp & Gerlitz, 2014). The BFI-S has satisfactory psychometric properties with the exception of low reliability in the measurement of agreeableness (Hahn et al., 2012). Therefore, we supplemented the instrument with the two agreeableness items from the BFI-10 (Rammstedt & John, 2007), which resulted in acceptable to satisfactory reliabilities for all domains (αA = .66; αC = .58; αE = .85; αES = .67; αO = .54). In addition, we assessed the same single-item measures of the Big Two and the Big Five as in Study 1 in the first and the third cohorts. Thus, different measures were available across cohorts (Cohort 1: single-item measures; Cohort 2: scale measures; Cohort 3: singe-item and scale measures). To include as much information as possible, we averaged the two measures in the third cohort. To control for cohort effects, we standardized all variables within cohorts.
Perceiver effects in real-life first impressions
For external validation, we extracted perceiver effects from the mutual ratings in the initial group meeting. Given that the participating students were meeting their future peer group for the first time, the situation was subjectively highly important for them, and perceiver effects extracted from their mutual impression ratings reflected a maximally naturalistic validity criterion for perceiver effects from the O-TAPE. Each person was rated on three dimensions. Likability (I don’t like this person at all—I like this person a lot), agency (this person is submissive, insecure—this person is dominant, self-confident), and communion (this person is cold-hearted, manipulative—this person is affectionate, trustworthy) were rated on a scale ranging from 0 to 5. As a control variable, participants also indicated how familiar the target was to them (ranging from 0 = I have never met this person before to 5 = this person is a good friend of mine). In all three cohorts, the level of familiarity was quite low (with means ranging from 0.11 to 0.26 and SDs ranging from 0.48 to 0.88), indicating that the vast majority of participants were indeed strangers to one another.
We analyzed ratings of liking, agency, and communion by running social relations analyses 4 using the R-package (R Development Core Team, 2008) TripleR (Version 1.5.3, Schönbrodt et al., 2012). We found that perceiver effects accounted for a considerable proportion of variance on all three rating dimensions (22%, 17%, and 15% for liking, agency, and communion, respectively) and saved the group-mean-centered perceiver effect scores (reliabilities rliking = .94, ragency = .91, rcommunion = .93). The PCA on the perceiver effect scores revealed that there was a prominent first component (eigenvalues: 2.16, 0.65, and 0.19) that captured the positivity of ratings (all loadings on the first component were positive). We saved scores on the first component as an index of positivity in other-perceptions in real-life first impressions (α = .80).
Results and Discussion
In almost any regard, Study 2 replicated the pattern of results from Study 1. The contributions of variance by perceivers and targets (Table 1) and the covariance structure of trait-level perceiver effects (Table 2) were very similar to Study 1. 5 The same is true for the internal consistency of trait-level perceiver effects (between α = .66 and α = .88), for the internal consistencies of generalized other-perceptions across traits (αSoN-TAPE = .94; αViS-TAPE = .93), for retest reliability (rSoN = .75 [95% CI: .62; .84]; rViS = .80 [.70; .87]), and for the convergence between the SoN-TAPE and ViS-TAPE scores (r = .82, 95% CI [.76, .87]). Furthermore, the association with scale-use bias as measured with the ORT (α = .87) was once again statistically significant but small in size (rSoN-TAPE = .21, 95% CI [.05, .37]; rViS-TAPE = .21, 95% CI [.04, .36]), and we controlled for ORT scores in all of the remaining analyses. In the following, we will focus on a closer discussion of the novel contributions of Study 2.
Nomological Network
The nomological network in Study 2 was largely comparable to the one found in Study 1. However, the associations were statistically significant less often than in Study 1 which can probably be explained by the lower statistical power. Crucially, however, the pattern of more positive other-perceptions among more communal and agreeable perceivers was robust. Furthermore, there were once again negative associations between positivity in other-perceptions and narcissistic rivalry and dispositional contempt, but the correlation with narcissistic rivalry was not statistically significant. Correlations with philosophies of human nature and extraversion were very close to zero, thus suggesting that the significant coefficients in Study 1 should be interpreted with caution. In line with Study 1, there were no associations between generalized other-perceptions and psychological adjustment. Paralleling Study 1, highly similar nomological networks were observed when we did not control for scale-use bias and when we used mean scores instead of factor scores (see Appendix A).
Prediction of Real-Life First Impressions
As displayed in Table 4, there was a substantial correlation between the O-TAPE and perceivers’ generalized other-perceptions measured on their welcoming day at the university. To examine whether the O-TAPE could predict real-life perceiver effects above and beyond scale-use bias, basic demographic variables, explicit anthropologic beliefs, and personality traits, we computed hierarchical regression analyses by adding these predictors in a stepwise fashion with the O-TAPE added last. The results are displayed in Table 4. Both the SoN-TAPE and the ViS-TAPE made substantial unique contributions toward explaining the positivity of first peer impressions and could alone account for almost the same amount of variance as was accounted for by the other 15 predictors combined. It is noteworthy that explicitly expressed other-perceptions as captured by the humanity-esteem and philosophies of human nature dimensions did not significantly predict real-life perceiver effects. One explanation for this could be the low reliability of the measures, but another possibility was that their validity was impaired by the limitations of the self-report method.
Prediction of Positivity in First Impressions of Classmates on the First Day of Classes at the University.

Note. n = 130. ORT = object rating task; SoN-TAPE = screenshots of social network profiles; ViS-TAPE = short video sequences.
Finally, we also explored the nomological network of real-life perceiver effects to learn whether their correlates were similar to the ones from the O-TAPE. The pattern of results was quite similar, but the correlations were slightly weaker on average (see Appendix A). This corroborates the claim that the O-TAPE’s ability to capture generalized other-perceptions is not inferior to the much less economic approach of collecting mutual ratings in actual groups of strangers and obtaining perceiver effects via social relations analysis (Kenny, 1994). In fact, it illustrates an important conceptual difference between perceiver effects computed from the O-TAPE versus from round-robin data: Whereas they both are to some degree influenced by scale-use bias, the substantive variance in the O-TAPE exclusively taps into the tendency to view others in certain ways in general, but round-robin perceiver effects tap into the tendency to view others in certain ways within a given social context. In the latter case, perceiver effects reflect a blend of general influences and context-specific influences (e.g., social realities or group-stereotypes).
In sum, Study 2 confirmed the basic psychometric findings about the factor structure and reliability of the O-TAPE and refined the nomological network found in Study 1. In addition, Study 2 demonstrated that the O-TAPE predicted how positively perceivers viewed others in a naturalistic context beyond scale-use bias, demographic variables, measures of explicit anthropologic beliefs, and conventional personality scales.
Study 3
Although findings from Studies 1 and 2 were promising, some issues deserved further consideration in a third study. First, we contended that one of the central assets of the O-TAPE is its insusceptibility to influences of social desirability but we did not directly test this claim empirically in Studies 1 and 2. In Study 3, we directly examined the O-TAPE’s relation with socially desirable responding.
Second, the O-TAPE was largely unrelated to the measures of attachment styles in Studies 1 and 2. Yet it has been argued that individual differences in adult attachment are best conceptualized dimensionally (rather than in terms of prototypes; Brennan et al., 1998) and thus, we sought to learn whether different results would be obtained with a dimensional measure of avoidance and anxiety in adult attachment.
Third, in the previous studies, we found several personality traits along a continuum from communal/prosocial to antagonistic/antisocial to be related to generalized other-perceptions in Studies 1 and 2. In order to zoom in on this, we adopted the HEXACO personality model (Lee & Ashton, 2004) to qualify the nomological network of the O-TAPE in Study 3. The HEXACO model distinguishes between honesty–humility (the tendency to be fair and modest) and agreeableness (the tendency to be forgiving and tolerant) and thus allowed us to explicitly address both active (honesty–humility) and reactive (agreeableness) aspects of prosociality.
Fourth, we also explored a somewhat radically economical approach to investigate generalized other-perceptions as a potential alternative to the O-TAPE: We asked participants to judge just one target—the “typical person.” This may be seen as the most direct measure of explicit and generalized other-perceptions and we were interested in its overlap with the O-TAPE as well as in its ability to elicit a similar nomological network.
Studies 1 and 2 pointed toward several ways in which the practical applicability of the O-TAPE could be enhanced. Specifically, there was no indication that either type of stimuli was superior in tapping generalized other-perceptions and thus, given that the social network stimuli are easier to implement and less time consuming for participants, we only used the SoN-TAPE (referred to as O-TAPE from here) in Study 3. Furthermore, highly similar nomological networks were observed in Studies 1 and 2 both when O-TAPE scores were adjusted for scale-use bias and when they were not. Therefore, we refrained from administering the ORT in Study 3. Moreover, results were almost identical no matter whether average scores or factor scores were used in Studies 1 and 2. Thus, for the sake of simplicity, we used average scores in Study 3.
Method
Participants and Procedure
An initial sample of n = 202 was recruited via newsletters and social media postings to complete an online survey implemented on the online platform formr.org (Arslan et al., 2018). The sample size resulted from our desire to have 80% power to detect associations of ρ = .20 in a two-sided test. The median duration for completing the O-TAPE was 6 minutes (21 minutes for the full survey). Two participants were excluded because they completed the survey overly quickly (<10 minutes). Participants ranged in age from 17 to 72 years (M = 28.04, SD = 10.42); 157 were women (79%) and 43 were men (22%). They were offered monetary compensation 6 and personality feedback at the end of the survey.
Social Desirability
Socially desirable responding was as-sessed using the German version of the Balanced Inventory of Desirable Responding (Musch et al., 2002; Paulhus, 1994). The instrument captures the dimensions impression management (IM; self-enhancement in the domain of agency) and self-deceptive enhancement (SDE; self-enhancement in the domain of communion; Paulhus, 2002). Internal consistencies were αIM = .66 and αSDE = .62.
Attachment
Fear and avoidance in adult attachment were assessed using the German short version of the Experiences in Close Relationships–Revised questionnaire (Brenk-Franz et al., 2018; Fraley et al., 2000). Internal consistencies were αanxiety = .80 and αavoidance = .84.
Broad Personality Traits
Broad personality traits were assessed with the German 60-item version of the HEXACO-PI-R (Lee & Ashton, 2004). Internal consistencies were αE = .72, αA = .79, αC = .78, αES = .78, αO = .69, and αHH = .75.
Perceptions of the Typical Person
Participants were instructed as follows: “Please complete the following questions with respect to a typical person. Just chose whichever option you consider to be most normal or average without thinking of particular groups of people: A typical person is . . . ” Then, the same rating scales were presented as in the O-TAPE. However, “I like this person” and “I think this person is good-looking” were omitted given that these items cannot be judged for a typical person. Internal consistency across the seven rated traits was α = .82, which points toward a common underlying dimension (i.e., positivity). Note that we assessed perceptions of the typical person before administering the O-TAPE because otherwise, participants might have tried to actively reproduce their average ratings from the O-TAPE.
Results and Discussion
The basic psychometric findings from Studies 1 and 2 were once again confirmed. Internal consistencies of trait-level perceiver effects were between .62 and .81 and their covariance structure was largely in line with a unidimensional model. 5 Averaging all trait-level perceiver effects resulted in a highly reliable index of positivity in generalized other-perceptions, α = .92.
The key results are presented in Table 5. Associations between the O-TAPE and SDE and IM were weak and not statistically significant suggesting that the O-TAPE is largely unsusceptible to influences of socially desirable responding. Furthermore, generalized other-perceptions were unrelated to fear and avoidance in adult attachment. Corroborating the findings from Studies 1 and 2, O-TAPE scores were positively related to being female rather than male and to communal and prosocial personality traits. More specifically, individuals both with a tendency to be fair and modest (high honesty–humility) and with a tendency to be forgiving and tolerant (high agreeableness) were found to have more positive generalized other-perceptions.
Nomological Network of Generalized Other-Perceptions Measured With the O-TAPE and With Perceptions of a “Typical Person” in Study 3.
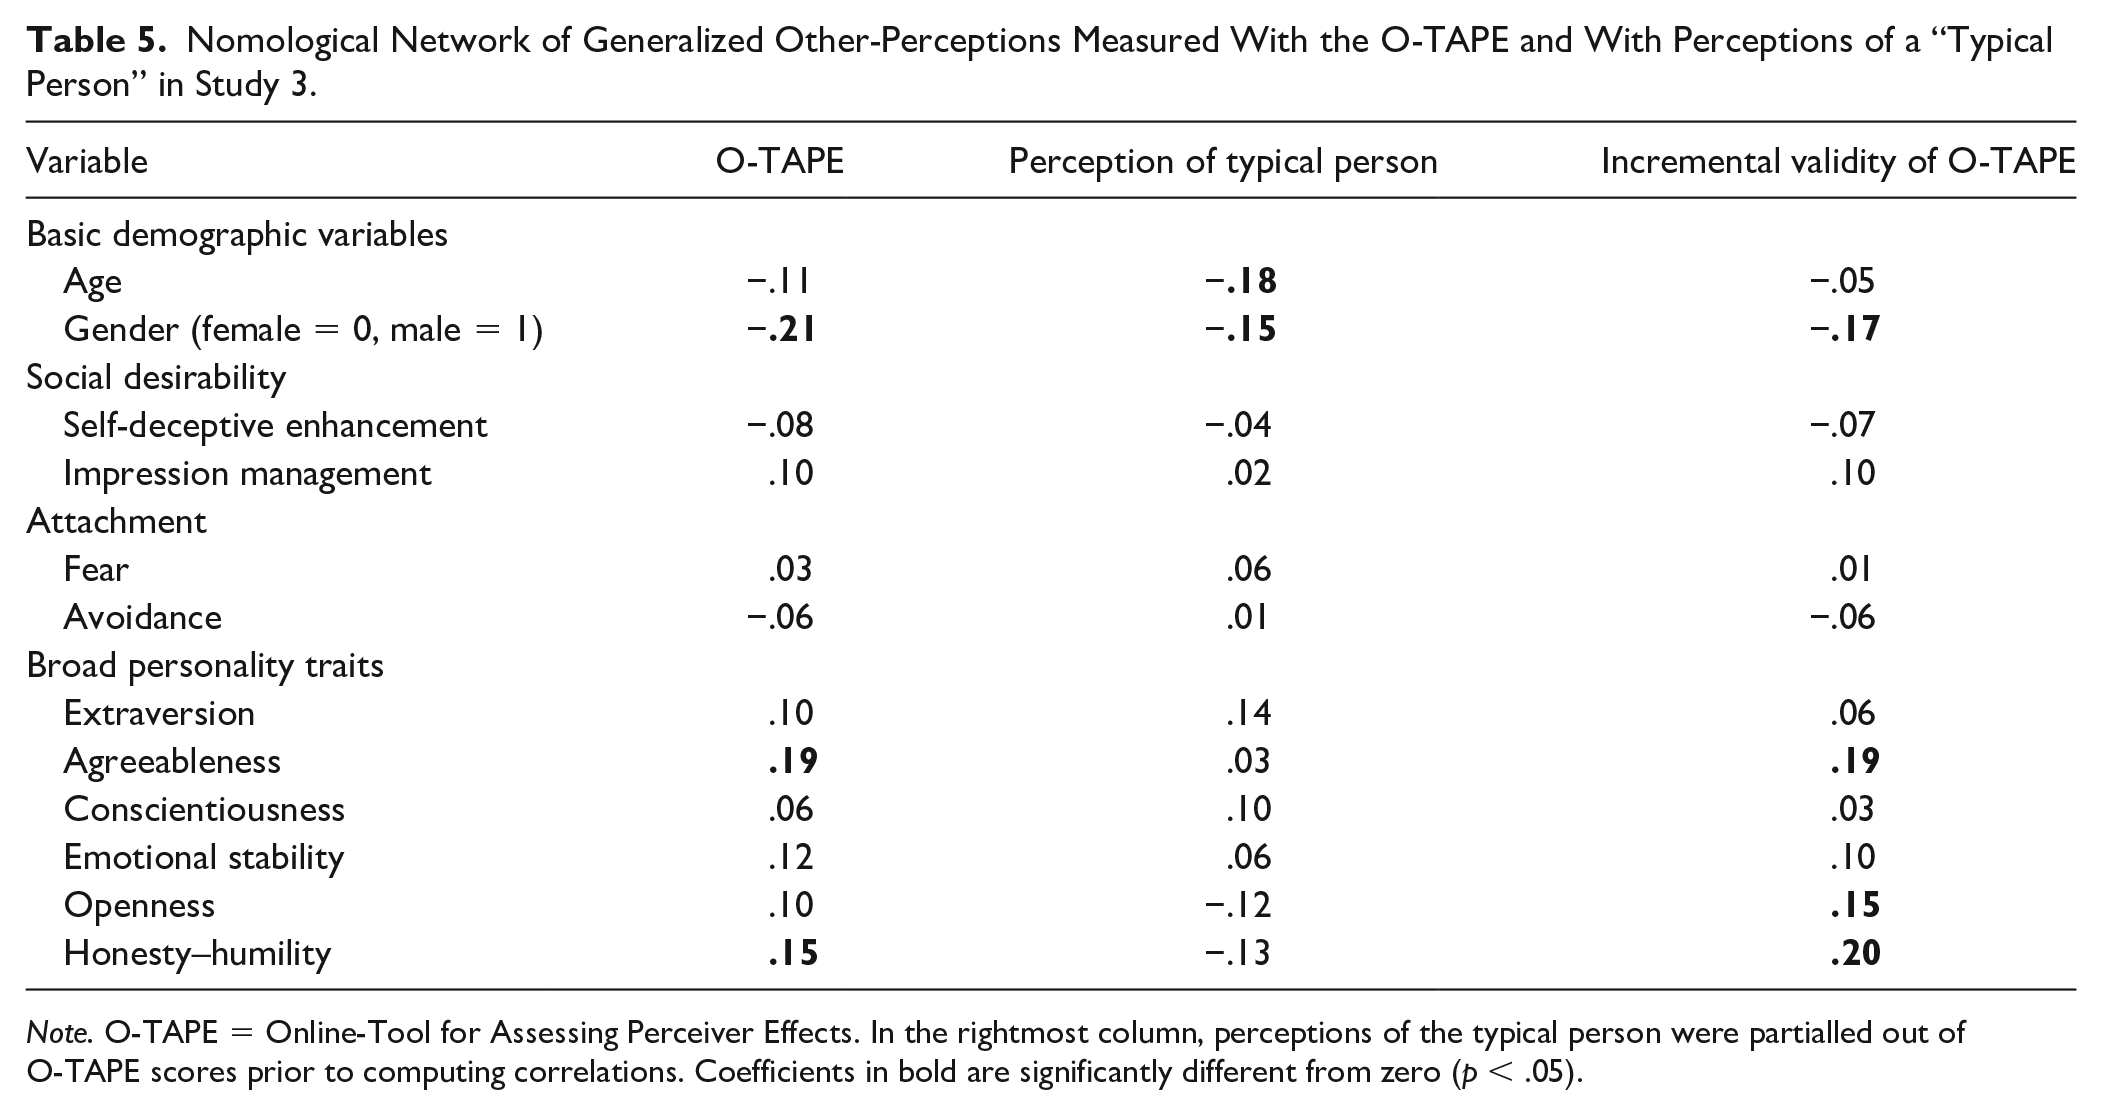
Note. O-TAPE = Online-Tool for Assessing Perceiver Effects. In the rightmost column, perceptions of the typical person were partialled out of O-TAPE scores prior to computing correlations. Coefficients in bold are significantly different from zero (p < .05).
Finally, approximating generalized other-perceptions by having participants rate, “the typical person” did not prove to be a viable alternative to the O-TAPE. Positivity in these ratings was moderately correlated with the positivity score from the O-TAPE, r = .33, 95% CI [.20, .45], but failed to demonstrate associations with agreeableness or honesty–humility (Table 5). As a further marker of incremental validity, the nomological network of the O-TAPE was hardly affected when we controlled for the typical-person measure.
General Discussion
In the current research, we introduced the O-TAPE, a measurement tool that objectively and reliably captures individual differences in the positivity of generalized other-perceptions. We developed two versions of the tool that use different types of stimuli: screenshots of social network profiles (SoN-TAPE) and short video sequences (ViS-TAPE). In both versions, perceivers differed considerably in how they judged a standardized set of individuals, and these perceiver differences could be aggregated into a score with excellent internal consistency, reflecting the positivity in judgments made across different targets and traits. Furthermore, in Studies 1 and 2 the two instruments demonstrated good convergent validity and showed remarkable retest reliability when we administered parallel forms in a time interval of 1 to 3 weeks. Moreover, the O-TAPE was able to predict generalized other-perceptions in a real-life context in Study 2.
The nomological network analyses established robust convergent and divergent relationships with a number of individual difference constructs across two heterogeneous online samples (Studies 1 and 3) and a student sample (Study 2). Most notably, more positive generalized other-perceptions were associated with several interpersonally relevant personality characteristics such as high communion, high agreeableness, high honesty–humility, low dispositional contempt, and (albeit less consistently) narcissistic rivalry. This suggests that generally positive versus negative views of others underlie many personality traits tapping differences on the continuum from communal/prosocial to antagonistic/antisocial. Furthermore, some demographic variables (i.e., gender and education) were associated with generalized other-perceptions. The gender effect converges with previous research reporting more positive generalized other-perceptions among women (Srivastava et al., 2010; Winquist et al., 1998; Wood et al., 2010) and indicates that women might be more mellow in their social judgments. The education effect indicates that the better people are educated, the less positive their other-perceptions are. A potential explanation could be that a good education goes along with a sense of self-importance and haughtiness, but this explanation is speculative and might be addressed in future research. Other characteristics such as openness to experience, conscientiousness, height, explicit anthropologic beliefs, and psychological adjustment were not or were not consistently linked to generalized other-perceptions. Finally, the O-TAPE predicted how positively or negatively students viewed their future classmates when they met them for the first time on a welcoming day at their university in Study 2. This suggests that the O-TAPE captures generalized other-perceptions in an ecologically valid way. Importantly, we ruled out the possibility that the correlations were driven by general scale-use bias. Thus, the results are informative, specifically about the positivity in generalized other-perceptions rather than about a global tendency to provide rather positive or negative evaluations on rating scales in general. Finally, we also demonstrated that O-TAPE scores are unaffected by differences in socially desirable responding.
Applications and Adaptations of the O-TAPE
Which version of the O-TAPE should be applied? The results of Studies 1 and 2 suggest that neither version should be preferred on the basis of psychometric properties. However, it might be wise to use the ViS-TAPE rather than the SoN-TAPE when studying populations that are not familiar with online social networks (e.g., elderly people). Yet, in most other contexts, it might be advisable to use the SoN-TAPE rather than the ViS-TAPE for pragmatic reasons. Specifically, the material of the SoN-TAPE can be adjusted for other languages and the technical implementation of images into online survey platforms is usually easier than the implementation of videos. For these reasons, we only administered the SoN-TAPE in Study 3. There, completing the measure took most participants between 5 and 8 minutes (interquartile range), suggesting that researchers can draw on it even when there are time constraints.
Moreover, the clear unidimensional factor structure of trait perceiver effects and the high internal consistency of positivity scores suggest that it would not be problematic to reduce the number of traits rated per target in future studies in order to obtain an even shorter instrument that still warrants a highly reliable and valid measurement of generalized other-perceptions. For this purpose, assessing impressions of at least five (sufficiently evaluative) traits should be adequate. To establish unidimensionality, samples sizes should be 200 or larger. At the same time, we advise against reducing the number of rated targets given that large target heterogeneity is crucial to warrant the generality of the measured construct. Importantly also, Study 3 emphasized that solely assessing people’s perceptions of “a typical person” without providing actual target stimuli does not do the job.
Researchers who are interested in applying and adapting the O-TAPE are referred to the Open Science Framework (https://osf.io/6wuf8/). There, we provide all materials necessary to apply the O-TAPE as well as templates and instructions for adjusting the social network stimuli for the use in non-German-speaking countries.
Finally, results of Studies 1 and 2 showed that generalized other-perceptions as measured with the O-TAPE exhibit moderate yet significant overlap with scale-use bias as measured with the ORT. However, this did not substantially affect the validity correlations in the present work because most validation measures were themselves relatively insusceptible to individual differences in scale-use. We thus refrained from including the ORT in Study 3. Nevertheless, researchers might consider complementing the O-TAPE with the ORT when they have a specific reason to suspect that scale-use bias might impair the validity of their results.
How should O-TAPE raw data be aggregated to obtain a scale score for each participant? In most cases of substantive research, it will not be necessary to run random effects models and report ICCs. As long as the only goal is to capture generalized other-perceptions, it is justified to treat the ten target stimuli as if they were items in a questionnaire without examining how much of the overall variance is due to differences in participants versus differences in “item difficulties” (i.e., targets). It is also warranted to treat the rating dimensions as if they were subscales of a questionnaire in which subscale scores can be averaged to index an overall construct (i.e., positivity). Reporting Cronbach’s coefficient alpha across these “subscales” serves as a straightforward (and conservative) estimate of the positivity score’s reliability.
Synthesis With Previous Interpersonal Perception Research
Like the current research, in previous research by Wood et al. (2010) in which the authors investigated perceiver effects in social groups (i.e., among dormitory roommates or members of the same fraternity or sorority), correlations were also found with interpersonally relevant personality traits. Both the current findings and the results from Wood et al. (2010) indicate that a positively biased view of others might be a characteristic of a certain dispositional signature, namely, a prosocial interpersonal orientation.
Wood et al. (2010) also found that perceiver effects were associated with a number of variables that were not included in the current research (i.e., popularity, personal sense of power) and also with variables that were included but not significantly related to perceiver effects in our data (i.e., psychological adjustment, grade point average). One should bear in mind, however, that perceiver effects in Wood et al.’s (2010) studies might not have been pure indicators of generalized other-perceptions but that they were also possibly influenced by scale-use bias and by the particular social context. Concerning the latter, having a positive view of the specific people who surround us in everyday life might be associated with good psychological health and other desirable life outcomes, presumably because people with functional social relationships accurately describe their interaction partners’ behaviors in more positive terms and are better psychologically adjusted. Like others before us (Kenny, 1994; Srivastava et al., 2010), we contend that it is important to conceptually distinguish between generalized and group-specific other-perceptions. When the goal is to unambiguously assess the former, it is important to minimize influences of social context, and the O-TAPE is a viable and easy-to-apply option for doing so. Future research might make use of this tool in combination with ratings of actual group members to disentangle effects of generalized and group-specific other-perceptions.
Implications and Future Directions
Various psychological theories have proposed that individuals’ working models of “the other” and their idiosyncratic expectations about others’ behaviors and intentions are a fundamental part of who they are (Bowlby, 1988; Erikson, 1959, 1968; Fraley, 2002). By reliably capturing the positivity of generalized other-perceptions, the O-TAPE can be used to test this claim. For instance, future research could examine whether perceivers with more or less positively biased views of others actually engage in more or less affiliative interpersonal behaviors in first encounters (e.g., smiling, eye contact) and whether this has a tangible effect on how they approach and maintain social relationships (e.g., number and intensity of friendships or intimate partnerships).
A promising avenue for future research concerns the explanation of prosocial behavior. Many game-theoretical paradigms such as the prisoner’s dilemma or the public goods dilemma work under the assumption that people who expect good will from others behave more prosocially and share more of their own money with strangers because they anticipate cooperation. Self-report measures predict these economic decisions only moderately (Thielmann et al., 2017; Thielmann & Hilbig, 2018), and the O-TAPE might add unique explanatory value to this line of work. In fact, personality traits related to prosociality are especially likely to yield inaccurate self-reports (Vazire, 2010), and the O-TAPE’s ability to capture diagnostic information about perceivers while bypassing their self-awareness might tap into some of the self’s blind spots.
Furthermore, personality pathology is partially rooted in distorted views about others (Fournier et al., 2012; Hopwood, 2018), and the O-TAPE might serve as a useful diagnostic tool for identifying individuals with negatively biased generalized other-perceptions (e.g., other-derogation among individuals with narcissistic or antisocial tendencies) or perhaps positively biased generalized other-perceptions (e.g., other-idealization among individuals with dependent tendencies).
Finally, it will be important to include more heterogeneous samples in future research. In Study 1, education was generally quite high but nevertheless showed a substantial association with perceiver effects. Potentially, more heterogeneous samples in terms of education could reveal even stronger associations. Moreover, further validation studies are required to generalize the current findings to non-Western and nonindustrialized countries.
Conclusion
The notion that people have different blueprints about others in general has a long tradition in psychological theory, but to date, no established way of measuring these blueprints exists. The present work showed that, much like a projective test, personality ratings about a standardized set of target people presented online can consistently detect perceivers’ stable tendencies to see the best or worst in others. With the O-TAPE, researchers now have a brief instrument with good psychometric properties at hand. It will allow them to systematically examine the role of generalized other-perceptions for psychological functioning.
Supplemental Material
supplement_material – Supplemental material for Seeing the Best or Worst in Others: A Measure of Generalized Other-Perceptions
Supplemental material, supplement_material for Seeing the Best or Worst in Others: A Measure of Generalized Other-Perceptions by Richard Rau, Wiebke Nestler, Michael Dufner and Steffen Nestler in Assessment
Footnotes
Appendix
Nomological Networks for Different Operationalization of Generalized Other-Perceptions and for Scale-Use Bias in Studies 1 and 2.

| Variable | Study 1 |
Study 2 |
|||||||
|---|---|---|---|---|---|---|---|---|---|
| O-TAPE controlled for ORT (cf. Table 3) | O-TAPE raw factor score | O-TAPE raw mean score | ORT | O-TAPE controlled for ORT (cf. Table 3) | O-TAPE raw factor score | O-TAPE raw mean score | ORT | Positivity score in real-life first impressions | |
| Basic demographic and physical variables | |||||||||
| Age | −.00/−.02 | −.03/−.04 | −.01/−.03 | −.08 | — | — | — | — | — |
| Gender (female = 0; male = 1) | − |
− |
− |
.04 | −.14/− |
−.12/− |
−.11/− |
.09 | .02 |
| Height controlled for gender | −.01/− |
.00/−.13 | .01/−.12 | .03 | .01/.04 | .02/.05 | .02/.05 | .06 | −.04 |
| Grade point average | .07/.03 | .03/−.01 | .04/−.01 | −.13 | — | — | — | — | — |
| Income | −.01/−.09 | −.08/− |
−.07/− |
−.23 | — | — | — | — | — |
| Education a | − |
− |
− |
−.10 | — | — | — | — | — |
| Explicit anthropologic beliefs | |||||||||
| Humanity-esteem | .04/.09 | .05/.10 | .05/.10 | .03 | .05/−.02 | .07/−.01 | .07/−.00 | .09 | .15 |
| Philosophies of human nature | − |
.07 | −.05/.06 | −.05/−.05 | −.04/.06 | −.03 | .10 | ||
| Personality traits | |||||||||
| Agency | .09/ |
.10/ |
.11/.16 | .07 | −.00/.04 | .02/.06 | .03/.06 | .12 | .08 |
| Communion | .11 | . |
−.02 | .15 | |||||
| Extraversion | . |
.00 | .01/−.06 | .03/−.03 | .04/−.03 | .11 | .08 | ||
| Agreeableness | .12 | .14 |
|
||||||
| Conscientiousness | .12/ |
.13/. |
.13/ |
.04 | . |
. |
.06 | .14 | |
| Emotional stability | .09/ |
.12/. |
.12/ |
.12 | .01/.00 | .06/.05 | .07/.06 |
|
.09 |
| Openness to experience | . |
. |
.05 | .14/ |
.11/.14 | .11/.14 | −.11 | −.02 | |
| Narcissistic admiration | − |
−.12/−.09 | −.11/−.08 | .04 | −.08/−.14 | −.10/−.15 | −.09/−.15 | −.07 | −.08 |
| Narcissistic rivalry | − |
− |
− |
.04 | −.11/−.16 | −.13/− |
−.14/− |
−.12 | −.08 |
| Dispositional contempt | − |
− |
− |
.05 | − |
− |
− |
− |
− |
| Psychological adjustment | |||||||||
| Self-esteem | .08/.12 | .07/.11 | .07/.10 | −.03 | .07/.08 | .11/.11 | .12/.12 |
|
.06 |
| Secure attachment | .12/.13 | .10/.11 | .11/.11 | −.05 | −.08/−.07 | −.06/−.06 | −.06/−.06 | .06 | .04 |
| Preoccupied attachment | .02/−.05 | .05/−.02 | .06/−.01 | .10 | .08/−.00 | .06/−.01 | .07/−.01 | −.06 | −.09 |
| Dismissing attachment | −.01/.00 | .02/.03 | .01/.03 | .09 | −.09/−.08 | −.09/−.09 | −.09/−.09 | −.04 | −.05 |
| Fearful attachment | −.00/−.05 | .03/−.02 | .03/−.02 | .10 | .01/.05 | −.00/.05 | −.00/.05 | −.03 | −.02 |
| Life satisfaction | .08/ |
.09/ |
.10/. |
.05 | .14/.11 |
|
.14 | ||
Note. O-TAPE = Online-Tool for Assessing Perceiver Effects. Correlations (Pearson) with social network version are presented before the slash “/” and correlations with the video version are presented after the slash. Bold printed coefficients are significantly different from zero (p < .05).
Kendall’s correlation coefficient used due to ordinal data.
Acknowledgements
We thank Michelle Heinrich for her assistance during data collection and Theo Toppe and Roman Stengelin for their valuable feedback on an earlier draft of this manuscript.
Declaration of Conflicting Interests
The author(s) declared no potential conflicts of interest with respect to the research, authorship, and/or publication of this article.
Funding
The author(s) received no financial support for the research, authorship, and/or publication of this article.

Supplemental Material
Supplemental material for this article is available online.
Notes
References
Supplementary Material
Please find the following supplemental material available below.
For Open Access articles published under a Creative Commons License, all supplemental material carries the same license as the article it is associated with.
For non-Open Access articles published, all supplemental material carries a non-exclusive license, and permission requests for re-use of supplemental material or any part of supplemental material shall be sent directly to the copyright owner as specified in the copyright notice associated with the article.
