
Abstract
The Self-Compassion Scale (SCS) is a widely used measure to assess the trait of self-compassion, and, so far, it has been implicitly assumed that it functions the same way across different groups. This assumption needs to be explicitly tested to ascertain that no measurement biases exist. To address this issue, the present study sought to systematically examine the generalizability of the bifactor exploratory structural equation modeling operationalization of the SCS via tests of measurement invariance across a wide range of populations, varying according to features such as student or community status, gender, age, and language. Secondary data were used for this purpose and included a total of 18 samples and 12 different languages (N = 10,997). Multigroup analyses revealed evidence for the configural, weak, strong, strict, and latent variance–covariance of the bifactor exploratory structural equation modeling operationalization of the SCS across different groups. These findings suggest that the SCS provides an assessment of self-compassion that is psychometrically equivalent across groups. However, findings comparing latent mean invariance found that levels of self-compassion differed across groups.
Keywords
Compassion is generally understood to involve the motivation to alleviate suffering and can manifest as both a temporary state of mind and a habitual tendency (Goetz et al., 2010). Drawing on Buddhist psychology (e.g., Bennett-Goleman, 2001; Kornfield, 1993), mindfulness and acceptance-based clinical models (e.g., Jordan, 1991; Rogers, 1961; Teasdale et al., 2000), and the self-concept and coping literature (e.g., Deci & Ryan, 1995; Harter, 1999; Stanton et al., 1994), Neff (2003b) proposed that self-compassion is a healthy way of relating to personal suffering in a way that provides a sense of safety, support, and unconditional self-worth. From this perspective (Germer & Neff, 2019; Neff, 2011, 2016b), a self-compassionate mindstate entails being kinder and more supportive toward oneself and less harshly judgmental. It involves greater recognition of the shared human experience and fewer feelings of being isolated by one’s imperfection. It includes greater mindfulness of personal suffering and less rumination about negative aspects of oneself or one’s life experience.
There has been an exponential increase in research on self-compassion over the past decade and a half since the construct was first introduced into the psychological literature (Neff, 2003a, 2003b), with over 2,500 studies being conducted on the construct (based on a Google Scholar search in April 2020 of published books or journal articles with “self-compassion” in the title). Research has examined self-compassion as a trait using self-report measures (e.g., Gilbert et al., 2004; Neff, 2003a), and also as a state using mood inductions (e.g., Breines & Chen, 2012; Leary et al., 2007). Self-compassion is positively linked to healthy psychological functioning in terms of greater happiness, life satisfaction, adaptive coping, emotional intelligence, wisdom, and motivation, and negatively linked to unhealthy functioning in terms of less maladaptive perfectionism, anxiety, stress, and depression (MacBeth & Gumley, 2012; Neff, Long, et al., 2018; Zessin et al., 2015). While the trait of self-compassion is shaped in part by early family experiences (Pepping et al., 2015), it is also a mindstate that can be trained through targeted interventions (Ferrari et al., 2019; Germer & Neff, 2019; Gilbert, 2005).
Most research on the trait of self-compassion has been conducted with the Self-Compassion Scale (SCS; Neff, 2003a), which has been translated into multiple languages. The SCS is designed to measure the operationalization of self-compassion offered by Neff (2003b), who proposes that self-compassion reflects a balance between increased compassionate and decreased uncompassionate self-responding in times of failure or personal struggle. Self-compassion (represented by a global self-compassion score) is thought to be composed of six components (represented by subscale scores). Three of these components represent increased compassionate responding: self-kindness (i.e., being imperfect and toward oneself), common humanity (i.e., understanding supportive that all humans are), and mindfulness (i.e., being mindfully aware of personal suffering). The other three represent decreased uncompassionate responding: self-judgment (i.e., harshly judging oneself for shortcomings), isolation (i.e., feeling isolated by one’s struggles), and overidentification (i.e., ruminating about negative aspects of oneself and one’s life). These components are conceptually distinct and tap into how people emotionally respond to pain or failure (with kindness vs. harsh judgment), how people cognitively understand their situation (as part of the common human experience vs. isolating), and how people pay attention to suffering (in a mindful vs. overidentified manner). While these components do not covary in a lockstep manner, they are thought to mutually affect one another and operate together as a system (Neff, 2016a, 2016b).
A recent meta-analysis of 27 randomized controlled trials of self-compassion interventions or mood inductions (Ferrari et al., 2019) found that all six subscales of the SCS changed significantly as a result of training. Similarly, a study of change in state self-compassion after a self-compassionate mindstate induction found that scores on all six subscales changed simultaneously and to the almost exact same degree (Neff et al., 2020). Moreover, research indicates that training in one component of self-compassion changes the tendency to experience other components (Dreisoerner et al., 2020). Thus, research that examines dynamic change in self-compassion supports the view that it operates as a system.
There has been controversy over whether or not self-compassion should be understood as a global construct, or if compassionate versus uncompassionate self-responding should be seen as two separate constructs - self-compassion and “self-coldness” (e.g., Muris & Petrocchi, 2017). Neff (2016a, 2016b) argues that because increasing self-kindness, common humanity and mindfulness in the context of suffering reduces self-judgment, isolation, and overidentification, that self-compassion is best viewed as a global construct that represents the balance between increased compassionate and decreased uncompassionate self-responding. This view is buttressed by research on how the components of self-compassion are configured within individuals. Phillips (2019) used latent profile analyses to examine patterns of scores on the various SCS subscales and found only three patterns—high in the three compassionate and low in the three uncompassionate subscales, low in the three compassionate and high in the three uncompassionate subscales, or moderate in both. There were no individuals who were high or low in both compassionate and uncompassionate responding, suggesting they form a balanced system. Recent research using functional magnetic resonance imaging scans (Kim et al., 2020) indicates that uncompassionate self-responding to negative emotional stimuli increases activity in the anterior insula, anterior cingulate, and amygdala, whereas compassionate self-responding suppresses activity in these very same regions, providing neurological evidence that they operate in tandem and are not independent.
Some have treated compassionate and uncompassionate self-responding as method factors due to their positive and negative valence (Montero-Marín et al., 2016). An artificial clustering effect may occur when items with a similar valence load onto a separate method factor that originates from item wording (Crego & Widiger, 2014). Such a wording effect has been demonstrated in research on self-esteem, for instance, and is known to create response biases (e.g., Marsh, 1996). Generally speaking, however, wording effects due to valence are construct-irrelevant sources of variance that do not have substantive importance or relevance (Morin et al., 2020; Williams et al., 2002). However, Neff et al. (2019) argue that each of the three positive and negative components of self-compassion are conceptually meaningful and differentially contribute to the global self-compassion construct. This is supported by findings that the positive and negative components differentially explain the link between self-compassion and psychopathology (Neff, Long, et al., 2018).
Several empirical studies have focused on examining the factor structure and dimensionality of the SCS (see Neff et al., 2019, for an overview). Neff’s (2003a) original study found support for a higher-order structure with one global self-compassion factor and six subscale factors. While some studies have found support for this model (e.g., Benda & Reichová, 2016; Castilho et al., 2015; Dundas et al., 2016), others have instead found support for two separate global factors termed self-compassion and self-coldness, which represent the three positive subscales and three negative subscales (e.g., Costa et al., 2016; López et al., 2015; Montero-Marín et al., 2016). These mixed findings likely stem from the theoretical fit of various analytical approaches with the construct of self-compassion, which is thought to be a multidimensional system. Neff (2016b) argues that the hierarchical models first used to validate the SCS were inappropriate. These models rely on the strict, and rarely supported, assumption that associations between items and the higher-order factor are unidirectional and mediated by the first-order factors only (Morin, Arens, et al., 2016). Other studies (Cleare et al., 2018; Neff et al., 2017) have shown that bifactor modeling, where items simultaneously define one global factor and one specific factor in a bidirectional manner provide a better theoretical operationalization of self-compassion than a higher-order model. However, the use of bifactor models alone is not sufficient to represent self-compassion as a multidimensional system. For instance, some scholars have used bifactor models in a way that was inconsistent with theory, such as the use of an uncorrelated two-bifactor CFA model (Brenner et al., 2017; Coroiu et al., 2018). Similarly, Halamová et al. (2020) examined bifactor models using unidimensional item response theory, which is not appropriate for multidimensional constructs such as self-compassion. Recent empirical studies on self-compassion have underscored the value of combining exploratory structural equation modeling (ESEM) with the bifactor approach (bifactor-ESEM; Morin et al., 2020; Morin, Arens, et al., 2016) to model the SCS as a multidimensional system.
The bifactor-ESEM framework provides a way to obtain a reliable, direct, and meaningful assessment of global levels of self-compassion as well as to identify specific factors that have uniquely attributable specificities over and above the global factors. This can be achieved by explicitly taking into account two sources of construct-relevant psychometric multidimensionality, namely the simultaneous assessment of global and specific factors (via the bifactor component; Reise, 2012) and the assessment of conceptually-related constructs (via the ESEM component; Marsh et al., 2014). An increasing number of studies (e.g., Neff, Tóth-Király, et al., 2018; Tóth-Király et al., 2017) have found support for the bifactor-ESEM operationalization of the SCS (incorporating one global and six specific factors). Most recently, Neff et al. (2019) compared one-factor, correlated two-factor, correlated six-factor, one-bifactor, and correlated two-bifactor models using confirmatory factor analysis (CFA) and ESEM in 20 international samples and 13 different languages. First-order analyses using both CFA and ESEM supported the use of six but not one or two first-order factors. Second-order analyses using CFA did not support either a single or two-bifactor model. ESEM analyses found excellent fit for both a single and correlated two-bifactor model, but the strength of the factor loadings indicated that separate positive and negative factors were poorly specified in a two-bifactor model. In contrast, factor loadings on a single self-compassion dimension were strong, and 95% of the reliable variance in item responding could be explained by a general self-compassion factor. Thus, support was found for a bifactor-ESEM operationalization of the SCS with one general factor and six specific factors across multiple samples. Despite the promising results, this study did not investigate measurement invariance in the structure of the SCS across these samples.
Although the SCS has been used in a wide variety of cultures, population types (e.g., student, community, and clinical) and ages, it tends to be implicitly assumed that the SCS operates the same way across groups. Little research has systematically tested whether this is the case. An important aspect of the assessment of psychological constructs is whether the instrument at hand can be validly used with individuals belonging to different groups. The generalizability of an instrument can be ascertained via tests of measurement invariance (Meredith, 1993; Millsap, 2011). If the instrument does not behave in the same manner across these groups, then measurement biases could occur, which, in turn, could lead to erroneous conclusions, effectively rendering the comparability of the constructs invalid. On the other hand, if the instrument does function in the same manner (i.e., the scale and the items have the same meaning across groups), then there can be more confidence in generalizing findings to other groups.
Traditionally, there have been six levels of measurement invariance that one could investigate with the first four levels focusing on the invariance at the item level, while the last two focusing on invariance at the factor level. First, configural invariance tests whether the construct is represented the same way across groups. Lack of configural invariance precludes any form of comparisons across samples because the construct is understood fundamentally differently in the groups. Weak (or metric) invariance tests whether the constructs have the same meaning and are manifested in the same way across groups by the items of the instrument. Lack of weak invariance prevents comparisons of latent variances, latent covariances, and latent relations with other variables. Strong (or scalar) invariance focuses on item intercepts (or thresholds) and posits that members of different groups have a similar item score when the construct is held equal. Not achieving strong invariance indicates that different groups use the response scale of the items differently and that these groups could score higher or lower on the indicators regardless of the group-related differences at the factor level. At the same time, achieving strong invariance is a prerequisite for latent mean comparisons. Strict (or residual) invariance examines item uniqueness to ascertain that the items measure the construct with the same precision and reliability. Lack of strict invariance shows that measurement error differs across groups, precluding comparisons based on manifest scores across groups. The invariance of latent variances-covariances can be examined to test group differences in interindividual variability (variances) and correlations among constructs (covariances).
Finally, the invariance of latent means can be examined to test for group differences in mean levels of a construct. Compared with the simple summation and comparison of observed scale scores, relying on latent means ensures that between-group differences are not tainted by biases or errors in measurement levels. Because latent means are naturally corrected for measurement error, conducting between group comparisons on latent means can be considered more reliable than observed means.
There is a need for a comprehensive test of measurement invariance in the SCS across diverse populations, serving as an important step in the construct validation process (Marsh, Ellis, et al., 2005) and also as a prerequisite to any group-based comparisons. Participants can differ from one another in the interpretation of the items, in the intended meaning of the items, or even in the conceptualization of the scale itself (Veenhoven, 1996). While there have been a few limited studies of measurement invariance of the SCS (e.g., Costa et al., 2016; Cunha et al., 2016; Petrocchi et al., 2014; Montero-Marín et al., 2016), these studies have not examined a bifactor-ESEM model, which has been found to be the most optimal and theoretically most consistent model of the SCS. One exception was Tóth-Király et al. (2017), who examined the equivalence of the bifactor-ESEM operationalization of the SCS across gender groups in a Hungarian community sample and reported that latent variance–covariance invariance had been achieved. However, research is needed to examine measurement equivalence across diverse cultural groups as well. In our study, therefore, we tested measurement invariance across groups based on population type, gender, age, and language.
We examined differences in latent mean self-compassion levels between groups based on these categories and also culture (We are using the nation in which data were collected as a proxy measure of culture, although we recognize that there is cultural diversity within countries and cultural similarity across cultures; Cohen, 2009). We planned to first conduct tests of measurement invariance between population, gender, age and language to rule out the presence of measurement biases before examining mean differences by culture, so that we could make more reliable comparisons. We expected there to be differences in self-compassion based on population type, given that clinical populations generally have lower levels of self-compassion than nonclinical populations (e.g., Castilho et al., 2015; Werner et al., 2012). We also expected there to be mean differences based on gender, given meta-analytic findings of a small but significant difference favoring males (Yarnell et al., 2015). We also expected self-compassion levels to be higher among older age groups, given that studies that have included a broad age range of individuals have found small positive correlations with age (e.g., Homan, 2016; Neff & Pommier, 2013; Neff & Vonk, 2009).
We also examined differences in levels of self-compassion by language and nation given that there were multiple English-speaking samples from very different cultures (Australia, Canada, the United States, and the United Kingdom), so we felt it was important to examine the data both ways. We therefore examined differences between culture while controlling for population type, so the two would not be conflated. We thought it likely that there would differences between cultures, given the unique and specific aspects of particular societies that are likely to impact the degree of compassion shown to the self. Some factors have to do with cultural beliefs or religious worldviews about the beneficial or harmful nature of self-compassion for outcomes such as motivation, selfishness, or personal responsibility (Robinson et al., 2016). Variation in parenting practices is also likely to have an impact. Individuals develop cognitive schemas for self-to-self relating based in part on prior interactions with caregivers, so cultural differences in parental warmth or rejection are likely in influence self-compassion (Pepping et al., 2015). We made no clear hypotheses in terms of the particular differences that might emerge, however. Past results pertaining to mean differences in self-compassion have been mixed. When examining mean self-compassion differences across countries, Neff et al. (2008) reported differences between participants from the United States, Thailand, and Taiwan. Thai participants scored the highest, Taiwanese the lowest, with Americans falling in between. Results were interpreted as being due to the influence of Buddhism in Thai culture which tends to promote self-compassion (Yan-Qin & Jian-Dan, 2012), and the influence of Confucianism in Taiwanese culture that tends to promote self-criticism as a means of achievement (Heine, 2003). However, Birkett (2014) did not find mean-level differences between a small sample of Chinese and American students. Likewise, Kemppainen et al. (2013) did not find statistically significant mean differences between five countries (Canada, China, Namibia, Puerto Rico, and United States), 1 meaning that the existence of cultural differences in levels of self-compassion has not been clearly established.
In summary, the present study sought to explicitly test the implicit assumption that the SCS operates similarly across groups through rigorous tests of measurement invariance using a total of 18 samples collected from 15 countries. We systematically tested the measurement invariance of the bifactor-ESEM operationalization of the SCS at six levels; we tested for configural, weak, strong, and strict invariance, as well as testing latent variances–covariances and means. We examined invariance across groups based on population type (student, community, clinical, or mixed), gender, age and language. We hoped this study would provide new information on the applicability, utility, and generalizability of the bifactor-ESEM operationalization of the SCS to new populations. Moreover, the inclusion of such a large variety of cultural groups will not only provide support for the universality of the construct but make it possible to conduct more rigorous cross-cultural research. The present investigation also provides an opportunity to demonstrate what Marsh and Hau (2007) refer to as a substantive-methodological synergy: how new and evolving methodological approaches can be applied to address substantively important research questions that have both theoretical and practical implications.
Method
Procedure
This study relied on secondary archival data gathered by Neff et al. (2019) to examine the factor structure of the SCS across several international samples. While that study tested model fit across 20 different samples, it did not examine invariance across groups. Local institutional review board approval was received before the original data collection period for all the individual samples, and all data were de-identified for the present study before being analyzed. We decided to drop three samples that had been included in Neff et al. (2019): we excluded the Chinese and Japanese samples because the bifactor-ESEM solution in those samples had identification issues, suggesting that further investigations might be needed in those particular populations. We also excluded the U.S. meditator sample due to the relatively low sample size compared with the other samples. However, we added a Hungarian sample examined by Tóth-Király et al. (2017).
Participants
Secondary data from a total of 10,997 respondents (69.4% female) from 18 different samples were analyzed. Participants were included from the following countries: Australia, Brazil, Canada, France, Germany, Greece, Hungary, Iran, Italy, Norway, Portugal, South Korea, Spain, the United Kingdom, and the United States. Participants were aged between 15 and 83 years (M = 31.16, SD = 13.45). As for sample populations, there were 5 student, 10 community, 1 mixed (community and student), and 2 clinical samples. The characteristics of the specific samples are reported in Table 1. Details about each sample can be found in Supplementary Appendix 1 (available online). Note that the Korean student sample was somewhat different from the other student samples, and was composed of older adults attending an online university.
Characteristics of the Total and Individual Samples Used in the Present Study.
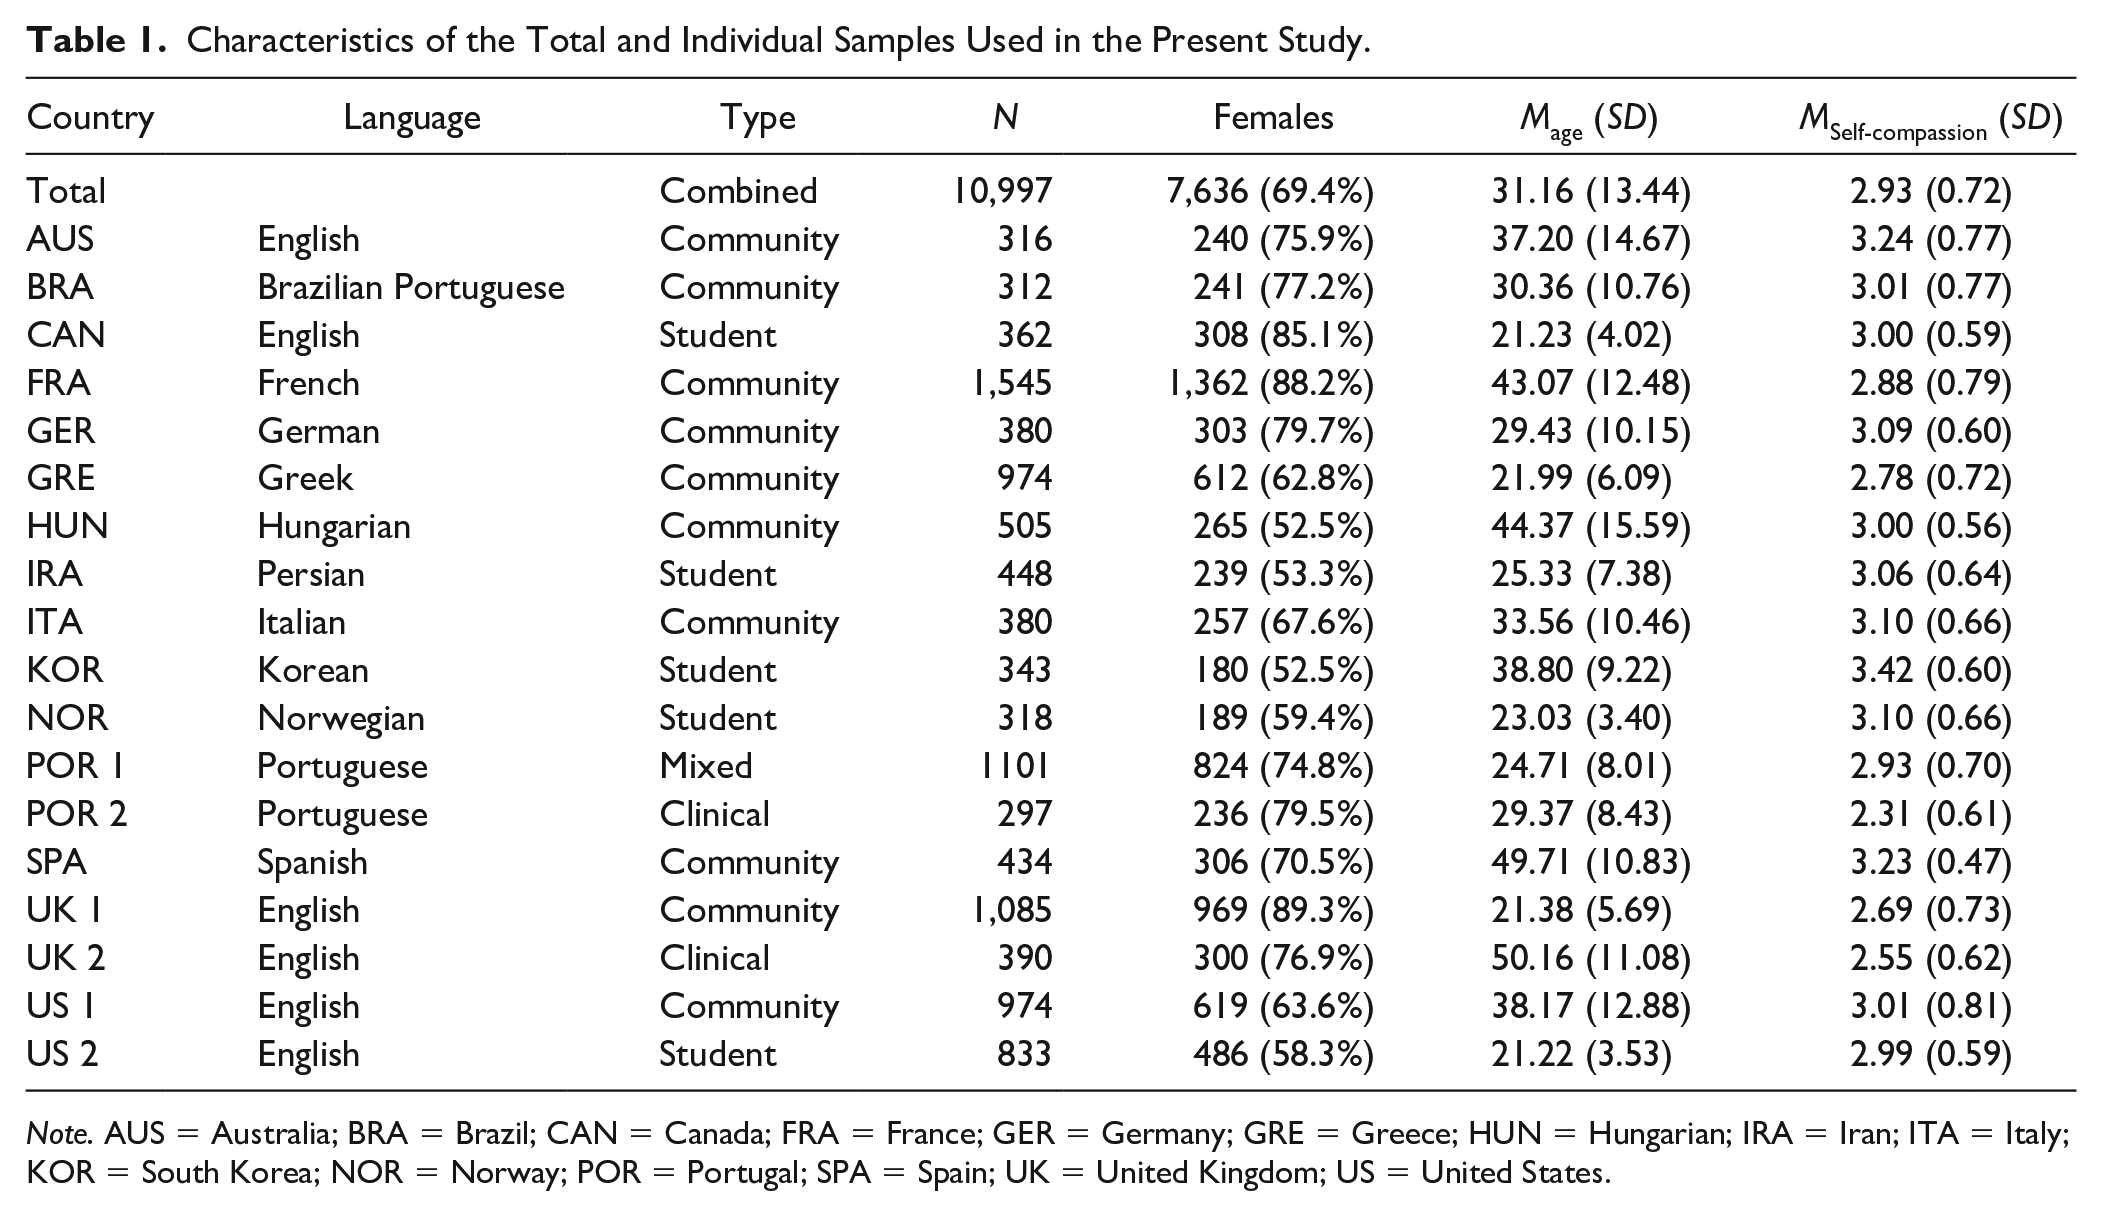
Note. AUS = Australia; BRA = Brazil; CAN = Canada; FRA = France; GER = Germany; GRE = Greece; HUN = Hungarian; IRA = Iran; ITA = Italy; KOR = South Korea; NOR = Norway; POR = Portugal; SPA = Spain; UK = United Kingdom; US = United States.
Measures
Self-Compassion Scale
The SCS (Neff, 2003b) is a 26-item self-reported questionnaire measuring the six components of self-compassion proposed by Neff (2003a): Self-Kindness (five items; e.g., “I’m kind to myself when I’m experiencing suffering”), reduced Self-Judgment (five items; e.g., “When I see aspects of myself that I don’t like, I get down on myself”), Common Humanity (four items, e.g., “I try to see my failings as part of the human condition”), reduced isolation (four items, e.g., “When I’m feeling down, I tend to feel like most other people are probably happier than I am”), mindfulness (four items, e.g., “When something painful happens I try to take a balanced view of the situation”), and reduced overidentification (four items, e.g., “When I’m feeling down I tend to obsess and fixate on everything that’s wrong”). Responses are given on a 5-point scale (1 = almost never; 5 = almost always). Scores for negative items representing uncompassionate self-responding are reverse-coded to indicate their absence. A total self-compassion score is obtained by taking the average of the six subscale means.
Statistical Analyses
Model Estimation and Specification
All analyses were conducted with Mplus 8 (Muthén & Muthén, 1998-2017), and models were estimated with the weighted least squares mean- and variance-adjusted estimator (WLSMV) and theta parameterization. The decision to rely on this estimator was based on prior studies showing weighted least squares mean- and variance to be superior, compared with maximum likelihood–based estimators, for ordered-categorical items, particularly when the items have five or fewer response categories and when they have asymmetric thresholds (e.g., Bandalos, 2014; see Finney & DiStefano, 2013 for a review). Following previous studies (Neff, Tóth-Király, et al., 2018; Neff et al., 2019), across all samples, we modeled self-compassion using the bifactor-ESEM framework (Morin, Arens, et al., 2016; Tóth-Király et al., 2018) that incorporated a bifactor and an ESEM component. Specifically, items were allowed to define one global factor and their a priori specific factors (bifactor component), while cross-loadings were also freely estimated across the specific factors, but targeted to be as close to zero as possible with the orthogonal target rotation procedure (ESEM component; Browne, 2001), thus relying on bifactor-ESEM in a confirmatory manner. In line with typical bifactor specifications (Reise, 2012; Morin, Arens, et al., 2016), the factors were orthogonal to one another (see Figure 1 for a visual representation of a bifactor-ESEM model).

Visual representation of the bifactor-ESEM model.
Tests of Measurement Invariance
We performed tests of measurement invariance across groups based on population type: student (n = 2,304), community (n = 6,905), mixed (n = 1,101), clinical (n = 687); gender: male (n = 2,949) and female (n = 7,636); age (based on Marsh et al., 2013): late adolescence/young adulthood (15-30, n = 6,473), middle age (31-60, n = 3714), older age (61-99, n = 404); and language: English (n = 3,960), Brazilian Portuguese (n = 312), French (n = 1,545), German (n = 380), Greek (n = 974), Hungarian (n = 505), Iranian (n = 448), Italian (n = 380), Korean (n = 343), Norwegian (n = 318), Portuguese (n = 1398), and Spanish (n = 434). These tests followed the typical sequence proposed by Meredith (1993) and Millsap (2011) where equality constraints are gradually added to the various parameters, ranging from a model where all parameters are freely estimated to a highly restrictive model where all parameters are constrained to be invariant: (a) configural invariance (equality of factor structure); (b) weak invariance (equality of factor loadings); (c) strong invariance (equality of item thresholds); (d) strict invariance (equality of item uniquenesses); (e) invariance of the variance–covariance matrix (equality of latent variances–covariances); and (f) invariance of the latent means (equality of latent means). While the first four steps (a-d) examine the presence of measurement biases across the samples, the last two steps (e and g) test for the presence of meaningful group-based differences at the level of factor variances, covariances, and means.
Because mean-level differences across the groups were of substantive interest, however, and because previous statistical evidence has suggested that guidelines might not be stringent enough for testing latent mean-differences (Fan & Sivo, 2009), we decided to interpret latent mean differences obtained from the model of latent variance–covariance invariance. In multigroup models, the latent means in a reference groups are constrained to zero for the purpose of identification, and are freely estimated in the other groups. These freely estimated latent means provide a direct estimate of the difference between the target group and the referent group, expressed in SD units and accompanied by tests of statistical significance. We examined latent mean differences using this approach by population, gender, age, and language. We also conducted analyses by culture within population groups. Note that latent means differ slightly from observed means, and can be considered more reliable since they contain less error (Kline, 2011; Marsh, 2007).
Model Evaluation
Models were evaluated using typical goodness-of-fit indices (Hu & Bentler, 1999; Marsh, Hau, et al., 2005): the chi-square test (χ2), the comparative fit index (CFI), the Tucker–Lewis Index (TLI), and the root mean square error of approximation (RMSEA) with its 90% confidence interval (90% CI). CFI, and TLI values are considered to be adequate or excellent when they are above .90 and .95, respectively. RMSEA values, on the other hand, are considered to be adequate or excellent below .08 and .06, respectively. However, because the chi-square test is known to be oversensitive to even minor model misspecifications and to be dependent on sample size (Marsh, Hau, et al., 2005), it is reported for the sake of transparency and comparability with previous studies, but not used in model evaluation. Instead, the comparison of the nested models in the tests of measurement invariance was based on the examination of relative changes (Δ) in the sample-size-independent fit indices. Specifically, a decrease of at least .010 or higher for CFI and TLI and an increase of at least .015 or higher for RMSEA were used as an indication for the lack of invariance (Chen, 2007; Cheung & Rensvold, 2002).
Still, these cutoff values have mostly been tested in scenarios where only a few groups were included, and studies have shown that the performance of these cutoff values tend to vary depending on sample size, the number of groups, the treatment of the data, and the complexity, or the examined measurement model (e.g., Byrne et al., 1989; Rutkowski & Svetina, 2014). As a response to these concerns, alternative, less restrictive cutoff values have been proposed (e.g., Desa, 2014; Khojasteh & Lo, 2015). Also, as put by Marsh (2007; see also, Heene et al., 2011; Perry et al., 2015), strictly adhering to any cutoff values without substantive interpretations could lead to biased interpretations and erroneous conclusions. Therefore, given the complexity of our sample (i.e., multiple groups) and the complexity of the measurement model (i.e., bifactor-ESEM), similar to Scherer et al. (2016), we relied on the cutoff values aforementioned as rough guidelines instead of golden rules, and small deviations (up to an additional Δ of .005) in only one of the fit statistics were considered acceptable (see also Van Heel et al., 2019). It is also worth noting that the TLI and the RMSEA (but not CFI) are corrected for parsimony (i.e., more parsimonious models can have better TLI and RMSEA values than less parsimonious ones) which has major importance given that more parameters are estimated in ESEM than in CFA (Marsh et al., 2009; Morin et al., 2020).
Results
Mean levels of self-compassion and standard deviations for each sample are presented in Table 1 as a general reference, but it should be remembered that the latent means analyzed in this study differ slightly from observed means. We tested a wide variety of invariance models to examine the generalizability of the bifactor ESEM operationalization of the SCS over population type, gender, age, and language. Goodness-of-fit results associated with all the models are reported in Table 2.
Goodness-of-Fit Statistics Associated With the Tests of Measurement Invariance.
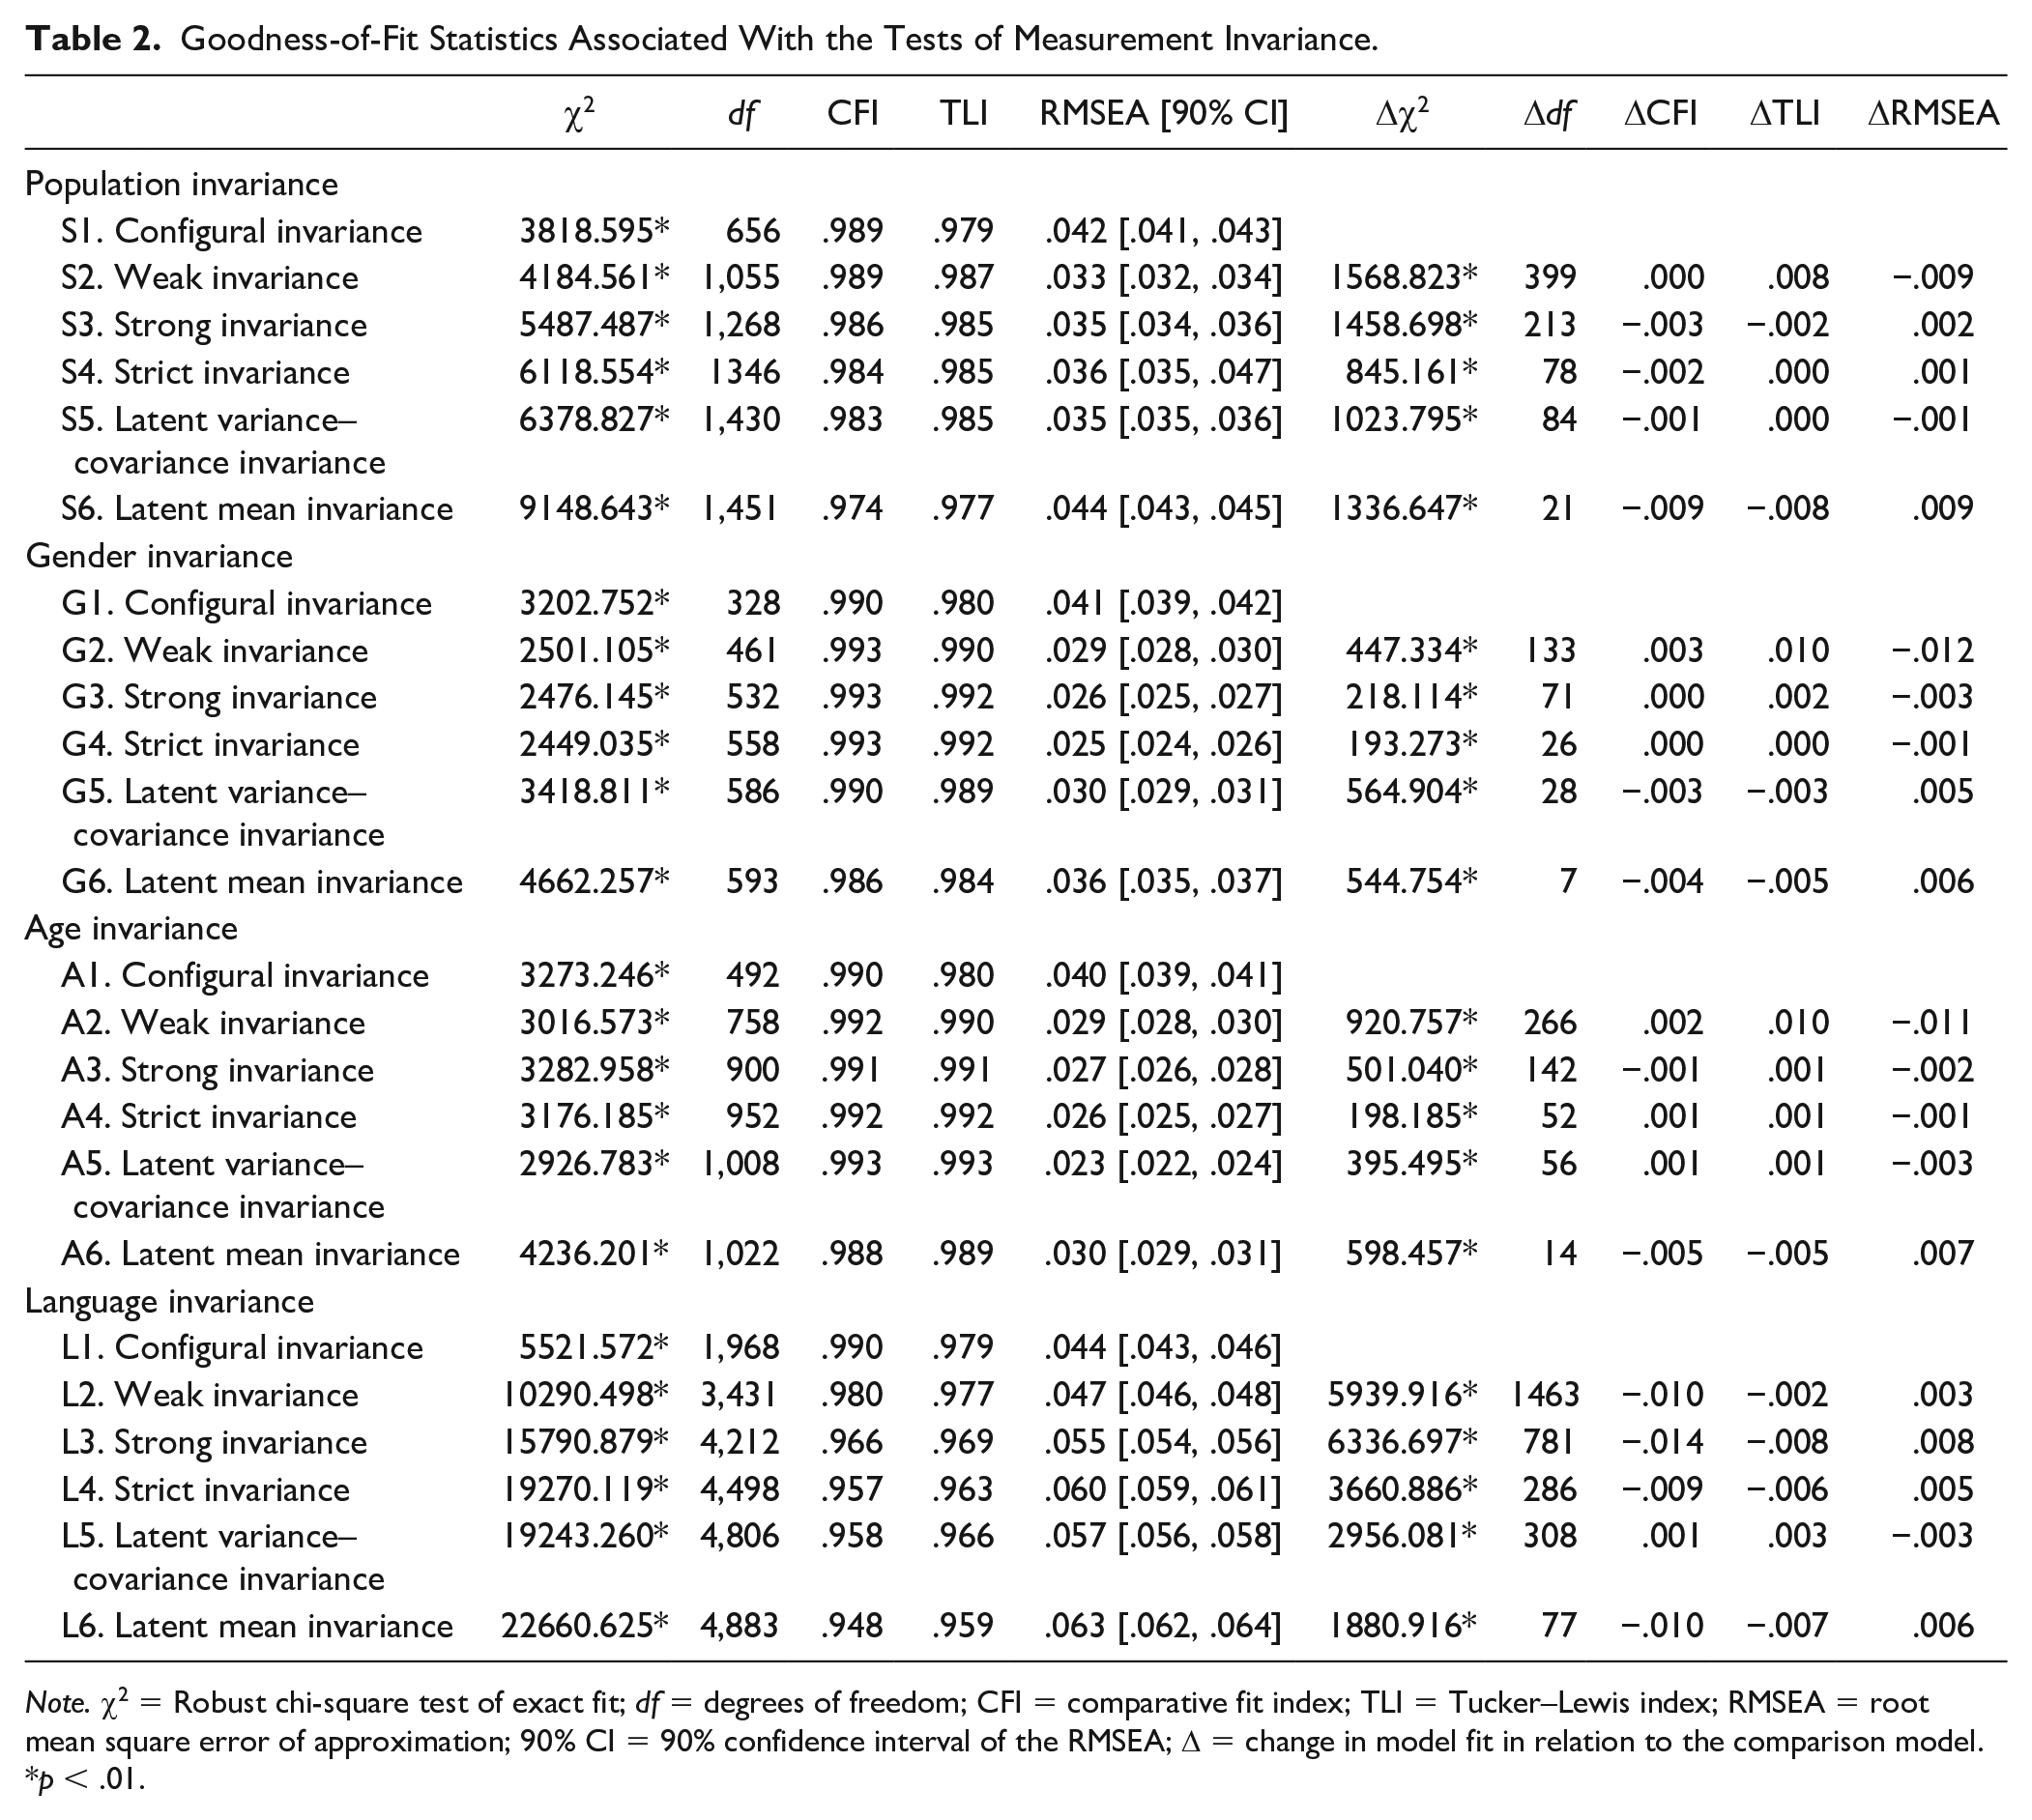
Note. χ2 = Robust chi-square test of exact fit; df = degrees of freedom; CFI = comparative fit index; TLI = Tucker–Lewis index; RMSEA = root mean square error of approximation; 90% CI = 90% confidence interval of the RMSEA; Δ = change in model fit in relation to the comparison model.
p < .01.
Invariance Across Population Type
First, we verified the extent to which the bifactor-ESEM model replicated across population types (student, community, clinical, mixed). The first model (Model S1) with no invariance constraints provided good fit to the data (CFI = .989, TLI = .979, RMSEA = .042), thus suggesting that the factor structure was the same across populations. In the next step, we put equality constraints on the factor loadings to test their invariance (Model S2). While CFI did not change, the parsimony-corrected indices improved (TLI = .979 vs. .987, RMSEA = .042 vs. .033), providing good support for weak invariance. The subsequent model (Model S3) assumed the invariance of item thresholds, and differences were negligible (ΔCFI = −.003, ΔTLI = −.002, ΔRMSEA = .002), supporting strong invariance across population type. Strict invariance (Model S4) requires the invariance of item uniquenesses to be invariant over groups. The comparison of the models again revealed negligible changes in fit indices (ΔCFI = −.002, ΔTLI = .000, ΔRMSEA = .001), thus providing strong support for strict measurement invariance. When equality constraints were added on the latent variance–covariance matrix (Model S5), model fit did not decrease substantially (CFI = .984 vs. .983, TLI = .985 vs. .985, RMSEA = .036 vs. .035). This suggests that the SCS functions the same in different population types.
Finally, when the latent means were constrained to be equal across samples (Model S6) fit did not substantially change either (ΔCFI = −.009, ΔTLI = −.008, ΔRMSEA = .009; standardized parameter estimates from the latent mean invariant measurement model are reported in Table S1 of the online supplement). However, when we tested for latent mean-differences from the model of latent variance–covariance invariance by comparing target and referent groups (Fan & Sivo, 2009), differences were found. Comparisons show that overall global levels of self-compassion were the lowest in the clinical population, followed by the community then mixed populations, and highest in the student population (see Table 3). We also compared latent means across population type without including the Korean sample, given that the Korean student sample was composed of older adults attending an online university and may have responded with more compassion than younger, more traditional students. Although the degree of differences obtained were smaller, all patterns of significance remained the same (exact results can be obtained from the first author).
Latent Mean Comparisons Between Groups Formed on the Basis of Population Type.
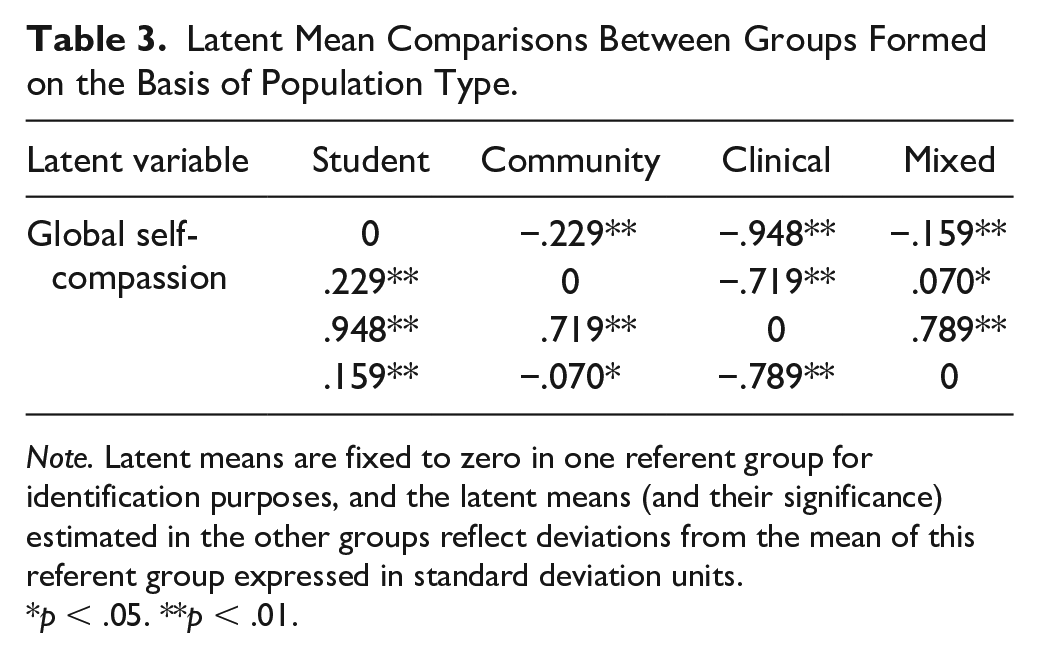
Note. Latent means are fixed to zero in one referent group for identification purposes, and the latent means (and their significance) estimated in the other groups reflect deviations from the mean of this referent group expressed in standard deviation units.
p < .05. **p < .01.
Invariance Across Gender
Is the bifactor-ESEM operationalization of SCS the same for men and women? We addressed this question by conducting tests of measurement invariance across gender groups. The addition of each set of equality constraints did not result in substantial changes in fit indices for the model of configural invariance (Model G1), CFI, TLI, and RMSEA were .990, .980, and .041, respectively; for weak invariance (Model G2), .993, .990, and .029; for strong invariance (Model G3), 993, .992, and .026; for strict invariance (Model G4), .993, .992, and .025; for latent variance–covariance invariance (Model G5), .990, .989, and .030.; and for latent mean invariance (Model G6), .986, .984, and .036. Standardized parameter estimates from Model G6 are reported in Table S2 of the online supplements. All changes remained within the recommended cutoff values. Still probing latent mean differences showed that when males’ latent means were constrained to zero, females’ latent means proved to be lower (−.290 SD, p < .001).
Invariance Across Age
To examine whether the bifactor-ESEM operationalization of self-compassion differs along age groups, we performed tests of measurement invariance across the three age groups representing late adolescence/young adulthood, middle age, and older age. Once again, the configural model (Model A1) provide excellent fit to the data (CFI = .990, TLI = .980, RMSEA = .040). Gradual inclusion of the invariance constraints on various model parameters (Models A2-A6) showed that (a) the CFI, TLI, and RMSEA indicated excellent fit to the data on all levels; (b) ΔCFI and ΔTLI were never above .010 with the highest being .005 for both indices; and (c) the ΔRMSEA never showed an increase of .015 or greater with the highest being .007. All these findings suggest that the SCS functions the same way not just in different linguistic and gender, but different age groups as well (see Table S3 for parameter estimates). Latent mean comparisons are reported in Table 4 and generally show that respondents tended to report higher levels of self-compassion with increasing age.
Latent Mean Comparisons Between Groups Formed on the Basis of Age.
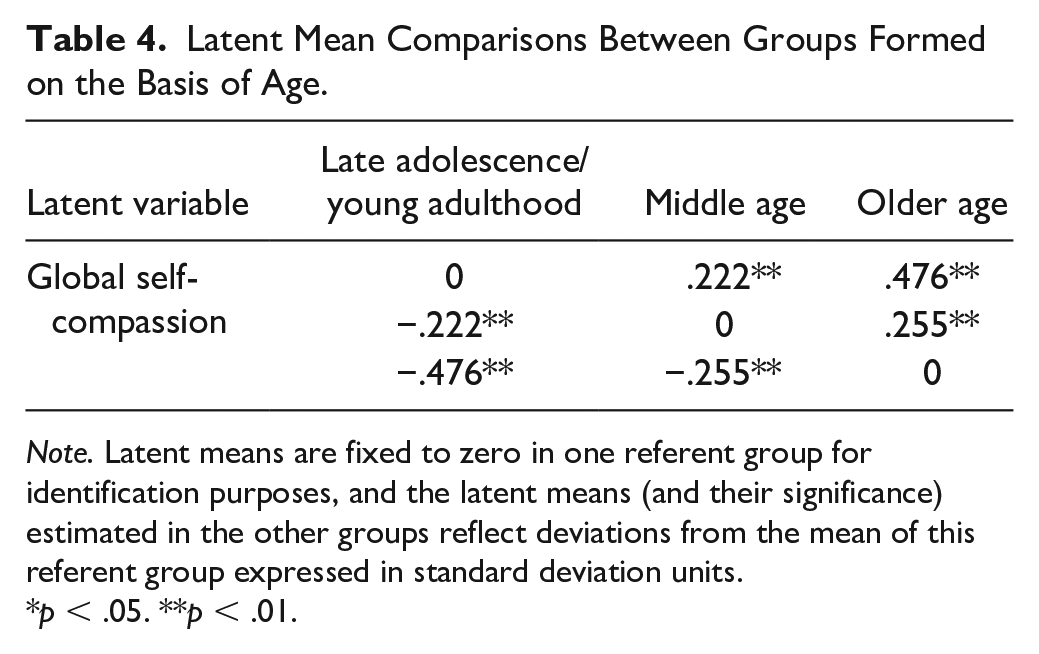
Note. Latent means are fixed to zero in one referent group for identification purposes, and the latent means (and their significance) estimated in the other groups reflect deviations from the mean of this referent group expressed in standard deviation units.
p < .05. **p < .01.
Invariance Across Languages
Finally, we examined the linguistic invariance of the SCS. This endeavor is important because the SCS has been administered around the world, yet cross-linguistic comparisons have not been made. Starting with the configural model (Model L1 in Table 2), sufficient level of fit was achieved (CFI = .990, TLI = .979, RMSEA = .044), providing reasonable support for the similarity of the factor structure across different languages. Equality constraints were imposed on the factor loadings to test weak invariance (Model L2), and fit indices did not show substantial decreases (ΔCFI = −.010, ΔTLI = −.002, ΔRMSEA = .003), providing support for the invariance of factor loadings.
Strict invariance (Model L3) assumes the invariance of item thresholds, nonsupport for this level of invariance would suggest differential item functioning. Although changes in TLI (.977 vs. .969) and RMSEA (.047 vs. .055) were negligible, changes in CFI were larger than ideal (.980 − .966 = .014). Instead of exploring partial invariance models, we decided to proceed with this model for three reasons. First, TLI and RMSEA, which have greater relevance in the case of ESEM-based models due to being corrected for parsimony, showed that this model indeed achieved invariance. Only changes in CFI exceeded the suggested cutoff values slightly, whereas all other cutoff criteria were met. Second, small deviations are acceptable when these remain small (e.g., .005 or lower) for only one of the fit indices (i.e., .015 instead of .010 for CFI). Third, the inspection of modification indices did not reveal any clear patterns as to which thresholds should be freed up that could substantially impact model fit (i.e., no item thresholds were systematically marked to be freed up across the groups), and we wanted to avoid ad hoc model modifications as these practices should be avoided due to capitalization on chance (Marsh et al., 2010). In summary, we interpreted these results as providing reasonable support for strong invariance across languages.
We next proceeded with the inclusion of invariance constraints on the item uniquenesses to test strict invariance (Model L4). These equality constraints did not lead to substantial decreases in fit (CFI = .966 vs. .957, TLI = .969 vs. .963, RMSEA = .055 vs. .060), implying that the items have the same measurement precision in all linguistic versions. Adding equality constraints to the latent variance-covariance matrix (Model L5) and to the latent means resulted in negligible fit differences (Model L5: ΔCFI = .001, ΔTLI = .003, ΔRMSEA = −.003; Model L6: ΔCFI = −.010, ΔTLI = −.007, ΔRMSEA = .006). Standardized parameter estimates from the latent mean invariant measurement model are reported in the online Supplementary Table S4.
When examining latent mean differences by target and referent groups, significant differences were apparent by language (see Table 5). Given the numerous comparisons, we only highlight general trends: Korean-speaking respondents tended to report the highest level of self-compassion, followed by Spanish and Hungarian-speaking respondents. These groups appeared to be followed by Iranian, Italian, Brazilian, Portuguese, and English-speaking respondents. Finally, compared with the other groups, French, German, Greek, and Norwegian-speaking respondents tended to report the lowest levels of self-compassion
Latent Mean Comparisons Between Groups Formed on the Basis of Language.
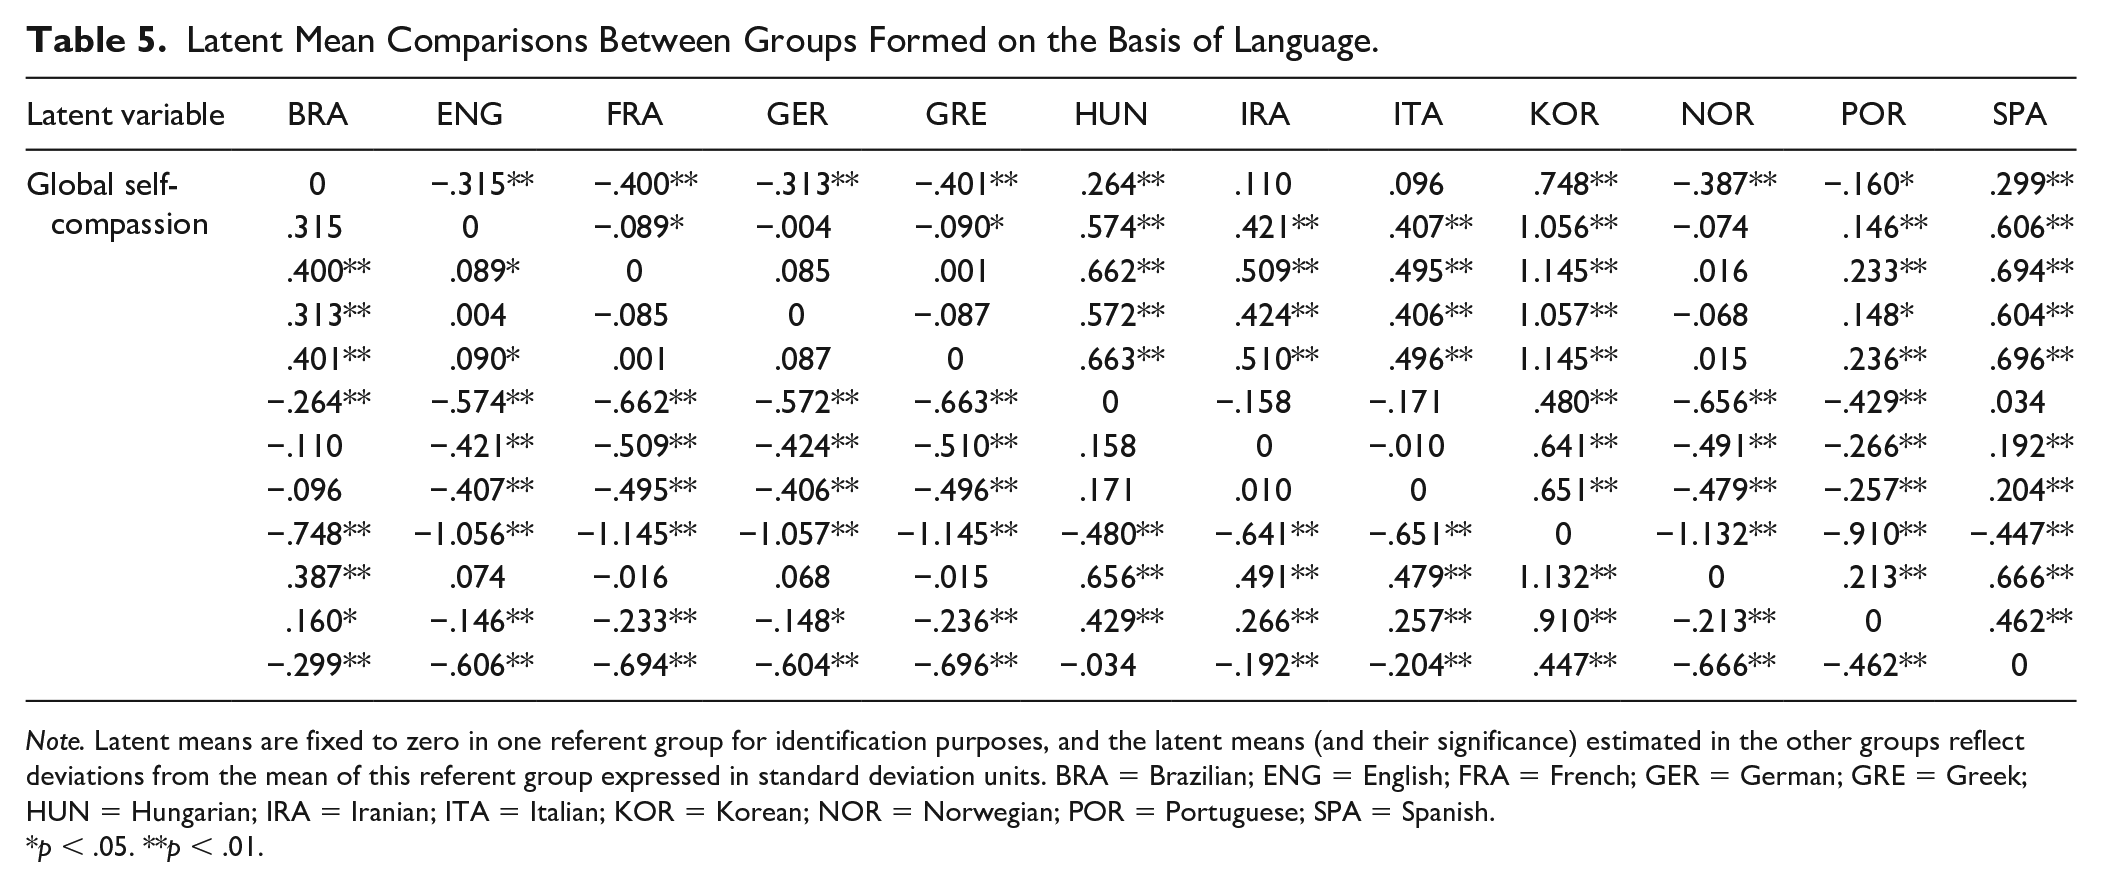
Note. Latent means are fixed to zero in one referent group for identification purposes, and the latent means (and their significance) estimated in the other groups reflect deviations from the mean of this referent group expressed in standard deviation units. BRA = Brazilian; ENG = English; FRA = French; GER = German; GRE = Greek; HUN = Hungarian; IRA = Iranian; ITA = Italian; KOR = Korean; NOR = Norwegian; POR = Portuguese; SPA = Spanish.
p < .05. **p < .01.
However, comparisons by language are not that informative since samples using particular languages varied by population type, and there were multiple English-speaking samples. For this reason, we also examined latent mean differences by country within student and community populations (given that there were only two clinical populations and one mixed population, we did not conduct analyses for these populations). For student populations (see Table 6), Korean students reported the highest level of self-compassion, followed by Iranian students. Canadian, American, and Norwegian students did not differ from each other, and all three had significantly lower levels than both Iranian and Korean students. For community populations (see Table 7), the Spanish sample appeared to have the highest levels of self-compassion, even though they were not significantly higher than the Italians, Hungarians, and Brazilians. The Australians had lower levels of self-compassion than the Spanish, followed by the American and German samples (who were not different from each other but were significantly lower than most of the countries listed above). The Greek, United Kingdom, and French samples appeared to be have the lowest levels of self-compassion, and the U.K. sample was significantly lower than the Greek sample.
Latent Mean Comparisons Within the Student Population.
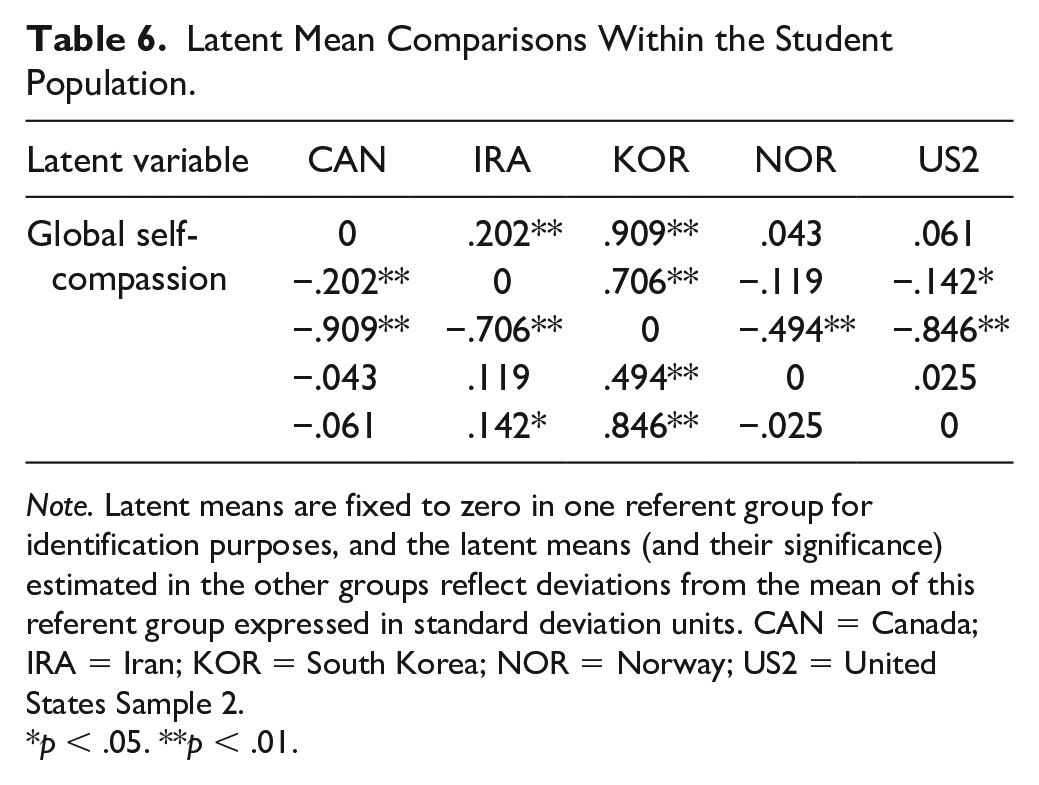
Note. Latent means are fixed to zero in one referent group for identification purposes, and the latent means (and their significance) estimated in the other groups reflect deviations from the mean of this referent group expressed in standard deviation units. CAN = Canada; IRA = Iran; KOR = South Korea; NOR = Norway; US2 = United States Sample 2.
p < .05. **p < .01.
Latent Mean Comparisons Within the Community Population.
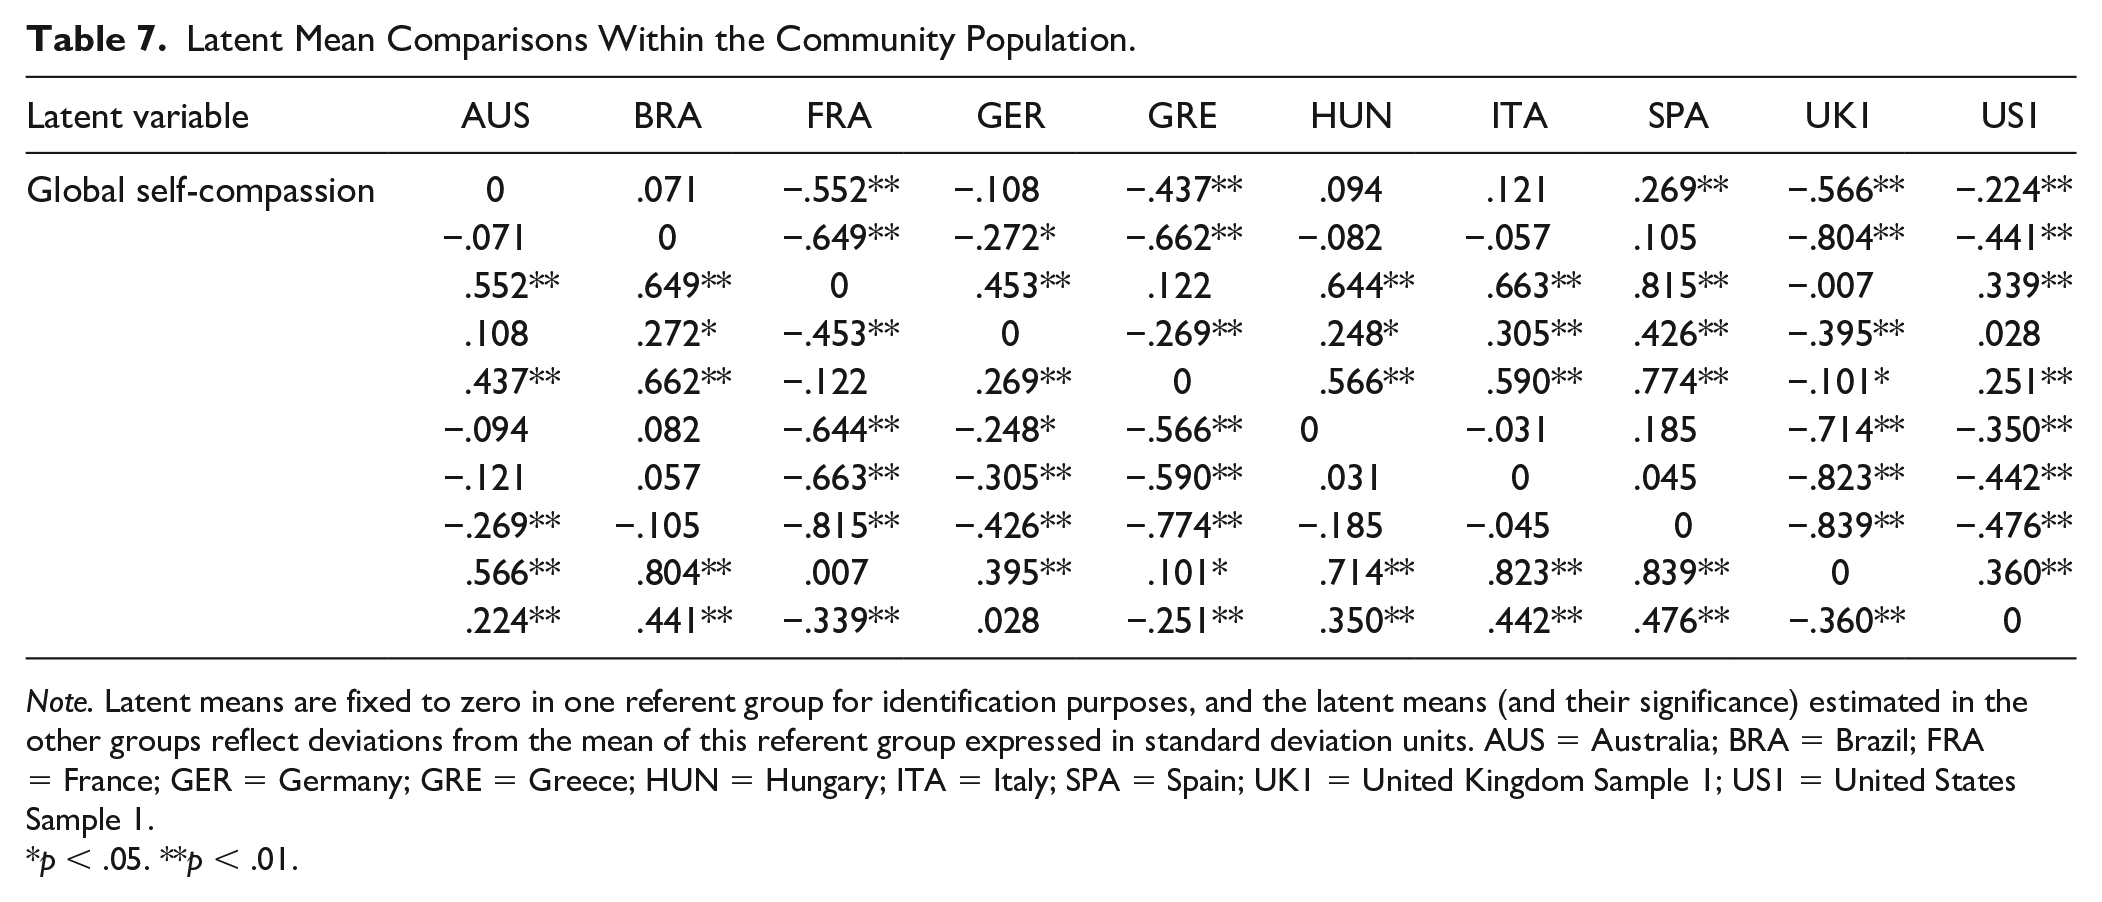
Note. Latent means are fixed to zero in one referent group for identification purposes, and the latent means (and their significance) estimated in the other groups reflect deviations from the mean of this referent group expressed in standard deviation units. AUS = Australia; BRA = Brazil; FRA = France; GER = Germany; GRE = Greece; HUN = Hungary; ITA = Italy; SPA = Spain; UK1 = United Kingdom Sample 1; US1 = United States Sample 1.
p < .05. **p < .01.
Discussion
Overall, findings demonstrated a striking degree of invariance in the factor structure of the SCS across population type, gender, age, and language. We first tested the measurement equivalence of the SCS across population types (i.e., student, community, clinical, and mixed populations). Analyses provided strong support for the complete measurement invariance of factor loadings, thresholds, uniqueness, as well as the invariance of latent variances–covariances of the SCS across all subgroups using the bifactor-ESEM operationalization. Findings suggest that the SCS measures self-compassion in a similar way in these groups without measurement biases. Similarly, when examining gender and age groups, results supported the configural, weak, strong, strict, and latent variance–covariance measurement invariance of factor loadings, thresholds, uniqueness, as well as the invariance of latent variances-covariances of the SCS across gender and age using the bifactor-ESEM operationalization.
The strength of support for linguistic invariance was remarkable. Configural invariance was achieved, suggesting that people with different linguistic backgrounds conceptualize self-compassion similarly. By demonstrating weak invariance, we can conclude that the factor loadings of the items were highly similar across the different groups. This finding would imply that the SCS items function similarly regardless of being presented in English, Spanish, German, Greek, or any other languages present in this study. This finding also implies that predictive relations between self-compassion and other constructs could be meaningfully compared across linguistic groups (e.g., comparing the strength of association between self-compassion and depression in English and non-English samples). The demonstration of strong invariance suggests that the levels of the underlying items are similar in the linguistic groups and that participants do not score higher or lower based on them belonging to a different linguistic group. Strong invariance also indicates that latent means can be meaningfully compared across groups. It has to be noted that, although strong invariance was reached, one of the three fit indices (i.e., CFI) did not suggest it based on the thresholds of Chen (2007) and Cheung and Rensvold (2002). This would have been more concerning had TLI and RMSEA not supported strong invariance and had the difference in CFI been substantially higher than .010. In addition, researchers also agree that the proposed cutoff values should not be treated as “golden rules” but rather as rough guidelines, and one should always use sound judgment when interpreting differences between competing or alternative models (Marsh et al., 2004). Finally, demonstrating strict invariance means that the error variance of the items is similar across the groups and that the items have the same measurement precision. Accordingly, one could compare observed scores across groups without being overly concerned with measurement error.
Although the SCS functioned the same way in all groups without any measurement bias being present (as evidenced by the strong support for configural, weak, strong, and strict invariance), there were differences in latent mean levels of self-compassion displayed between groups. When examining differences by population, clinical populations were found to have the lowest levels of self-compassion compared with the other populations and students the highest. The finding that clinical populations suffering from various mental health challenges reported less self-compassion is not surprising, given that psychopathology stems in part from judging oneself harshly, feeling isolated and ruminating on negative thoughts and emotions rather than being supportive, feeling connected and being mindfully aware of personal suffering (Castilho et al., 2015; Werner et al., 2012). In fact, low levels of self-compassion are seen as a transdiagnostic feature of clinical populations (Schanche, 2013). The finding that student populations scored higher in self-compassion than community populations was somewhat surprising, and contradicts findings of no difference between a student and community sample in the United States (Neff & Pommier, 2013). While further research will be needed to confirm these findings, it may be that attending college is a time of self-reflection, learning, and growth that may lend itself to a more self-compassionate frame of mind (Neff et al., 2005).
In terms of gender, females reported slightly lower latent mean self-compassion than males. This result aligns well with a meta-analysis, including a total of 88 study samples, showing that males reported slightly higher levels of self-compassion than females (Yarnell et al., 2015). This gender difference may be due to the fact that that females tend to be more self-critical and judge themselves more negatively than males, and self-judgment is a component of self-compassion (Leadbeater et al., 1999). However, these gender differences appear to be less a function of sex and more a function of gender role socialization which emphasizes self-sacrifice for females and entitlement for males. Self-compassion involves meeting one’s needs to alleviate suffering, so norms of self-sacrifice work against this process while norms of entitlement encourage it. Research demonstrates that sex differences are negligible once gender roles are taken into account (Yarnell et al., 2018).
Our results also indicated that people became more self-compassionate as they become older, consistent with past research (Homan, 2016; Neff & Pommier, 2013; Neff & Vonk, 2009). In fact, the increasing wisdom, life satisfaction and self-acceptance experienced by the elderly (Ardelt, 1997, Erikson, 1968) is probably bi-directionally linked to increasing self-compassion with age (Neff et al., 2007). The wisdom that comes from maturity and experience allows for a kinder and more balanced stance toward oneself that recognizes that shared nature of human suffering, and the ability to relate to life difficulties and personal imperfection with mindfulness and compassion enhances life satisfaction and acceptance. The fact that self-compassion increases with age is encouraging, given the many benefits that self-compassion provides to the elderly in terms of mental and physical well-being (Allen et al., 2012; Perez-Blasco et al., 2016).
Our results also show that respondents speaking different languages differed from one another in their level of self-compassion. Moreover, when comparing samples within student and community populations, cultural differences were apparent. Although past results examining cross-cultural differences have been mixed (Birkett, 2014; Kemppainen et al., 2013; Neff et al., 2008), the fact that the present study relied on a comprehensive set of samples recruited from a total 15 countries and used sophisticated analytic techniques to control for measurement biases, we can tentatively conclude that there are group differences in self-compassion. This makes sense given the societal, religious, and family influences embedded in culture that are likely to affect self-compassion. Among undergraduates, findings indicated that Korean students reported the highest level of self-compassion. The fact that Korean students reported the highest levels of self-compassion is somewhat surprising, given the influence of Confucianism in East Asian cultures, which is thought to promote self-criticism as a means of achievement (Heine, 2003). Of course, caution should be used in interpreting results given that they may have been sample-specific, and a great deal more research will be needed to determine if these finding replicate. For community adults, it was found that Spanish, Italian, Hungarian, Brazilian, and Australian participants had the highest level of self-compassion, those from the United Kingdom, France and Greece tended to have the lowest levels, with Americans and Germans in between. Of course, the fact that comparisons were confounded by age composition and gender renders findings somewhat difficult to interpret. Also, a great deal more research will be needed to determine if findings replicate. A few things are noteworthy about these findings, however. First, English speaking countries differed in level of self-compassion, indicating that culture may be more important than language in relative impact on self-compassion. Also, there did not appear to be a general trend for more economically prosperous nations to have more self-compassion, suggesting that healthy self-attitudes are not merely a product of standard of living.
Finally, results suggest that while the measurement of self-compassion does not vary by culture, levels of self-compassion do. This has important implications given that meta-analyses have found similarly strong correlations between self-compassion and well-being across cultures (MacBeth & Gumley, 2012; Zessin et al., 2015). For instance, although Neff et al. (2008) found that levels of self-compassion were highest in Thailand and lowest in Taiwan with the United States falling in between, strong negative correlations of self-compassion with depression were found in all three cultures (rs ranging between −.53 and −.61). Given that the measurement invariance of the SCS supports the validity of these cross-cultural results, it appears that self-compassion may be a universally beneficial way to enhance well-being. This is further buttressed by meta-analyses of intervention studies conducted internationally (Ferrari et al., 2019), which have found large decreases in psychopathology after self-compassion training across cultures.
Had high levels of measurement invariance not been achieved, it would have indicated that the construct of self-compassion itself would have varied greatly across groups, which could have led to theoretical and practical complications. The fact that it was achieved provides remarkably strong support for the generalizability of the bifactor-ESEM operationalization of self-compassion and suggests that latent or observed means could be compared along different groups.
In terms of implications for how the SCS should be used, previous research (e.g., Neff et al., 2019) has already shown that the general self-compassion factor appears to account for a substantial amount of reliable variance (95%) in item responses. For this reason, if one is only interested in the global levels of self-compassion, simply averaging the SCS subscale means should be sufficient. If researchers are interested in the mechanisms of action of self-compassion, however, use of the six subscales may be more informative. Still because the bifactor-ESEM operationalization is a complex measurement model due to the disaggregation of the global and specific effects of self-compassion, we advise researchers to, in their pursuits, consider relying on fully latent variables (which are naturally corrected for measurement error) or on factor scores derived from these complex measurement models in order to preserve the nature of the underlying measurement model (Morin, Boudrias, et al., 2016). This approach makes it possible to have a more precise estimation of self-compassion, given that bifactor-ESEM models weight items based on their contributions to the factor itself. To make this scoring process seamless, automated scoring procedures could be developed, or else the Mplus statistical package could be used, which provides standardized measurements as a function of the sample mean and standard deviation (Perreira et al., 2018).
Given the exponentially growing interest in self-compassion and the desirable outcomes associated with it (MacBeth & Gumley, 2012; Neff, Long, et al., 2018; Zessin et al., 2015), it is important to rely on instruments for the measurement of self-compassion that have satisfactory construct validity. Part of construct validity is the examination of the generalizability of an instrument to groups with different characteristics. The present study provided very strong evidence for the measurement invariance of the SCS. This should hopefully give confidence to researchers wanting to use the SCS to examine self-compassion in different gender, age, and linguistic groups.
Limitations and Future Directions
Despite its strengths, several limitations of the present study need to be addressed. First, the research was based on a single self-report questionnaire. While we were able to demonstrate that the SCS functions equivalently across groups, reliance on quantitative data meant we could not closely examine if the construct of self-compassion is construed differently across groups. For instance, self-compassion may be seen as selfish and self-indulgent in some cultures but healthy and necessary in others. Future research should employ more qualitative methods to address this issue. Second, this study used cross-sectional data, and longitudinal research designs could be used in future studies to examine the temporal stability of this operationalization. Third, although the recruited samples were diverse, more investigations should be conducted using different clinical populations, younger participants (e.g., children or adolescents), or specific samples (e.g., varying in religion, socioeconomic status). Other linguistic versions should also be included in future studies that were not used in the present study. Finally, the criterion-related validity of the bifactor-ESEM operationalization of the SCS should also be tested in relation to key indicators of psychological health (e.g., depression or life satisfaction), possibly in a longitudinal setting and across different samples. Indeed, tests related to criterion validity would help achieve a more precise definition of the meaning of the different subscales once global levels of self-compassion have been taken into account.
Overall, the present study provides strong support for the invariance of the bifactor-ESEM model of the SCS across a variety of groups. We would, therefore, encourage future researchers to rely on the bifactor-ESEM operationalization in their investigations of self-compassion.
Supplemental Material
supplementary_material – Supplemental material for Is Self-Compassion Universal? Support for the Measurement Invariance of the Self-Compassion Scale Across Populations
Supplemental material, supplementary_material for Is Self-Compassion Universal? Support for the Measurement Invariance of the Self-Compassion Scale Across Populations by István Tóth-Király and Kristin D. Neff in Assessment
Footnotes
Acknowledgements
We are grateful for the following colleagues (in alphabetical order) for providing us with the samples used in the present study: Paula Castilho, Nima Ghorbani, Jameson K. Hirsch, Jörg Hupfeld, Claudio S. Hutz, Ilios Kotsou, Willem Kuyken, Woo Kyeong Lee, Michail Mantzios, Jesus Montero-Marin, Fuschia M. Sirois, Luciana K. de Souza, Julie L. Svendsen, and Ross B. Wilkinson. The UK clinical sample was drawn from the PREVENT trial, a project funded by the National Institute for Health Research Health Technology Assessment Programme (project 08/56/01).
Declaration of Conflicting Interests
The author(s) declared no potential conflicts of interest with respect to the research, authorship, and/or publication of this article.
Funding
The author(s) disclosed receipt of the following financial support for the research, authorship, and/or publication of this article: The first author was supported in the preparation of this article by a Horizon Postdoctoral Fellowship from Concordia University and by funding from the Social Sciences and Humanities Research Council of Canada (435-2018-0368).
Supplemental Material
Supplemental material for this article is available online.
Notes
References
Supplementary Material
Please find the following supplemental material available below.
For Open Access articles published under a Creative Commons License, all supplemental material carries the same license as the article it is associated with.
For non-Open Access articles published, all supplemental material carries a non-exclusive license, and permission requests for re-use of supplemental material or any part of supplemental material shall be sent directly to the copyright owner as specified in the copyright notice associated with the article.