
Abstract
Malingered attention-deficit hyperactivity disorder (ADHD) may be strongly motivated on college campuses by recreational use of ADHD medications and to obtain unwarranted academic accommodations. Rather than rely on face-valid (easily faked) ADHD checklists, the study focused on the more complex Wechsler Adult Intelligence Scale–Fourth edition (WAIS-IV; Wechsler, 2008). However, the current literature has not yet investigated well-defined detection strategies for feigned WAIS-IV presentations. Using aprioristic standards, four different detection strategies from the feigning literature were adapted to certain WAIS-IV subscales. For example, significantly below-chance performance was applied to visual puzzles. Using a between-subjects simulation design, 74 undergraduate simulators were compared with archival data on 73 outpatients diagnosed with ADHD at a university psychology clinic. Very large effect sizes (Cohen’s ds from 1.66 to 1.90) differentiated between genuine and feigned ADHD. Two strategies (significantly below-chance performance and floor effect) showed strong promise if cross-validated for other feigning presentations. The study concluded with clinical considerations and future avenues for research.
Keywords
Feigned cognitive impairment (FCI) continues to be a cornerstone issue in clinical and forensic assessments. Related concepts of “suboptimal effort,” “noncredible performances,” “response bias,” and “possible malingering” have pushed estimates of feigning as high as 50% (Young, 2014). In stark contrast, classic surveys (e.g., Rogers, Salekin et al., 1998) have produced far lower base rates of 17.4% forensic and 7.2% nonforensic cases when seasoned forensic practitioners are restricted to the Diagnostic and Statistical Manual of Mental Disorders definition of malingering. Young (2015) concluded that more focused estimates typically fall between 0% and 30%. Whatever the true base rate, malingering occurs frequently and plays a central role in forensic assessments.
Meta-analyses have compellingly demonstrated the importance of systematically assessing validity indicators for feigning within two broad domains: (a) FCI; e.g., simulated intellectual disability or faked attention-deficit hyperactivity disorder (ADHD) deficits and (b) feigned mental disorders (FMD; e.g., simulated posttraumatic stress disorder). For instance, Sollman and Berry (2011) documented very large effect sizes on cognitive tests for a range of clinical presentations using both simulation and known-group designs. More recently, Sharf et al. (2017) conducted a meta-analysis of the Minnesota Multiphasic Personality Inventory–2 Restructured Form (Ben-Porath & Tellegen, 2011) involving both FCI and FMD. Interestingly, the Response Bias Scale (Ben-Porath & Tellegen, 2011)—intended to assess FCI—evidenced unpredicted elevations (i.e., Ms > 75T) for certain genuine disorders (posttraumatic stress disorder, major depression, neurological impairment). It also failed to discriminate between the two feigning domains (d for FCI = 0.88; d for FMD = 0.95). Focusing solely on feigned ADHD, a meta-analysis by Wallace et al. (2019) found remarkable differences in both methodological rigor as well as effect sizes.
Feigning on intelligence tests may have far-reaching consequences at both individual and societal levels. Intellectual abilities are often evaluated as a core component of disability determinations (Foote, 2016) either on its own or resulting from other disorder. With 2.4 million claiming disability due to mental disorders alone (Anfang et al., 2018), even a 5% prevalence of feigning on intellectual measures might yield about 120,000 potentially undetected malingerers.
FCI Assessment and the WAIS-IV
Garcia-Willingham et al. (2018) systematically reviewed Wechsler Adult Intelligence Scale–Fourth edition (WAIS-IV; Wechlser, 2008) FCI studies, utilizing embedded validity scales. As one of the earliest efforts, Mittenberg et al. (1995) proposed using Vocabulary minus Digit Span subtests (V − DS). According to Mittenberg et al. (1995, p. 492), the V − DS was intended to identify feigners with “theoretically derived method . . . based on a predicted disproportionate reduction in Digit Span relative to other intellectual functions.” Vocabulary was selected because it was “most closely related to overall level of intellectual function.” As an initial detection strategy, V − DS capitalized on a consistent but not necessarily strong finding that some simulators overplayed their feigned deficits on DS.
Greiffenstein et al. (1994) proposed the Reliable Digit Span (RDS), which is operationalized as “summing the longest string of digits repeated without error over two trials under both forward and backward conditions” (pp. 219-220). However, they provided no conceptual rationale for its use as a measure of FCI. Nonetheless, more than two-dozen studies have evaluated its effectiveness with decidedly mixed results. From a positive perspective, Jasinski et al. (2011) concluded via a meta-analytic review that the RDS had a large effect size (M d = 1.34) and strong utility estimates. In contrast, Schroeder et al. (2012) adopted a more nuanced approach in examining specific clinical and demographic groups. Using a RDS cut score of ≤6, for instance, specificity rates were devastatingly low for persons with intellectual disabilities (.27) and deeply concerning for Hispanic patients (i.e., .69 and .81 in two investigations). Moreover, sensitivity (overall M = 0.30) remained low, limiting its clinical usefulness.
Other approaches to FCI on the WAIS measures are not conceptually driven (Garcia-Willingham et al., 2018). As the clearest example, Mittenberg et al. (1995) utilized discriminant function with seven WAIS-R scores in an effort to predict the simulating and head trauma groups. In summary, most WAIS-IV feigning research has not applied empirically validated FCI detection strategies (Rogers, 2018).
Detection Strategies for the WAIS-IV
More than 25 years ago, Rogers et al. (1993) conducted the original review of FCI detection strategies. Tellingly, recent reviews (e.g., Rogers & Bender, 2018) continue to affirm four of the five detection strategies currently used in clinical research: floor effect (FE), significantly below-chance performance 1 (SBCP), performance curve (PC), and magnitude of error (MoE).
The current research utilizes these four empirically based detection strategies with the WAIS-IV. This section briefly reviews how each detection strategy will be defined and applied to the WAIS-IV. Brief titles are added to the lead paragraphs for each detection strategy. Utilizing relevant studies, aprioristic operationalizations were established for each detection strategy at three different levels of rigor: relaxed, stringent, and very stringent (see Table 1).
WAIS-IV Detection Strategies for FCI with Aprioristic Operationalizations.

Note. WAIS-IV = Wechsler Adult Intelligence Scale–Fourth edition; FCI = feigned cognitive impairment; DS = Digit Span; DSF = Digit Span forward; DSB = Digit Span Backward; MR = Matrix Reasoning; VP = visual puzzles; R = relaxed; S = strict; VS = very strict.
Floor Effect
FE is characterized by an unexpectedly large number of incorrect responses on “very easy cognitive tasks (i.e., ‘too simple to fail’)” that can be “successfully completed by most impaired persons” (Rogers & Bender, 2018, p. 29). When grossly exaggerating their cognitive impairment, some examinees do not consider item difficulty and can be detected by FE. For the current study, FE can be tested within the selected WAIS-IV subtests.
FE cut scores are based on high rates of success for genuine responders from the appropriate clinical sample. For instance, FE ≥ 90 (see Table 1) means that at least 90% of genuine responders from the relevant population correctly responded to this item. When scales a have small number of items, it is often not possible to be as stringent as FE ≥ 90. For example, Rogers, Robinson, et al. (2017) attempted to identify those feigning implausibly wrong Miranda beliefs on the Miranda Questionnaire (MQ; Rogers et al., 2012). Because it is composed of only 25 items, they had to rely on the relaxed standard of MQ-FE ≥ 85 in order to retain seven FE items. In contrast, the Inventory of Legal Knowledge (ILK; Musick & Otto, 2010) designed to identify feigned legal knowledge and consists of 61 items. With this large number of items, Rogers, Robinson, et al. (2017) were able to establish stringent (ILK-FE ≥ 90) and very stringent (ILK-FE ≥ 95) scales. Consistent with its detection strategy, ILK-FE ≥ 95 had outstanding sensitivity (.97) and specificity (1.00) with the latter being maintained (.97) in a cross-validation study (Rogers, Henry, et al., 2017).
Significantly Below-Chance Performance
SBCP is used for items with a forced-choice format, typically with chance performance set at 50%. Thus, binomial probability can be applied to establish SBCP cut scores significantly below random responding (Rogers & Bender, 2018). By its operationalization, specificities are high to very high; however, many feigners do not simulate such extreme impairment, thereby limiting sensitivity. For the current study, visual puzzles (VP) was selected because feigners must correctly choose three of six choices representing a 50% chance level. Using eight items with 24 selections, SBCP probabilities were calculated.
Past research was applied in establishing relaxed, stringent and very stringent standards. For the stringent standard, the malingered neurocognitive dysfunction (MND) model (Slick et al., 1999) utilized p < .05 to designate SBCP. This standard is widely used with feigning measures such as the Test of Memory Malingering (Tombaugh & Tombaugh, 1996) and the ILK (Musick & Otto, 2010). The relaxed standard (p < .10) relied on early research on the Portland Digit Recognition Test (Binder, 1993). Finally, no feigning studies were found to inform the very stringent standard. In forensic research on competency to stand trial, however, p ≤ .02 was considered as the most rigorous (Rogers et al., 2004); it will be used for the very stringent standard.
Performance Curve
Rogers et al. (1993) indicated the PC detection strategy “presupposes that malingerers will not take into account differences in item difficulty in deciding which questions to fail” (p. 261). When the percentage correct is plotted for genuine responders, it generally forms a negative accelerating curve until it reaches chance performance. For feigners, a much flatter profile is typically generated, because more items of easy and medium levels are missed. Gudjonsson and Shackleton (1986) conducted one of the earliest studies, demonstrating the effectiveness of PC on Raven’s Standard Progressive Matrices. Moreover, the PC strategy appears to be effective even when participants are cautioned about its application to their feigning; their performance may actually worsen (Bender & Rogers, 2004). For the current study, the PC detection strategy is tested on the Matrix Reasoning (MR) subtest.
Methods of assessing PCs are sometimes very complex, including the calculation of slopes (Wogar et al., 1998) or running means across multiple sectors (Frederick, 2003). For this study, we opted for three levels of item difficulty (Rogers et al., 2012), based on the percentages correct in the clinical sample: easy (61% to 80%), medium (41% to 60%), and difficult (21% to 40%). Extremes were intentionally avoided to (a) minimize overlap with FE (very easy; >80%) and (b) eliminate items failed by most (very difficult; ≤20%). Regarding the latter, feigners cannot fake what they do not know in a forced-choice format.
Magnitude of Error
In scoring cognitive tests, psychologists focus almost entirely on correct responses (i.e., partial and full credit) rather than consider the degree that failed responses are “off-the-mark.” Therefore, MoE was developed as a detection strategy (Rogers et al., 1993) that could identify noncredible errors rarely observed in an appropriate clinical comparison sample. The MoE strategy assumed that feigners would not be overly concerned in selecting incorrect responses (Bender & Rogers, 2004). This strategy has successfully detected more uncommon responses by both simulators and suspected malingerers in prior memory feigning research (Martin et al., 1998). As a simple illustration, Bender and Rogers (2004, p. 52) asked participants to “complete a sequence by choosing the correct beginning and end responses (e.g., _ 5, 4, 3, _) from four possible choices (e.g., 7, 2, 6, 4).” In this instance, the MoE can be directly calculated. MoE can be empirically derived from “frequent” and “infrequent” errors (e.g., WAIS-IV MR) based on clinical data from genuine responders.
The available research (Bender & Rogers, 2004; Liff, 2004; Stevens et al., 2008) did not yield any aprioristic standards that could be systematically applied to MoE. However, infrequent errors (i.e., MoE) clearly represent the inverse of frequent successes (FE). As a result (see Table 1), we inverted the FE standards for infrequent (INF) errors: INF < 15% (relaxed), INF < 10% (stringent); INF < 5% (very stringent).
Current Study
The current study examined FCI detection strategies as applied to feigned ADHD on the WAIS-IV (Wechsler, 2008). Using a between-subjects simulation design (Rogers & Bender, 2018), undergraduate participants were provided with a realistic scenario instructing them to feign ADHD. They were systematically contrasted with an archival clinical comparison group, diagnosed with ADHD. To standardize incorrect responses, only WAIS-IV subtests were used for which particular wrong answers were specified: DS, MR, and VP. The single exception involved Coding (CD) on which any incorrect answers were thought to be unlikely among the Genuine ADHD group, because commission errors (i.e., making the wrong response on a very simple cognitive task) are rarely observed in genuine clients (e.g., “d errors” on the b Test; Boone et al., 2002).
Method
The study was approved by the University of North Texas (UNT) Institutional Review Board. In addition, the Psychology Clinic’s Executive Board reviewed and granted approval for retrieving the archival clinical data. We reported how we determined our sample size, all data exclusions, all manipulations, and all measures in the study.
Participants
A total of 147 participants were utilized for this between-subjects simulation study. The ADHD-simulation group and the ADHD-genuine group (i.e., the clinical comparison sample) are described in more detail in the subsequent paragraphs. The total number for the ADHD group was 73. It represented all the available cases from March 2013 (i.e., the date on which the online data storage was implemented) to January 2019. To keep the groups comparable, 74 were included in the ADHD-simulation group.
ADHD-Simulation Group
The ADHD-simulation group included 74 undergraduate students, who were at least 18 years of age and enrolled in a psychology course at the UNT. All participants were asked about any history of ADHD or ADHD medication. If either was acknowledged, prospective participants were to be excused from the study. However, no participants were screened out. 2 A manipulation check was conducted after the study was completed for research credit regarding ADHD diagnoses. Still no data needed to be excluded.
ADHD-Genuine Group
Participants with previous ADHD diagnoses (n = 73) were obtained by using archival data from the UNT Psychology Clinic. ADHD diagnoses are based on a comprehensive psychological assessments. Inclusion criteria involved an ADHD diagnosis and general consent for the anonymous use of archival data. The exclusion criterion was minimal, eliminating only data from those under the age of 18 years.
Measures
The Wechsler Adult Intelligence Scale–Fourth Edition
The WAIS-IV (Wechsler, 2008) measures overall cognitive functioning and intellectual abilities. All subtests demonstrated excellent interrater reliability (ICC = .98 to .99; Wechsler, 2008). Four subtests were utilized in the current study. First, the DS subtest measures attention, concentration and mental control with 48 items across its three subsections: Digit Span Forward (DSF), Digit Span Backward (DSB), and Digit Span Sequencing (DSS). Second, MR with 26 items uses sequences of shapes to measure nonverbal abstract problem solving, inductive reasoning, and spatial reasoning. Third, the VP subtest—also with 26 items—measures spatial reasoning. Fourth and finally, the CD subtest is a timed (120 seconds) test of visual-motor coordination, motor and mental speed, and visual working memory.
The Conners’ Adult ADHD Rating Scale Self-Report: Short Version (CAARS-S:S)
The CAARS-S:S (Conners et al., 1999) summarizes self-reported ADHD problems in adult participants. Four subscales include the following: Inattention/Memory Problems, Hyperactivity/Restlessness, Impulsivity/Emotional Lability, and Problems with Self-Concept. The CAARS has good to excellent test–retest reliability (rs from .80 to .91; Conners et al., 1999).
Procedure
Procedures are described separately for the archival data (genuine ADHD group) and the current data (feigning ADHD group).
Genuine ADHD Group
For the clinical comparison sample (Rogers & Gillard, 2011), data for the genuine ADHD group were obtained via client files from the UNT Psychology Clinic. Only files with general consents for archival data were reviewed. De-identified data were entered into Excel files by doctoral students in clinical psychology. Diagnoses as well as WAIS-IV FSIQ (Full Scale Intelligence Quotient) and index scores were compiled. Basic demographic information such as age, ethnicity, gender, and education level was also collected. For this study, item-level responses were collected for DS, MR, and VP. For CD, each item was scored as correct or incorrect.
Feigning ADHD Group
Participants in the feigning ADHD group were recruited through the research participation pool of UNT’s psychology department. The study was explained to potential participants individually with an opportunity to ask questions or request more information. They were informed about receiving course credit for their participation as well as alternative methods of obtaining extra credit. Each participant provided written informed consent.
Following the informed consent, participants were administered the CAARS-S:S as a brief measure for ADHD-related symptoms. It was utilized in a post hoc analysis to evaluate whether results would remain similar to those with few or many ADHD characteristics.
Simulation Design
The rigor for simulation designs include several methodological considerations. For a realistic scenario (Rogers & Cruise, 1998), the current scenario was adapted from Sollman et al. (2010) and Robinson and Rogers (2018). Undergraduate feigners can easily identify with the challenges of coursework and the understandable motivation to perform better with less effort as a result of ADHD medication. They were presented with the following scenario: Your roommate has been diagnosed with ADHD. He had trouble with classes, but then was given some medication for ADHD from his family doctor, and now does well. He even got a couple of A’s recently, and has more time to socialize because studying is not as hard! During your midterms, you decided to try your roommate’s medication, and ended up surprising yourself with how much easier things went. You think that you may have undiagnosed ADHD, so you Google the disorder to learn more about it. Your goal: Please take the following test as if you are trying to convince a psychologist that you have ADHD. Remember, you’re trying to be convincing so that you can get a prescription like your roommate. It is not necessary for you to try to act like you have ADHD; you only need to respond to the test items as if you do. In other words, it’s about how you answer the questions, not how you act while taking the tests. But beware, some tests have questions to catch fakers, so you have to be smart about it. If you are too obvious, the psychologist would never believe you and you would get in trouble. Are you clever enough to fake enough to get medication, but not be so blatant that you get caught?
As noted in the scenario, feigners could learn more about ADHD before they engaged in simulation. Given the easy access to online information (Booksh et al., 2010; Sollman et al., 2010), a list of ADHD symptoms was supplied to correspond with the “Google” search mentioned in the scenario.
The scenario is designed to increase feigners’ investment in credible performance (Rogers & Bender, 2018). Participants are provided with both external incentives (i.e., college credit) and internal motivation. Regarding the latter, personal challenges (“Are you clever enough to fake” successfully?) may encourage participants to see if they “can beat the tests,” enhancing their internal motivation to win (Rogers & Gillard, 2011). To mirror real-world conditions, simulators were also cautioned that failed attempts at feigning could cause them trouble.
Following the scenario, feigners were administered the following subtests of the WAIS-IV: DS, MR, VP, and CD. This sequence of subtests follows the standard order of administration. After the simulation component, participants were tasked to respond genuinely on basic demographics (e.g., age, education, and self-identified ethnicity).
Manipulation Checks
Manipulation checks are important to remove uninformed and disengaged participants (Rogers & Bender, 2018). Studies (e.g., Robinson & Rogers, 2018) have shown that 5% to 10% of participants either fail to remember the scenario/instructions or disclose poor effort. Besides their recall, feigners in the current study rated their efforts on a 10-point scale (1 = didn’t try at all, 5 = somewhat tried, gave about 50% effort, 10 = tried my hardest). Participants with poor recall of instructions or effort less than 7 (tried fairly hard) were to be eliminated from the study. However, no participants failed this manipulation check; instead, they reported a high level of effort (M = 7.91, SD = 1.57).
Supplementary Analysis
Woods et al. (2011) selectively investigated performance on the WAIS-IV DSF and DSB. For DSF, first digit errors (i.e., primacy effect) were virtually nonexistent for the genuine group but occurred with more than 15% frequency for the feigning group. Given the paucity of research, DSF and DSB were included as a supplementary analysis.
Establishment of Effect Sizes
Overreliance on statistical significance without a full appreciation of effect sizes may have contributed to the current replication crisis in psychology (Maxwell et al., 2015). In addition to establishing aprioristic operationalizations, the current study adopted rigorous standards for effect sizes that have long been utilized (Rogers, 2008, 2018) in the assessment of response styles: “moderate” (Cohen’s d ≥ 0.75), “large” (d ≥ 1.25), and “very large” (d ≥ 1.50). As a parallel to Cohen’s d, empirical-correlate research (Rogers et al., 2018; Sharf & Rogers, 2020) has recently started to implement equivalent standards: .35 (“moderate”), .53 (“large”), and .60 (“very large”).
Results
Regarding biological sex, women (54.8%) had a slightly higher representation in the genuine ADHD group than men (45.2%). Consistent with undergraduate psychology-major demographics (Snyder et al., 2019), this disparity increased substantially for the ADHD simulators (73.0% and 27.0%, respectively). The genuine ADHD group (M = 25.59, SD = 4.17) was significantly older than the feigned ADHD group (M = 20.51, SD = 7.47; F = 55.63, p < .001, d = 0.84) but both groups averaged in low to mid-twenties.
The groups did not significantly differ in their self-identified ethnicity. The overall sample consisted primarily of European American (51.0%), Hispanic American (23.8%), and African American (10.2%), with smaller representations of Asian (4.8%), biracial (6.1%), and other/not reported (4.1%).
For the genuine ADHD group, all WAIS-IV indexes fell within the average range; M FSIQ = 102.77 (SD = 12.86). With ADHD, processing speed abilities was the lowest index scores (M PSI = 95.36, SD = 11.96). Based on past studies (e.g., DuPaul & Volpe, 2009; Katz et al., 2011), this reduction was expected. Regarding Diagnostic and Statistical Manual of Mental Disorders–Fifth edition diagnoses, the genuine ADHD group averaged 1.81 (SD = .76) disorders with major depressive disorder (28.8%), learning disorders (19.5%), and anxiety disorders (19.2%) as common comorbidities.
Using the CAARS-S:S as a brief screen for reported ADHD problems, the feigned ADHD group averaged a T score of 48.89 (SD = 9.67) far below the suggested T-score cut score ≥ 65 for the ADHD Index. Nine simulators met this cut score with only one simulator (1.4%) exceeding 70T.
Susceptibility of Select WAIS-IV Subtests to Feigned ADHD
The feigned ADHD group produced dramatically lower WAIS-IV subtest scores than the genuine ADHD counterparts (see Table 2). In general, the genuine ADHD group scored in the average range with minimal variation in WAIS-IV subtest scores (9.96-10.83). In stark contrast, the feigned ADHD group had scores in the 5 to 6 range, which fall in the range of borderline intellectual functioning (Wechsler, 2008). The greatest difference (d = 1.90) was observed on MR with the feigned ADHD group having an average scaled score (M = 5.34) of only about half of their genuine counterparts (M = 10.83). The ability of simulators to suppress these selected WAIS-IV subscales was amply documented with very large effect sizes (M d = 1.72; range from 1.66 to 1.90).
Differences between ADHD-Genuine and ADHD-Feigning Groups on WAIS-IV Subtest Raw and Scaled Scores.
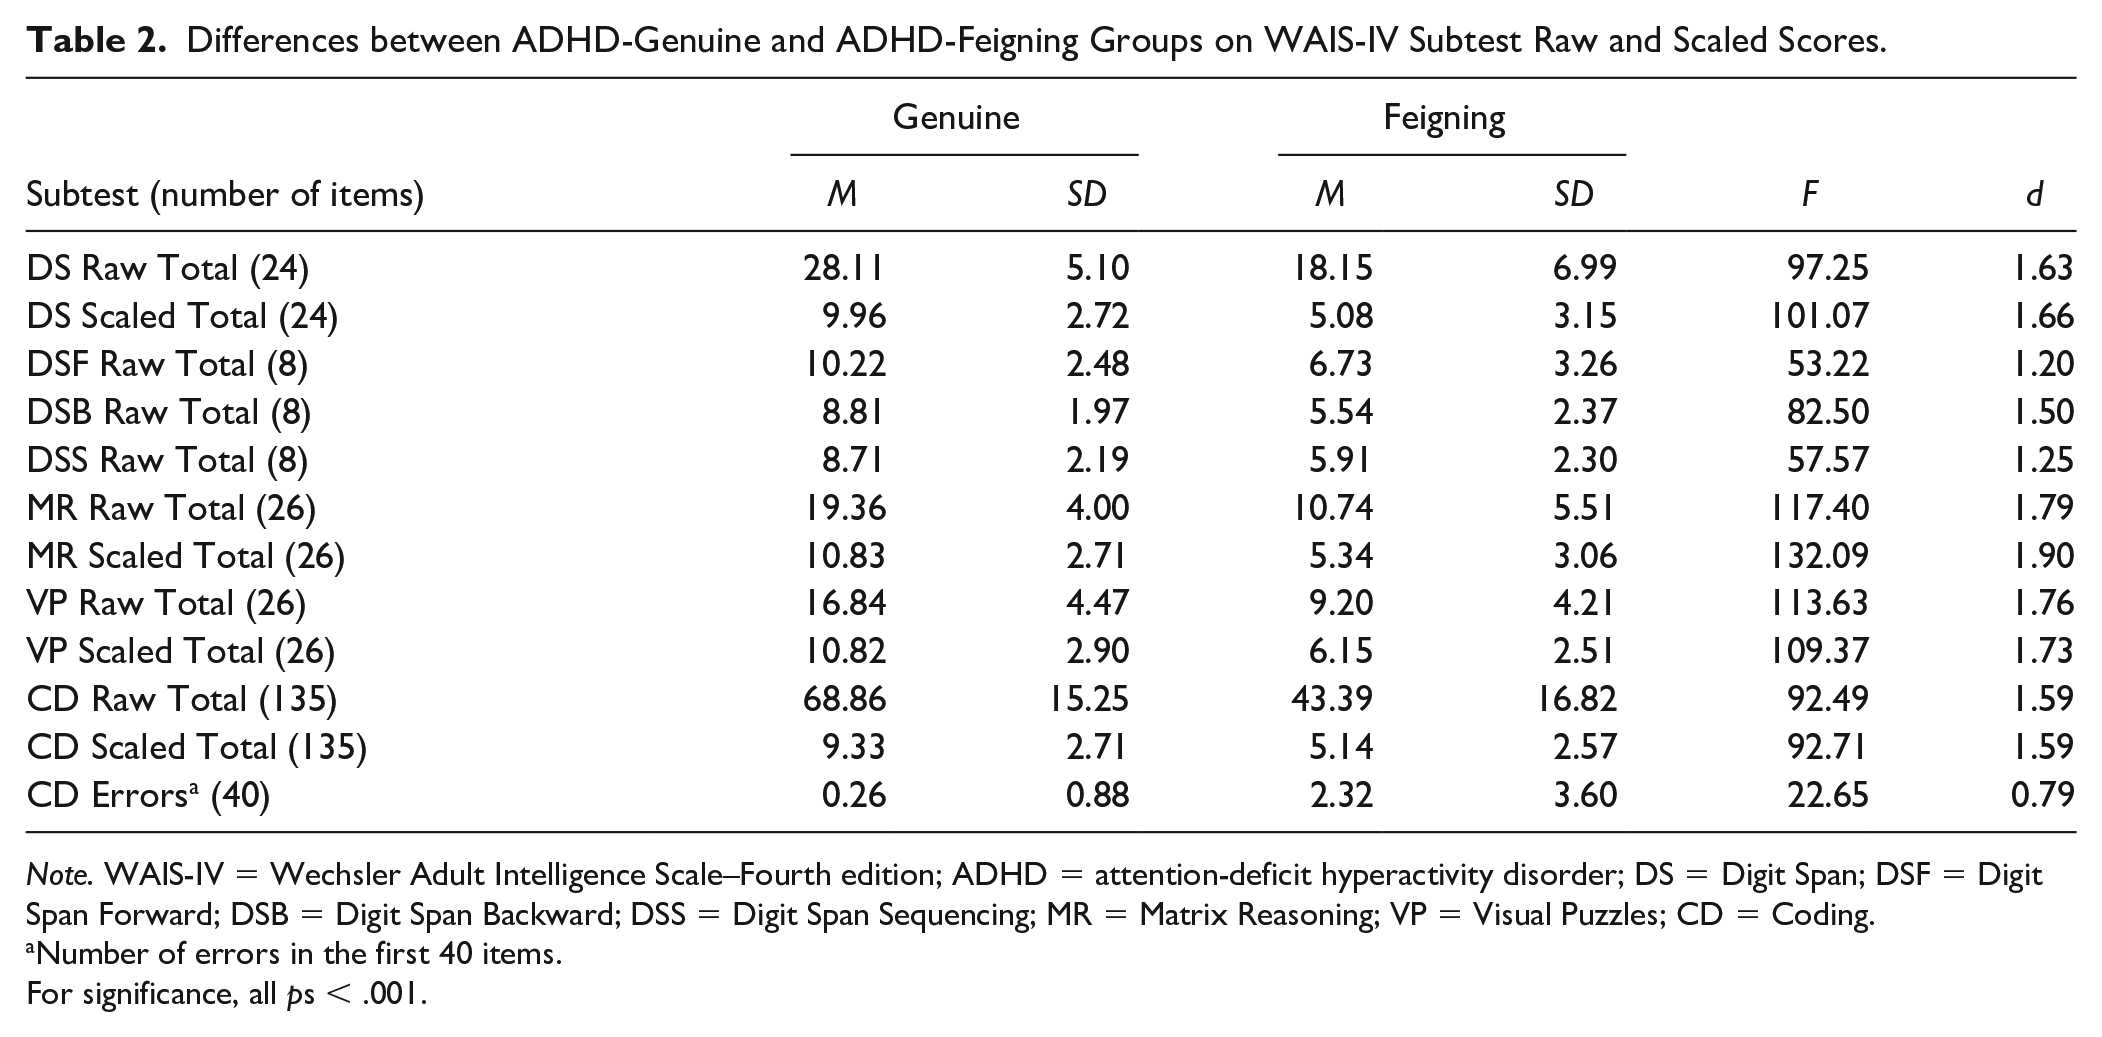
Note. WAIS-IV = Wechsler Adult Intelligence Scale–Fourth edition; ADHD = attention-deficit hyperactivity disorder; DS = Digit Span; DSF = Digit Span Forward; DSB = Digit Span Backward; DSS = Digit Span Sequencing; MR = Matrix Reasoning; VP = Visual Puzzles; CD = Coding.
Number of errors in the first 40 items.
For significance, all ps < .001.
Our working hypothesis proved correct that the genuine ADHD group would make virtually no errors on CD (see Table 3). In particular, most (86.3%) of the genuine ADHD group had no errors; the cumulative percentage for 1 or 2 errors rose to 95.9%. For feigned ADHD, a far different picture emerged. While nearly half (45.9%) had no errors, the remaining were widely dispersed ranging from 1 to 18. As a result, the large SD (3.60) militated against a large effect size (0.79).
Differences on WAIS-IV for Feigning Indicators between ADHD-Genuine and ADHD-Feigning Groups.
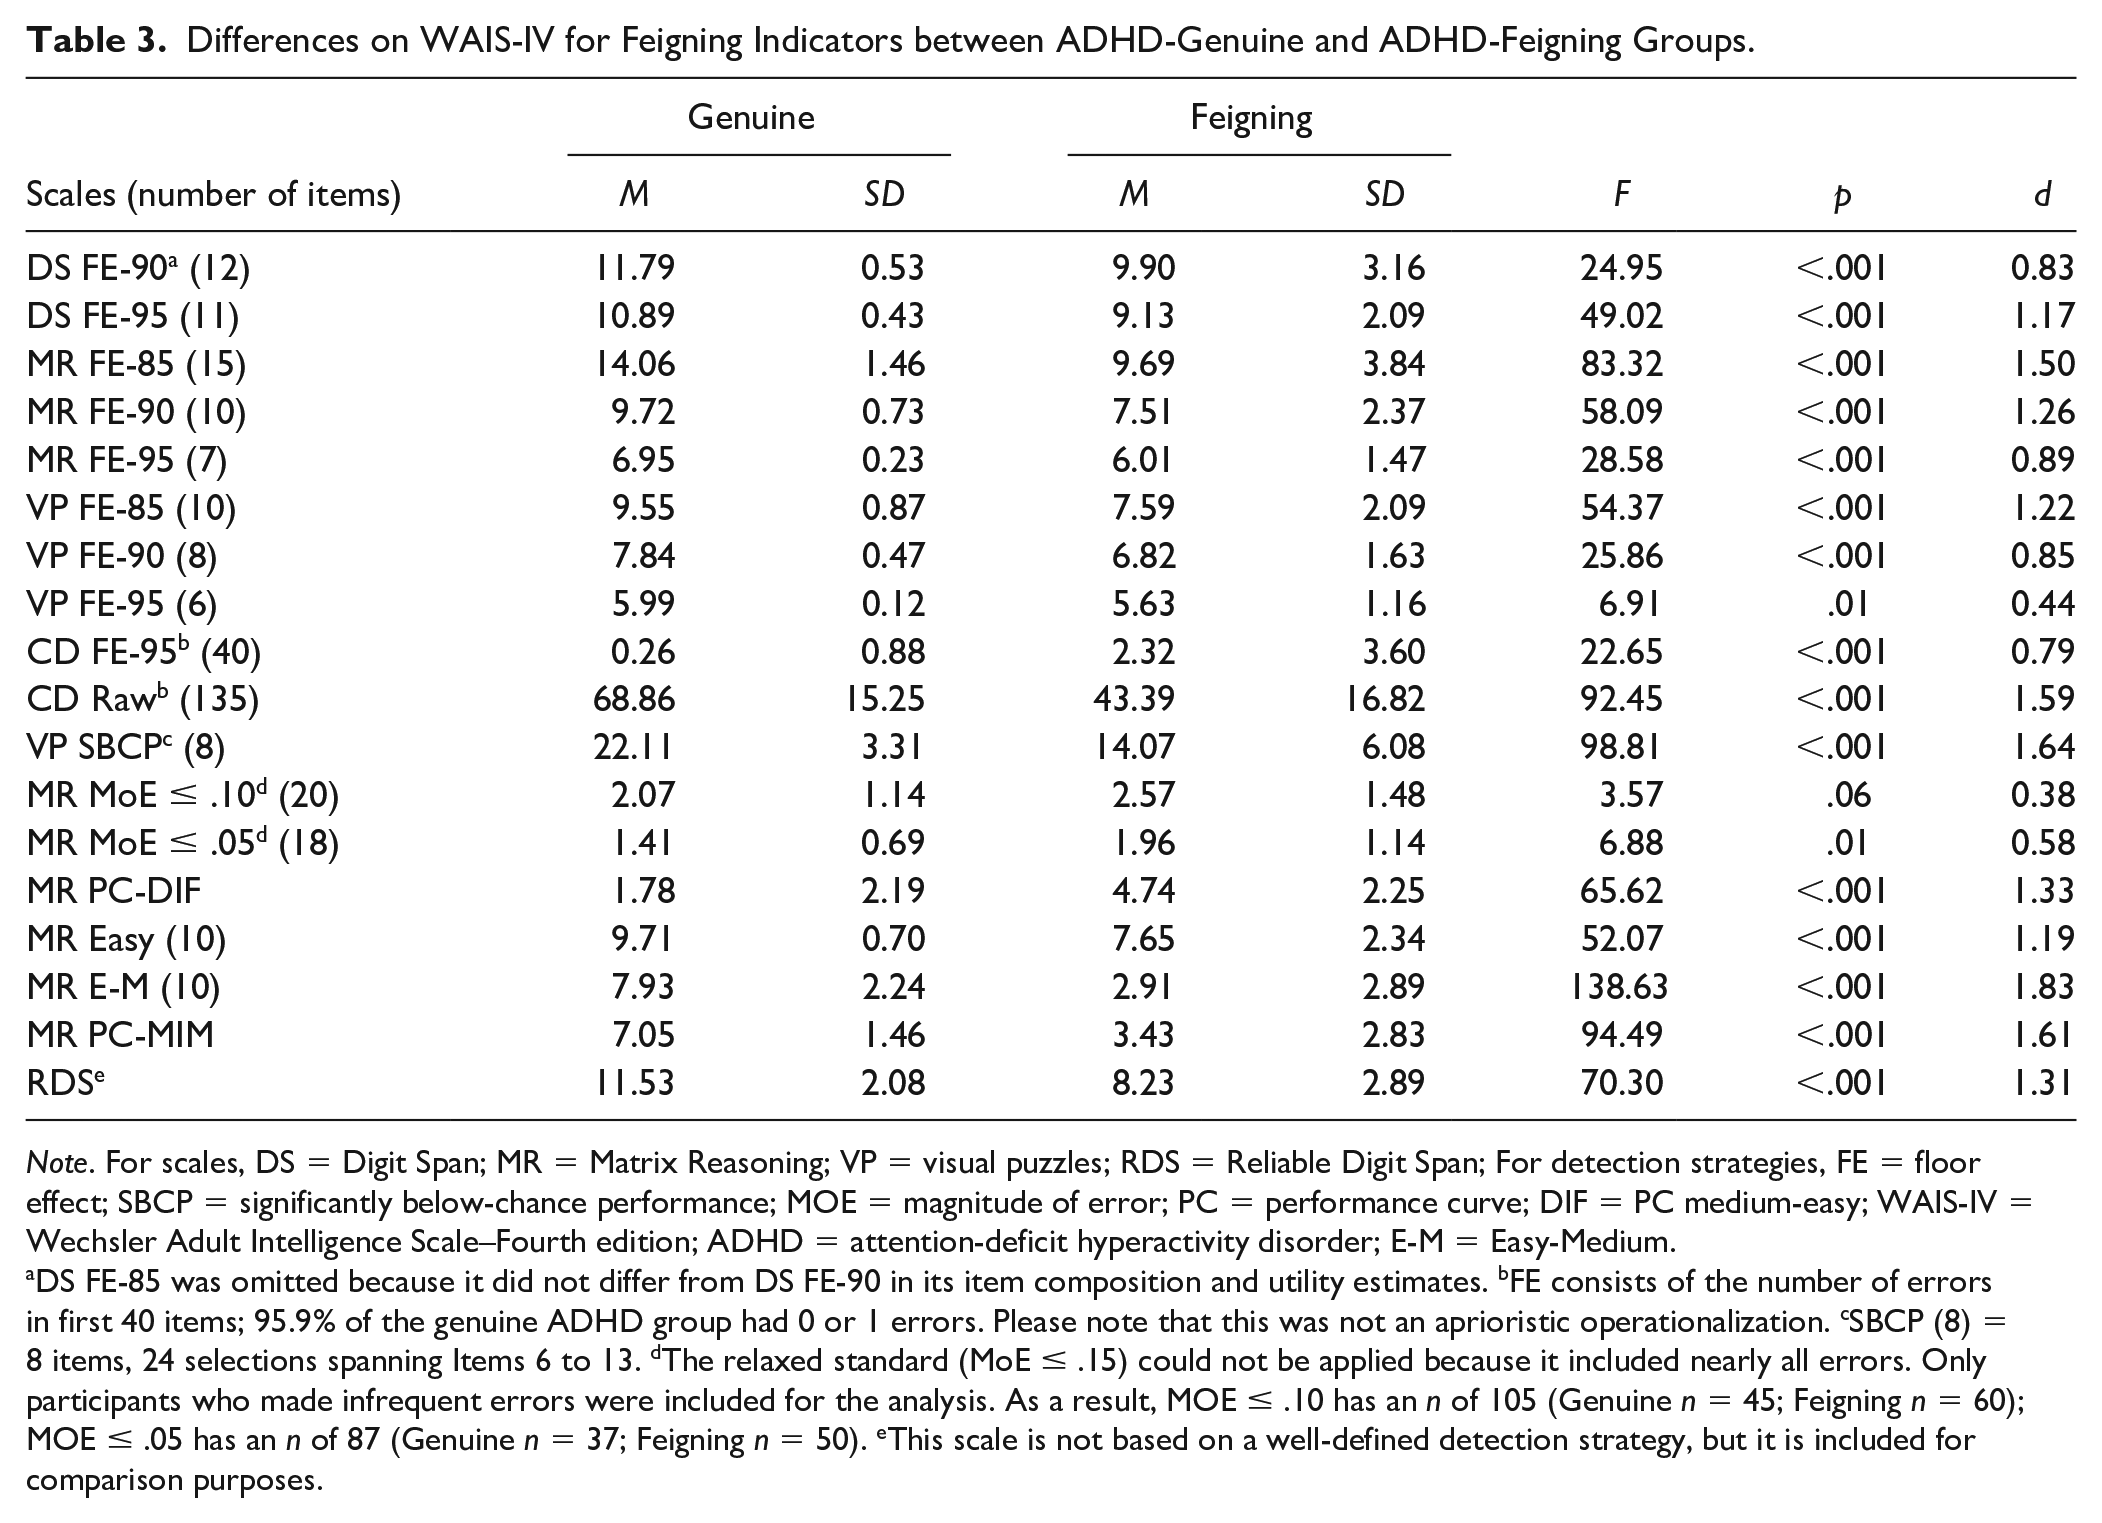
Note. For scales, DS = Digit Span; MR = Matrix Reasoning; VP = visual puzzles; RDS = Reliable Digit Span; For detection strategies, FE = floor effect; SBCP = significantly below-chance performance; MOE = magnitude of error; PC = performance curve; DIF = PC medium-easy; WAIS-IV = Wechsler Adult Intelligence Scale–Fourth edition; ADHD = attention-deficit hyperactivity disorder; E-M = Easy-Medium.
DS FE-85 was omitted because it did not differ from DS FE-90 in its item composition and utility estimates. bFE consists of the number of errors in first 40 items; 95.9% of the genuine ADHD group had 0 or 1 errors. Please note that this was not an aprioristic operationalization. cSBCP (8) = 8 items, 24 selections spanning Items 6 to 13. dThe relaxed standard (MoE ≤ .15) could not be applied because it included nearly all errors. Only participants who made infrequent errors were included for the analysis. As a result, MOE ≤ .10 has an n of 105 (Genuine n = 45; Feigning n = 60); MOE ≤ .05 has an n of 87 (Genuine n = 37; Feigning n = 50). eThis scale is not based on a well-defined detection strategy, but it is included for comparison purposes.
WAIS-IV Feigning Indicators Based on Detection Strategies
The aprioristic operationalization involved four different FCI detection strategies on WAIS-IV subtests for differentiating between feigned and genuine ADHD. Results will be organized by detection strategies (see Table 3). The item composition for each detection strategy is included in the supplementary material (see Table S1, available online). This section parallels the introduction in examining each detection strategy separately and in the same order.
Floor Effect
The FE produced marked differences across the four WAIS-IV subtests. For example, the feigned ADHD group performed nearly as well as the genuine ADHD group on the very easiest items of VP (i.e., FE-95 with a d of merely 0.44). Feigners may have recognized the utter simplicity of the items and opted to succeed, achieving 5.63 of 6.00 or 93.8% correct. Overall, the largest FE effect size (d = 1.50) was observed with MR FE-85, which was partially constrained by the marked variability (SD = 3.84) in the feigning ADHD group.
Regarding utility estimates, the FE sensitivities (see Table 4) differed remarkably. MR FE demonstrated the most versatility: MR FE-85 (relaxed standard) yielded an excellent sensitivity (.92), whereas MR FE-95 (very stringent standard) produced an outstanding specificity (.95). In general, VP FE lagged behind the other FE indicators with OCC rates varying from .73 to .79.
Effectiveness for Detection Strategies on WAIS-IV between ADHD-Genuine and ADHD-Feigning Groups.
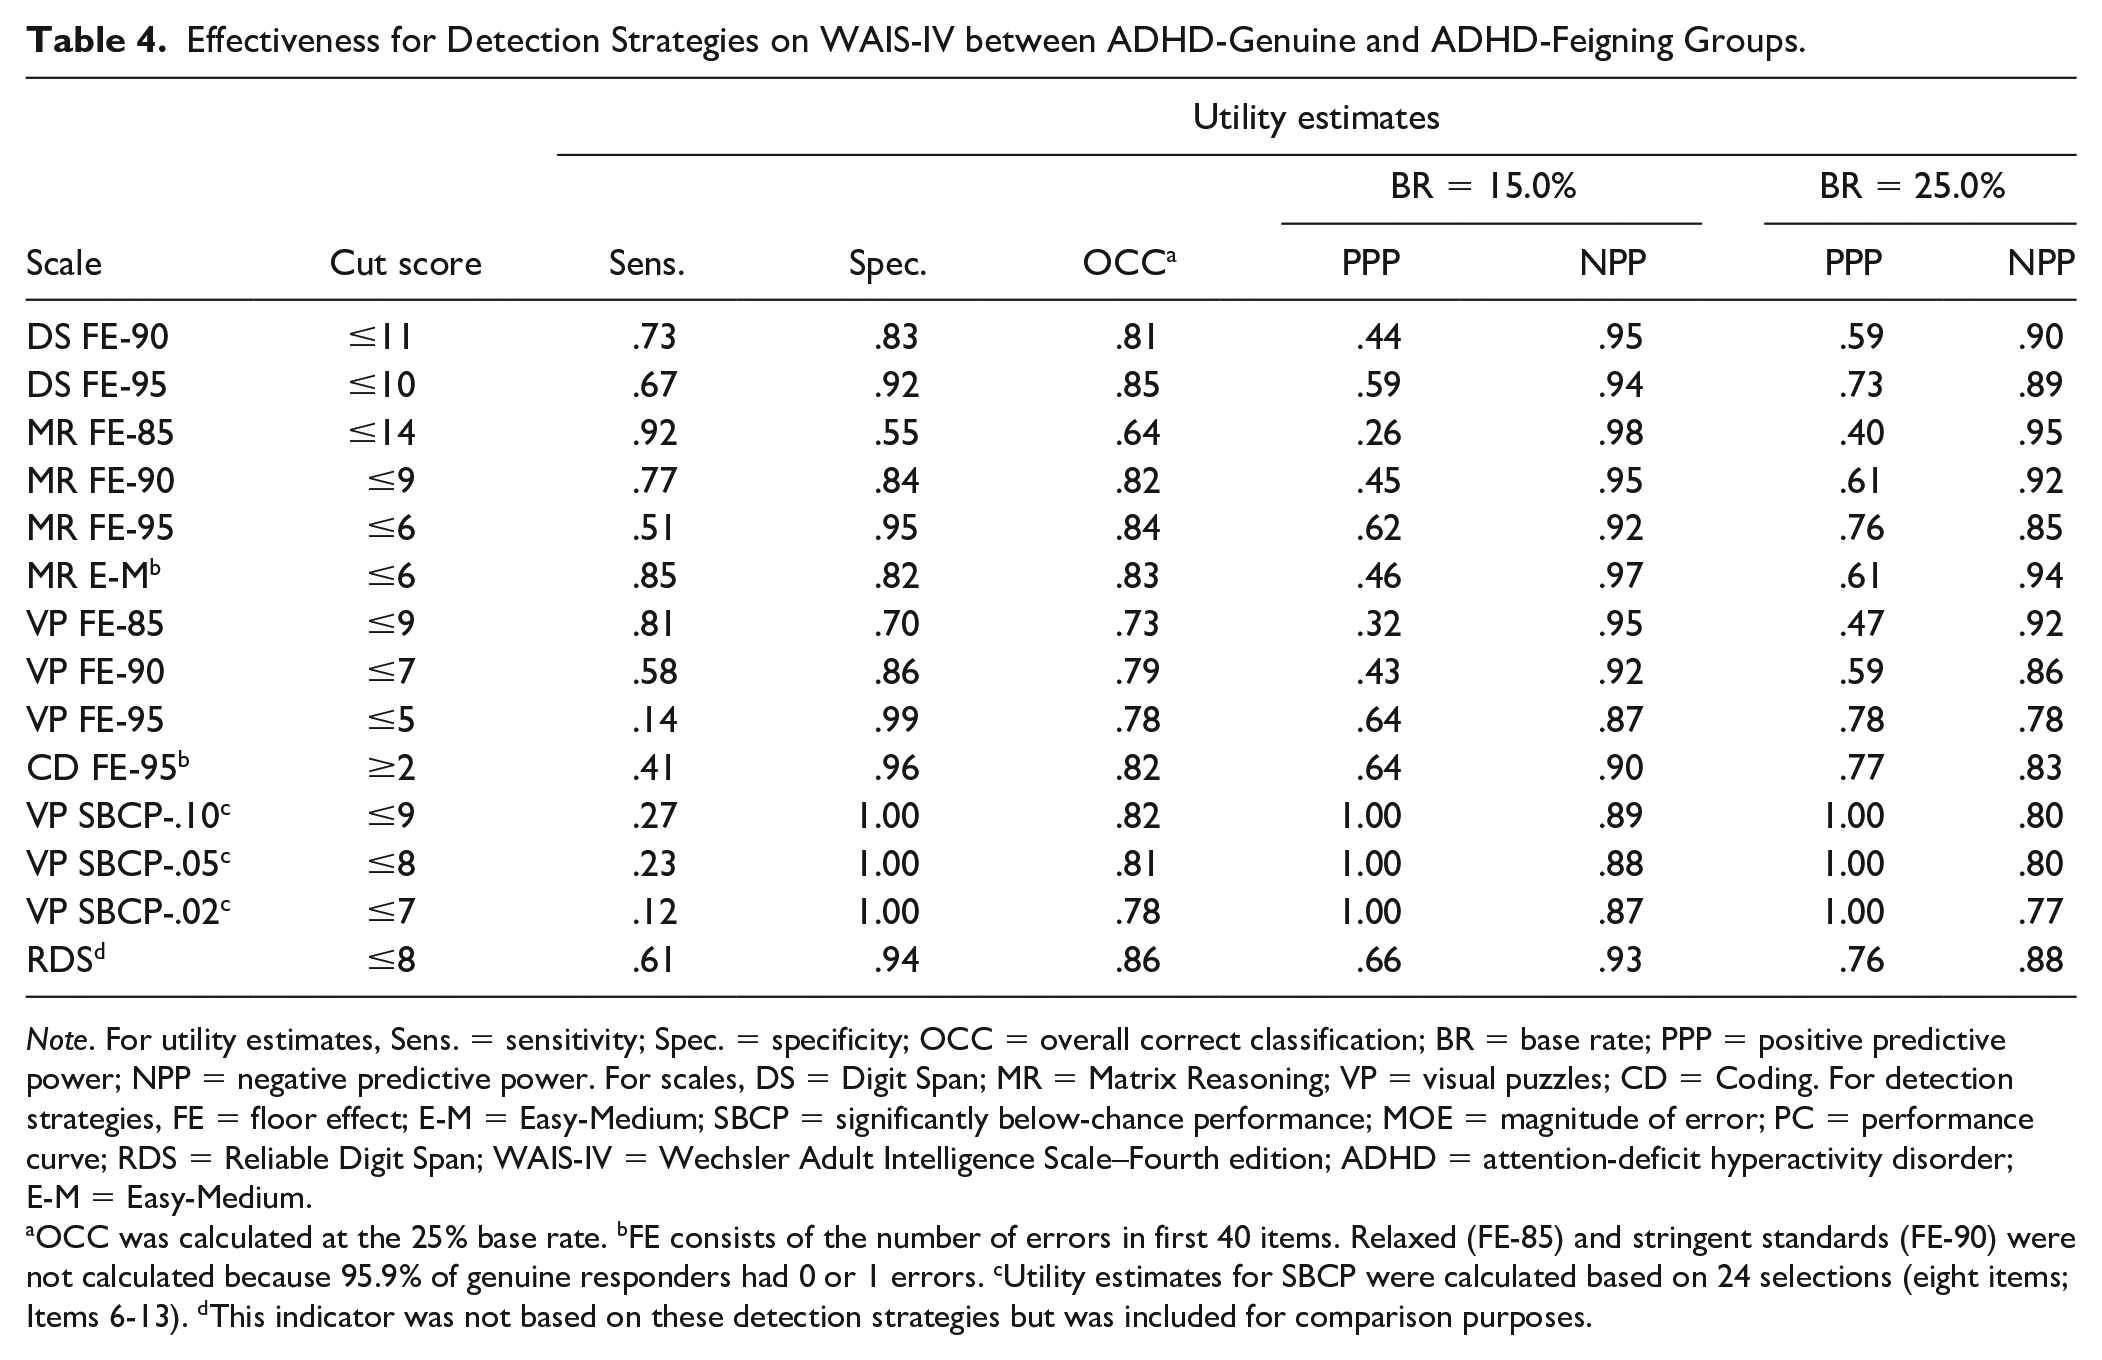
Note. For utility estimates, Sens. = sensitivity; Spec. = specificity; OCC = overall correct classification; BR = base rate; PPP = positive predictive power; NPP = negative predictive power. For scales, DS = Digit Span; MR = Matrix Reasoning; VP = visual puzzles; CD = Coding. For detection strategies, FE = floor effect; E-M = Easy-Medium; SBCP = significantly below-chance performance; MOE = magnitude of error; PC = performance curve; RDS = Reliable Digit Span; WAIS-IV = Wechsler Adult Intelligence Scale–Fourth edition; ADHD = attention-deficit hyperactivity disorder; E-M = Easy-Medium.
OCC was calculated at the 25% base rate. bFE consists of the number of errors in first 40 items. Relaxed (FE-85) and stringent standards (FE-90) were not calculated because 95.9% of genuine responders had 0 or 1 errors. cUtility estimates for SBCP were calculated based on 24 selections (eight items; Items 6-13). dThis indicator was not based on these detection strategies but was included for comparison purposes.
Significantly Below-Chance Performance
For VP SBCP should not be used at both ends of the distribution: (a) very easy items (#1-#5) were answered correctly by both genuine (100%) and feigned (98.6%) ADHD groups, and (b) difficult items were impractical with feigners because of WAIS-IV discontinuation rules. Therefore, SBCP was focused on eight, easy-to-medium items (#6-#13) consisting of 24 selections. Even with this focus, the ADHD feigning group had marked variability with an SD of 6.08 and a range of 0 to 24. Nonetheless, VP SBCP produced a very large effect size (see Table 3). Consistent with the SBCP strategy, perfect specificity was achieved for all three cut scores (see Table 4).
Magnitude of Error
The MR MoE was generally unsuccessful because most incorrect responses were infrequent. Even when restricted to MR MoE ≤ .05, only a modest effect size (d = 0.58; see Table 3) was observed. In light of this effect size, it is understandable that the OCCs also remained modest.
Performance Curve
The PC strategy for MR was not adequately tested in the current study, particularly because medium level items could not be effectively established, based on the genuine ADHD group. In addition, the difficult category (21% to 40%) did not have sufficient representation with only four items. On an exploratory basis, an Easy-Medium (E-M; >50% <90%) group was created. However, it did not perform like the PC detection strategy because genuine ADHD participants continued to perform at a high level of accuracy (i.e., 97.1% easy and 79.3% for E-M; see Table 3). As demonstrated by Figure 1, the feigned ADHD group failed many more E-M items than their genuine counterparts.

Differences in Errors on Matrix Reasoning Items between Genuine and Feigned ADHD Groups.
Nonstrategy Approaches
Poorer than expected performances were investigated for the RDS and CD. Given its frequent use in clinical practice, it is reassuring that the RDS produced a large effect size (d = 1.31) with very good specificities (.88 to .93; see Table 4). In addition, poor performance on the CD yielded similar results to the RDS regarding both its effect size (d = 1.59) and overall classification rate.
Correlations Among WAIS-IV Feigning Indicators
For the feigned ADHD group, improbable failure rates were captured by FE and SBCP strategies, which evidenced mostly moderate correlations across WAIS-IV subtests (see Table 5). The only exception was CD FE-95. On CD, feigners must actively commit an error rather than simply selecting the wrong response. The genuine ADHD group in measuring their actual abilities produced more variable results. Interestingly, the RDS was generally uncorrelated with other feigning indicators for both feigned (M r = .16) and genuine (M r = −.07) ADHD. 3
Intercorrelations of Feigning Indicators for ADHD-Feigning Group (above the Diagonal) and ADHD-Genuine Group (below the Diagonal).
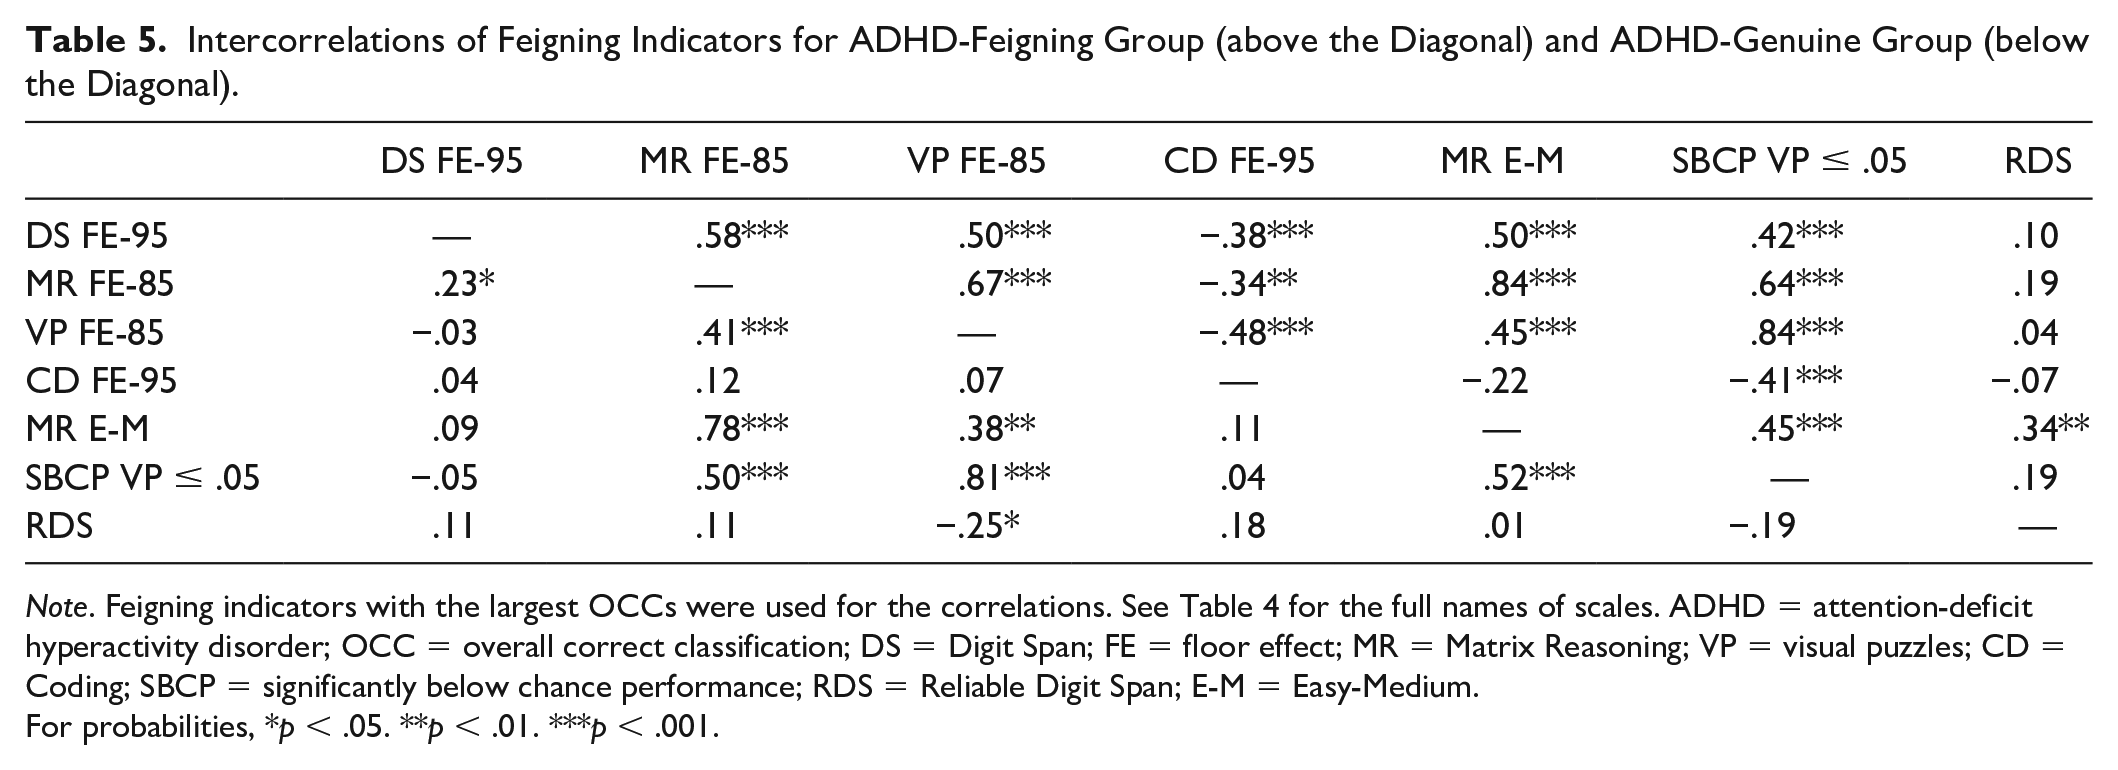
Note. Feigning indicators with the largest OCCs were used for the correlations. See Table 4 for the full names of scales. ADHD = attention-deficit hyperactivity disorder; OCC = overall correct classification; DS = Digit Span; FE = floor effect; MR = Matrix Reasoning; VP = visual puzzles; CD = Coding; SBCP = significantly below chance performance; RDS = Reliable Digit Span; E-M = Easy-Medium.
For probabilities, *p < .05. **p < .01. ***p < .001.
Supplementary Analysis on the Effects of ADHD Problems on Feigners’ Performance
For the post hoc analysis, two different approaches were considered. A comparison on the CAARS-S:S between Little ADHD and Moderate-High ADHD groups was initially contemplated. Due to the low level of reported ADHD problems, the median-split approach was adopted. With a median of 47 and an standard error of measurement (SEM) of 4.32, measurement error was addressed by removing close to 1 SEM (4) each from above and below the median. This resulted in 16 participants in the lower median subgroup (LMS) and 26 participants in the higher median subgroup (HMS). The two groups differed substantially on the ADHD Index: LMS (M = 37.69, SD = 2.18) and HMS (M = 60.19, SD = 5.46; F = 239.52, p < .001) producing an extremely large effect size (d = 5.32).
Slight and mostly nonsignificant trends were observed (see Table 6) with HMS showing poorer performances than LMS. Only CD FE produced a modest effect (d = 0.56), constrained by the marked variability in HMS (SD = 4.30). Although these groups are small, the initial data are promising because the presence of some ADHD characteristics did not have any major effect on the WAIS-IV feigning indicators. In summary, HMS and LMS tended to produce similar results.
Differences on WAIS-IV Feigning Indicators for the ADHD-Feigning Group between LMS (<42) and HMS (>51).
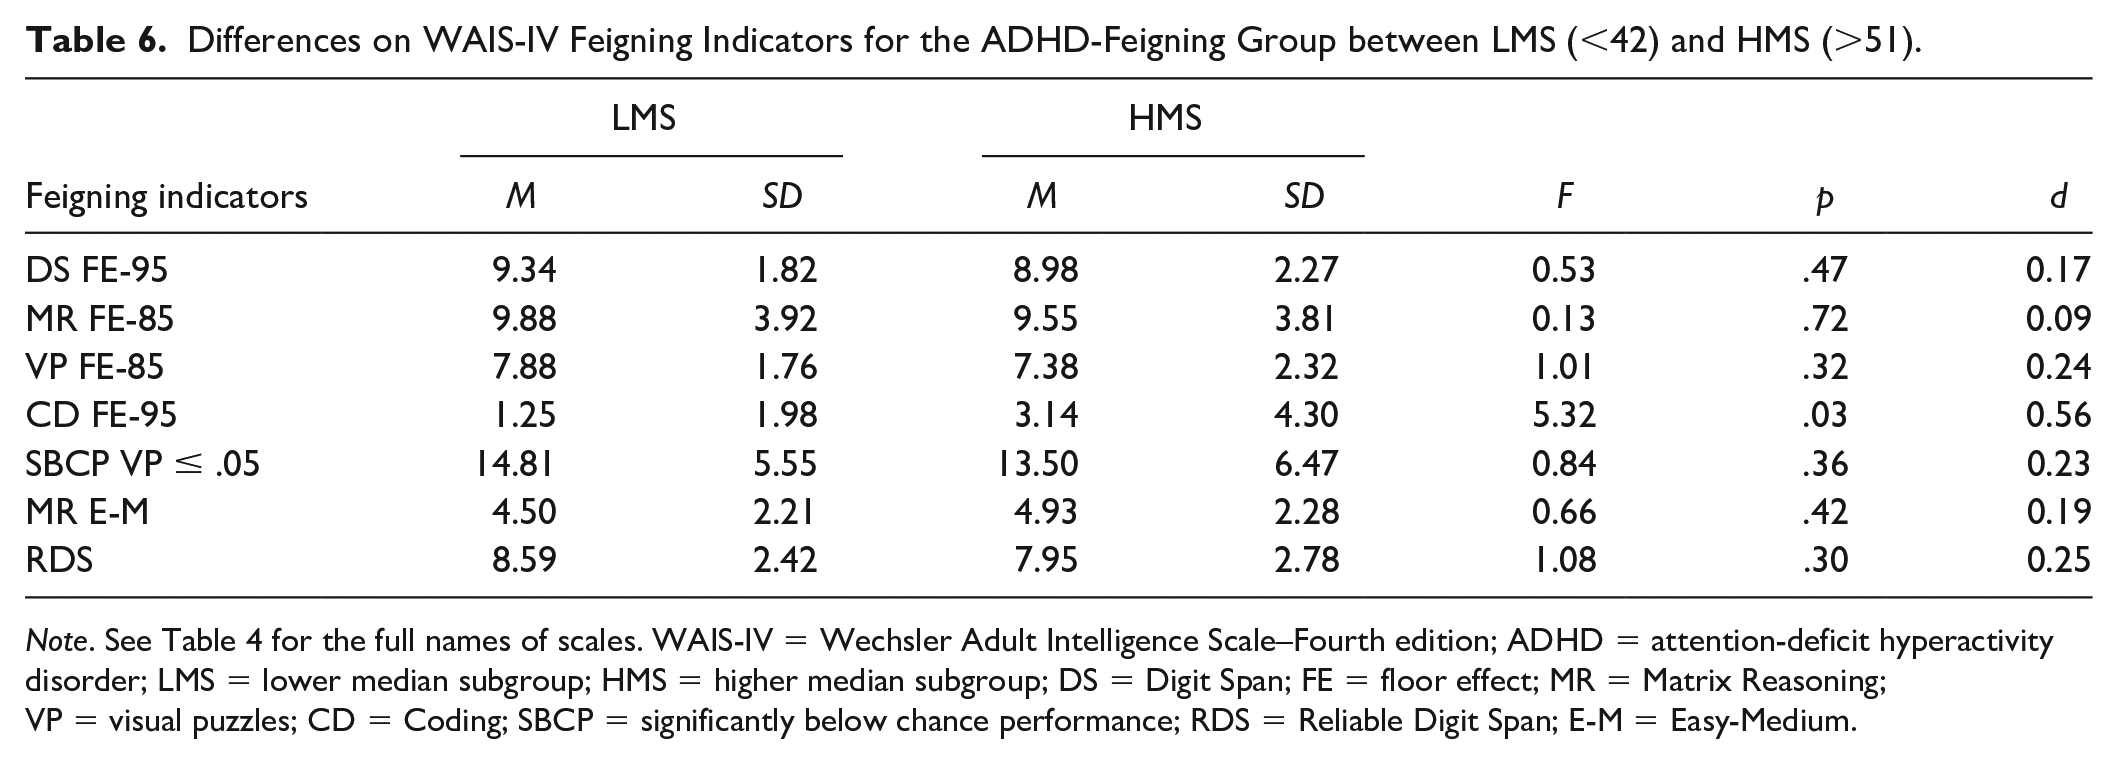
Note. See Table 4 for the full names of scales. WAIS-IV = Wechsler Adult Intelligence Scale–Fourth edition; ADHD = attention-deficit hyperactivity disorder; LMS = lower median subgroup; HMS = higher median subgroup; DS = Digit Span; FE = floor effect; MR = Matrix Reasoning; VP = visual puzzles; CD = Coding; SBCP = significantly below chance performance; RDS = Reliable Digit Span; E-M = Easy-Medium.
Discussion
Embedded feigning indicators have several important advantages over specialized scales including their comparatively low face validity and twin objectives of measuring both true abilities and feigning efforts (Garcia-Willingham et al., 2018). When retrofitting measures, however, items that were designed to measure true abilities may have limited value in differentiating between genuine and feigned effort. This discussion begins by examining the limits of establishing detection strategies on selected WAIS-IV subscales for feigned ADHD.
Challenges in Retrofitting WAIS-IV Subscales
For this study, an overriding goal was to establish aprioristic operationalization of detection strategies to avoid overfitting the data and capitalizing on chance findings. As an initial investigation, though, we had little guidance on several feigning indicators. Moreover, the comparatively small number of WAIS-IV items on several subscales also constrained the selection of items for feigning indicators. In our estimation, two detection strategies failed to be operationalized, whereas the remaining detection strategies were successful.
Failed Operationalizations
MR MoE appeared the simplest to explain. With four possible wrong responses in the MR format, most errors were comparatively infrequent. Using the very stringent (≤.05) standard, the 18 relevant items still had 31 rare errors. Moreover, the overall range was very limited from 1% to 4% with an average of 2.6%. Thus, efforts to retrofit the MoE were unsuccessful, and any future efforts are also likely to fail.
Distribution of scores for the MR PC did not conform to the aprioristic expectations for easy, medium, and difficult items. The goal of excluding easy items (i.e., >80%) that overlap with FE items could not be achieved. However, on further testing, the PC clearly appears to have merit. As shown in Figure 1, the slope for the feigned ADHD group is much steeper and covers nearly the full range (i.e., 0% to 90.5%), which is very different from the genuine ADHD group (i.e., 0% to 42.5%).
Successful Operationalizations
FE was easily established for WAIS-IV subtests, although sometimes only two of the three standards (relaxed, stringent, and very stringent) were able to be implemented. In addition, VP SBCP was completely successful with small variations in the standards: relaxed (.0779), stringent (.0439), and very stringent (.0206).
Clinical Applications
The study represents the first systematic investigation of empirically based detection strategies for selected WAIS-IV subtests. As such, it would be tempting to draw firm clinical conclusions despite the obvious lack of replication research. As a critically important caveat, the design—even with successful replication—precludes any conclusions about feigned ADHD per se. Without other simulation conditions (e.g., feigned learning disorders) and a general clinical sample, research can only determine general feigning (see Merten & Rogers, 2017). To address this issue, Robinson and Rogers (2018) developed and validated a specific ADHD feigning scale for the Minnesota Multiphasic Personality Inventory–2 Restructured Form, specifically the ADHD Dissimulation (ADHD-Ds) scale.
Used solely as initial screens, two scales have strong sensitivities for highly educated persons: MR FE-85 (.92) and VP FE-85 (.81). However, this study alone has unknown generalizability to other samples and simulation conditions. Moreover, it would be completely inappropriate to draw any—even tentative—conclusions about feigning; their PPPs remain consistently below .50 meaning that misclassifications clearly overshadow accurate classifications. If used clinically as screens, it is our strong recommendation that they are used as an informal check with no mention occurring in written or oral professional communications. Unfortunately, practicing psychologists and researchers sometime confuse feigning screens with comprehensive measures (see Rogers et al., in press). Therefore, it would be fully understandable that other professionals may fail to make this crucial distinction.
Mental health professionals are likely to differ in their views on the clinical applicability of the RDS. In the current well-educated sample, the specificity was excellent but clearly achieved at the expense of sensitivity. Some practitioners may view the RDS favorably, given its popularity and ease of use. Others may be alarmed at its failure for those with limited intelligence and apparent ethnic biases (Schroeder et al., 2012). The absence of a conceptual rationale is also concerning. More to this point, the current data found virtually no expected relationships between the RDS and either FE or SBCP, two well-established detection strategies.
The SBCP was utilized by the MND model (Slick et al., 1999) as the only required criterion for definite FCI. In the current investigation, SBCP was applied for the first time to the WAIS-IV VP; consistent with its strategy, it produced very high levels (1.00) of specificity. This detection strategy is not content-specific but based simply on probability. Therefore, practitioners may wish to implement this detection-based strategy for ADHD and similar referral issues. In keeping with the MND model, VP SBCP-.05 cut score of ≤8 is recommended to minimize false-positives. For about 20% of ADHD feigners, the VP SBCP provides definite evidence of FCI with less than a minute of scoring. However, it must be supplemented by other measures of cognitive feigning to substantially improve the overall sensitivity.
Methodological Considerations
A recent meta-analysis for feigned ADHD (Wallace et al., 2019) underscored the challenges of using embedded feigning indicators with an average effect size (Hedges’ g = 0.66) that falls below the current standard for even a moderate effect size (≥0.75). For the two detection strategies that were successfully operationalized, FE feigning indicators varied from moderate to very large, whereas SBCP was very large. Regarding the former, we would be very interested in whether an aggregate of FE indicators might be more effective than using individual FE scales. However, this analysis was not a part of the aprioristic operationalization, and thus, was not performed.
As a common theme, extremely simple items should likely be avoided—irrespective of the detection strategy—because of their (a) purportedly excessive impairment and (b) high face validity. Regarding the former, college simulators desiring ADHD medication were likely aware that faking basic intellectual disabilities is grossly excessive. Regarding the latter, some simulators may also recognize that extremely impaired performances might be used to detect their feigning. As an instructive example, consider MR-Easy and MR E-M in Table 3. For the Easy items, the ADHD feigning group performed fairly well with 76.5% correct. When focusing on the E-M items, their performance plummeted to 29.1%, producing the largest effect size (d = 1.83) between genuine and feigned ADHD groups, which far exceeds MR-Easy (d = 1.19). This finding suggests an important line of FE research, which excludes the simplest items. Similarly, very simple items on VP SBCP were correctly answered by both groups.
The current investigation was limited to four WAIS-IV subtests, which have a specified array of incorrect responses. As a result, the active production of incorrect responses could not be systematically investigated. As the first of two observations, CD FE-95 was the only subtest for which the wrong response was independently generated by ADHD groups. It almost never occurred, even for feigned ADHD group (i.e., 2.32 errors / 40 items = 5.8%). Second, the scoring of open-ended items would constitute a monumental challenge (e.g., MoE for Vocabulary) that would unlikely produce—because of its incredible complexity—any effective feigning indicators.
Future research may wish to investigate violations of a learning principle (Rogers, 2008; Rogers & Granacher, 2011). Serial-position effects represent a well-established learning principle with better recall on first (primacy effect) and last (recency effect) items. As background, an almost universal finding is described as a U-shaped serial position with primary and recency effects (Neath & Brown, 2006). As a supplementary analysis, first and last digit errors were explored with some initial evidence concerning primacy effects (see Table S2, available online). Future research may explore U-shaped serial position.
The VP SBCP should be broadly applicable because it relies on binomial probabilities rather than actual abilities. In contrast, FE and E-M indicators may have restricted applicability to clinical populations with limited cognitive abilities. To address specificities for genuine responders, archival WAIS-IV data may be easily rescored to test their applicability with diverse clinical populations. Additionally, simulation studies may address a range of realistic scenarios across diverse clinical populations. Finally, FE and E-M effectiveness might be tested separately in clinical and forensic settings (see, e.g., Rogers, Sewell et al., 1998).
Concluding Thoughts
The current investigation focused on the retrofitting of FCI detection strategies for the assessment of feigned ADHD with two successes (FE and SBCP) and two failures (PC and MoE). In clinical practice, effective screens for possible feigning (e.g., MR FE-85 ≤ 14) must be clearly differentiated from feigning determinations (e.g., VP SBCP-.05 < 8). Finally, in looking forward, a more balanced analysis is certainly needed that addresses more equally the likelihood of genuine responding as well as feigning (Merten & Rogers, 2017).
Supplemental Material
Supplement_material – Supplemental material for Embedded WAIS-IV Detection Strategies and Feigned Cognitive Impairment: An Investigation of Malingered ADHD
Supplemental material, Supplement_material for Embedded WAIS-IV Detection Strategies and Feigned Cognitive Impairment: An Investigation of Malingered ADHD by Richard Rogers, Sarah F. Velsor, John W. Donnelly and Brittney Dean in Assessment
Footnotes
Declaration of Conflicting Interests
The author(s) declared no potential conflicts of interest with respect to the research, authorship, and/or publication of this article.
Funding
The author(s) received no financial support for the research, authorship, and/or publication of this article.
Supplemental Material
Supplemental material for this article is available online.
Notes
References
Supplementary Material
Please find the following supplemental material available below.
For Open Access articles published under a Creative Commons License, all supplemental material carries the same license as the article it is associated with.
For non-Open Access articles published, all supplemental material carries a non-exclusive license, and permission requests for re-use of supplemental material or any part of supplemental material shall be sent directly to the copyright owner as specified in the copyright notice associated with the article.