
Abstract
Children differ in their sensitivity to positive and negative environmental influences, which can be measured with the Highly Sensitive Child (HSC) scale. The present study introduces the HSC-21, an adaptation of the original 12 item scale with new items and factor structure that are meant to be more informative than the original ones. The psychometric properties of the HSC-21 were investigated in 1,088 children across Belgium and the Netherlands, including child and mother reports. Results showed evidence for (a) bifactor model with a general sensitivity factor and two specific factors (i.e., Ease of Excitation–Low Sensory Threshold and Aesthetic Sensitivity); (b) (partial) measurement invariance across gender, developmental stage, country, and informants; (c) moderate child–mother agreement; (d) good reliability; (e) normally distributed item scores; and (f) meaningful associations with personality and temperament across both samples. No evidence was found for HSC-21 as a moderator in the relationship between parenting and problem behaviors.
Keywords
Children and adolescents differ in their environmental sensitivity (Greven et al., 2019; Pluess, 2015), which is the ability to perceive and process environmental stimuli more deeply and broadly. Highly sensitive children and adolescents seem to be more affected by negative environments such as negative controlling parenting (Slagt et al., 2018), but can also benefit more from positive environments such as supportive parenting (Pluess, 2015; Slagt et al., 2018). These findings are in line with the differential susceptibility framework (Belsky & Pluess, 2009) that states that more sensitive individuals are more sensitive to both negative and positive environments, in comparison with less sensitive individuals who are less affected by environmental stimuli.
Several studies that investigated individual differences in sensitivity to environmental influences focused on genetic polymorphisms (Caspi et al., 2003), stress reactivity (El-Sheikh et al., 2007), or infant temperament (Slagt et al., 2018). However, a more proximate marker of environmental sensitivity seems to be sensory processing sensitivity (SPS; Aron & Aron, 1997; Slagt et al., 2018). Individuals high in SPS would be more (a) emotionally reactive and empathic, (b) easily overstimulated, (c) behaviorally inhibited in new situations, and (d) aware of subtleties in their environment. Moreover, they would process environmental information more deeply (Aron & Aron, 1997; Greven et al., 2019). In adults, SPS can be measured with the Highly Sensitive Person (HSP; Aron & Aron, 1997) scale. Scores on the HSP scale have been shown to be reliable and valid across different samples (e.g., Lionetti et al., 2018). Factor analysis showed evidence for a bifactor structure (Lionetti et al., 2018) with a general sensitivity dimension and three specific dimensions: Ease of Excitation (EOE; e.g., being easily overwhelmed in crowded situations or when having a lot to do in a small amount of time), Low Sensory Threshold (LST; e.g., the negative feeling caused by sensory stimuli such as loud noises, bright lights, or being touched), and Aesthetic Sensitivity (AES; e.g., being aware of subtleties in the environment, such as details, nice smells and flavors).
The Highly Sensitive Child Scale
Pluess et al. (2018) developed a variant of the HSP scale, which was referred to as the Highly Sensitive Child (HSC) scale, to measure environmental sensitivity in children from 8 years onward. This scale consists of 12 items (Online Supplementary Material 1; items in bold) that reflect the same three dimensions as the HSP scale, namely EOE (five items), LST (three items), and AES (four items; Pluess et al., 2018). The psychometric properties of the HSC scale were examined in different samples in the United Kingdom (Pluess et al., 2018) and Belgium (Weyn et al., 2019). Across these samples, evidence was found for a bifactor model (Figure 1) with a general sensitivity factor (HSC) and three specific factors (i.e., EOE, LST, and AES). Weyn et al. (2019) showed that the general and the specific factors explained an important amount of variance in the HSC scores, with most overlap in the variance explained by the general, LST, and EOE factors. They found good internal consistency values of the scores on the total scale and the EOE subscale, but weaker internal consistency values of the scores on the AES and LST subscales in multiple samples. Intercorrelations among the different subscales of environmental sensitivity showed high associations between the EOE and LST scale but lower associations with AES. The different specific dimensions seemed to be moderately associated with different domains of temperament and personality. EOE and LST were positively related to Neuroticism and Negative Affect and negatively with Extraversion, whereas AES was positively related to Openness and Extraversion. Based on these results, AES seems to capture another part of sensitivity (which may reflect a sensitivity to positive stimuli) than the LST and EOE subscales (which may reflect a sensitivity to negative stimuli; Pluess et al., 2018; Weyn et al., 2019).
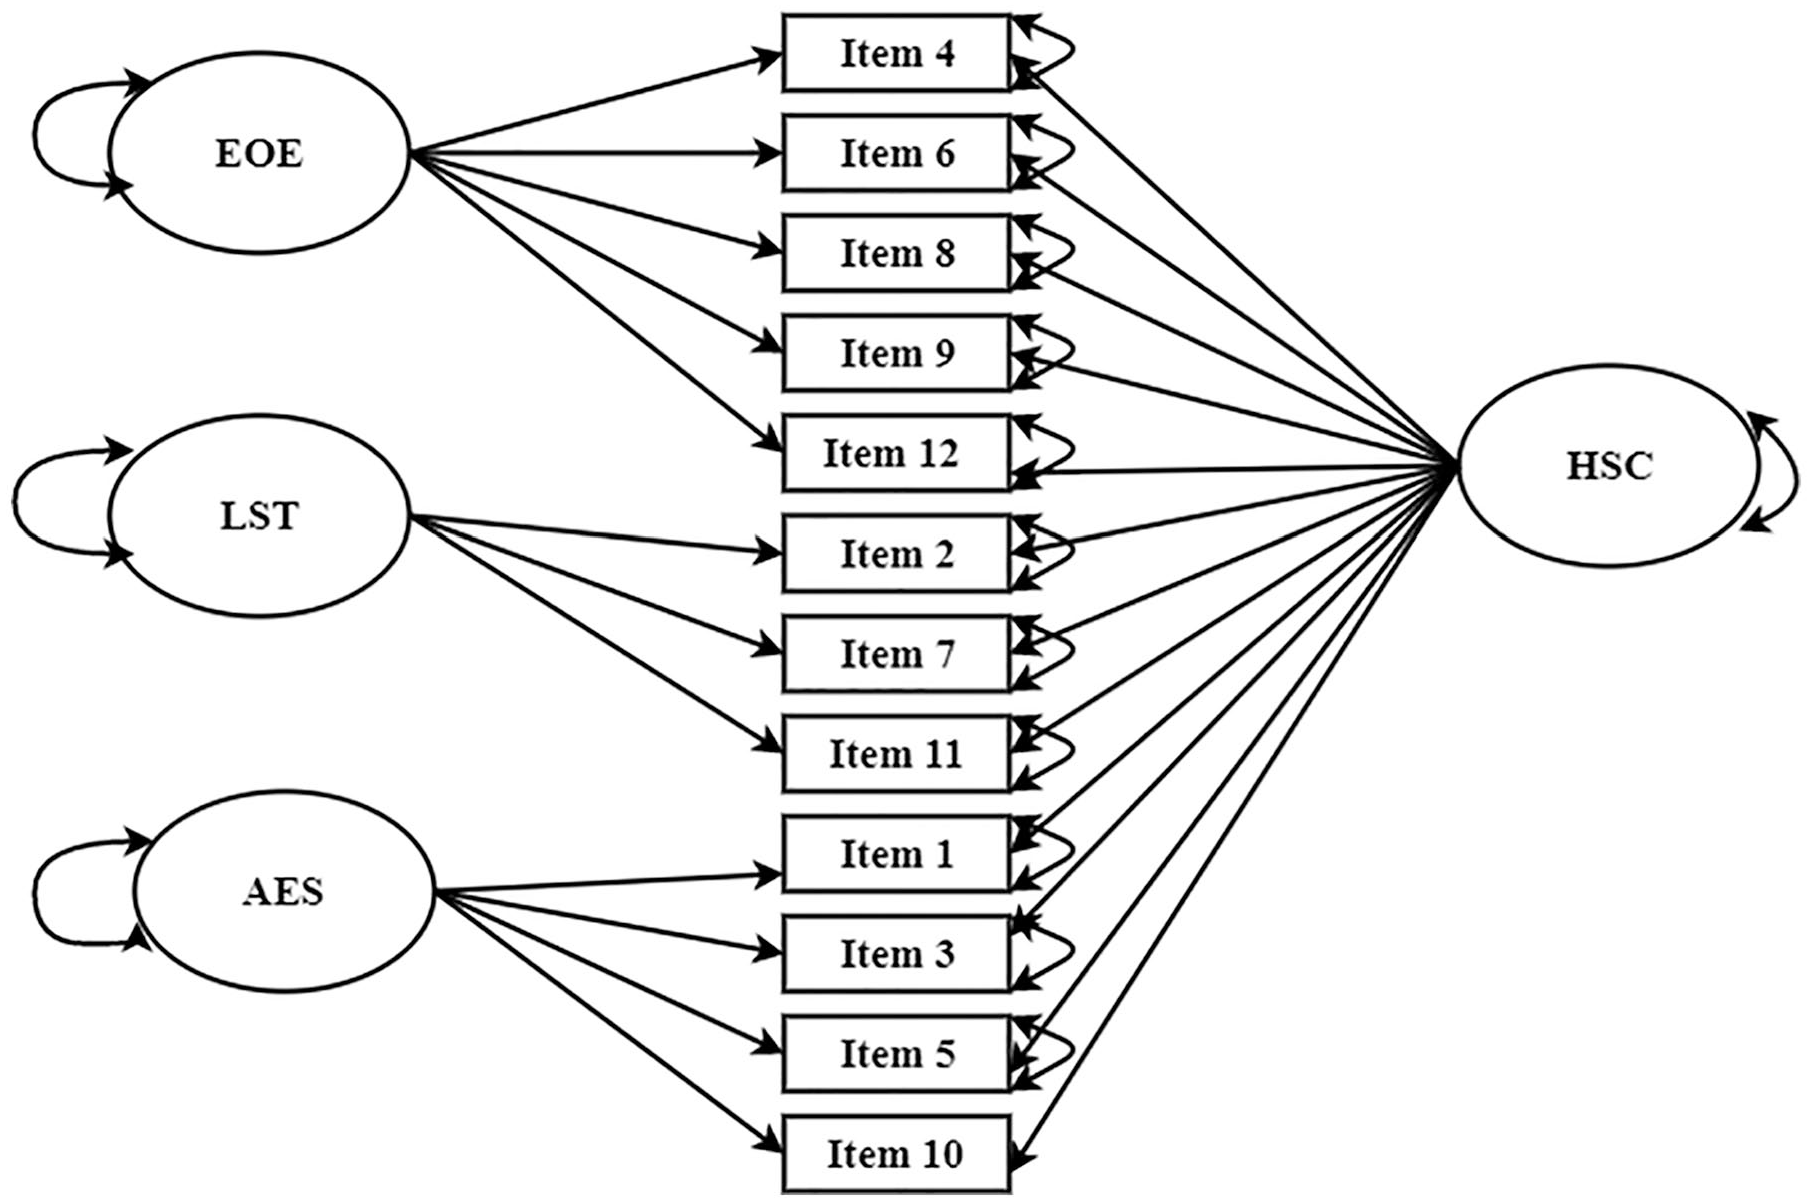
Bifactor model of the original HSC scale.
Evidence was found for partial metric and partial scalar measurement invariance across gender, developmental stage, and country. These results suggested that the groups do not attribute the same meaning to all the items (i.e., partial metric invariance) and do not always use the same reference point (i.e., partial scalar invariance; Weyn et al., 2019). Therefore, children who are similar in environmental sensitivity may score differently on the HSC scale (Schmitt et al., 2011).
Despite some limitations regarding reliability and measurement invariance, studies showed that the HSC scale does capture individual differences in environmental sensitivity. A longitudinal study found that environmental sensitivity interacted with changes in both negative and positive parenting in predicting externalizing problems (Slagt et al., 2018). Intervention studies found that children scoring high on the HSC scale benefitted more from an antibullying intervention (Nocentini et al., 2018) and from a school-based depression prevention program (Pluess & Boniwell, 2015), than children scoring lower on the HSC scale. These studies indicated that children scoring high on environmental sensitivity were more sensitive to parenting and intervention programs than children scoring low or average on environmental sensitivity, which might have important implications for further research and clinical interventions.
Toward an Improved Version of the HSC Scale
Because previous studies in samples with children and adolescents indicated that the internal consistency values of scores on the AES and LST subscales were weak in the examined samples (Pluess et al., 2018; Weyn et al., 2019) and that the HSC scale was only partially measurement invariant across gender, developmental stage, and country, Weyn et al. (2019) looked more in detail at the distribution of the scores and the content of the items. Results showed that the scores on the (a) EOE scale were approximately normally distributed, (b) those on the AES scale were negatively skewed (i.e., ceiling effects), and (c) those on the LST scale were more positively skewed. By examining the item content of the scales for which the scores were skewed, the authors found that the skewness was possibly due to the wordings of some items that did not show much variation in responses (e.g., “I love nice tastes” or “I love nice smells”). As a consequence, these items had overall high scores and did not differentiate well between low and high sensitive children. One item of LST (“I don’t like watching TV programs with a lot of violence in them”) showed a weak association with the LST total scale, probably because the negation it the wording of the item, which might be difficult for children to answer on a 7-point Likert-type scale. Moreover, two out of three items of the LST subscale refer to being sensitive to loud noises only, whereas based on literature (Aron & Aron, 1997; Greven et al., 2019), we would expect that children scoring high on environmental sensitivity would be more sensitive to a broader range of sensory stimuli (e.g., bright lights, being touched, strong smells, and itchy fabrics).
The Present Study
Based on these limitations (i.e., the lower internal consistency of the item scores on the HSC scale, the skewed distribution of the LST and AES subscale, the limited discriminative value of the AES subscale, the evidence for only partial metric and scalar invariance, and the limited scope of items of the LST subscale), we aimed to improve the HSC scale by developing new items that capture the construct more broadly and that allow more variation in responses, while starting from the existing structure (i.e., EOE, LST, and AES). In what follows, we describe how the new items were developed and which criteria were used to select the final set of items. Next, we examined the following psychometric properties of the adapted scale: (a) the factor structure; (b) measurement invariance across developmental stage, gender, country, and informants; (c) agreement between child and mother reports; (d) the internal consistency; and (e) the distribution of the item scores of the adapted HSC scale in two different samples (i.e., Belgian and Dutch sample) with different informants (i.e., child and mother reports). Finally, as a first validity check, we investigated (a) the associations between different dimensions of environmental sensitivity and well-studied domains of personality and temperament (i.e., convergent and discriminant validity) and (b) whether scores on the HSC scale are a moderator in the relationship between negative and positive environmental factors (i.e., negative and positive parenting) and outcomes (i.e., internalizing and externalizing problem behaviors; criterion validity). Based on the literature, we expect that (a) items capturing EOE and LST are positively associated with Neuroticism and Negative Affect and negatively with Extraversion; (b) items capturing AES are positively associated with Openness, Extraversion, and Orienting Sensitivity (e.g., Pluess et al., 2018; Weyn et al., 2019); and (c) children scoring high on environmental sensitivity are more sensitive to both negative and positive environments (e.g., Greven et al., 2019).
Method
Participants and Procedure
Data from two cross-sectional samples were used. Sample 1 includes Wave 1 data of the Methylation in Development (MIND) study, a longitudinal study in which children from Grade 5 across different participating schools (N = 96) of the Dutch speaking part of Belgium and their parents were invited to participate. In total, active consent for participation was received from 629 early adolescents from Grade 5 (Mage = 10.77, SDage = 0.48, boys = 45.1%, 91.1% Caucasian [0.5% African, 8.4% missing]) and their parents. Early adolescents completed the extended version of the HSC scale (38 items, see Supplementary Material 1, available online). In addition, mothers (n = 417; 99.1% biological mother [0.7% stepmother, 0.2% adoptive mother]; 10.4% single mother; 83.7% highly educated; 30.2% full-time employed, 62.8% part-time employed, 8.1% unemployed) reported on their parenting and on their child’s personality, temperament, internalizing, and externalizing problem behaviors. Sample 2 includes data of Wave 1 of the Sensitivtiy in Context (SiC) study, conducted in the Southern part of the Netherlands. In total, 16 schools agreed to participate in the study. From Grade 1 to 6 mothers were invited to report on their parenting and on their child’s sensitivity, personality, temperament, internalizing, and externalizing problem behaviors. From Grade 5, children were invited to report on their own sensitivity. This resulted in active consent for participation of 151 early adolescents from Grade 5 to 8 (Mage = 12.57, SDage = 1.37; boys = 41.2%; nationality was not reported by children) and 542 mothers of children from Grade 1 to 6 (characteristics child: Mage = 9.91, SDage = 2.12, boys = 52.7%, 97% Caucasian; characteristics family: 99.8% biological mother [0.2% foster mother], 10.4% single mother, 70.2% highly educated [missing: 8.2%], 22.7% full-time employed, 67.7% part-time employed, 9.6% unemployed [missing:2%]) participated. Because we only included self-reports from Grade 5 and because mothers could give active consent for the participation of their child without participating themselves, we only received both child and mother reports for 101 early adolescents (Mage = 12.02, SDage = 1.14; boys = 44.5%; 99% Caucasian; 100% biological mother; 10.9% single mother; 60.4% highly educated [14.9% missing]; 35.6% full-time employed, 58.4% part-time employed, 5.9% unemployed). Both early adolescents and their mothers completed the extended version of the HSC scale. In addition, mothers filled out questionnaires regarding parenting and their child’s internalizing and externalizing problem behaviors. All questionnaires were completed on a computer that gave an alert (with the exception of demographic questions) when not all items were completed. Therefore, there were no missing data in Sample 2. In both projects, there were no exclusion criteria for participation. Both projects were approved by the university’s ethics committee.
Instruments
Environmental Sensitivity
Environmental sensitivity was measured using an extended version of the HSC scale (38 items; see the online Supplementary Material 1), which was developed by adding 26 new items to the original HSC scale (Pluess et al., 2018). The new items were developed by (a) identifying important aspects (e.g., emotional reactivity, behavioral inhibition, depth of processing, and being aware of subtleties in the environment) and domains (i.e., EOE, LST, and AES) of environmental sensitivity that are based on literature (e.g., Aron & Aron, 1997; Greven et al., 2019; Pluess et al., 2018); (b) with the help of experts in the field; and (c) while taking into account the appropriateness and comprehensibility of the items for children from 8 year onward. The new items were meant to capture the subdomains of environmental sensitivity more broadly (e.g., not only sensitivity to loud noises but also sensitivity to other sensory stimuli such as lights, scents, and tactile stimulations) and to allow more variation in responses, while fitting the existing subdomains of environmental sensitivity (i.e., EOE, LST, and AES). The new items were developed in Dutch but were translated into English (for research purposes, see online Supplementary Material 1) by a native English speaker and back-translated by an independent person into Dutch in order to check whether the meaning of the items was preserved by translating them. The Dutch version can be obtained from the first author. The extended scale comprises items capturing the EOE scale (n = 6, with 1 extra, i.e., “In crowded places I quickly get overwhelmed”), the LST scale (n = 16, with 14 extra, e.g., “I find coarse or itchy fabrics unpleasant”), and the AES scale (n = 15, with 11 extra, e.g., “I am good at distinguishing different tastes”). For the EOE scale, only one extra item was developed because the original items captured the construct of EOE already well (i.e., “being easily overstimulated by external and internal incentives”; Greven et al., 2019) and differentiated well between individuals (i.e., no ceiling or floor effects). Early adolescents answered items on a 7-point Likert-type scale ranging from 1 (not at all true) to 7 (extremely true).
Personality
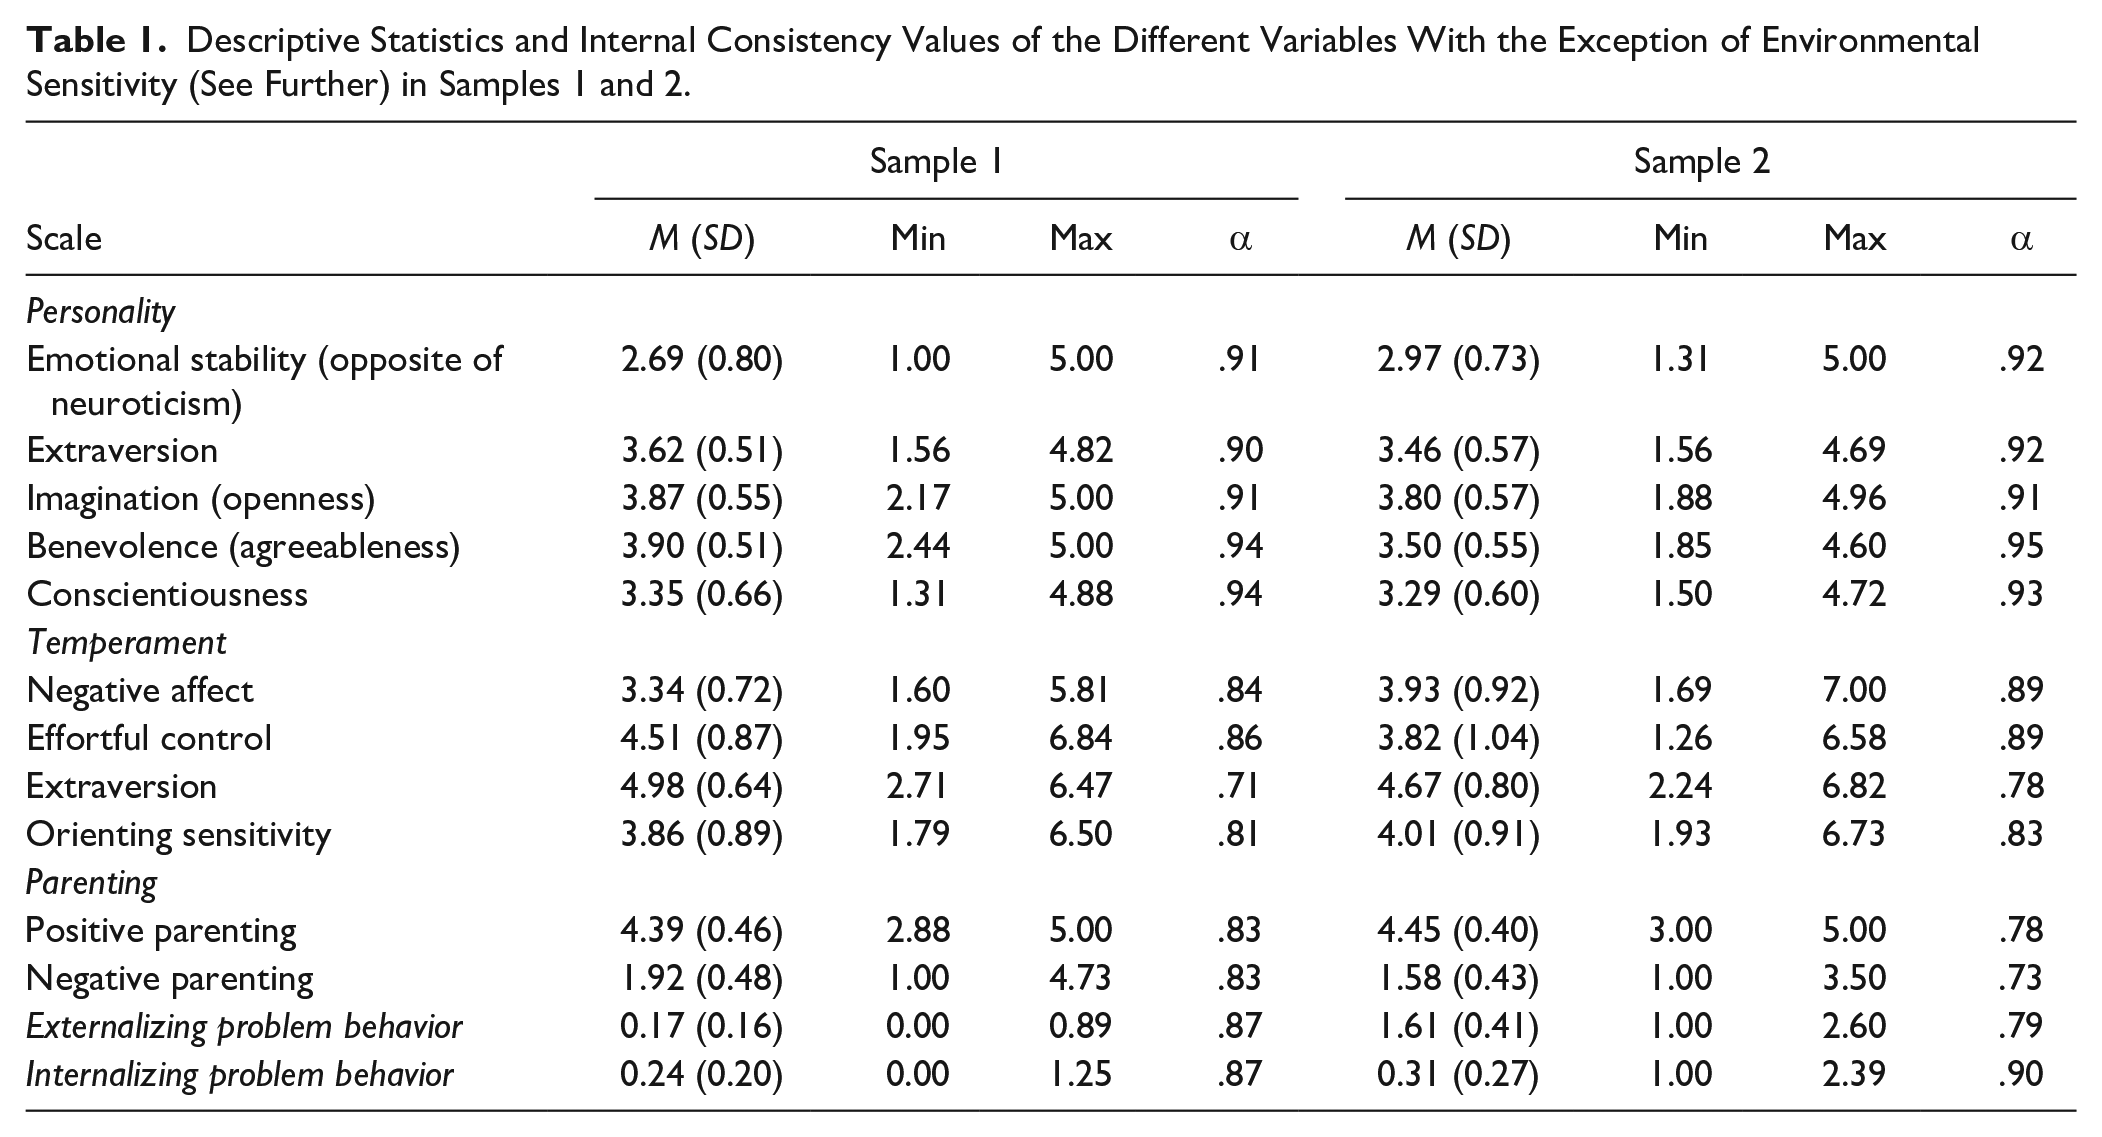
Personality was measured with the Hierarchical Personality Inventory for Children (HiPIC; Mervielde et al., 2009). The HiPIC is based on the five-factor model of personality (i.e., Neuroticism, Extraversion, Openness, Agreeableness, and Conscientiousness; McCrae & Costa, 1987) and consists of 144 items. The instrument has five subscales, that are, Emotional stability (or the opposite of Neuroticism; e.g., “My child worries quickly about things”), Extraversion (“ My child talks easily to people”), Imagination (a label for Openness; e.g., “My child has a rich imagination”), Benevolence (or Agreeableness; e.g., “My child grants also something to others”), and Conscientiousness (e.g., “My child finishes tasks to the very end”). All items were answered by mothers on a 5-point Likert-type scale ranging from 1 (very untypical) to 5 (very typical). The internal consistency values of the item scores on personality in both samples were good. The descriptive statistics and internal consistency values of the item scores on the personality subscales are reported in Table 1.
Descriptive Statistics and Internal Consistency Values of the Different Variables With the Exception of Environmental Sensitivity (See Further) in Samples 1 and 2.
Temperament
Temperament was measured with the short version of the Adult Temperament Questionnaire (ATQ) 1 , which is developed based on the temperament model of Rothbart (Evans & Rothbart, 2007) and consists of 77 items. The ATQ consists of four subscales measuring four domains of temperament: Negative affect (e.g., “My child becomes easily frightened”), Effortful control (e.g., “My child is often late for appointments”), Extraversion (e.g., “Sometimes minor events cause my child to feel intensely happy”), and Orienting sensitivity (e.g., reversed-coded item: “Barely noticeable visible details rarely catch my child’s attention”). All items were answered by mothers on a 5-point Likert-type scale ranging from 1 (not at all) to 7 (completely). The internal consistency values of the item scores on the temperament subscales in both samples were good. The descriptive statistics and internal consistency values of the item scores on the temperament subscales are reported in Table 1.
Parenting
Positive parenting was measured using the Parental Support subscale (e.g., “If my child wants to tell something, I make time to listen to him or her”) of the short version of the Parental Behavior Scale (PBS-S; Van Leeuwen et al., 2018). Negative parenting was measured using the Psychological Control scale (e.g., “I do not talk to my son/daughter when he/she has disappointed me, until he/she pleases me again”) of the Parental Regulation Scale (PRS-YSR; Soenens et al., 2006). All items were rated by mothers on a 5-point Likert-type scale ranging from 1 ([almost] never) to 5 ([almost] always). The internal consistency values of the item scores on the parenting subscales in both samples were good. The descriptive statistics and internal consistency values of the item scores on parenting are reported in Table 1.
Externalizing Problem Behavior
In Sample 1, externalizing problem behavior was measured by means of the raw scores on the broad-band Externalizing Problem scale (e.g., “My child breaks rules at home, school, or elsewhere”) of the Child Behavior Checklist (CBCL; Achenbach, 1991). Mothers reported on a 3-point Likert-type scale ranging from 0 (not at all) to 2 (obvious or often). In Sample 2, externalizing problem behavior was measured with the mean of the subscales Conduct Problems (e.g., “My child often has temper tantrums or a hot temper”) and Hyperactivity/Attentional problems (e.g., “My child is easily distracted, has troubles with concentrating”) of the Strengths and Difficulties Questionnaire (SDQ; Goodman, 1997), which were answered by mothers on a 3-point Likert-type scale ranging from 1 (not true) to 3 (definitely true). The internal consistency values of the item scores on externalizing problem behavior in both samples were good. The descriptive statistics and internal consistency values of the item scores on externalizing problem behavior are reported in Table 1.
Internalizing Problem Behavior
In both samples, internalizing problem behavior was measured using the raw scores on the broad-band Internalizing Problem scale of the CBCL (Achenbach, 1991), which was answered by mothers on a 3-point Likert-type scale ranging from 0 (not at all) to 2 (obvious or often). In both samples, the internal consistency values of the item scores on the Internalizing Problem Behavior scale were good. The descriptive statistics and internal consistency values of the item scores on internalizing problem behaviors are reported in Table 1.
Data Analyses
Factor Structure and Item Selection
Sample 1 was randomly split into a calibration (n = 315, 6.40% missing HSC data) and validation (n = 314, 4.94% missing HSC data) sample. In both samples, Little’s (1988) missing completely at random (MCAR) test was not significant: χ2(1439.59), degrees of freedom (df) = 1401, p = .23 (Sample 1) and χ2(1311.68), df = 1274, p = .23 (Sample 2). The number of factors and the best functioning items were selected based on theory and results from the Hull method (Lorenzo-Seva et al., 2011), exploratory structural equation modelling (ESEM; Asparouhov & Muthén, 2009; Marsh et al., 2014), and multidimensional item response theory (MIRT; Reckase, 2009) in the calibration sample. Before running these analyses, four original items were omitted. Three items (original Item 3: “I love nice smells,” Item 5: “Some music can make me really happy,” and Item 10: “I love nice tastes”) were omitted from the analyses because previous research showed that these items were negatively skewed and did not show much variation in responses across multiple samples (Weyn et al., 2019). Also original Item 7 (“I don’t like watching TV programs with a lot of violence in them”) was omitted because we noticed during data collection that a lot of children had difficulties to answer this item on a 7-point Likert-type scale, probably due to the negation in it. 2
The Hull method, which aims to find an optimal balance between the model fit and the amount of parameters, was used to determine the number of common factors (hullEFA package in R version 4.0.1, with maximum likelihood as extraction method and common part accounted for index). To control for missing data, the analyses were repeated on five multiple imputed data sets.
ESEM integrates the advantages of an exploratory factor analysis (e.g., all factors can freely load on all indicators) and a confirmatory factor analysis (CFA, which is part of SEM; e.g., model fit indices and a priori hypotheses on factor structure). ESEM allows to specify the expected factor structure (based on theoretical considerations; i.e., EOE, LST, and AES), while freely estimating all cross-loadings (i.e., non-zero loadings on other than a priori defined factors; Booth & Hughes, 2014; Gomes et al., 2017; Marsh et al., 2014). ESEM models were run using robust maximum likelihood and target rotation in Mplus (Version 8.2). Full information maximum likelihood (FIML; Arbuckle, 1996) was used to deal with missing data. The results from the ESEM and Hull approach results were used to determine the number of factors.
MIRT is a multidimensional extension of the unidimensional item response theory (IRT). IRT is a theoretical framework that states that an individual’s response to an item depends on specific item (i.e., item discrimination and item threshold) and person (i.e., a person’s ability or position on the latent trait, such as environmental sensitivity) characteristics. In graded response IRT models, which are used for polytomous items (e.g., Likert-type scale items), the item discrimination (called slope [a] in MIRT) indicates how well an item differentiates between individuals along a continuum of the underlying trait and is analogous to factor loadings in a classical test theory framework, such as ESEM. The higher the discrimination parameter, the more informative an item is, or the more an item differentiates among people at different degrees of the underlying trait. The item threshold parameters, or category boundary intercept parameter in MIRT (d) refer to the latent trait value(s) for which there is a 50% probability of responding higher than the category corresponding with the threshold. The latent traits are assumed to follow a multivariate standard normal distribution, for reasons of model identification. One advantage of IRT is that the item parameters are independent of the sample (e.g., Immekus et al., 2019; Osteen, 2010; Sharkness & DeAngelo, 2011). A MIRT graded response model with two dimensions was fitted (in MIRT package in R Version 4.1) parallel to ESEM to examine how well the HSC items (n = 34) differentiate among individuals and at which positions on the trait continuum (i.e., the examined dimensions of environmental sensitivity) the items are most informative. FIML was used to deal with missing data.
The information from previous analyses and theory were combined to select a final pool of items. Items were omitted when ESEM factor loadings were <.40 (e.g., Boateng et al., 2018) and when the MIRT slope parameters were <.65. MIRT discrimination parameters between 1.35 and 1.70 were considered as high, above 1.70 was considered as very high (Baker, 2001; Sharkness & DeAngelo, 2011). The final factor structure with the retained items was again tested in ESEM to evaluate the model fit. Based on the modification indices, correlated errors between highly correlated items, which could be theoretically justified (e.g., tapping into similar content such as the same sensory modality), were added to the model (Brown, 2015).
Validation of the Factor Structure of the Adapted HSC Scale
After the number of factors and well-functioning items were selected in the calibration sample, the factor structure with the final item pool was evaluated in Sample 1 (validation part, n = 314) and Sample 2 (child and mother reports) using CFA, in which the cross-loadings of items are constrained to be zero (Boateng et al., 2018). Because previous studies using the original HSC items found evidence for a bifactor model (Pluess et al., 2018; Weyn et al., 2019), the fit of a correlated-trait model (first-order factor structure) was compared with the fit of a bifactor model (second-order factor structure) with the same first-order factors as the correlated trait model. Bifactor models allow to investigate whether potential overlap in factors is due to a general factor. CFAs were conducted in R (Version 4.0.1, lavaan package), using maximum likelihood robust to address nonnormality (Satorra & Bentler, 1994) and FIML to deal with missing data. Model fit was considered acceptable when (a) the comparative fit index (CFI) was at least .90, (b) the root mean square error of approximation (RMSEA) was not larger than .06, and (c) the standardized root mean squared residual (SRMR) was maximally .08 (Kline, 2005). A model was considered to fit the data as substantially different from the other model when ΔCFI was .010 or more, ΔRMSEA was at least .015, and ΔSRMR was .010 or more (Chen, 2007). The sample-size-adjusted Akaike information criterion (AICc) and Bayesian information criterion (aBIC) were used as comparative fit indices; a smaller AICc and aBIC value indicating a better fit. Burnham and Anderson (2004) specified some rules of thumb when comparing the AICc values of two models. When ΔAICc is not larger than 2, there is still substantial support for the model having a higher AICc value, when ΔAICc is between 4 and 7 there is considerably less support for the model having a higher AICc value, and when ΔAICc is larger than 10, there is no support for the model having a higher AICc value. For ΔaBIC, we applied the same rules of thumb as for ΔAICc (Raftery, 1995).
Measurement Invariance of the Adapted HSC Scale
From these analyses onward, the calibration and validation subsample of Sample 1 were merged again (n = 639). Next, measurement invariance of the HSC scale was evaluated. Because previous research (Weyn et al., 2019) indicated that the HSC scale was only partially measurement invariant across gender and developmental stage, the measurement invariance of the adapted HSC scale was first evaluated across gender (in Samples 1 and 2, separately) and developmental stage (in Sample 2 across participants in primary and secondary school). 3 Next, we tested whether the adapted HSC scale was measurement invariant across Belgium and the Netherlands and across child and mother reports. Measurement invariance was tested at three levels. First, we checked whether the factor structure of the adapted HSC scale was invariant across groups (i.e., gender, developmental stage, country, and informant; i.e., configural measurement invariance) by running a multigroup CFA in R (Version 4.0.1, package lavaan). Next, we checked whether the factor loadings were similar across these groups (i.e., metric measurement invariance). Finally, we tested whether intercepts were invariant across these groups (i.e., scalar measurement invariance). Configural invariance was established when (a) CFI was at least .90, (b) RMSEA was not higher than .06, and (c) SRMR was not higher than .08. Metric and scalar invariance were established when ΔCFI between the nonconstrained and constrained model was smaller than .010, ΔRMSEA between the nonconstrained and constrained model was smaller than .015, and ΔSRMR between both models was smaller than .030 (metric invariance) or .010 (scalar invariance; Chen, 2007). Based on simulation studies, when comparing nested models one should first rely on ΔCFI; ΔRMSEA and ΔSRMR could be considered as well, but they should be given less weight (Sellbom & Tellegen, 2019). Partial metric and/or scalar measurement invariance was established when at least two factor loadings and/or intercepts per latent factor were invariant (Byrne et al., 1989).
Internal Consistency and Dimensionality of the Adapted HSC Scale
The internal consistency of the item scores on the extended version were examined by calculating Cronbach’s alpha, McDonald’s (1999) omega, and McDonald’s hierarchical omega (ωH/S) in R (packages BifactorIndicesCalculator and MBESS). McDonald’s ω is a factor model-based coefficient of internal consistency that does not rely on tau-equivalence assumptions as Cronbach’s α does (e.g., Revelle & Zinbarg, 2008; Zinbarg et al., 2005). Therefore, McDonald’s ω is more realistic and less sensitive to overestimations and underestimations of internal consistency than Cronbach’s α (Dunn et al., 2014). Cronbach’s α of .60 or lower were considered as low, between .60 and .70 as acceptable, and .70 or higher as a good (Leary, 2008). For McDonald’s ω, we applied the same rules. For bifactor models, McDonald’s omega hierarchical of the general factor (ωH) and specific factors (ωS) are important model-based reliability indices because they separate the proportion of variance in the item scores that is attributed to the general and each specific factor while controlling for each other (i.e., the variance in item scores explained by the general factor while controlling for proportion of variance explained by the specific factors, and vice versa; e.g., Rodriguez et al., 2015). Finally, the explained common variance (Sijtsma, 2008), which reflects the strength of the general factor, was computed. Higher values (e.g., >.80) indicate a strong general factor and supports the use of a unidimensional model, even to multidimensional data (Rodriguez et al., 2015).
Descriptive Statistics and Agreement Between Child and Mother Reports of the Adapted HSC Scale
In Samples 1 and 2, the means, medians, standard deviations, skewness, and intercorrelations among the subscales of the adapted HSC scale were examined and compared with the descriptives when using only the 12 original items. When at least partial measurement invariance is established, we will compare the agreement between child and mother reports by examining the correlations between the different dimensions of the adapted HSC scale. According to Cohen (1988), a correlation coefficient between .10 and .30 is considered as small, a coefficient between .30 and .50 as medium, and a coefficient of .50 or larger as large.
Convergent and Discriminant Validity: The Association of the Adapted HSC Scale With Well-Studied Domains of Personality and Temperament
To investigate whether the adapted version of the HSC scale is associated with (i.e., convergent validity), but still different from (i.e., discriminant validity), well-studied domains of personality and temperament, we investigated the associations between the different dimensions of the adapted HSC scale (reported by children in Sample 1 and by mothers in Sample 2) and different domains of personality (i.e., Neuroticism, Extraversion, Openness, Agreeableness, and Conscientiousness) and temperament (i.e., Negative Affect, Effortful Control, Extraversion, and Orienting Sensitivity), which were reported by mothers in both samples. Both bivariate zero-order and partial correlations were estimated in Samples 1 and 2 using SPSS (Version 26). To deal with missing values in Sample 1 (10%, Little’s MCAR test did not converge), the results across five imputed data sets were pooled.
Criterion Validity: The Adapted HSC Scale as a Moderator of Environmental Stimuli
In order to validate whether the extended HSC scale indeed captures individual differences in sensitivity to the environment, we tested hierarchical regression models in SPSS (Version 26). In both samples, we ran hierarchical regression analysis for each dependent variable (i.e., externalizing and internalizing problem behaviors) separately. As a first step, we included control variables age and gender. In a second step, we included the standardized parenting (i.e., positive and negative parenting) and environmental sensitivity (i.e., HSC total or subscales) variables. As a third step, we included the interaction terms between the standardized parenting and environmental sensitivity variables. Parenting and outcome measures were reported by mothers and environmental sensitivity was reported by early adolescents in Sample 1 and by mothers in Sample 2 (because of a small number of child reports in Sample 2). Variance inflation factor (VIF) was examined to evaluate multicollinearity in the data (a proposed cutoff is VIF > 10, indicating severe multicollinearity; Menard, 1995). To deal with the missing values in Sample 1 (10%, Little’s MCAR test did not converge), the results across five imputed data sets were pooled.
Results
Factor Selection and Item Reduction
Although the Hull method indicated that a model with two dimensions provided the best fit (Figure S1, available in the online supplement material), we fitted both a two-factor and a three-factor model using ESEM, because the original HSC scale assumed three underlying traits (Pluess et al., 2018). However, in the three-factor ESEM model, the items that were a priori assigned to the EOE factor did not load on this factor. Furthermore, these items had high factor loadings on the LST factor, as did the items that were a priori assigned to LST (Table S1, available in the online supplement material). Therefore, in the two-factor ESEM model, the EOE and LST items were a prior assigned to one factor. 4 In parallel, but treating the response scale as ordered categorically, a MIRT model with two a priori defined dimensions (i.e., EOE-LST and AES) was fit to the data. Based on theoretical considerations and the results of the ESEM and MIRT analysis, items were selected. To be more precise, items with factor loadings <.40 (ESEM), slope parameters <.65 (MIRT), or with an inappropriate range of category boundary intercept parameters (MIRT) were considered for dropping if there was no theoretical justification (e.g., an aspect of environmental sensitivity that was not yet captured by the other retained items) for maintaining these items in the scale. This process resulted in a selected item pool of 21 well-functioning or informative items. All selected items had a factor loading ≥.40 (except HSC1: “I notice when small things have changed in my environment,” which had a factor loading of .38 but a slope of 1.21 and is considered as theoretically meaningful for the AES construct). According to the MIRT category boundary intercept parameter results, all items were informative along a wide range of the relevant underlying trait. Three items, however, were slightly more informative toward the extremes of the relevant traits: HSC21: “I get upset when other children touch me.” and HSC 35: “I am sensitive to being touched.” were slightly more informative for children scoring above average on EOE-LST; HSC15: “I immediately notice when someone has new clothes or a new haircut.” was slightly more informative for children scoring below average or average on AES. ESEM and MIRT results per item are reported in Table 2. Of the initial 34 items, only 21 were retained. Nevertheless, the content of the remaining items seems to cover the conceptual definition of environmental sensitivity across the different dimensions, that are, EOE, low sensory threshold, and aesthetic sensitivity (Greven et al., 2019; Pluess et al., 2018), sufficiently.
Items of the Extended Version of the Highly Sensitive Child Scale (34 Items), Factor Loadings, Discrimination, and Threshold Parameters for a Two-Factor Correlated Traits Model in the Calibration Part of Sample 1.

Note. HSC = Highly Sensitive Child scale total score; EOE = Ease of Excitation; LST = Low Sensory Threshold; AES = Aesthetic Sensitivity; selected items in bold; λ = factor loading; a = slope; d = category boundary intercept which are ordered in a decreasing manner.The bullet numbers are the numbers of the items of the extended HSC scale (see Supplementary Material 1). The numbers between parentheses are the item variable names of the final HSC-21 scale.
p < .05. **p < .01. ***p < .001.
Finally, within the ESEM framework the fit of the two-factor solution with 21 items (EOE-LST: n = 13, AES: n = 8) was optimized by allowing correlated error terms between highly correlated items tapping similar item content (e.g., between items HSC19 (“I have a delicate sense of smell”) and HSC7 (“I quickly notice how something smells,” for a complete overview, see Table S2, available in the online supplement material). The final model fitted the data in the calibration sample well (CFI = 0.946; TLI = 0.928; RMSEA = 0.036; SRMR = 0.041). The standardized factor loadings of the final two-factor model in the calibration sample are presented in Table 3.
Standardized Factor Loadings of the Final ESEM Two-Factor (Correlated Traits) Model of the HSC-21 in the Calibration Part of Sample 1.
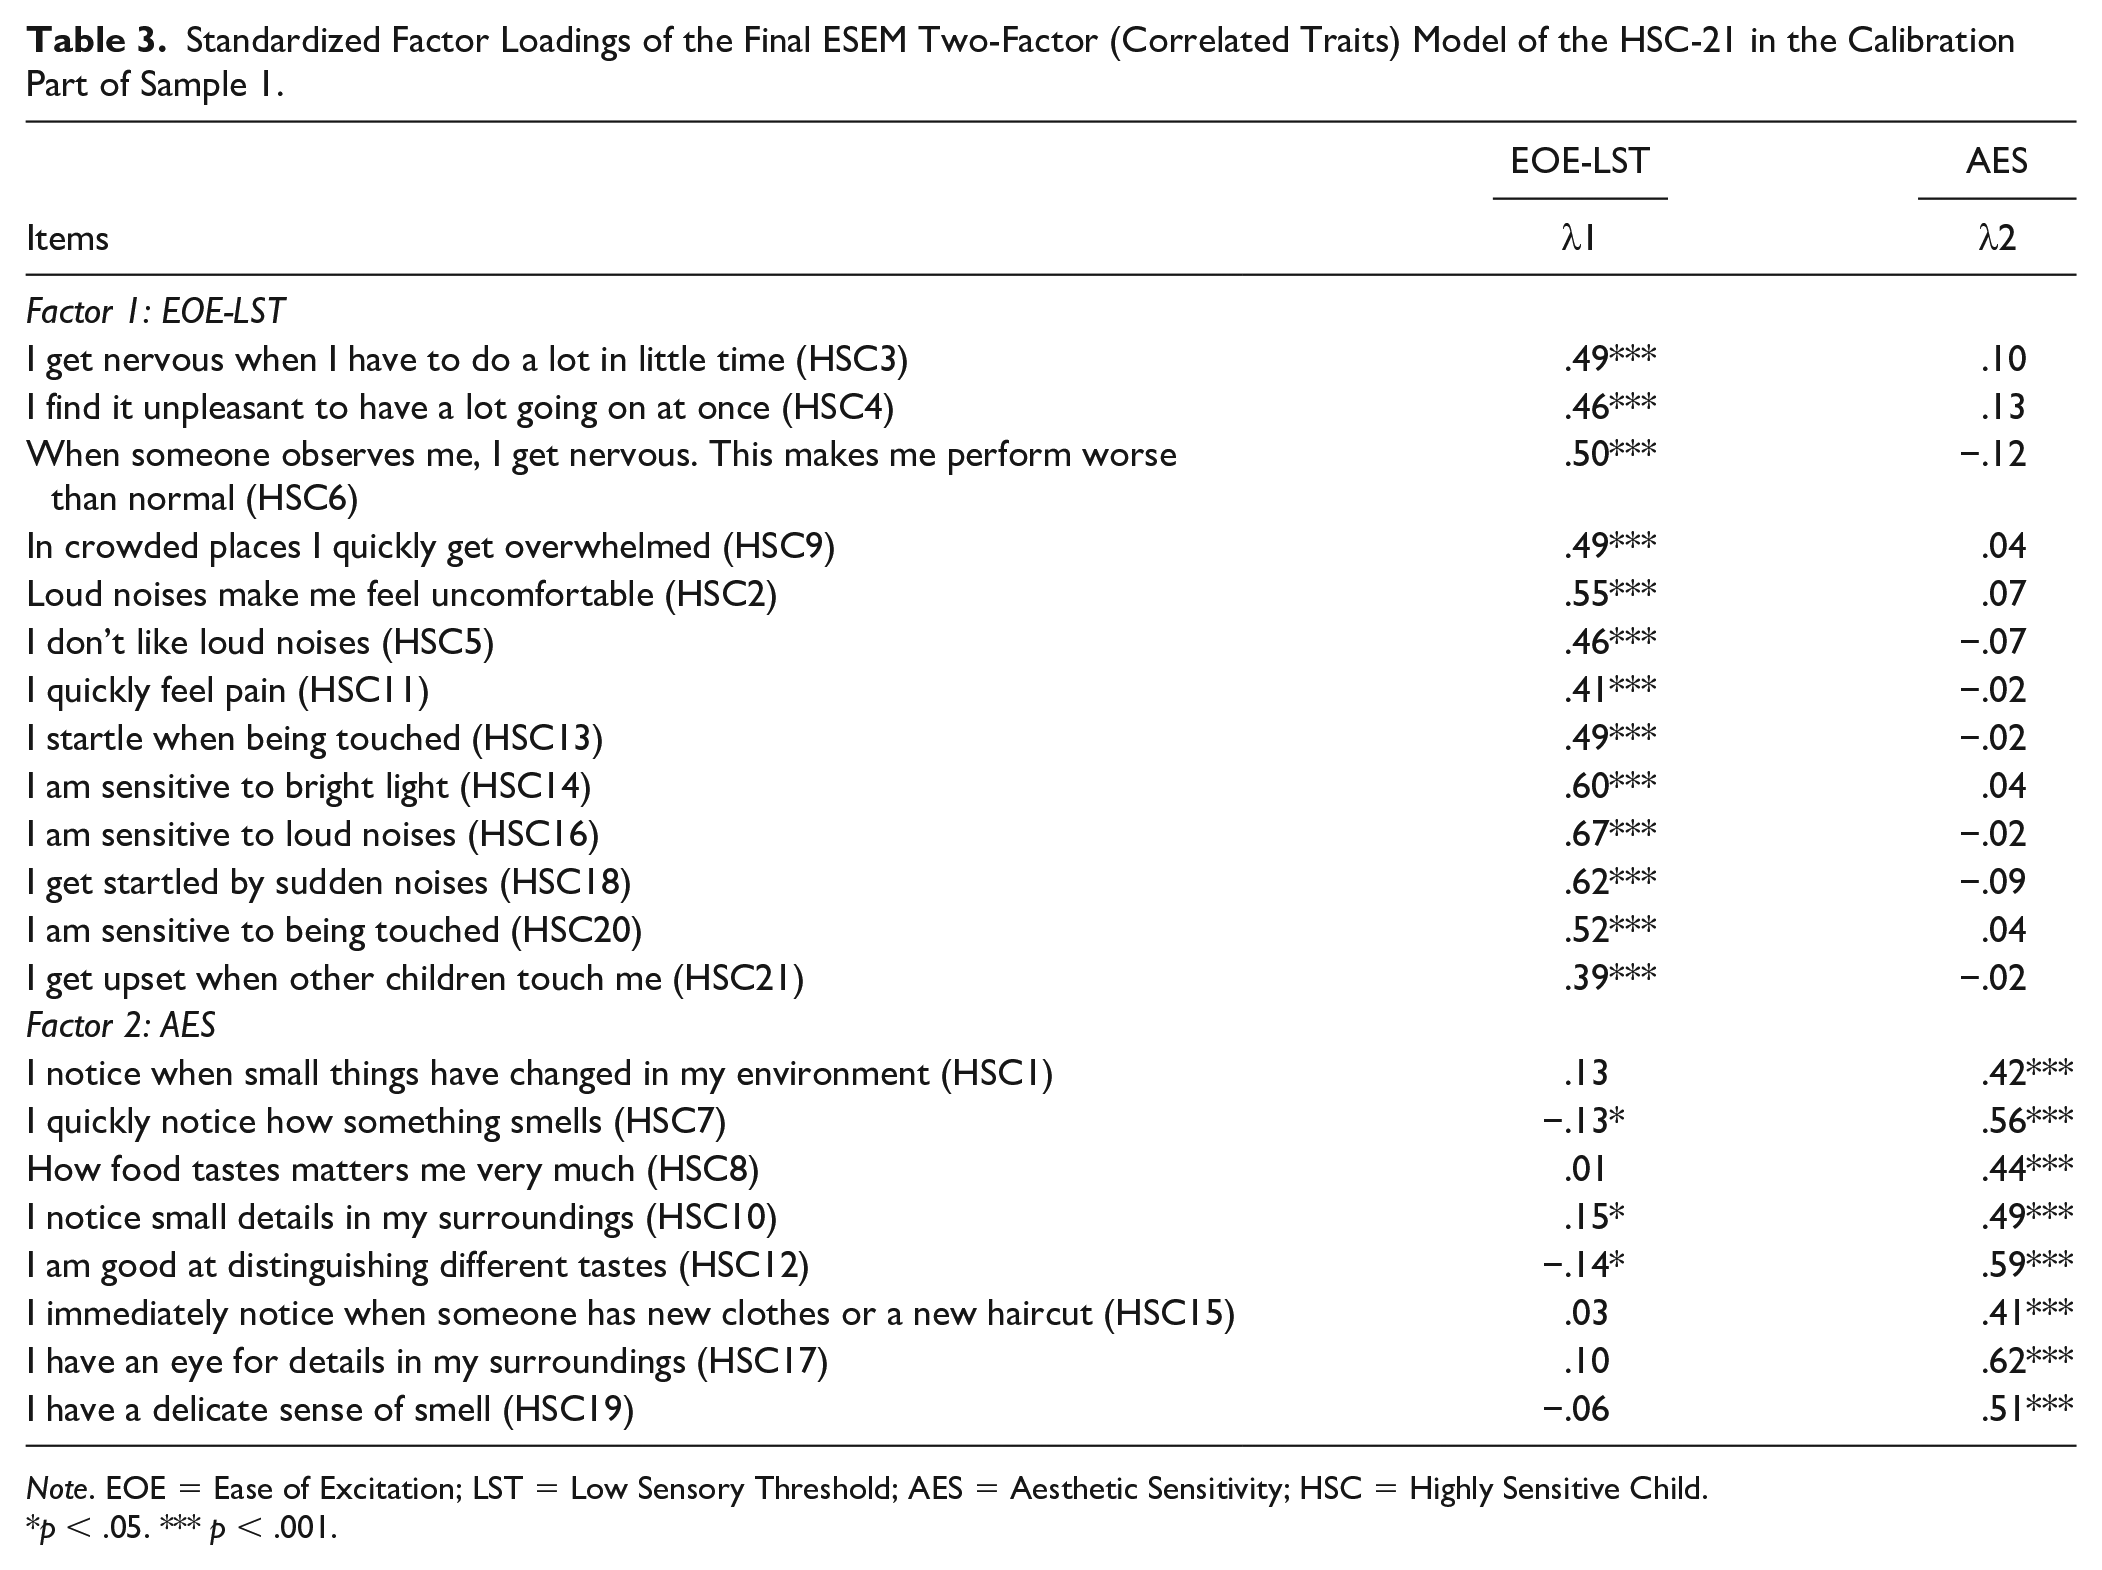
Note. EOE = Ease of Excitation; LST = Low Sensory Threshold; AES = Aesthetic Sensitivity; HSC = Highly Sensitive Child.
p < .05. *** p < .001.
Validation of the Factor Structure of the HSC-21 Scale
The fit of a two-factor correlated traits model (first-order model) was evaluated and compared with the fit of a bifactor model with the same two specific first-order factors (second-order model) in the validation part of Sample 1 and in Sample 2 (child and mother reports). In Sample 1, CFA results indicated an acceptable model fit for the two-factor solution (validation: CFI = 0.889; TLI = 0.867, RMSEA = 0.050; SRMR = 0.060; AICc = 23851.12; aBIC = 23841.641) and an acceptable model fit of the bifactor solution (CFI = 0.929; TLI = 0.906, RMSEA = 0.042; SRMR = 0.048; AICc = 23848.07; aBIC = 23811.728). For the two-factor model, only the CFI and TLI were <.90, which might not be informative because the baseline model’s RMSEA (0.140) was <.158, meaning it is unlikely to have CFI/TLI values >.90 (Rigdon, 1996). In Sample 2, CFA showed a nonacceptable model fit for a two-factor (CFI = 0.867; TLI = 0.842, RMSEA = 0.079; SRMR = 0.086; AICc = 11132.24; aBIC = 10975.267) and bifactor solution (CFI = 0.896; TLI = 0.862. RMSEA = 0.074; SRMR = 0.064; AICc = 11268.7; aBIC= 10935.900) when using self-reported data, but an acceptable and good model fit for the two-factor (CFI = 0.939; TLI = 0.928, RMSEA = 0.068; SRMR = 0.053; AICc = 36816.94; aBIC= 36876.114) and bifactor solution (CFI = 0.969; TLI = 0.959, RMSEA = 0.051; SRMR = 0.034; AICc = 36622.53; aBIC = 36687.936), respectively, when using mother reported data. In general, the bifactor model fit the data better than a correlated-traits model: Sample 1 (validation): ΔCFI = .042; ΔTLI = 0.030; ΔRMSEA = −0.008; ΔSRMR = −0.012, ΔAICc = −3.05; ΔaBIC = −29.913; Sample 2 (child report): ΔCFI = 0.029; ΔTLI = 0.020; ΔRMSEA = −0.005; ΔSRMR = −0.012; ΔAICc = 136.46; ΔaBIC = −39.367; and Sample 2 (mother report): ΔCFI = 0.03; ΔTLI = 0.031; ΔRMSEA = −0.017; ΔSRMR = −0.0190; ΔAICc = −194.41; ΔaBIC = −188.178.
Measurement Invariance of the HSC-21 Scale
Next, measurement invariance of the HSC-21 was tested across multiple groups. Regarding gender and developmental stage, results (Table 4) showed evidence for a full configural, partial metric (one item was variant with higher factor loading for girls), and full scalar invariance across gender in Sample 1. In Sample 2, evidence was found for full configural, full metric, and full scalar invariance across gender and developmental stage. Regarding measurement invariance across Belgium and the Netherlands, results (Table 4) showed evidence for full configural, full metric, and partial scalar invariance (one item was variant with higher intercepts in the Dutch sample). Finally, regarding measurement invariance across informants, results (Table 4) supported full configural invariance, partial metric invariance (one variant item with higher factor loadings for mother reports), and partial scalar invariance (with most variant items, except items HSC11 and HSC13, having higher intercepts for mother reports in comparison with child reports).
Summary of the Measurement Invariance Analyses of the HSC-21 Across Multiple Groups Within and Between Samples 1 and 2.
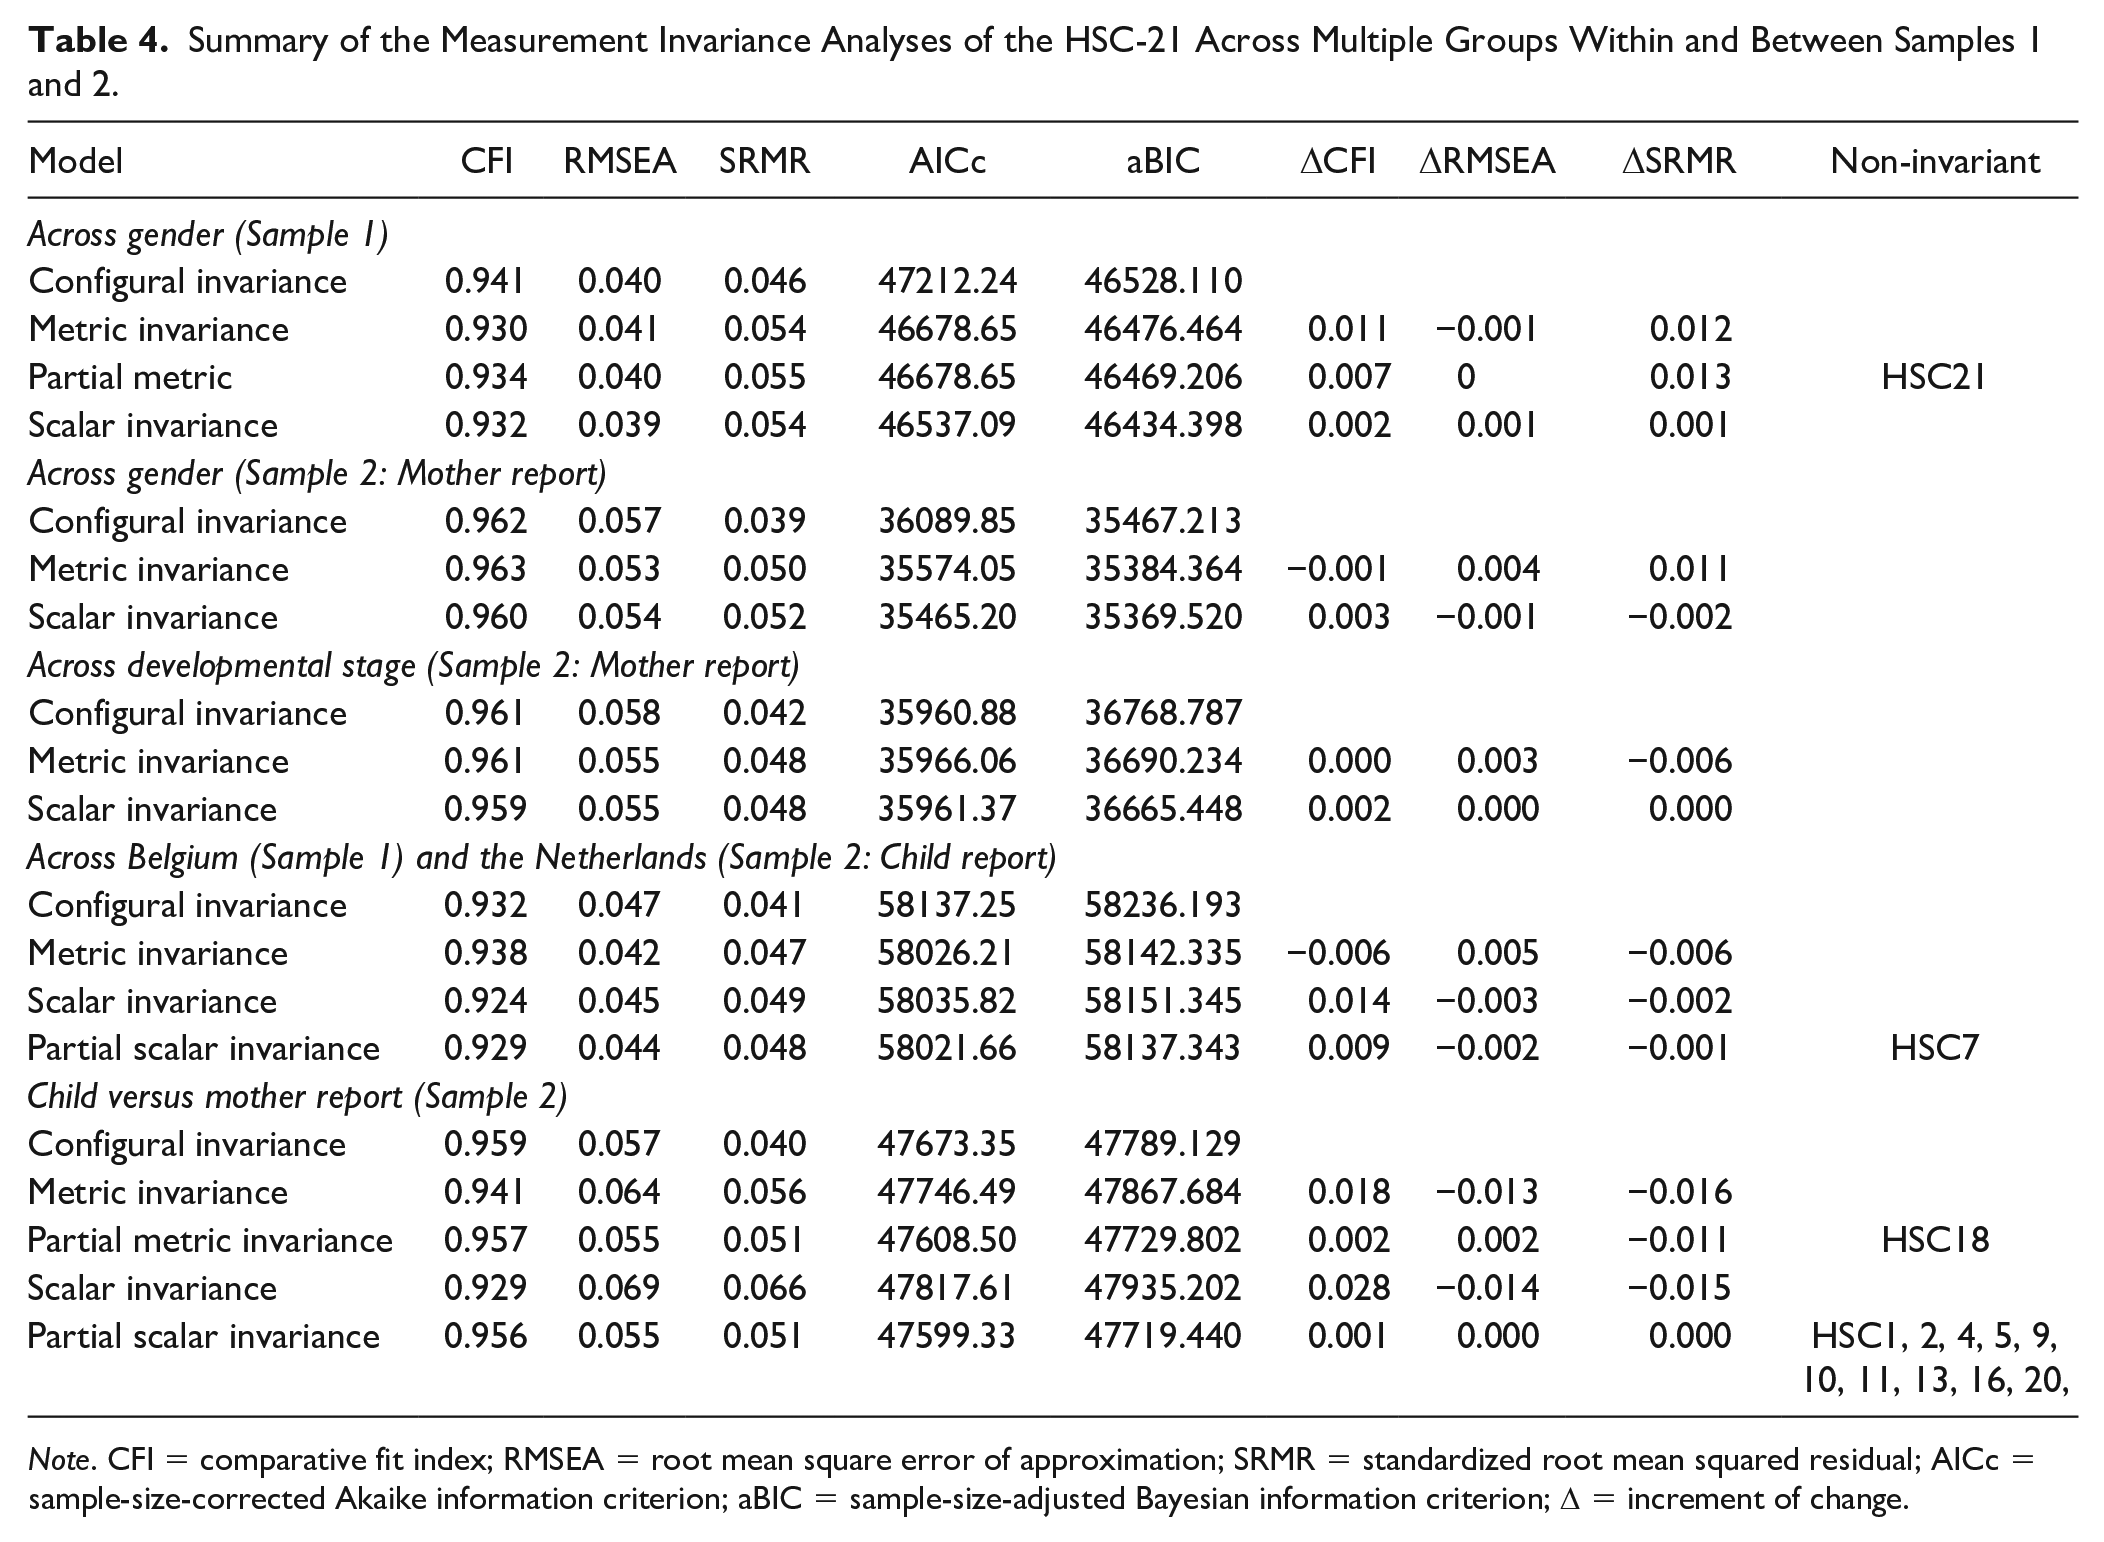
Note. CFI = comparative fit index; RMSEA = root mean square error of approximation; SRMR = standardized root mean squared residual; AICc = sample-size-corrected Akaike information criterion; aBIC = sample-size-adjusted Bayesian information criterion; Δ = increment of change.
Internal Consistency and Dimensionality of the HSC-21 Scale
The internal consistency values of the item scores on all subscales of the HSC-21 were good across Samples 1 and 2 and across child and mother reports (Table 5). The internal consistency values of the scores on the original 12 items are added for informational purposes, but cannot be directly compared due to differences in the number of items. Bifactor specific indices were further examined. Omega hierarchical of the general factor (ωH) indicated that 37 to 54% of the total variance of the HSC items in Sample 1 and Sample 2 (child report), and Sample 2 (mother report), respectively, were due to the general sensitivity factor while controlling for the specific sensitivity factors (EOE-LST and AES). When comparing ωH and ω, results indicated that 29 to 40% of the reliable variance in the total sensitivity scores was due to the subscale scores (EOE-LST and AES). For the specific factors, we see that 63% to 65% of the total variance of the HSC items in Samples 1 and 2 was explained by the EOE-LST factor and 29% to 53% by the AES specific factor when controlling for the variance in HSC items explained by the general factor. By comparing ωS with ω of the specific factors, EOE-LST results indicated that 16% to 29% of the reliable variance in the EOE-LST subscale scores and 36% to 48% of the reliable variance in AES subscale scores were accounted for by the total sensitivity score.
Internal Consistency of the HSC Scale 21 Versus 12 Items.
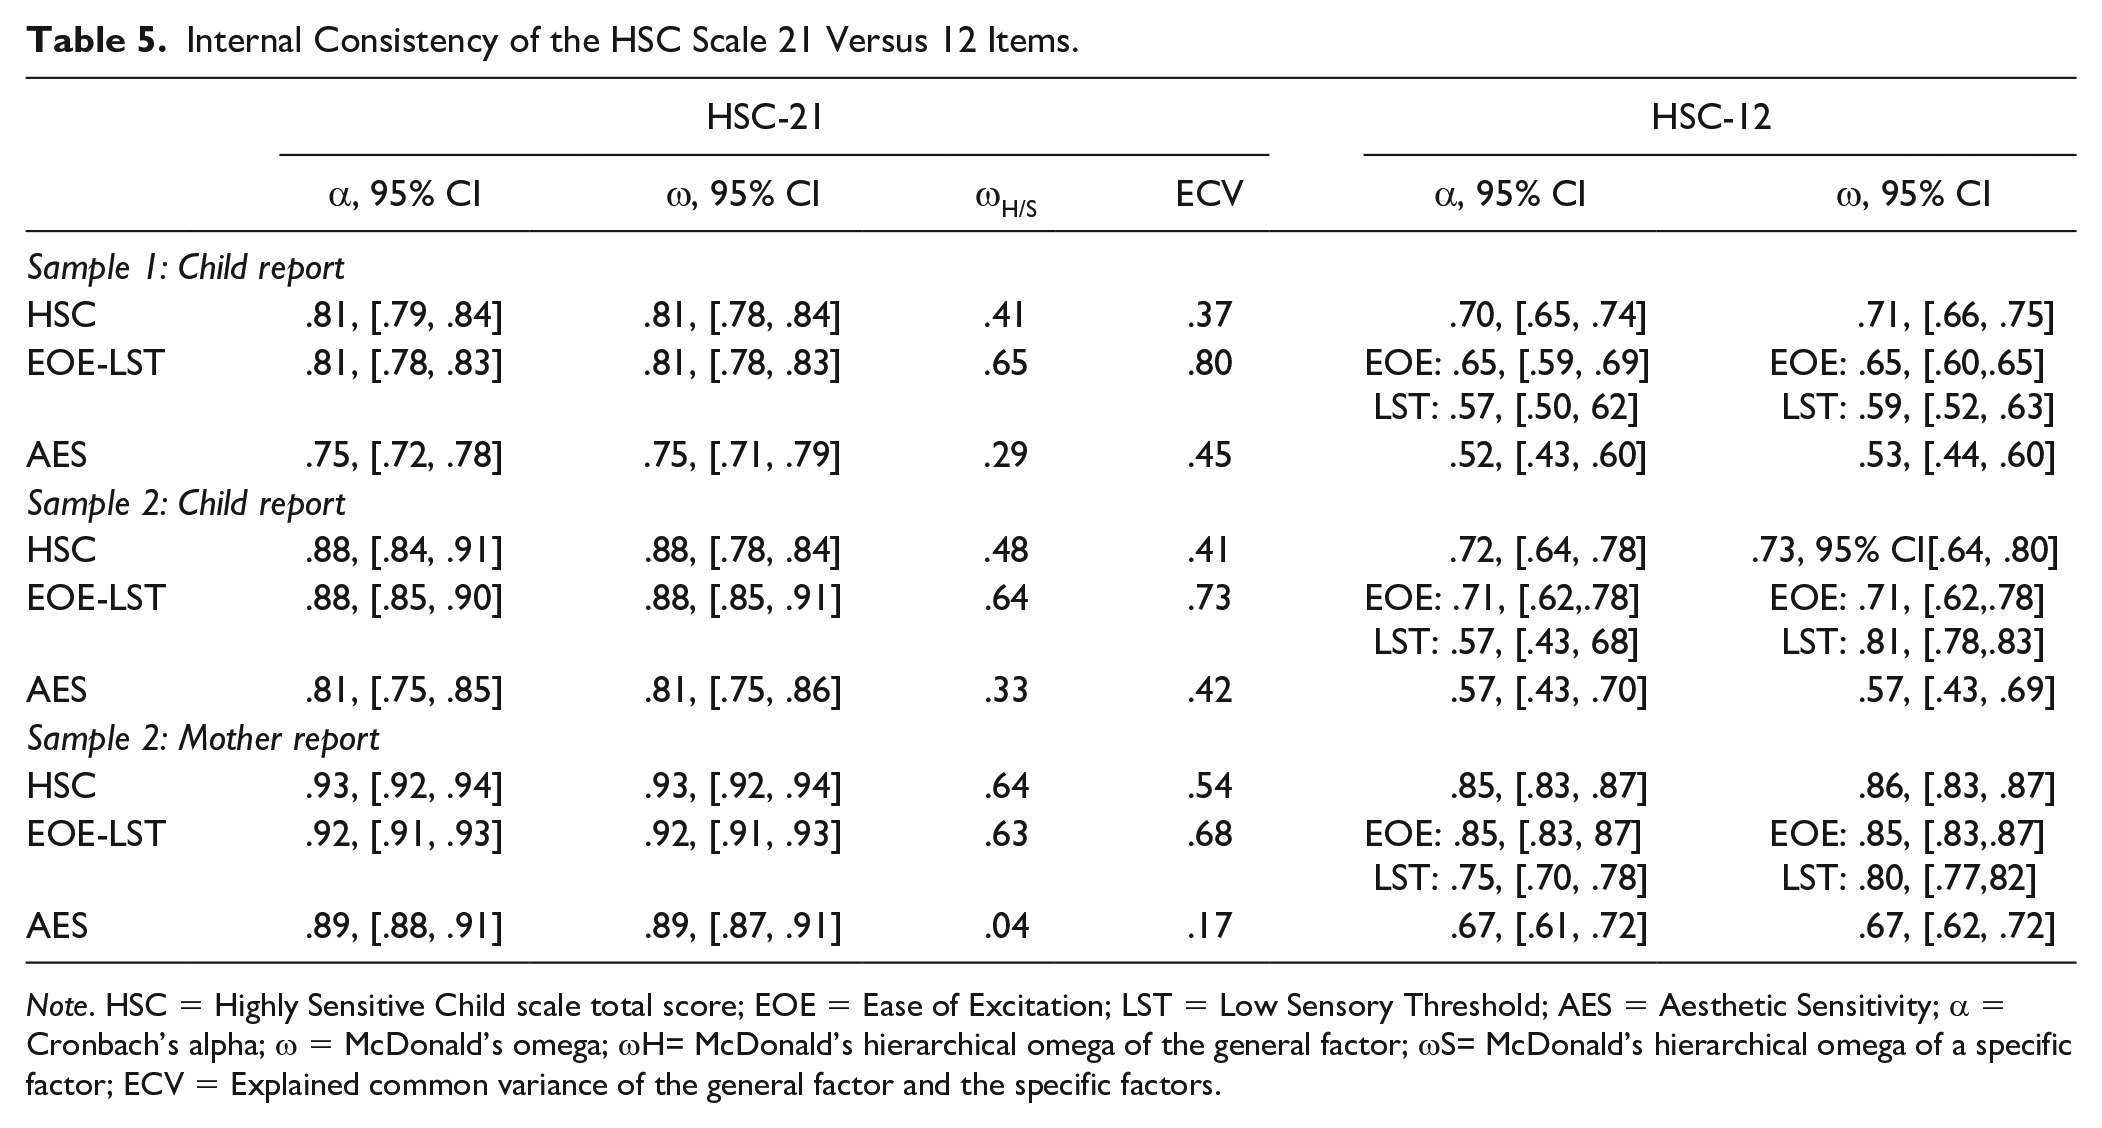
Note. HSC = Highly Sensitive Child scale total score; EOE = Ease of Excitation; LST = Low Sensory Threshold; AES = Aesthetic Sensitivity; α = Cronbach’s alpha; ω = McDonald’s omega; ωH= McDonald’s hierarchical omega of the general factor; ωS= McDonald’s hierarchical omega of a specific factor; ECV = Explained common variance of the general factor and the specific factors.
Descriptive Statistics and Agreement Between Child and Mother Reports
Information on the descriptive statistics and the intercorrelations among the subscales of the HSC-21 scale are presented in Table 6 (Sample 1) and Table 7 (Sample 2; descriptive statistics of the original 12 items were added for informative and comparison purposes). Results across the different samples showed small to moderate positive correlations between the EOE-LST and AES subscales. By comparing the mean scores on the total and subscales of the HSC-21 with their original counterparts, large positive correlations were found. Moreover, the scores on the HSC-21 total scale and subscales were relatively normally distributed, whereas this was not the case for the original items (i.e., skewness values are more around zero for the HSC-21 in comparison with the HSC-12, see Tables 6 and 7). The median of the HSC-21 total and subscales was also close to the middle of the theoretical range, compared with the median of the 12-item version (e.g., the median of the AES subscale [Sample 1] indicated that 50% of the responses were between 5.75 and 7, whereas the other 50% were between 1 and 5.75). Because (partial) scalar measurement invariance was established, we could compare the correlations between child and mother reports (Table 7). Results indicated medium positive correlations between child and mother reports on the EOE-LST subscale, and a low nonsignificant positive correlation between child and mother reports on the items of the AES subscale. As an additional analysis, the agreement between mother and child reports at item-level was investigated. Results indicated that across most items of EOE-LST (especially items regarding being easily overwhelmed and sensitivity to loud noises and pain), there were medium positive correlations between child and mother reports (Table S3, available in the online supplement material). For AES, items regarding noticing details in the environment and the importance of how food tastes, showed small positive correlations between child and mother reports, whereas mother and child reports on other items did not significantly correlate (i.e., items regarding having a delicate sense of smell, distinguishing different tastes, and having an eye for details in the environment).
Descriptive Statistics and Intercorrelations of the HSC-21 Scale the Original HSC-12 Scale in Sample 1.

Note. HSC = Highly Sensitive Child scale total score; EOE = Ease of Excitation; LST = Low Sensory Threshold; AES = Aesthetic Sensitivity.
p < .001.
Descriptive Statistics and Intercorrelations of the HSC-21 and the Original HSC-12 Scale for Child and Mother Reports in Sample 2.

Note. HSC = Highly Sensitive Child scale total score; EOE = Ease of Excitation; LST = Low Sensory Threshold; AES = Aesthetic Sensitivity. The correlations across informants were calculated on a sample of 101 participants. The values in bold are the correlations between the same (sub)scales across informants.
p < .05. **p < .01. ***p < .001.
Convergent and Discriminant Validity: The Association of the HSC-21 With Well-Studied Domains of Personality and Temperament
Bivariate zero-order and partial correlations between the HSC-21 scales and well-studied domains of personality and temperament were investigated (Table 8). Results showed positive correlations between the scores on the HSC-total scale and scores on Neuroticism, Negative affect, and Orienting sensitivity, and negative associations with Extraversion (temperament), Extraversion (personality, Sample 2), Agreeableness (Sample 2), and Effortful control (Sample 2). For the subscales of HSC-21, we describe only partial correlations because they control for the contribution of the other sensitivity subscale. Regarding the scores on the EOE-LST subscale, results across samples showed positive correlations with Negative affect, Orienting sensitivity, and Neuroticism (Sample 2); and negative associations with Conscientiousness, Extraversion (temperament), Extraversion (personality, Sample 2), Openness (Sample 2), Agreeableness (Sample 2), and Effortful control (Sample 2). Scores on the AES subscale showed positive correlations with Openness, Orienting Sensitivity (Sample 2), and Extraversion (temperament and personality).
Bivariate Zero-Order and Partial Correlations Between the HSC Scale (21 Items) and Personality and Temperament in Samples 1 and 2.
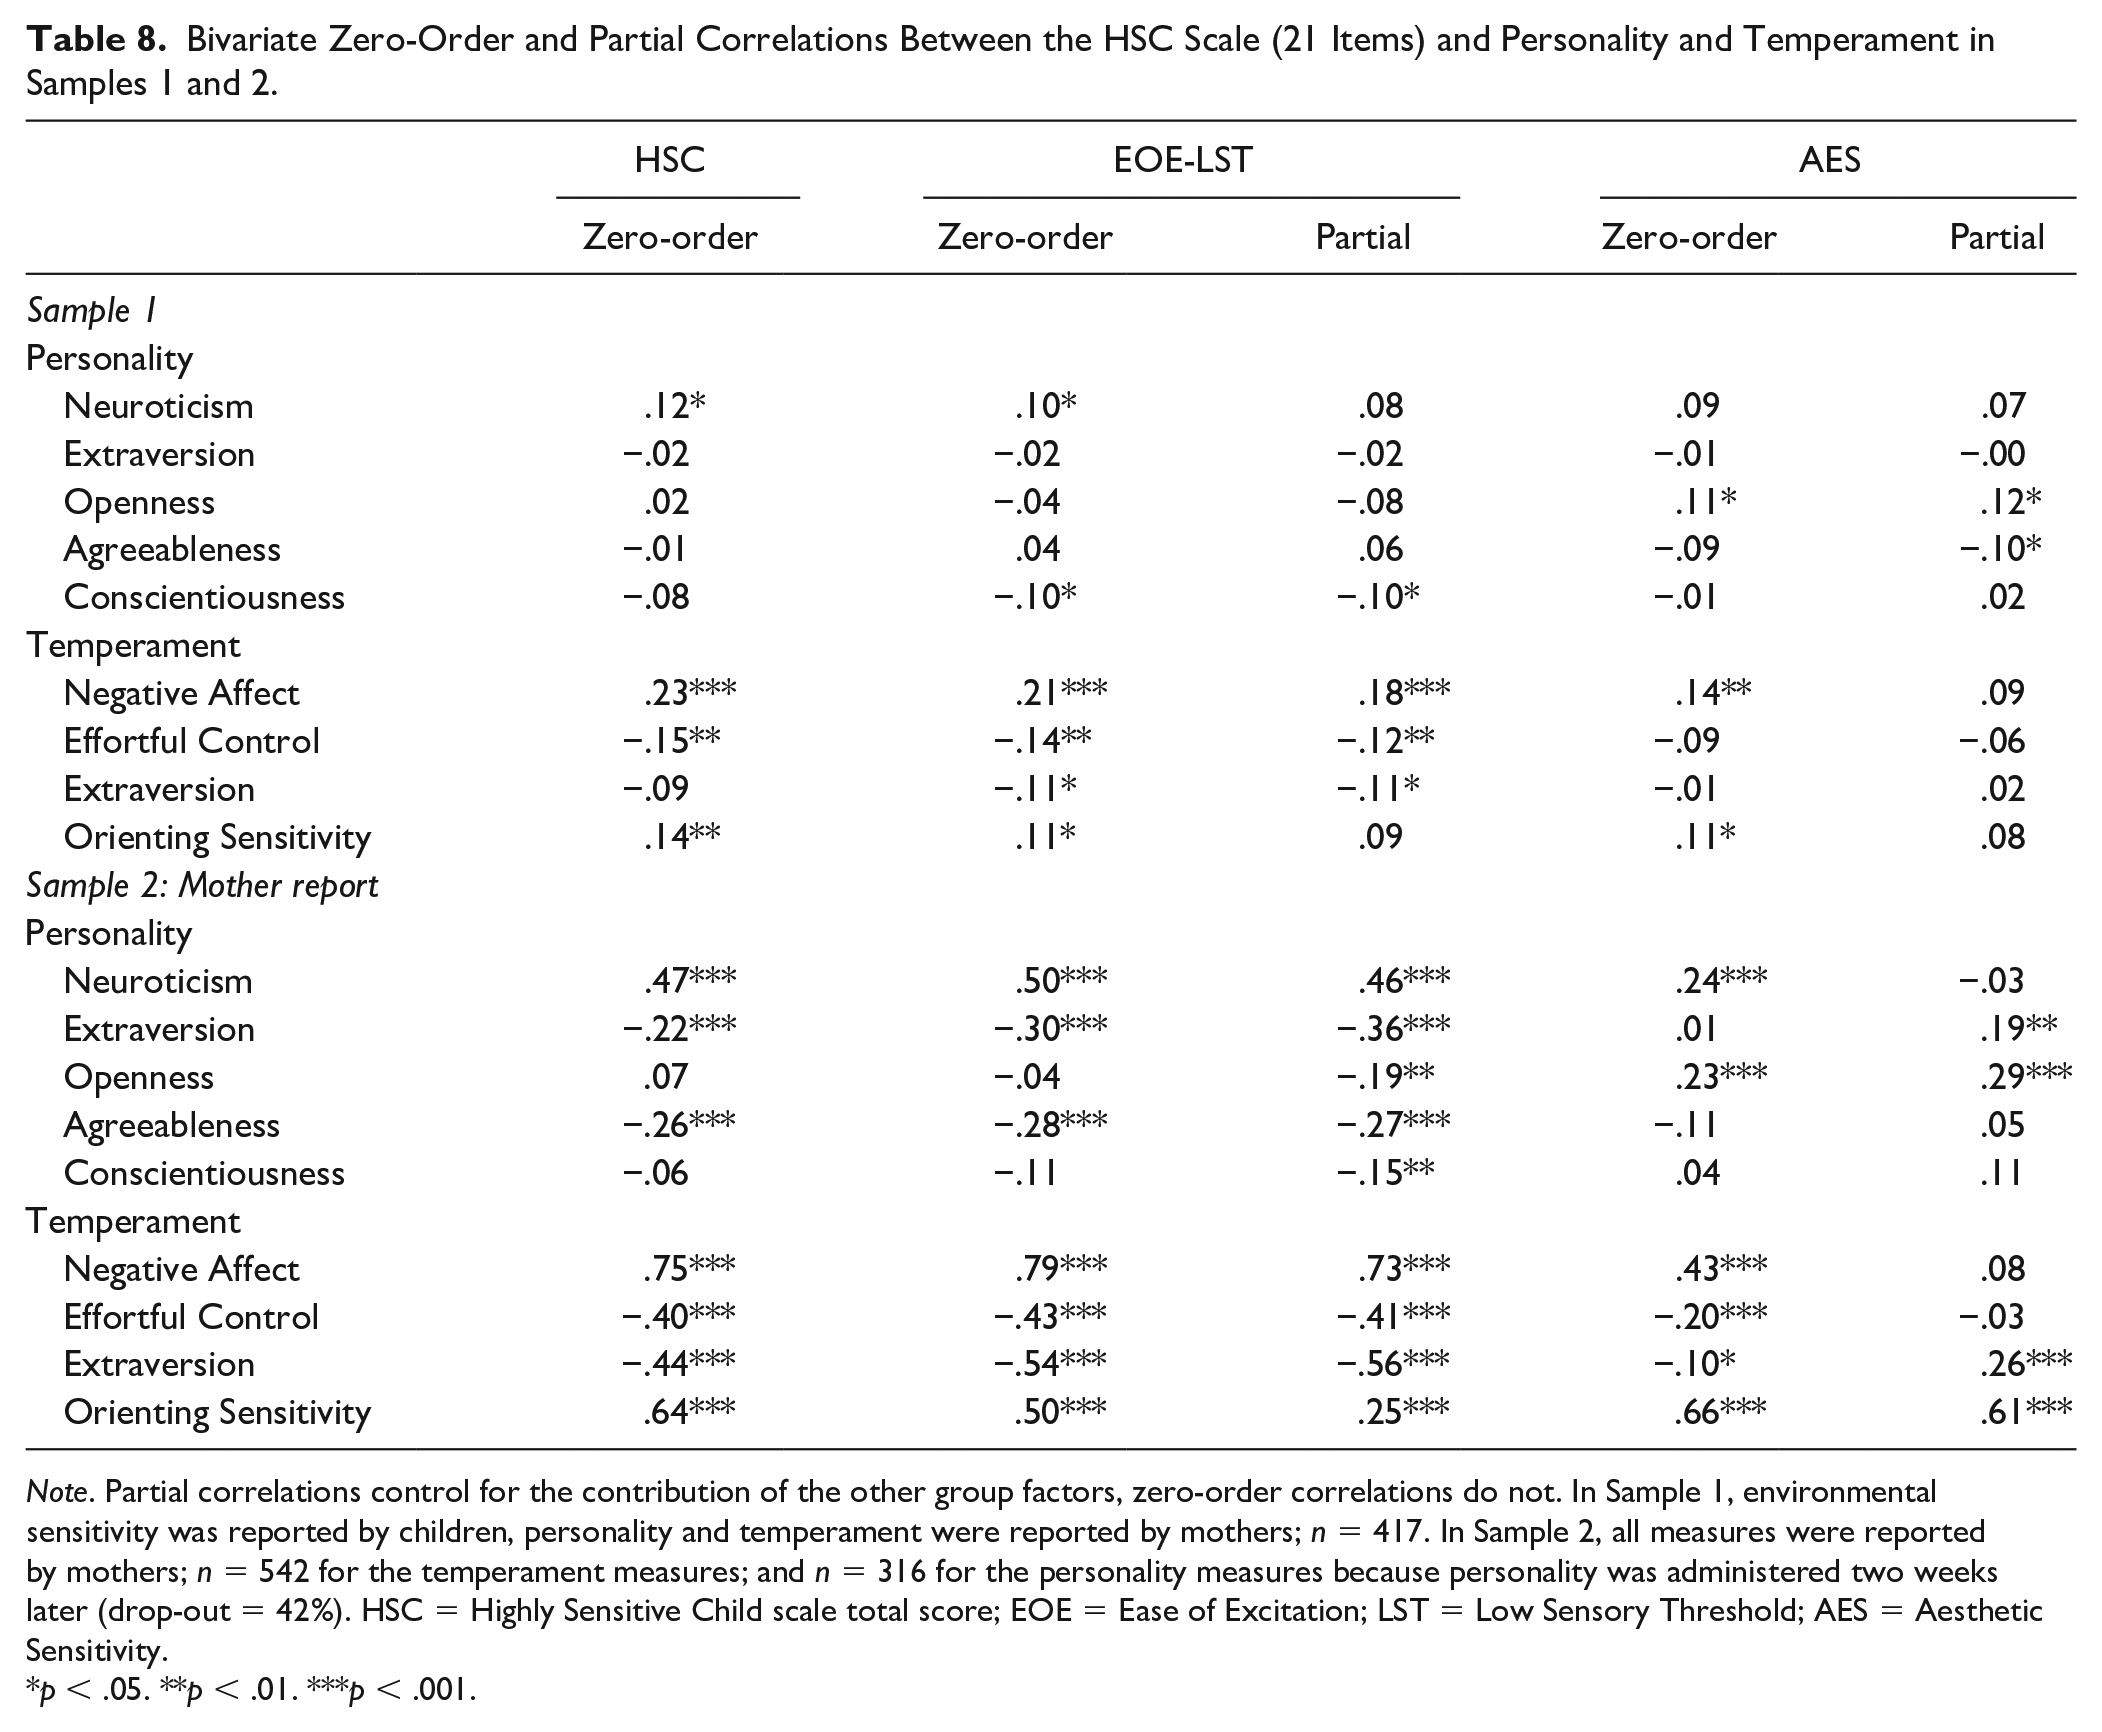
Note. Partial correlations control for the contribution of the other group factors, zero-order correlations do not. In Sample 1, environmental sensitivity was reported by children, personality and temperament were reported by mothers; n = 417. In Sample 2, all measures were reported by mothers; n = 542 for the temperament measures; and n = 316 for the personality measures because personality was administered two weeks later (drop-out = 42%). HSC = Highly Sensitive Child scale total score; EOE = Ease of Excitation; LST = Low Sensory Threshold; AES = Aesthetic Sensitivity.
p < .05. **p < .01. ***p < .001.
Criterion Validity: The HSC-21 as a Moderator of Environmental Stimuli
Results of the eight hierarchical regression analyses are shown in Table 9 (total HSC scale) and 10 (HSC subscales). VIF was around 1 across all analyses, indicating evidence for no multicollinearity. Across both samples no evidence for the moderating role of the HSC-21 in the relationship between parenting and internalizing and externalizing problem behaviors was found. Results suggested only some direct associations with HSC-21total scale and subscales. Higher scores on environmental sensitivity, especially on EOE-LST, were associated with more externalizing and internalizing problem behaviors.
Hierarchical Regression Analysis of HSC-241 (Total Scale) as a Moderator in the Relation Between Parenting and Internalizing and Externalizing Problem Behaviors (Samples 1 and 2).
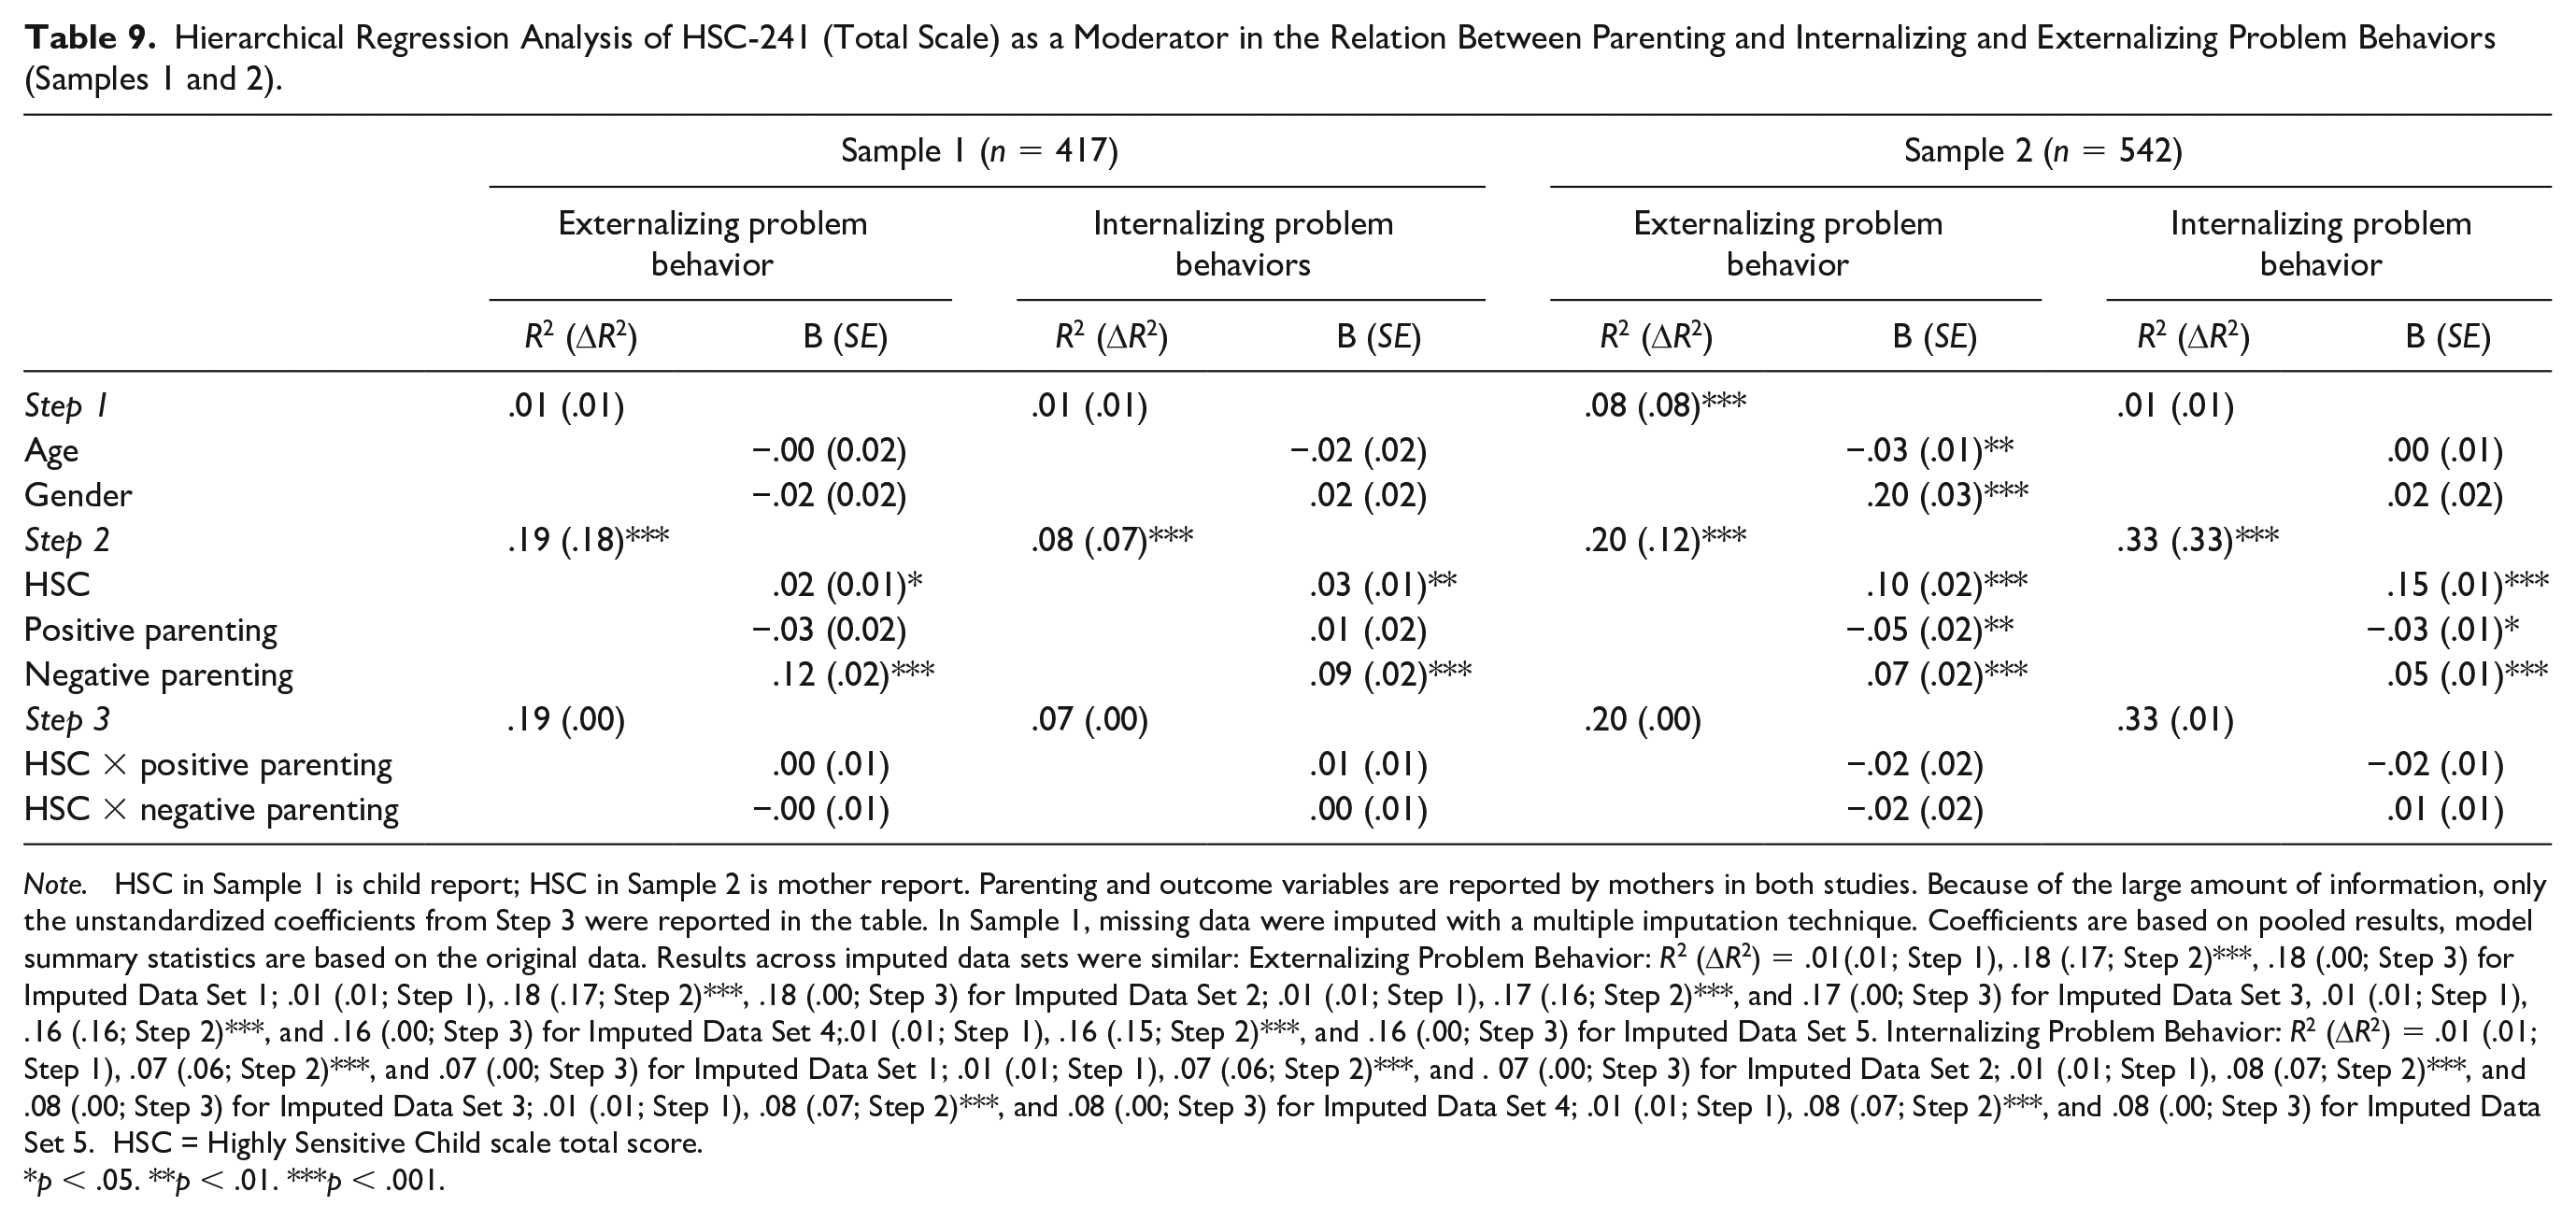
Note. HSC in Sample 1 is child report; HSC in Sample 2 is mother report. Parenting and outcome variables are reported by mothers in both studies. Because of the large amount of information, only the unstandardized coefficients from Step 3 were reported in the table. In Sample 1, missing data were imputed with a multiple imputation technique. Coefficients are based on pooled results, model summary statistics are based on the original data. Results across imputed data sets were similar: Externalizing Problem Behavior: R2 (ΔR2) = .01(.01; Step 1), .18 (.17; Step 2)***, .18 (.00; Step 3) for Imputed Data Set 1; .01 (.01; Step 1), .18 (.17; Step 2)***, .18 (.00; Step 3) for Imputed Data Set 2; .01 (.01; Step 1), .17 (.16; Step 2)***, and .17 (.00; Step 3) for Imputed Data Set 3, .01 (.01; Step 1), .16 (.16; Step 2)***, and .16 (.00; Step 3) for Imputed Data Set 4;.01 (.01; Step 1), .16 (.15; Step 2)***, and .16 (.00; Step 3) for Imputed Data Set 5. Internalizing Problem Behavior: R2 (ΔR2) = .01 (.01; Step 1), .07 (.06; Step 2)***, and .07 (.00; Step 3) for Imputed Data Set 1; .01 (.01; Step 1), .07 (.06; Step 2)***, and . 07 (.00; Step 3) for Imputed Data Set 2; .01 (.01; Step 1), .08 (.07; Step 2)***, and .08 (.00; Step 3) for Imputed Data Set 3; .01 (.01; Step 1), .08 (.07; Step 2)***, and .08 (.00; Step 3) for Imputed Data Set 4; .01 (.01; Step 1), .08 (.07; Step 2)***, and .08 (.00; Step 3) for Imputed Data Set 5. HSC = Highly Sensitive Child scale total score.
p < .05. **p < .01. ***p < .001.
Hierarchical Regression Analysis of HSC-241 (Subscales) as a Moderator in the Relation Between Parenting and Internalizing and Externalizing Problem Behaviors (Samples 1 and 2).

Note. HSC subscales in Sample 1 are child report; HSC subscales in Sample 2 are mother report. Parenting and outcome variables are mother reports in both studies. Because of the large amount of information, only the unstandardized coefficients from Step 3 were in the table. In Sample 1, missing data were imputed with a multiple imputation technique. Coefficients are based on pooled results, model summary statistics are based on the original data. Results across imputed data sets were similar: Externalizing Problem Behavior: R2 (ΔR2) = .01(.01; Step 1), .18 (.17; Step 2)***, .18 (.00; Step 3) for Imputed Data Set 1; .01 (.01; Step 1), .17 (.17; Step 2)***, and .18 (.00; Step 3) for Imputed Data Set 2; .01 (.01; Step 1), .17 (.16; Step 2)***, and .17 (.00; Step 3) for Imputed Data Set 3; .01 (.01; Step 1), .16 (.16; Step 2)***, and .17 (.01; Step 3) for Imputed Data Set 4;.01 (.01; Step 1), .16 (.15; Step 2)***, and .16 (.00; Step 3) for Imputed Data Set 5.Internalizing Problem Behavior: R2 (ΔR2) = .01 (.01; Step 1), .07 (.06; Step 2)***, and .0 8 (.00; Step 3) for Imputed Data Set 1; .01 (.01; Step 1), .07 (.06; Step 2)*** and. 07 (.00; Step 3) for Imputed Data Set 2; .01 (.01; Step 1), .08 (.07; Step 2)***, and .08 (.00; Step 3) for Imputed Data Set 3; .01 (.01; Step 1), .08 (.07; Step 2)***, and .08 (.00; Step 3) for Imputed Data Set 4;.01 (.01; Step 1), .08 (.07; Step 2)***, and .08 (.00; Step 3) for Imputed Data Set 5. EOE = Ease of Excitation; LST = Low Sensory Threshold; AES = Aesthetic Sensitivity.
p < .05. **p < .01. *** p < .001.
Discussion
Individual differences in environmental sensitivity in children and adolescents can be measured with the HSC scale (Pluess et al., 2018; Weyn et al., 2019). The original HSC scale shows a bifactor structure with a general sensitivity factor and three-group factors (i.e., EOE, LST, and AES). However, previous studies (e.g., Weyn et al., 2019) indicated that (a) the internal consistency values of the scores on two out of three subscales (i.e., LST and AES) were too low in the examined samples; (b) there was low variation in responses on some items (due to ceiling effects); (c) the scope of the domains captured by the items (i.e., content validity) was limited; and (d) the HSC scale was only partially metric and scalar invariant across developmental stage (i.e., early vs. middle to late adolescents), gender, and country (i.e., Belgium and the United Kingdom). Therefore, in the present study, we aimed to improve the HSC scale by developing and testing additional items (n = 26) that were expected to perform better than the original 12 items (i.e., allowing more variation in responses and capturing the underlying construct more broadly).
Item Selection, Factor Structure, Measurement Invariance, and Multi-Informant Agreement of the HSC-21 Scale
By using Hull method, ESEM, MIRT, and theoretical considerations, 21 items loading on two dimensions (EOE-LST and AES) were selected. The model fit of a two-factor correlated traits model and a bifactor model with the same two first-order factors were examined across a Belgian and a Dutch sample, including child and mother reports. Evidence pointed to the bifactor solution with a general sensitivity factor and two specific factors (i.e., EOE-LST and AES) as the most optimal configuration. Therefore, we recommend that researchers examine both the general sensitivity factor (i.e., more or less sensitivity) and the two specific factors. We believe that this will contribute to a better understanding of the environmental sensitivity construct and allows researchers to characterize individual children in terms of sensitivity along the different dimensions on top of the general sensitivity dimension. In contrast to the original HSC scale, we collapsed two factors (i.e., EOE and LST) into one factor (i.e., EOE-LST). Previous studies supported a bifactor solution with three specific factors (i.e., EOE, LST, and AES), but found that EOE and LST showed large mutual associations and similar associations with external variables, such as personality and temperament (Pluess et al., 2018; Weyn et al., 2019). These studies indicated that higher scores on EOE and LST might be associated with a sensitivity toward negative environments, whereas higher scores on AES might be associated with a sensitivity toward positive environments (Pluess et al., 2018; Weyn et al., 2019). Moreover, Evans and Rothbart (2008) also found in adults most evidence for a factor solution of the HSP scale (i.e., the adult variant of the HSC scale) with two orthogonal factors: (a) Negative Affect which is associated with temperamental traits Negative Affect and more specifically with Sensory Discomfort and (b) Orienting Sensitivity which is associated with the temperamental traits Orienting Sensitivity/Openness and its subscale Sensory Sensitivity. Therefore, the final factor structure that we present in the present study is supported by the results across multiple analyses and samples, is partially in line with results of previous studies, is more parsimonious than the original structure, and is meaningful when we look at associations with external variables (e.g., temperament and personality).
Regarding measurement invariance, evidence was found for full configural, partial (Sample 1, one invariant item) and full (Sample 2) metric invariance, and full scalar invariance across gender and developmental stage (i.e., children in primary vs. secondary school). A previous study, investigating the psychometric properties of the original scale across different samples, supported evidence for only partial metric and partial scalar invariance across gender and developmental stage (with multiple variant items; Weyn et al., 2019). Next, evidence was found for full configural, full metric, and partial scalar invariance (one variant item) across the Belgian and Dutch sample. Finally, evidence was found for full configural, partial metric, and partial scalar invariance across mother and self-reports. These results mean that (a) the underlying structure of environmental sensitivity was conceptualized similarly across the investigated groups (i.e., configural invariance); (b) children and early adolescents, boys and girls, from both samples attributed the same meaning to environmental sensitivity (i.e., metric invariance, with the exception of one variant item across all comparisons); and (c) children and early adolescents from both samples used the same reference point (with the exception of variant items; i.e., partial scalar invariance). In general, noninvariant items per analysis showed higher associations (i.e., factor loadings) for girls in comparison with boys, a higher reference point (i.e., intercept) in the Dutch sample in comparison with the Belgian sample, and a higher reference point and higher associations (i.e., factor loading) for mother reports in comparison with child reports. For the group comparisons in which full scalar measurement was established (i.e., developmental stage and gender), researchers are allowed to compare the observed means (Van de Schoot et al., 2012). For the other comparisons, where only partial scalar invariance was established, it is possible to compare the latent structure, latent mean levels, intercorrelations, and predictive relations with external variables of the HSC-21 across Belgium and the Netherlands and across child and mother reports (Steinmetz, 2013).
We were able to investigate the agreement between child and mother reports, because partial scalar measurement invariance between informants was established. Results showed moderate associations between child and mother reports on the total scale and EOE-LST dimension, but not for AES. These results are in line with research on agreement between children and mothers regarding personality traits (Laidra et al., 2006). Research showed moderate agreement between children and mothers for Neuroticism, Extraversion, and Agreeableness (which seems to be associated with EOE-LST; e.g., Weyn et al., 2019), but only low agreement between child and mother reports for Openness (which seems to be associated with AES; e.g., Weyn et al., 2019).
Internal Consistency, Dimensionality, and Distribution of the HSC-21
Results showed good internal consistency values of the scores on the total scale and subscales across the different samples. Bifactor model specific indices (i.e., McDonald’s hierarchical omega of the group factor and specific factors and ECV) were examined to further explore the psychometric properties of the HSC-21. The hierarchical omega indices indicated that both the general sensitivity factor and the specific factors explained a considerable amount of variance in the data, also after controlling for each other’s contribution. The ECV, an index of unidimensionality, also supported a multidimensional structure. In a previous study, the variance explained by the general factor was almost exclusively attributed to the variance explained by EOE and LST (Weyn et al., 2019). Using the HSC-21, both the AES and EOE-LST scales contribute to the variance explained by the general factor. In addition, item scores on all the scales (i.e., total scale and subscales) were distributed relatively normally and the formulation of the items allowed more variation in responses.
Convergent, Discriminant, and Criterion Validity
Across both samples, EOE-LST showed small to medium (Sample 1) and large (Sample 2) associations with Neuroticism, Negative Affect, and Orienting Sensitivity, whereas AES showed small to medium positive associations with Extraversion (only Sample 2) and Openness and a large positive association with Orienting Sensitivity (Sample 2). These results are in line with previous research (e.g., Aron & Aron, 1997; Pluess et al., 2018; Smolewska et al., 2006; Weyn et al., 2019), which showed that environmental sensitivity is related to (i.e., convergent validity), but not simply a reflection of (i.e., discriminant validity) well-studied domains of temperament (e.g., the model of Evans and Rothbart [2008]) and personality (e.g., Big Five; McCrae & Costa, 1987). Moreover, they indicated that the different dimensions (EOE and LST vs. AES) were differently related to domains of personality and temperament, with EOE and LST showing medium associations with Neuroticism and Negative affect, and AES showing small to medium associations with Openness and Extraversion (Pluess et al., 2018).
Regarding criterion validity, based on the environmental sensitivity framework (Pluess, 2015) we would expect that children scoring high on the HSC scale are more affected by both positive and negative environmental stimuli. However, results did not show evidence for the HSC-21 (total scale and subscales) as a moderator in the relationship between supportive and/or psychological controlling parenting and internalizing and externalizing problem behaviors. Previous studies (e.g., Lionetti et al., 2019; Slagt et al., 2018) did find evidence for a heightened sensitivity toward positive and negative environments (i.e., differential susceptibility). These studies differed from the present study in that they studied much younger children (i.e., toddlers) and used a different design (e.g., longitudinal study, observation study, or specified environmental sensitivity as a categorical predictor). Moreover, because we examined general population samples, we were not able to see much variation in parenting and outcome measures. Most parents reported high supportive parenting, low psychological controlling parenting, and low internalizing and externalizing problem behaviors. Finally, it is possible that there are better proxies of environmental quality in adolescence than parent reported positive and negative parenting, such as family climate, friendship quality, socioeconomic status, difficulties in coparenting, and major life events.
Strengths, Limitations, and Further Research
An important strength is the in-depth examination of the psychometric properties of an improved version of the HSC scale in two different samples, including both child and mother reports and reports from two different countries (i.e., Belgium and the Netherlands). The present study created a parent-report version of the HSC-21 and was the first to examine agreement between child and mother reports. Across these samples, the HSC-21 showed acceptable to good psychometric properties and a moderate agreement between child and mother reports on environmental sensitivity. However, there are also some limitations. First, all findings were based on self and mother reports, which may elicit socially desirable answers. It could be informative to also include father and teacher reports, or to use more objective measures such as observations or experimental manipulations (e.g., positive mood induction). Second, we used Belgian and Dutch samples that are both predominantly Caucasian and are quite similar to each other (e.g., Dutch language). It would be interesting to compare our findings with findings in more ethnically diverse samples to examine the culture fair nature of the HSC-21 and environmental sensitivity in general. Third, for AES, we found little agreement between child and mother reports. It would be interesting in further research to investigate possible predictors (e.g., differences in personality/temperament of the informant) and outcomes (e.g., self-esteem) that are associated with little agreement between child and mother reports on environmental sensitivity. Fourth, the current study is cross-sectional, therefore we were not able to examine whether the HSC-21 interacts with changes in positive and negative parenting or to investigate the direction of associations between parenting and environmental sensitivity across time. Fifth, as a proxy of environmental quality, we included only parent reported parenting, for which there was not much variation in responses (i.e., most parents reported high support and low psychological control). Sixth, externalizing problem behavior was measured with different questionnaires, which makes a direct comparison of the results between both samples difficult. Seventh, because of the smaller sample size of self-reported data in Sample 2, we were not able to use these data across all analyses. Finally, a shortcoming of all existing HSC (children) and HSP (adults) scales is that they do not capture depth of cognitive processing. We tried to include some items capturing the pause and check behaviors as observed in highly sensitive children (Items 16 and 34 in the online Supplementary Material 1; based on Lionetti et al., 2019), but during data collection, we noticed that these items were too difficult for children to answer. This issue of content validity and item wording appropriateness for younger children should be taken into account in further research. Nevertheless, we believe that the HSC-21 captures the different dimensions of environmental sensitivity in a more fine-grained way than previous measures (e.g., more sensory modalities and with items that discriminate more among people along the continuum of environmental sensitivity).
Conclusion
The present study described the development and initial validation of the HSC-21 items scale. The HSC-21 is an adaptation of the original HSC scale with additional items that perform better than the original ones. Results across different samples, including Belgian and Dutch samples and child and mother reports, showed acceptable to good psychometric properties of the HSC-21. The HSC-21 showed (a) an acceptable to good model fit of a bifactor model with a general sensitivity factor and two specific factors: the first one is EOE-LST and the second one refers to AES, (b) (partial) measurement invariance across gender, developmental stage, country, and informants, (c) good reliability, (d) 21 informative items that are relatively normal distributed and allowing variation in responses, (e) moderate agreement between child and mother reports, and (f) meaningful associations with well-studied domains of temperament and personality. However, no evidence was found for the moderating role of the HSC-21 between parenting and internalizing and externalizing problem behaviors. Based on the present study, we recommend to use the HSC-21 when (a) investigating the different dimensions of environmental sensitivity (i.e., EOE-LST and AES), (b) using both child and mother reports, or (c) characterizing individual children in terms of sensitivity along the different dimensions. When one is interested in the construct in general and in its moderating role both the HSC-12 and HSC-21 can be used. The HSC-21 can be used in further research and eventually also in clinical practice or in school contexts to develop more personalized interventions.
Supplemental Material
sj-pdf-1-asm-10.1177_1073191120983894 – Supplemental material for Improving the Measurement of Environmental Sensitivity in Children and Adolescents: The Highly Sensitive Child Scale–21 Item Version
Supplemental material, sj-pdf-1-asm-10.1177_1073191120983894 for Improving the Measurement of Environmental Sensitivity in Children and Adolescents: The Highly Sensitive Child Scale–21 Item Version by Sofie Weyn, Karla Van Leeuwen, Michael Pluess, Francesca Lionetti, Luc Goossens, Guy Bosmans, Wim Van Den Noortgate, Dries Debeer, Anne Sophie Bröhl and Patricia Bijttebier in Assessment
Footnotes
Acknowledgements
We would like to express our gratitude to all the participating early adolescents from the primary and secondary schools in Belgium and the Netherlands as well as their parents and teachers. We would also like to thank “Regionaal Samenwerkingsverband Breda (RSV Breda)” for the collaboration.
Methodological Disclosure
We report how we determined our sample size, all data exclusions, all manipulations, and all measures in the study.
Declaration of Conflicting Interests
The author(s) declared no potential conflicts of interest with respect to the research, authorship, and/or publication of this article.
Funding
The author(s) disclosed receipt of the following financial support for the research, authorship, and/or publication of this article: The Methylation and Internalizing Problem Behaviors in Adolescence: Examining Associations Across Multiple Levels of Analysis (MIND) project received financial support for the research, authorship, and/or publication of this article: This project was supported by a C1-grant (C14/16/040) from the KU Leuven Research Fund. Sofie Weyn is supported by a PhD Fellowship of the Research Foundation – Flanders (FWO Vlaanderen).
Supplemental Material
Supplemental material for this article is available online.
Notes
References
Supplementary Material
Please find the following supplemental material available below.
For Open Access articles published under a Creative Commons License, all supplemental material carries the same license as the article it is associated with.
For non-Open Access articles published, all supplemental material carries a non-exclusive license, and permission requests for re-use of supplemental material or any part of supplemental material shall be sent directly to the copyright owner as specified in the copyright notice associated with the article.