



Abstract
The Washington Assessment of the Risks and Needs of Students (WARNS) is a computer-based assessment created to help courts, schools, and youth service providers determine an adolescent’s risks and needs that may lead to truancy, drop out, or delinquency from school. Users are advised to consider the WARNS total score to work with youth. A total score estimate based on fewer items than the full item set may result in less respondent burden, administration time, and fatigue, while not hindering accurate decisions. This simulation study examined the applicability and efficiency of a computerized adaptive test (CAT) to estimate a WARNS total score under a unidimensional item response theory model. The results demonstrate that the CAT provides an accurate estimate of students’ risks and needs and reduces the number of items administered for each examinee compared with the existing version. Future directions and limitations of CAT development with the WARNS are discussed.
Prevention science addresses problems that individuals experience due to maladaptive behaviors (e.g., substance use, suicide, and delinquency) before the behaviors occur. This is typically accomplished by employing psychology principles (De Matos et al., 2019) to inform the systems (e.g., schools, organizations) in which an individual is engaged. As these maladaptive behaviors can result in severe tragedies for youth, early intervention is suggested (De Matos et al., 2019). To aid early intervention, the potential risk of maladaptive behaviors and social and emotional needs should be assessed. Many assessments exist for this purpose, including the (a) Beck Scale for Suicide Ideation (Beck et al., 1979), (b) Youth Level of Service/Case Management Inventory (Hoge & Andrews, 2002), (c) Washington Assessment of the Risks and Needs of Students (WARNS; George et al., 2015), and (d) Problem-Oriented Screening Instrument for Teenagers (POSIT; Rahdert, 1991), to name a few. Existing measures require individuals to respond to many items, requiring much time for the youth to complete the assessment. Shorter assessments may be preferred in settings such as schools, as time and personnel resources are limited. Computerized adaptive testing (CAT) can assist in creating shorter versions of assessments without sacrificing the accuracy of information (De Beurs et al., 2014; Flens et al., 2016; Hol et al., 2008).
CAT has been applied to several measures developed for assessing maladaptive behaviors (e.g., Butler et al., 2017; De Beurs et al., 2014; Latimer et al., 2014; Thimm, 2020), and with rating scales commonly used in personality assessments (Hol et al., 2005; Magis et al., 2017). The primary purpose of applying CAT to such measures has been to reduce the number of administered items to save administration time and decrease the respondent burden, without hindering accuracy of the measured trait, as well as improving standard error of estimate (SEE) for ability levels on both sides of the ability continuum where high SEE is seen under a traditional fixed-length test.
Applicability and efficiency of CAT can differ depending on the assessment (e.g., the characteristics of item pool) and participants (e.g., ability distribution). The same stopping rule for terminating the CAT for an individual for different assessments (e.g., anxiety, depression, motivation, panic disorder) does not result in the same average item reduction or correlations between CAT and full assessment scores (e.g., Gibbons et al., 2012; Hol et al., 2007; Sunderland et al., 2017; Walter et al., 2007). However, in a live CAT environment, it is impractical to continually adjust stopping rules to determine which performs best. Thus, simulation provides an opportunity to examine the effectiveness of different stopping rules for CAT administrations (Magis et al., 2017).
The WARNS is a self-report instrument used to assess student risks and needs linked to truancy, delinquency, and dropping out of school. Six subdomains assessed include the following: Aggression–Defiance, Depression–Anxiety, Substance Abuse, Peer Deviance, School Engagement, and Family Environment. The WARNS was developed in Washington State in response to court administrators’ need for information to guide decision making about youth who had been served with a court petition (George et al., 2015). The development of the WARNS was related to legislation known as the Becca bill. The bill was formed in response to Rebecca Hedman’s parent’s discovery of a lack of resources from the school system, court system, and community to assist their daughter, who was truant due to drug and prostitution problems, and eventually was murdered. The WARNS was intended to assist the truancy process and serve to facilitate conversations with the student and the education and court systems to aid support services and reduce negative outcomes. This context of use is shifting, given changes to policy in Washington, where assessments such as the WARNS are to be used at an earlier time in student development. Moreover, use of the WARNS is occurring beyond Washington, pushing its use beyond the boundaries of original intended uses (Gotch & French, 2020).
In the WARNS computer-based version, the risks and needs scores are automatically calculated by each subdomain and a general risks and needs domain (George et al., 2015). Users are advised to consider the WARNS total score with other information, as reliability is higher for the total score compared with the subdomain scores (Strand et al., 2019). Moreover, classification of risk is based on the total score. The subdomain scores may be used to understand the reasons for the total risks and needs scores in conversations with the student. For students who are not at risk, there is no need to examine subdomain scores for a deeper understanding of issues, as these students most likely have low scores across all six subdomains and typically are categorized into a low-risk profile (Iverson et al., 2018). Therefore, determining whether a youth has a low-risk score based on the total score may save time and decrease the respondent burden and save school resources. Thus, a CAT may quickly screen if a student has a risk level that deserves completion of the full WARNS for a complete understanding of the student’s risks and needs.
Present Study
Although other risk assessments exist, we focus on the WARNS because it (a) is perhaps the most comprehensive in terms of covering the domains most associated with negative outcomes for youth, (b) provides in-depth information across several domains, (c) has a well-articulated theoretical framework, and (d) has a comprehensive validity argument supported by claims and evidence compared with other existing measures (Gotch & French, 2020). Creating an operational CAT to examine if a CAT is applicable and efficient for a test under different conditions might be impractical, as real data do not support the manipulation of study conditions (Feinberg & Rubright, 2016), such as a stopping rule. Therefore, CAT simulations can assess the efficiency of different conditions to inform operation (e.g., Butler et al., 2017; Flens et al., 2016; Hol et al., 2008; McClarty, 2006; Waller & Reise, 1989).
The purpose of this simulation study was to investigate if the WARNS total scores could be estimated with fewer items using a CAT environment, compared with the current computer-based WARNS, without degrading score accuracy. This simulation study can (a) help determine the parameters (e.g., stopping rules) in a WARNS CAT that leads to optimal performance and (b) continue to inform the CAT personality literature of the appropriateness of CAT in another behavioral domain. Therefore, we performed a CAT simulation with a stopping rule criterion based on the commonly used SEEs. We also examined the most appropriate stopping rule for the study purpose—the best reduction rate without degrading score accuracy.
Method
Measure
The WARNS comprises 40 items, five to nine items for subdomains, responded to on a 4-point rating scale (0 = never or hardly ever, 1 = sometimes, 2 = often, and 3 = always or almost always). Once students complete the assessment, scores are used by the school personnel, student service providers, or court system to inform conversations about the risks and needs of the student and a course of action for the student. The WARNS has support for its bifactor structure (Strand et al., 2019), item and test-level invariance across groups (Alpizar et al., 2020; French & Vo, 2020), and reliability of scores (Gotch & French, 2020), with a focus on the general score for decisions.
Unidimensionality
To support CAT use in estimating a WARNS total score, evidence of essential unidimensionality is required. A sufficient unidimensional structure can be supported for a bifactor model when common pattern coefficients are greater than 0.3 (McDonald, 1999), as with WARNS (Strand et al., 2019). We inspected the scree plot from an exploratory factor analysis, which supported a dominant first factor, with a second factor accounting for less than 10% of variance. In addition, omega (.98) and omegahierarchical (.83) estimates suggested that 83% of the variance of unit-weighted total scores can be attributed to the individual differences on a general factor, and there is a strong correlation (.91) between the general factor and the observed total score (Rodriguez et al., 2016). This indicates that about 15% of the reliable variance in total scores can be due to the multidimensionality related to the specific factors, and only about 2% of this variance is attributable to random error. Thus, recognizing few tests are truly unidimensional (Nandakumar, 1991), our evidence supports the essential unidimensionality assumption in item response theory (IRT; e.g., Stout, 1990) and that the minor dimensions outside the primary dimension of risks and needs likely have negligible consequences on parameter estimates (e.g., Anderson et al., 2017). As the WARNS is used in practice with a total score, it is reasonable to interpret the scores as an essentially unidimensional reflection of student risks and needs, even in the presence of multidimensionality as indicated by the minor specific factors.
Procedure
CAT Simulation
A one-factor simulation study with eight SEE stopping rules (0.2, 0.3, 0.4, 0.5, 0.6, 0.7, 0.8, and no stopping) was conducted in catR (Magis & Raîche, 2012). The no stopping rule condition was applied to compare the WARNS CAT with the WARNS used in practice (i.e., all WARNS items administered). The catR package requires item and person parameters to conduct the CAT simulations. To obtain these parameters, the best-fitting IRT model was determined by examining model-data fit statistics in IRTPRO Version 4.2. (Cai et al., 2011) using live student data based on the most commonly used polytomous IRT models, including (a) the graded response model (GRM; Samejima, 1969), (b) the generalized partial credit model (Muraki, 1992), (c) the rating scale model (Andrich, 1978), and (d) the partial credit model (Masters, 1982). The live data consisted of 4,081 (female = 46.2%) high school students ages 13 to 18 years in the State of Washington. Students completed the WARNS as a part of the school counseling service. Data were stored anonymously to protect student information. The student response data were used to estimate item and person parameters to inform the simulation study.
To prevent bias caused by using the same sample both in estimating item parameters and in CAT simulations, the sample was randomly divided into two halves, consisting of 1,000 and 3,081 participants. Item parameters were estimated using the responses of 1,000 participants. Based on the estimated item parameters, thetas for remaining sample were estimated to be used in simulations. The thetas were normally distributed (i.e., M = −0.03, SD = 1.01; skewness = −0.280, kurtosis = 0.303). Thus, 3,081 true theta values and their real responses to WARNS items were assigned to simulees. Several decisions were made to apply the CAT simulation procedures, including (a) a starting point, (b) methods for selecting the next items, (c) estimating simulees’ theta levels (θ), and (d) stopping criteria. The catR package (Magis & Raîche, 2012) was used for all these steps since the recent Version (3.16) allows researchers to conduct CAT simulations with the given IRT models (Magis & Barrada, 2017).
The most informative item at the mean of the ability continuum (0) was selected as an initial item for all simulees in all conditions. After each item administration, simulees’ theta levels were estimated based on the most current response patterns using the expected a posteriori (EAP) estimation method (Bock & Mislevy, 1982). As EAP is efficient to compute scores for polytomous IRT models, does not need iteration, and can estimate trait levels even with initial responses to highest or lowest response categories (Embretson & Reise, 2013; Linden & Glas, 2007), it was chosen to estimate theta values. In selecting the next most informative items for the current theta estimates, maximum Fisher information (MFI) was used, which is widely used in CATs with polytomous items (e.g., De Beurs et al., 2014; Walter & Holling, 2008). Each item was chosen from any subdomain as long as it was not previously administered to the same simulee, and it was the most informative item in the currently estimated θ level. Any trait estimator and item selection criteria can be used together for a given item pool, but one of the most commonly used combinations is the EAP estimator with the MFI item selection method (e.g., Bulut & Kan, 2012; Lian et al., 2020; Tan et al., 2018). MFI is the only method currently available in catR for polytomous IRT models (Magis & Raîche, 2012). The item selection and ability estimation procedures continued until termination criteria were met or all WARNS items were administered. A fixed-length stopping rule was not considered, given it would not meet the purpose of the study. After item administration terminated, for each simulee, a final theta level was estimated using the EAP method.
Outcome Measures
Precision
The WARNS CAT precision was assessed for each condition based on marginal reliability (MR; Equation 1) calculated using the mean SEE. The conditions with MR over .80 were considered sufficient for CAT use (e.g., Butler et al., 2017). While

Efficiency
To assess which stopping rule was more efficient for WARNS CAT, (a) the average number of administered items, (b) the differences in the number of administered items across the theta levels, and (c) the proportion of simulees that satisfied the stopping criteria were examined for each simulation condition. Stopping conditions with fewer items administered on average, especially for the lower risks and needs groups, and higher stopping criteria satisfaction proportion were considered more efficient.
Accuracy
In the investigation of how accurately the WARNS CAT estimated simulees’ theta levels, Pearson’s correlation coefficient was calculated between theta estimates of WARNS CAT simulations and raw scores used in practice. A correlation over .85 can be considered sufficient for CAT use (e.g., Butler et al., 2017). Also, the correlation between true thetas and estimated thetas from each simulation condition was examined to support the accuracy of WARNS CAT true theta estimation. To investigate the accuracy of the estimated thetas from the WARNS CAT simulations, bias and root mean of square error (RMSE) were examined for true thetas versus estimated thetas from CAT simulations for each condition, separately. As bias and RMSE values get closer to zero, score accuracy increases. While true thetas were symbolized


For a final decision of which simulation condition performed best, precision, efficiency, and accuracy of each condition were considered in combination based on the given criteria.
Results
The GRM (Samejima, 1969) was the best fitting IRT model for the live data based on the statistics of −2 log likelihood, Akaike’s information criterion (Akaike, 1974), and Schwarz’s Bayesian information criterion (Schwarz, 1978; Table 1). Thus, item parameters (Table 2) and person parameters (thetas) were estimated based on the best fitting IRT model (i.e., GRM).
Model-Data Fit Statistics for the WARNS Data Set.

Note. Values in boldface indicates preferred model. GRM = graded response model (Samejima, 1969); GPCM = generalized partial credit model (Muraki, 1992); PCM = partial credit model (Masters, 1982); and RSM = rating scale model (Andrich, 1978); WARNS = Washington Assessment of the Risks and Needs of Students; −2LL = log likelihood.
Item Parameters for the WARNS Based on the Graded Response Model.
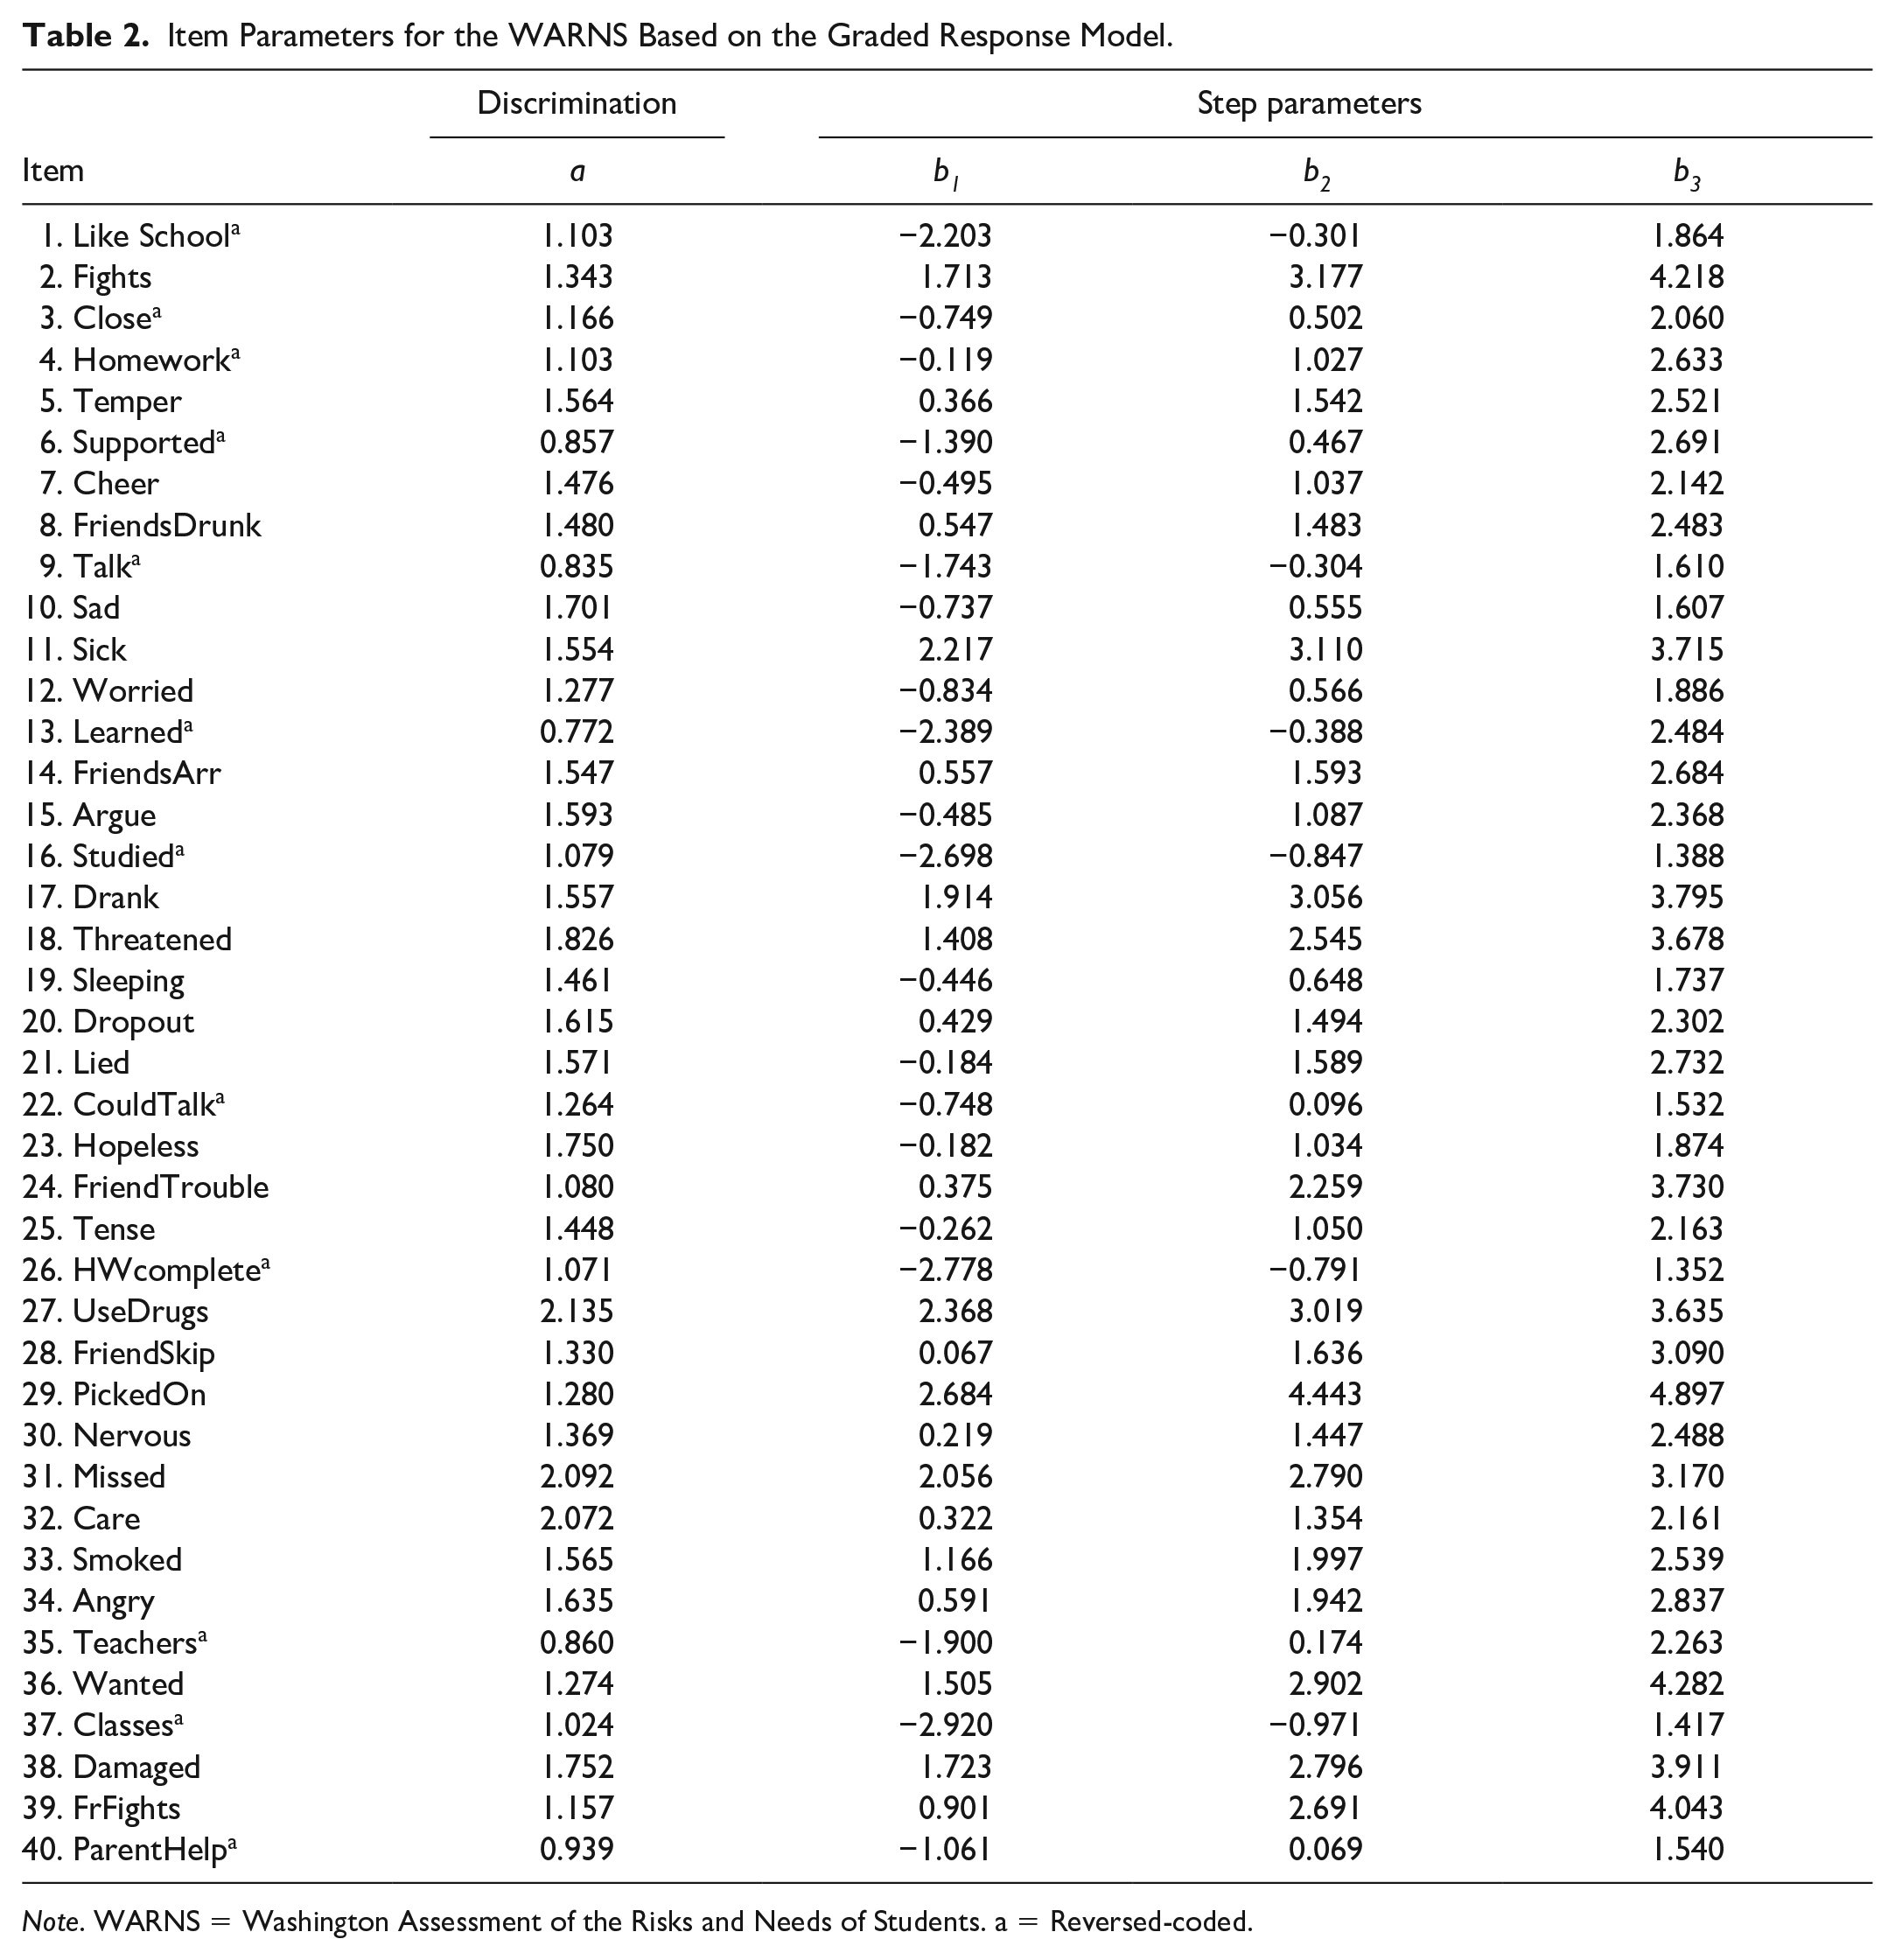
Note. WARNS = Washington Assessment of the Risks and Needs of Students. a = Reversed-coded.
Precision
The stopping conditions of 0.2, 0.3, and 0.4 had acceptable MRs, with .93, .91, and .85, respectively. MR for the no stopping condition, corresponding to the current computer-based WARNS, was also .93. All other stopping conditions had low MRs compared to our criterion (i.e., > .80). Mean SEEs were 0.26, 0.31, and 0.39 for the 0.2, 0.3, and 0.4 stopping conditions, respectively, and the no stopping condition had the same mean SEE with the 0.2 stopping condition. See Table 3 for details about precision results.
Precision: Marginal Reliability (MR) and Mean Standard Error of Estimate (SEE) of Each Stopping Condition.

Efficiency
The average number of administered items was 10, 21, and 40 for the stopping conditions of 0.4, 0.3, and 0.2, respectively, whereas it was 5, 3, 2, and 2 for the stopping conditions of 0.5, 0.6, 0.7, and 0.8, respectively. The CAT simulations required a different number of items to estimate a WARNS total score for the simulees at the different locations of the risks and needs scale for each condition. As the risks and needs levels of the simulees decreased on the scale, more items were needed to estimate total WARNS scores. For most of the simulees with relatively lower risks and needs levels compared with the mean point of the scale, around 14 items were administered on average in the stopping condition of 0.4. However, this average rapidly increased for stopping conditions of 0.3 and 0.2 with roughly 30 and 40 items administered, as seen in Figure 1. The stopping rule satisfaction proportion was 100%, 95.72%, and 82.83%, for stopping conditions of 0.5, 0.4 and 0.3, respectively. However, this proportion rapidly decreased to 1.14% for the stopping condition of 0.2. For stopping conditions of 0.6, 0.7, and 0.8, all simulees satisfied the stopping rule, so item administration ceased before all items were administered for these conditions. See Table 4 for details.
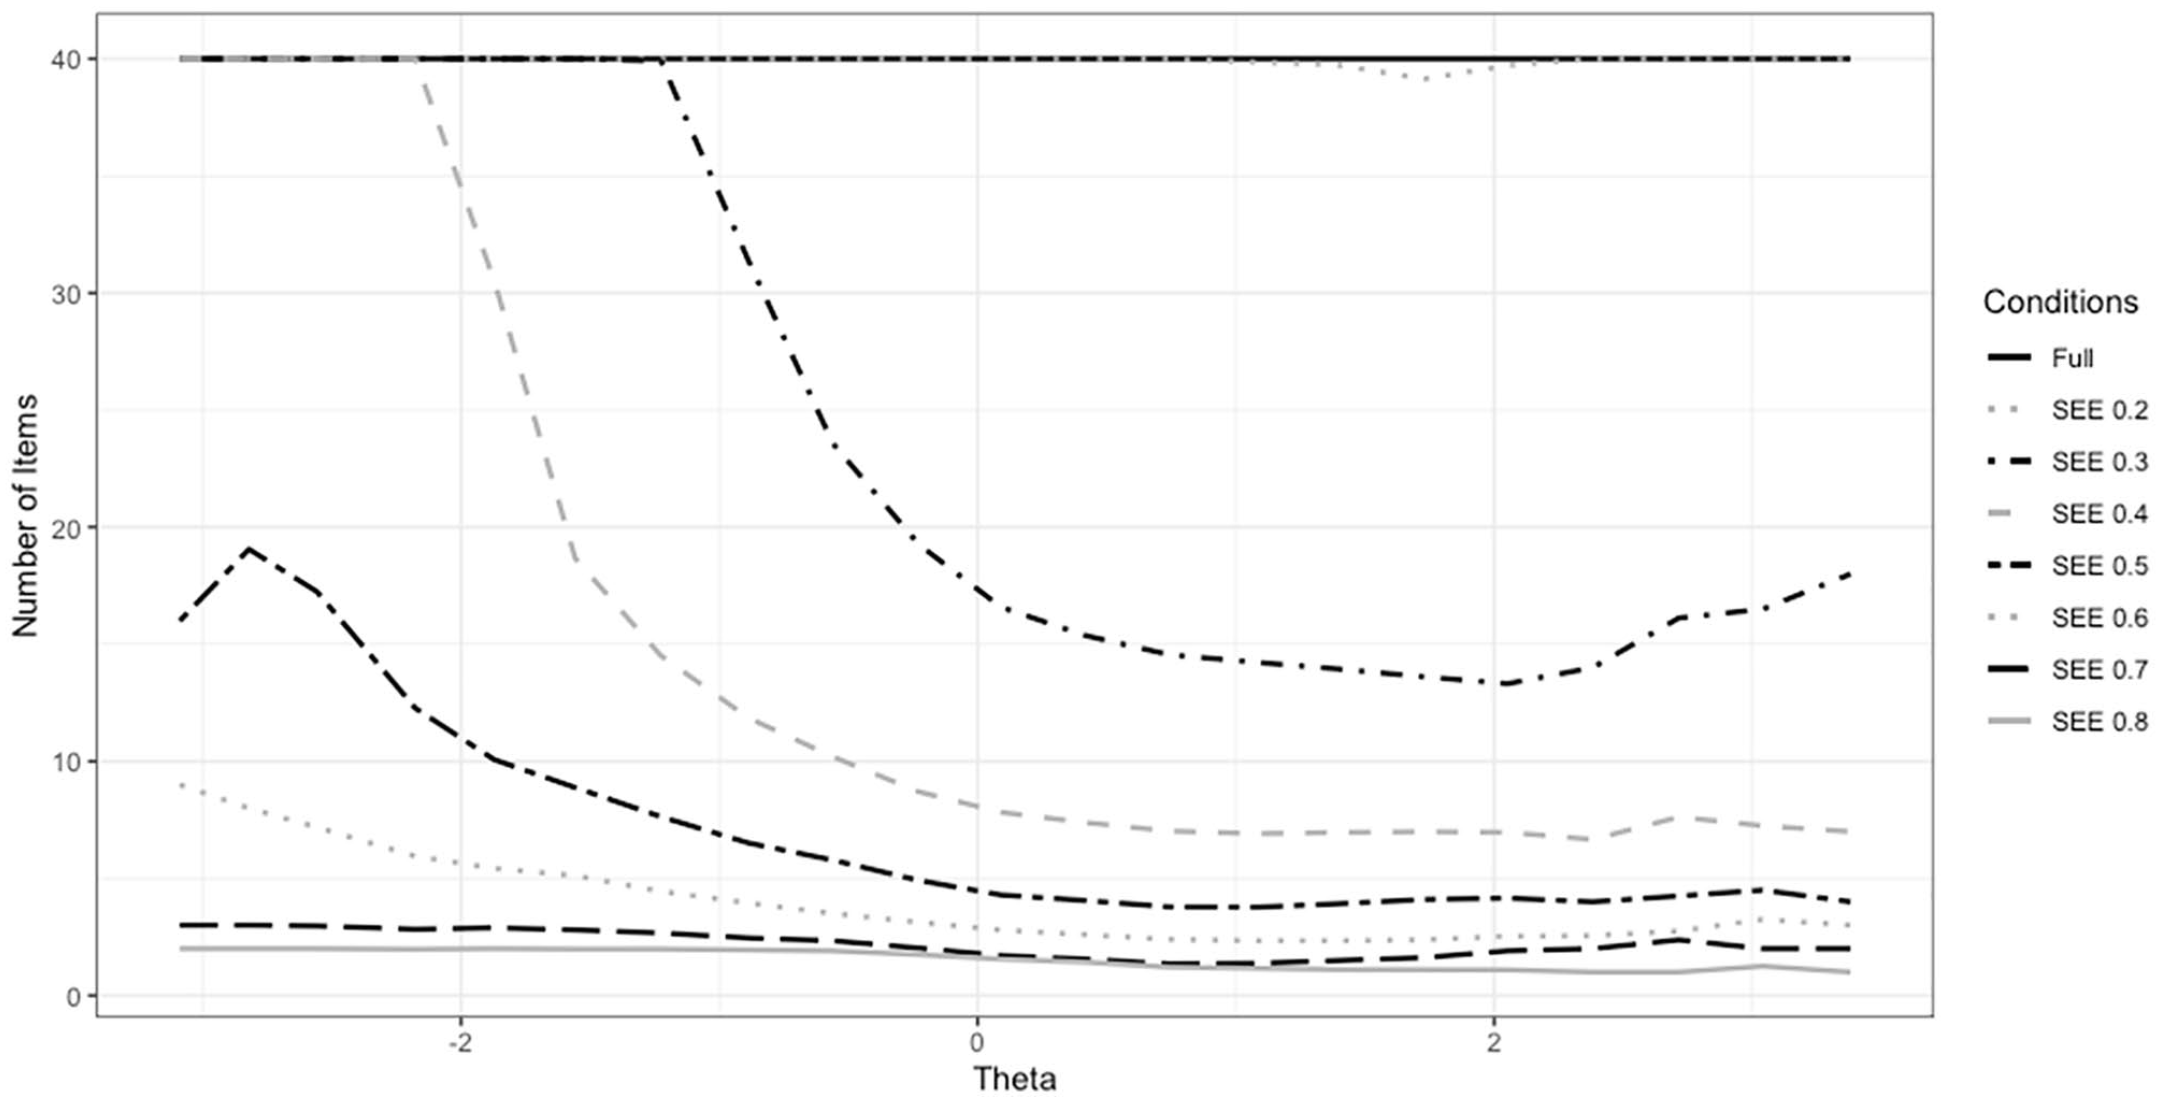
Differences in the number of administered items across theta levels for each simulation condition.
Efficiency: Mean Number of Administered Items (MNAI) and Stopping Rule Satisfaction Proportion (SRSP) for Each Stopping Condition.

Note. SEE = standard error of estimate.
Accuracy
The correlations between theta estimates of WARNS CAT and raw scores were >.85 for the stopping conditions of 0.2, 0.3, and 0.4. The correlations between true thetas and estimated thetas were also >.85 for the same conditions with an addition, condition of 0.5. Other stopping conditions could not satisfy the desired correlation criteria, being <.85. Bias was close to zero for each condition, and RMSE kept increasing from .01 to .68 for stopping condition 0.2 to 0.8. Tables 5 provides full results for accuracy.
Accuracy: Correlation, Biases, and Root Mean Square Error (RMSE) for WARNS CAT Stopping Conditions.
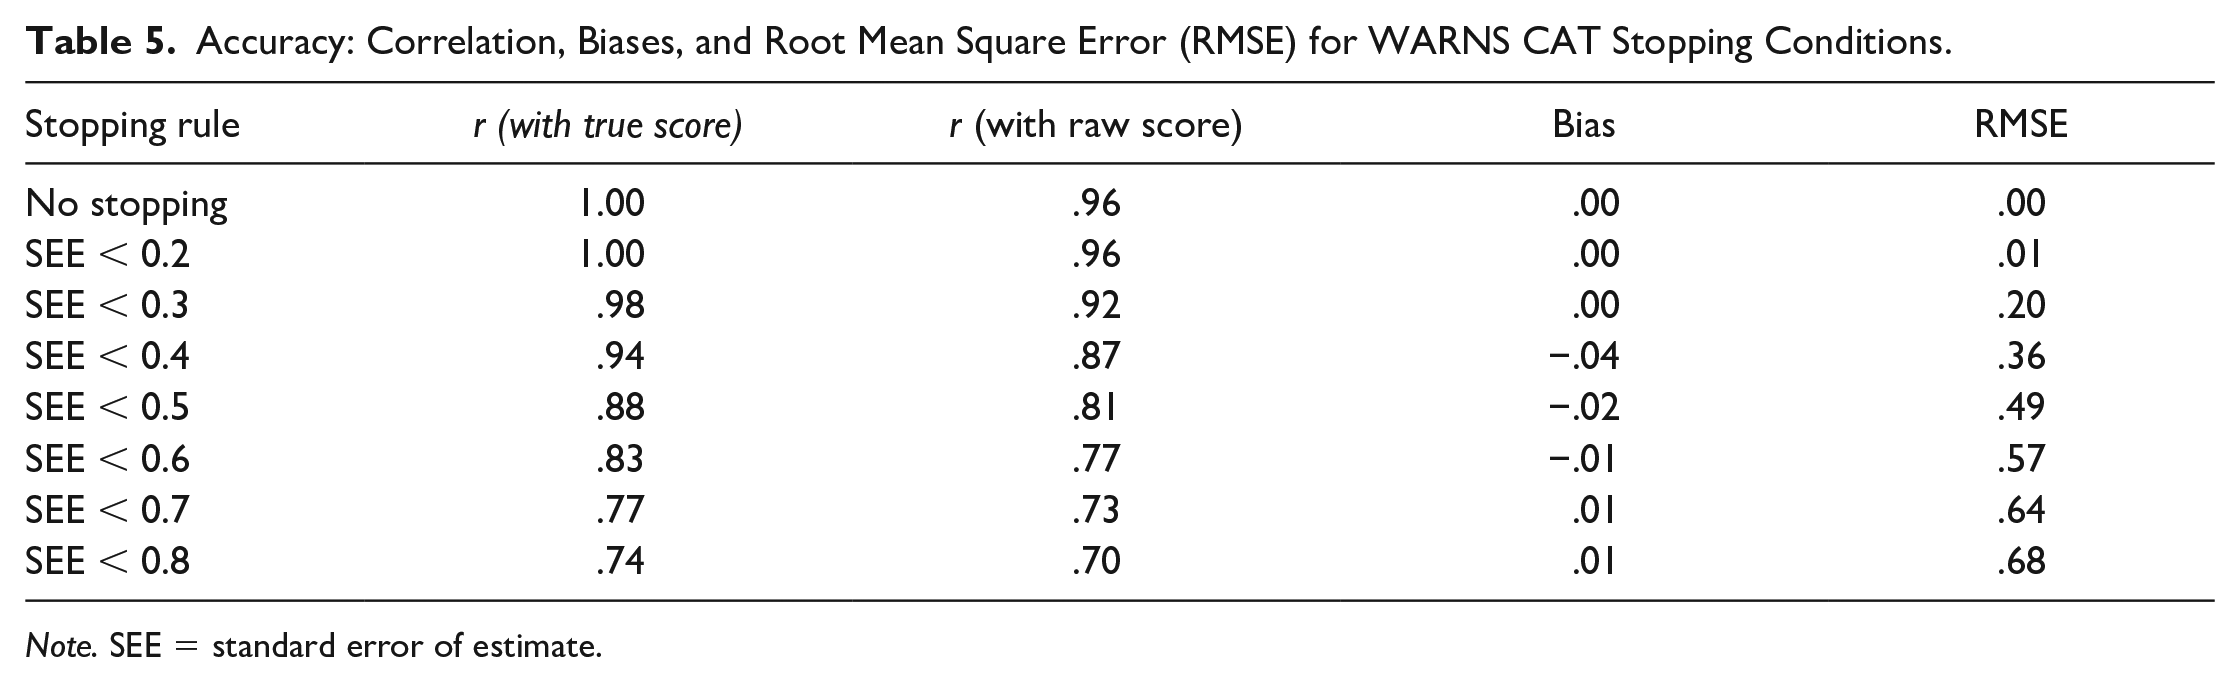
Note. SEE = standard error of estimate.
Discussion
The purpose of this study was to examine the applicability and efficiency of a CAT on estimating students’ WARNS total risks and needs scores with fewer items without degrading score accuracy. The WARNS CAT was simulated using the item parameters estimated from 1,000 live student responses based on the GRM (Samejima, 1969). Eight stopping conditions were investigated to determine which CAT simulation condition performed well compared with the current computer-based WARNS, using 3,081 live student responses. The WARNS CAT simulation results suggested the best performing stopping conditions of 0.3 and 0.4 based on the aggregation of MRs, the number of administered items, stopping rule satisfaction proportion, the correlation between raw scores and estimates from each simulation condition, bias, and RMSE.
The differences in the number of administered items across the ability scale for simulees were related to the total information and standard error curves of the WARNS across the scale, as seen in Figure 2. As the WARNS CAT provided more information at the higher risks and needs levels of the scale with smaller error, generally fewer items were administered for the simulees at this end of the ability continuum compared with the lower risks and needs levels. Using more items for simulees at the lower risk levels of the scale increased the mean number of administered items. More items are required for the lower risk and need score estimates to decrease the number of item administration on average, which can enhance the reliability (Flens et al., 2016).
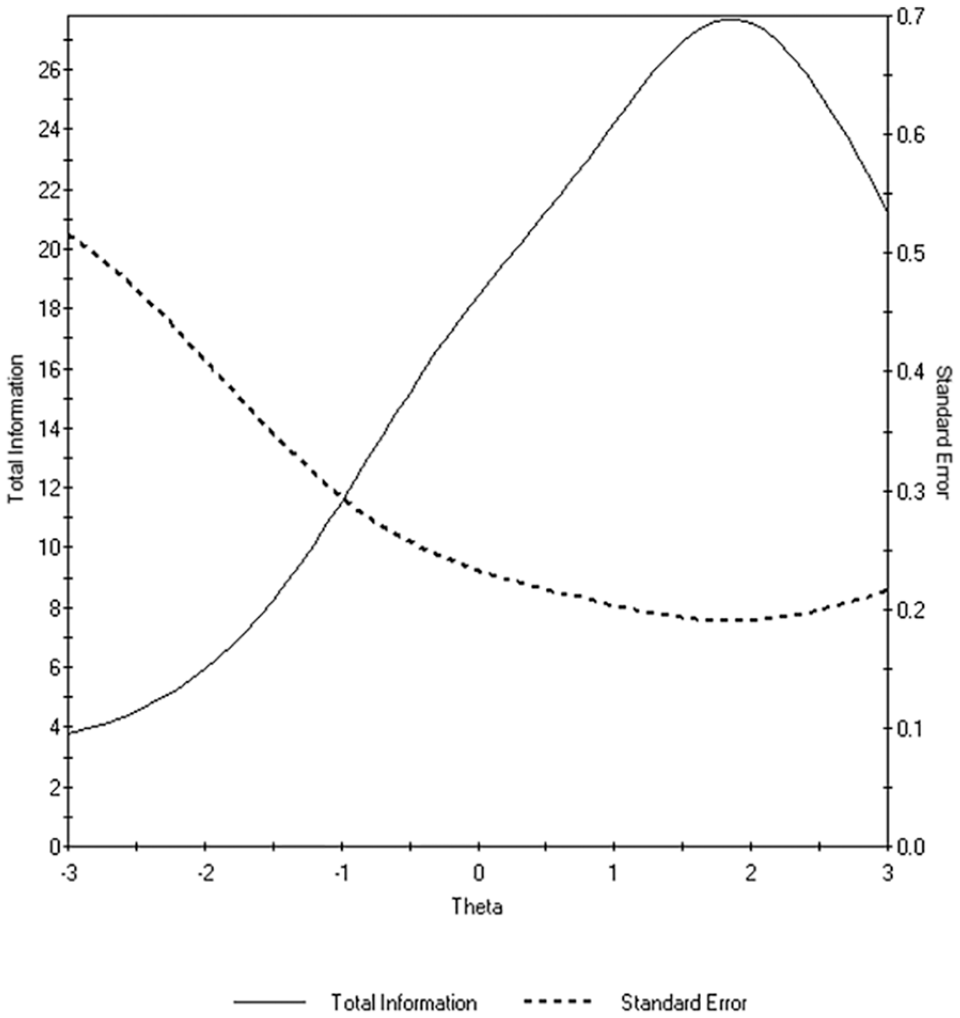
Total test information and standard error curves of the WARNS items.
Although most CAT simulation studies did not report the differences in the number of items used across the scale, we thought that reporting these differences would be necessary to determine the best performing stopping condition. Determining a student who is not at risk with fewer items was more important than determining a student at risk, as the WARNS system suggests users administer all items for at-risk students to calculate subdomain scores for better understanding of the risks and needs, if risk is elevated. Based on this consideration, the stopping condition of 0.4 performed better than the stopping condition 0.3, by estimating total risks and needs scores with fewer items for simulees at low levels of risks and needs, with little loss of measurement precision. The WARNS item pool was effectively used for the condition of 0.4, using all the WARNS items for different simulees.
Sireci et al. (1991) stated that MR based on IRT was comparable to the internal consistency reliability based on classical test theory (CTT). The MR of the current WARNS was .93 based on no stopping rule in the CAT simulation, which is in accord with the CTT-based internal consistency reliability estimate of the WARNS (.93) for the general factor. This consistency between both indices is evidence for the applicability of the WARNS CAT simulations. As MR calculations are based on averaging unequal variances of measurement error, some information is lost with these calculations (Sireci et al., 1991). Nevertheless, consistency between IRT and CTT based reliability indices for the WARNS supported the use of MR indices for examining the consistency of the WARNS CAT simulations.
To determine whether the WARNS CAT scores are accurate for use in practice, we must ensure that the scores obtained from the WARNS CAT are comparable with the scores used currently. This is one of the most important indicators of applicability of the WARNS CAT in practice. A high correlation (i.e., >.85) between raw scores and estimated WARNS CAT scores was a substantial indicator of score accuracy. For the stopping condition of 0.4, the correlation between raw scores and estimated scores was .87, which meets the criterion for score accuracy (e.g., Butler et al., 2017).
A practical implication of this work is that it does allow for a cut score to be suggested. In doing so, the existing WARNS cut score was treated as expected observed score by tracing the test characteristic curve. In doing so, we arrived at an approximate cut score of a theta estimate equal to −0.5. This places about 40% of the sample into a category of low risks and needs. This suggested cut score is in accord with profiles that have been advocated for the WARNS (Iverson et al., 2018), where approximately 40% of students were identified as being in the low-risk profile. The caution with this suggested cut score is that for full implementation additional validity evidence is required. A main limitation of advocating for this cut score is that the original cut score was developed based on the criterion variables of arrests and suspensions (George et al., 2015), whereas score use currently is more in line with truant behaviors. Thus, the use of the suggested cut score may result in a high rate of false positives until additional data can be gathered and adjustments considered (e.g., Beuk, 1984). This seems low risk, given it will likely result in more conversations with students about what is happening in their lives and maybe help to build more connections to the school systems for some students.
There were some limitations to this study. The first limitation was the sample used for calibration, which was limited to Washington and to students who, in general, were identified as needing to complete this assessment for an undisclosed reason (e.g., truant, general school screening, referred for services). A more heterogeneous sample is suggested to further investigate the comparability to the current WARNS. This limitation resulted in the inability to generalize the results to a national audience. Second, the WARNS cut score used to derive the CAT based cut score proposed here was based on a sample of referred youth and derived based sensitivity and specificity values for the outcomes of arrests and suspensions of that sample. The sample used in this study is different from that original sample, where students in this sample completed the WARNS for a variety of reasons, including general screening for risks and needs, and for some associated with truant behavior. We do not have access to truancy levels, or other outcomes variables, for this sample. Thus, additional research is needed to confirm the proposed cut score and its accuracy before full implementation. Third and a final limitation of the study was that content balance was not a component of item selection. Content balance warrants administering items from each subdomain for tests with a multidimensional structure. As (a) essential unidimensionality was supported, (b) the number of items in each subdomain was limited, and (c) item exposure was not a concern for the WARNS, we did not integrate content balance into the CAT simulation. However, exclusion of content balance may favor subdomains with more informative items (i.e., high discrimination parameters). This can have a negative influence on measurement accuracy (e.g., Zheng et al., 2013). As the WARNS items’ discrimination values are similar across subdomains, accuracy may not be degraded. However, research should examine accuracy differences between the presence and absence of content balanced CAT WARNS scores.
These results can make important contributions to the CAT personality literature and, more important, the practice of the WARNS assessment system. This study was critical in continuing to demonstrate that personality assessments with many items could be implemented with fewer items with the use of a CAT. It continues to build evidence that CAT can work well with personality measures. With less administration time and less burden for both students and test users, the WARNS CAT may provide a quick screening assessment for schools and districts. Besides, this study demonstrated that a CAT could be used in a CTT-derived personality test (e.g., Butler et al., 2017), yielding equal reliability and precision compared with conventional test models. Also, results indicated that the WARNS CAT could provide a 75% reduction in items for estimating total scores based on general risks and needs factor with minimal loss of measurement precision. Another strength of the WARNS CAT was that all WARNS items for simulees in different locations on the ability scale were used, showing that all WARNS items were useful in estimating the WARNS total scores.
Future work is needed to overcome some limitations of this study and provide supporting evidence for developing a WARNS CAT to use in practice. First, the WARNS CAT should be inspected for items functioning differently for different groups, as French and Vo (2019) found that six WARNS items functioned differently across groups. It was stated that the amount and magnitude of these items were probably not enough to change the decisions made using total scores calculated based on CTT (French & Vo, 2019). Nevertheless, this might cause inappropriate item selections for individuals in the administration of the WARNS CAT. Second, it is recommended to create more items for the WARNS item pool. The availability of additional items at the lower risk score levels may provide more information for the individuals who are not at-risk. Thus, a better reduction for the WARNS CAT can be obtained with higher measurement precision for the same stopping condition. Third, the mean point of 0.3 and 0.4 SEEs (i.e., 0.35) can be investigated as a stopping rule to indicate better psychometric quality and reduction than the condition 0.4 for simulees who are not at-risk. The 0.35 SEE as a stopping rule in practice for a live WARNS CAT may be best. Fourth and finally, cut scores need to be determined based on the current intended use of the WARNS, including general screening for risks and needs, and for some associated with truant behavior.
In conclusion, practical youth risks and needs assessment can aid early intervention with high school students. An assessment format that is least burdensome for the student and counselor will encourage use. Results support a WARNS CAT version to reduce assessment time without degrading measurement precision. More broadly, results support that CAT can be useful beyond achievement testing and adds to the personality assessment literature.
Footnotes
Declaration of Conflicting Interest
The author(s) declared no potential conflicts of interest with respect to the research, authorship, and/or publication of this article.
Funding
The author(s) received no financial support for the research, authorship, and/or publication of this article.
