



Abstract
Current methods to assess human anxiety often ignore that anxiety is a dynamic process and have limitations such as high recall bias and low generalizability to real life. Smartphone apps using ecological momentary assessment (EMA) may overcome such limitations. We developed a smartphone app for the longitudinal evaluation of anxiety symptoms using EMA. We assessed the feasibility (retention and compliance) and psychometric properties (reliability and validity) of the app over 6 months in a sample of 99 participants with different levels of anxiety. The EMA-based smartphone app was highly feasible. It showed excellent within-person and between-person reliability, high convergent and moderate discriminant validity, and significant incremental validity. Assessing anxiety longitudinally using a smartphone and following EMA principles is feasible and can be reliable and valid. Studies combining EMA-based anxiety longitudinal assessments with other assessment methods deserve further research and may offer novel insights into human anxiety.
What is the best way to assess anxiety in humans? When clinicians or researchers assess anxiety, they often rely on global self-report instruments (e.g., questionnaires, diagnostic interviews), administered on a single occasion in an “unnatural” context (e.g., a hospital), and inquiring about a past period ranging from days to lifetime. From a conceptual perspective, this approach ignores that anxiety, like most other emotions, is dynamic, that is, it changes over time and across contexts (Cohen et al., 2020; Scherer, 2009; Trull et al., 2015). This approach also suffers from low ecological validity (generalizability to “real life”) and potential high recall bias from a methodological perspective. The use of ecological momentary assessment (EMA) may at least partially overcome these limitations.
EMA encompasses a range of methods that involve repeated sampling of individuals’ behaviors and experiences in natural environments, maximizing ecological validity, minimizing recall bias, and without increasing reactivity, that is, changes in behaviors/experiences as a result of reporting (Shiffman et al., 2008). EMA methods have been widely used in psychopathology research, including anxiety. In recent years, the implementation of EMA using smartphones (in comparison with traditional pen-and-paper approaches) has highly increased its scalability (Gillan & Rutledge, 2021; Trull & Ebner-Priemer, 2020). There seems to be an enormous potential to dramatically increase our understanding of pathological anxiety (i.e., anxiety disorders) by combining or complementing smartphone EMA-based methods with in-person work (Gillan & Rutledge, 2021; Treadway & Leonard, 2016). These novel approaches are essential because anxiety disorders are the most common group of mental disorders and are associated with vast individual and societal costs (Craske et al., 2017; Kessler et al., 2010).
Here, we present a smartphone app for the longitudinal assessment of anxiety using EMA. We tried to address three gaps or limitations from previous research. First, although some past studies have used EMA to assess anxiety (Walz et al., 2014), most were conducted in clinical samples. Moreover, very few collected data for prolonged lengths of time sufficient enough to provide information on dynamic processes. Second, although many smartphone apps to assess (or treat) anxiety exist, their content is rarely based on current theoretical knowledge (Sucala et al., 2017). Third, the psychometric properties (e.g., the reliability or validity) of EMA-based instruments (including those assessing anxiety) are rarely investigated (e.g., Cohen et al., 2020; Dubad et al., 2018; Shrout & Lane, 2012).
The goals of the current study are (a) to describe the development and characteristics of an EMA-based smartphone app for the longitudinal assessment of anxiety, based on current theoretical perspectives; (b) to assess the feasibility (retention rates and compliance) of the app over 6 months, one of the longest published EMA assessment periods so far; and (c) to assess the psychometric properties (reliability, convergent and divergent validity, and incremental validity) of the app.
Our original goal was to develop a measure of anxiety that reflected transient reactions related to specific moments (i.e., state anxiety). However, the long duration of our study also allowed us to assess individual differences related to the tendency to present stable state anxiety (i.e., trait anxiety). Although the differences between states and traits at the conceptual level may seem obvious, overall their differential assessment using self-report questionnaires has proven difficult (Edmondson et al., 2013). In recent years, EMA collection methods have been combined with sophisticated analytical techniques to assess traits using EMA data (Edmondson et al., 2013; Halvorson et al., 2021; Merz & Roesch, 2011). Therefore, we also examined whether our app could measure trait anxiety and the minimal time intervals required to do so reliably/validly.
Method
We followed the recently proposed reporting guidelines for ambulatory assessment in psychopathology research (Trull & Ebner-Priemer, 2020).
App Development
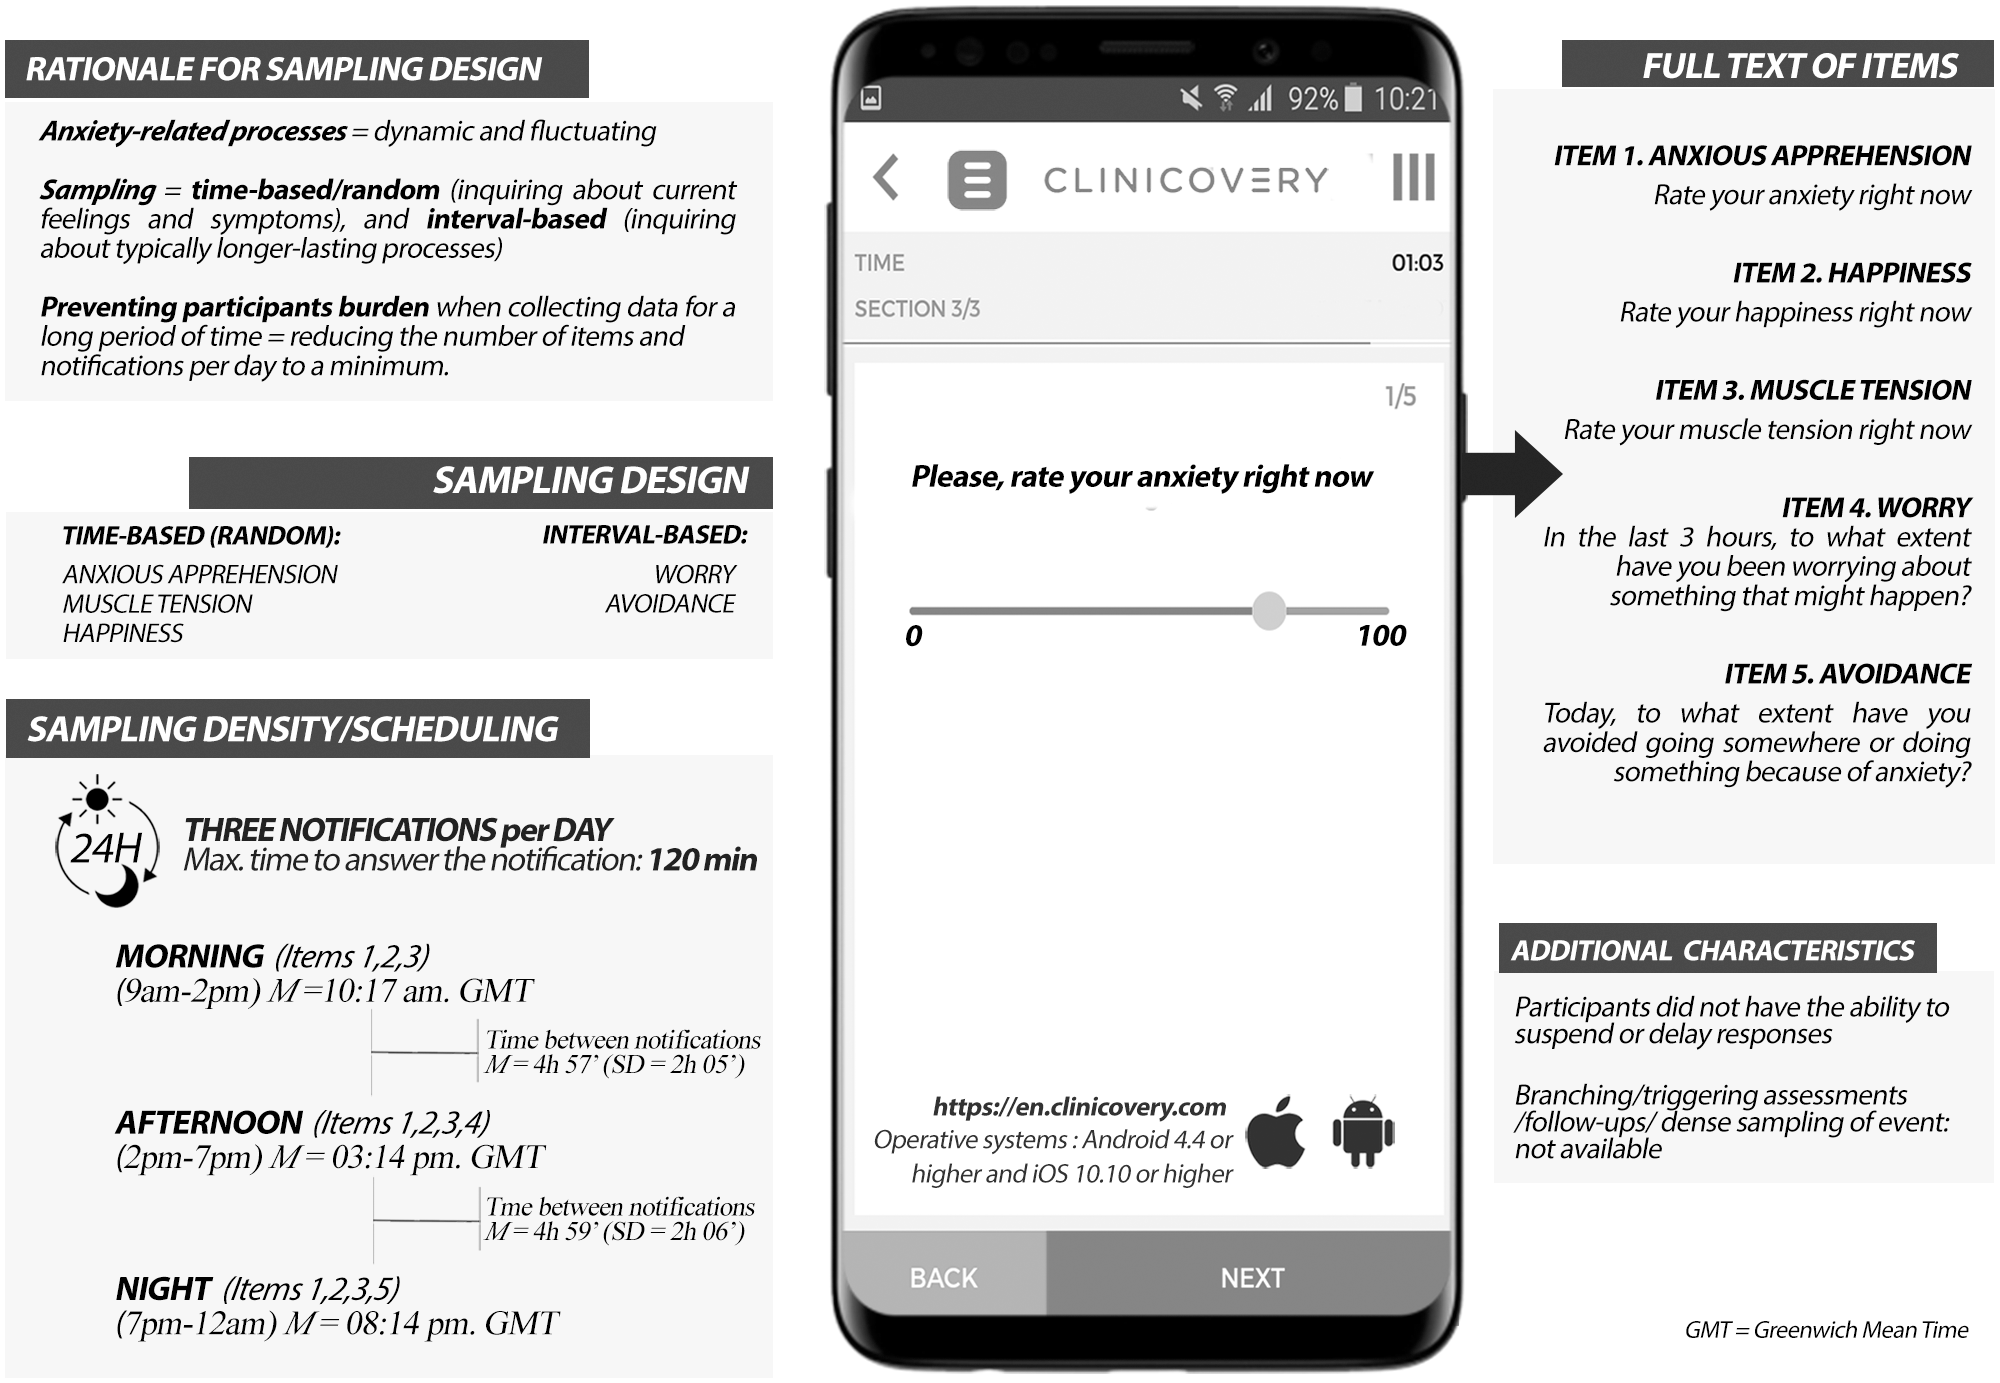
We developed an EMA-based smartphone app to assess anxiety using commercially available clinical data management software (en.clinicovery.com). The app sent the notifications to participants (see Figure 1 and “EMA Assessment” section) and collected and saved their responses using a secure web system.
Summary of App Characteristics.
We followed the definition of anxiety as a multifaceted construct that refers to “a suite of anticipatory affective, cognitive and behavioral changes in response to uncertainty about a potential future threat” (Grupe & Nitschke, 2013, p. 488). We evaluated anxiety using four separate items that assessed four typical anxiety-related symptoms or processes: anxious apprehension, muscle tension, worry, and avoidance. These tap directly into distinct components of human anxiety (cognitive, physiological, behavioral; Craske et al., 2009; Grupe & Nitschke, 2013; Lang, 1968). We included an additional item to assess positive affect (“happiness”), given the well-established negative association between anxiety and positive affect (Craske et al., 2009; Mineka et al., 1998). The items were modeled after similar items used in previous studies. All items were scored moving a slider on a visual analog scale (VAS), a horizontal line representing a continuum between the labels “not at all” and “very much.” Responses were transformed into 0-100 scores, with higher scores indicating higher levels of each of the symptoms/processes. We provide a summary of the app characteristics in Figure 1.
Item and Anxiety Scores Validation
We conducted a preliminary psychometric cross-sectional study of the app items in a convenience sample (Supplementary Material, Section 1). Ninety-eight participants completed on a single occasion the five items that would be included in the app and three self-report questionnaires (one assessing anxiety symptoms, one assessing positive and negative trait affect, and one assessing avoidance). In this study, a measure of anxiety consisting of the four anxiety items had higher internal consistency (Cronbach’s α = .68) than a measure of anxiety that also included the happiness item (Cronbach’s α = .63), probably due to the nearly orthogonal relationship between positive and negative affect. We obtained further support for using four (instead of five) items to measure anxiety in confirmatory factor analysis. The four-item anxiety measure showed moderate/large correlations with the anxiety symptoms and negative affect questionnaires and nonsignificant correlations with positive affect. Moreover, these correlations were significantly higher than those of any individual anxiety items with the questionnaires. Therefore, our EMA scores (see below) included the four anxiety items.
Sample and Procedure
The current study is part of a larger investigation on predictors of anxiety. The research and ethics committee at Hospital de Bellvitge (Barcelona, Spain) approved all procedures.
We screened a large number (N = 461) of adult (age ≥ 18) individuals using the Spanish version (Buela-Casal et al., 2015) of the State-Trait Anxiety Inventory–Trait (STAI-T) subscale (Spielberger et al., 1970) via a secure web system to recruit participants with different levels of trait anxiety. Inclusion criteria were having a smartphone and being willing to collect data for 6 months. Exclusion criteria were severe medical disorder (as per self-report), and current mental disorder or substance use (except occasional use of alcohol and other recreational drugs, or tobacco use), as assessed with the Mini International Neuropsychiatric Interview (MINI; Sheehan et al., 1998), administered by an MD. The analyses presented here included data of the first 99 participants who entered the study (55% females, with a mean age of 24.33 years, SD = 4.17).
During a face-to-face intake session (baseline assessment), participants downloaded the app on their smartphones, received instructions on the EMA assessments, and were provided a written plain language definition for each item (Supplementary Material, Section 2). We told participants that they would receive €200 if they completed most EMA notifications for the whole study period. They also provided written, informed consent and filled out demographic information as well as the validated versions of the STAI-T (Spielberger et al., 1970); Penn State Worry Questionnaire, abbreviated version (PSWQ-11; Meyer et al., 1990); and the Depression-Anxiety-Stress-Scales (DASS-21; Lovibond & Lovibond, 1995). The time frame was “habitually” or “in general” (STAI-T and PSWQ) and “over the past week” (DASS-21; Supplementary Material, Section 2).
On the same day of the intake, participants started assessing their anxiety. After 6 months of EMA data collection, participants conducted a second face-to-face assessment session (i.e., endline assessment), filled out the same questionnaires as in the baseline assessment, and those who completed the study received the compensation. Participants could contact the research team in case of technical difficulties with the app during the study period.
EMA Assessment
Participants received three notifications per day, pseudorandomized at three different times of the day: in the morning (9:00 a.m.–2:00 p.m.), in the afternoon (2:00–7:00 p.m.), and in the evening (7:00–12:00 a.m.). After a notification, participants had 2 hours to rate all items included in that notification (afterward, the items would be skipped until the following notification). The items anxious apprehension, muscle tension, and happiness were included in all three notifications, which inquired about current (“right now”) feelings. The items worry and avoidance were included only in the afternoon and evening notification, respectively, and asked about worry during the previous 3 hours and avoidance during the day. Therefore, the total number of items per day the participant was asked to answer was 11 (eighth anxiety items plus three happiness items).
Statistical Analyses
The data that support the findings of this study are available on request from the corresponding author. The data are not publicly available due to privacy or ethical restrictions. We conducted all analyses using the statistics environment R (R Core Team, 2020). The scripts used are provided in the Supplementary Material (Section 4).
We calculated a daily anxiety score (“EMA anxiety score”) as the mean of all anxiety items per day. We included only the answered items. EMA anxiety scores from different days were aggregated (i.e., averaged across days) at the person level using different time durations (e.g., 1–2 weeks, 1–6 months).
Feasibility Analyses
We estimated the feasibility of the EMA-based smartphone app by calculating participant’s retention rate and compliance. We defined retention as the number of participants at the end of the study period and compliance as the percentage of notifications answered by the participant for the total notifications received, excluding those not answered due to technical issues (e.g., server crash).
Reliability Analyses
We assessed longitudinal reliability following a generalizability theory approach, a standard approach for multilevel data typical of EMA methods (Shrout & Lane, 2012). We estimated a full random-effects model including all sources of variance (person, day, time of the day, item, and all of the main effect interactions, as well as the error). From the variances obtained at different time durations, we calculated the between-person reliability (RKF) and within-person reliability (RC) estimates (Shrout & Lane, 2012). In EMA studies, between-person reliability refers to rank-order consistency of participants over time, that is, person-level individual differences. In contrast, within-person reliability refers to how well the items measure a single construct and can be reliably used to assess changes in this construct over time across individuals (Shrout & Lane, 2012).
Validity Analyses
We assessed convergent validity (i.e., how closely our EMA scores were to measures of anxiety symptoms) by calculating Pearson correlations between aggregated EMA scores (last week of the EMA period) and DASS-21-anxiety (DASS-21-A) and DASS-21-stress (DASS-21-S) scores at endline. To assess discriminant validity (i.e., that EMA scores did not show high correlations with measures of depressive symptoms), we calculated Pearson correlations between aggregated EMA-anxiety scores (last week of the EMA period) and DASS-21-depression (DASS-21-D) scores at endline. We used the last week of the EMA period for convergent and discriminant validity analyses because this corresponds to the time frame of the DASS-21.
We assessed incremental predictive validity as the degree to which EMA anxiety scores accounted for anxiety and depressive symptoms at endline above and beyond such symptoms at baseline (Haynes & Lench, 2003). We used a separate stepwise hierarchical linear regression analysis for each of the following dependent variables: worry (PSWQ-11), anxiety (DASS-21-A), stress (DASS-21-S), and depression (DASS-21-D). We first entered baseline scores on these instruments into the model and then aggregated EMA anxiety scores (first month of the EMA period) were included in the equation as independent variables. We used the first EMA month as a predictor because this is closer (compared with the first 2 months of the EMA period, for example) to the baseline assessment.
Using EMA Scores to Assess Trait Anxiety
The analyses to examine whether we could estimate trait anxiety using EMA scores involved assessing mean-level anxiety, variability, and instability. Our aim here was to establish convergent validity with respect to a person-level average tendency that inherently, based on theory and empirical evidence, varies within person. Previous studies have identified the measures that we leveraged in our design as indicators of higher level dysregulation in affect (specifically anxiety), but none have assessed their reliability or convergent validity with extant trait measures. First, we checked whether longer aggregations of EMA scores yielded higher associations (Pearson correlations) with trait anxiety. For instance, we calculated the correlation between first-week-aggregated EMA scores and average (baseline and endline) STAI-T scores, between second-week-aggregated EMA scores and average STAI-T scores, and so on. We then averaged these correlations (using Fisher’s z-transformation) to obtain the average correlation between 1-week-aggregated EMA scores and STAI-T. Second, we calculated the percentages of the variance in our full random-effects model (see reliability analyses) related to within-person and between-person variability in EMA scores across the whole study period. We assumed that our longest EMA period would be conceptually closer to trait anxiety, that is, that a lengthy repeated assessment of anxiety “states” would yield an estimate of trait anxiety. Third, we calculated two indices of trait affective instability (see Trull et al., 2015) using EMA scores (whole EMA period) and we calculated the Pearson correlations of these indices with average STAI-T scores. Affective instability is a dynamic process defining “rapid oscillations of intense affect, with difficulty in regulating these oscillations or their behavioral consequences” (Marwaha et al., 2014, p. 1082) and for which EMA techniques are especially suited (Trull et al., 2015). We calculated the mean square successive differences (MSSD) and the probability of acute change (PAC) following Solhan et al. (2009; Supplementary Material, Section 2).
Missing Data Analyses
We assessed the potential impact of missing data and we concluded that it was sufficiently minimal to proceed with the planned analyses (Supplementary Material, Section 3).
Results
Our reliability results (see “Reliability” subsection) suggest that there was no need to exclude any participant from our analyses, based on low compliance, apart from one individual who dropped out after the first day of EMA (see below).
After data cleaning (Supplementary Material, Section 2), of 52,920 potential notifications (98 participants × 180 days × three notifications per day), 41,022 (77.52%) were answered by participants (80% for the 95 retained individuals, see below). A total of 541 notifications (1.02%) were lost due to technical issues.
Feasibility
Ninety-five participants (96%) were retained in the study and completed the endline assessment. Of the four participants who abandoned the study, one abandoned the first day, one after 1 week, and two after 2 months.
The percentage of answered notifications for each participant ranged between 4% and 98%, with most participants (N = 91, 92.86%) responding to more than 50% of the notifications (Supplementary Material, Figure S1). The percentage of answered notifications was similar across the three moments of the day (morning: 79%, afternoon: 76%, and evening: 77.5% (Supplementary Material, Figure S2). Most notifications (87.5%) were answered within the first hour after the notification and the mean time to respond the notifications was 22 (SD = 28) minutes.
Descriptive Data
Descriptive data for EMA items and EMA-anxiety scores for the whole study period are presented in Table 1.
Descriptive Statistics for EMA Items and EMA Anxiety Scores (N = 98) a .
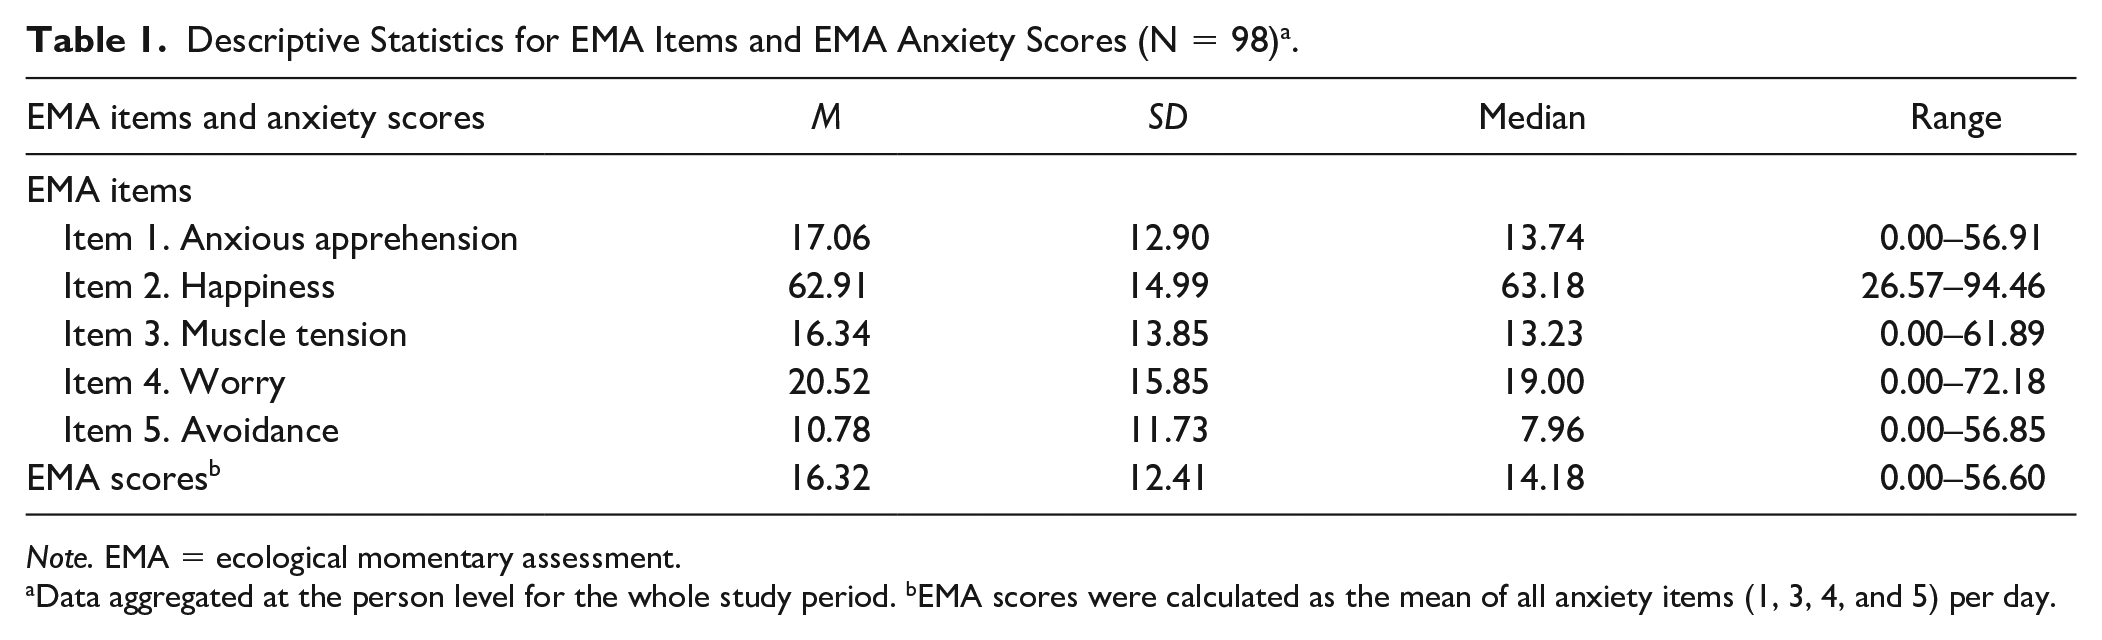
Note. EMA = ecological momentary assessment.
Data aggregated at the person level for the whole study period. bEMA scores were calculated as the mean of all anxiety items (1, 3, 4, and 5) per day.
Reliability
As shown in Table 2, both between-person (RKF) and within-person (RC) reliability were excellent, with high values even for short (i.e., 1 week) durations (RKF > .99 and RC > .72).
Reliability of EMA Anxiety Scores Using Different Time Durations (N = 98) a .
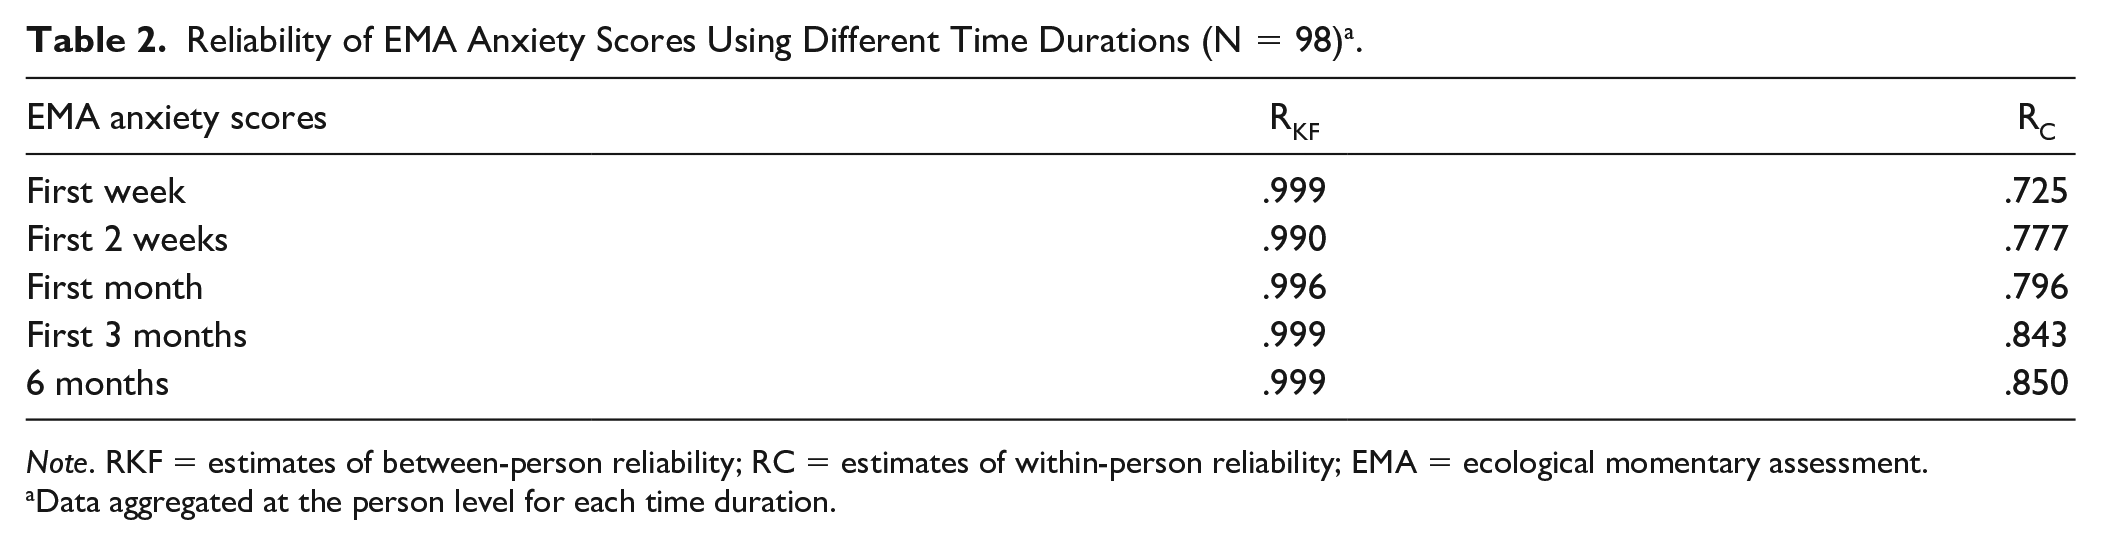
Note. RKF = estimates of between-person reliability; RC = estimates of within-person reliability; EMA = ecological momentary assessment.
Data aggregated at the person level for each time duration.
Convergent and Discriminant Validity
EMA scores (last week of the EMA period) showed significant moderate positive correlations with both endline anxiety (DASS-21-A), r =.473, p < .001, and stress (DASS-21-S) symptoms, r = .549, p < .001, indicating good performance in terms of convergent validity. The correlation with endline depressive symptoms (DASS-21-D), r = .453, was also significant, p < .001, but lower than that with anxiety symptoms, indicating moderate discriminant validity.
Incremental Predictive Validity
We present the results of the regression analyses conducted to assess incremental predictive validity in Table 3. EMA scores (first month of the EMA period) were able to predict endline stress (DASS-21-S) and depression (DASS-21-D) symptoms significantly above and beyond baseline scores for the same variables (p = .002 and p = .024, respectively). Therefore, adding anxiety EMA-based scores to self-report instruments can increase the prediction of anxiety-related phenomena. For worry (PSWQ) and anxiety (DASS-21-A) symptoms, the incremental predictive validity of EMA scores fell short of significance (p = .053 and p = .052, respectively).
Results From Hierarchical Multiple Regression Analyses Predicting Symptom Scores at Endline (6 months) From Baseline Symptom Scores and EMA Anxiety Scores (n =95) a .
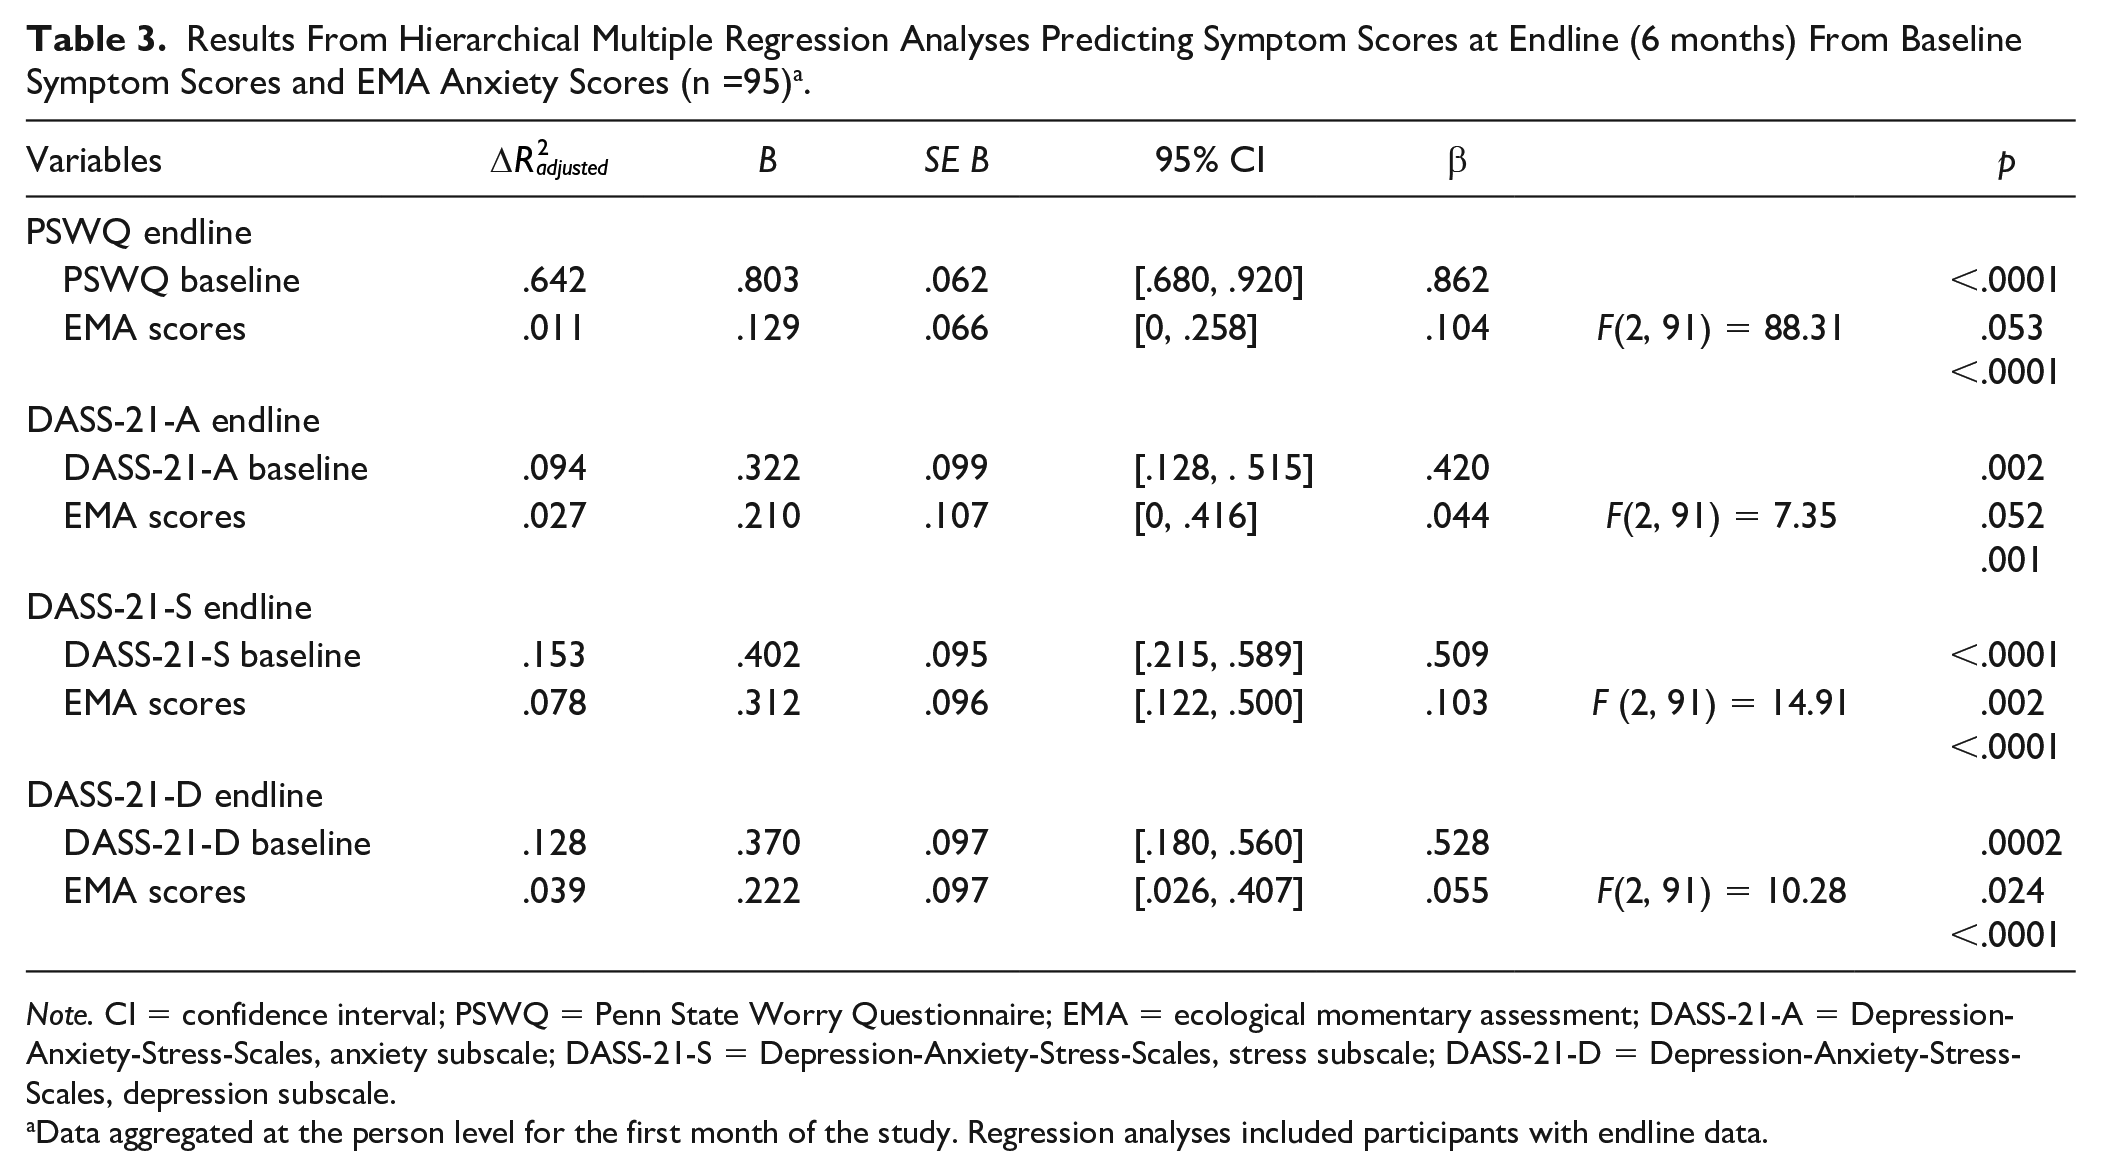
Note. CI = confidence interval; PSWQ = Penn State Worry Questionnaire; EMA = ecological momentary assessment; DASS-21-A = Depression-Anxiety-Stress-Scales, anxiety subscale; DASS-21-S = Depression-Anxiety-Stress-Scales, stress subscale; DASS-21-D = Depression-Anxiety-Stress-Scales, depression subscale.
Data aggregated at the person level for the first month of the study. Regression analyses included participants with endline data.
Using EMA Scores to Assess Trait Anxiety
Table 4 presents the means of the correlations between EMA scores using different time aggregations and trait anxiety (average of baseline and endline STAI-T). Overall, the magnitude of the correlations was higher as we aggregated EMA scores increasingly. However, the magnitude of the correlation is moderate (r = .464, p < .001) even with very long (6 months) EMA periods.
Means of the Correlations Between EMA Anxiety Scores and Trait Anxiety (N = 98) a .
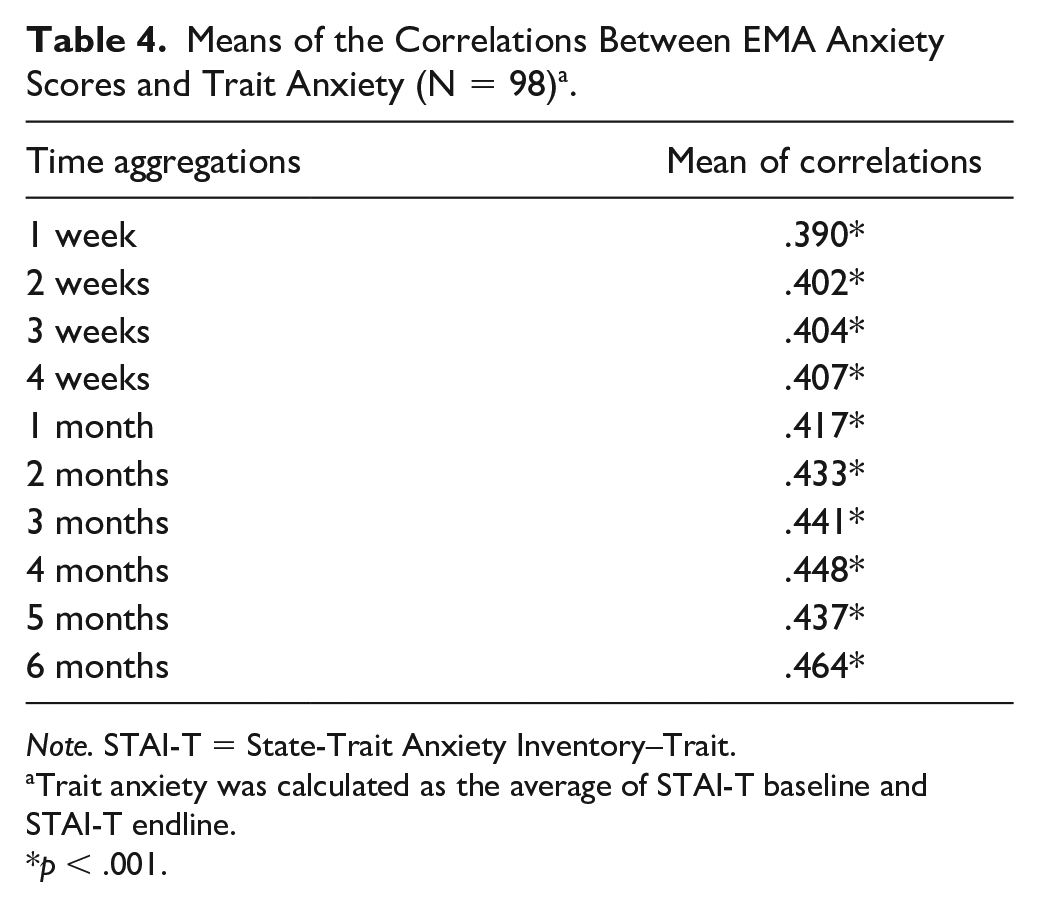
Note. STAI-T = State-Trait Anxiety Inventory–Trait.
Trait anxiety was calculated as the average of STAI-T baseline and STAI-T endline.
p < .001.
Furthermore, an inspection of the variance components for EMA anxiety scores across the whole study (Supplementary Material, Table S4) suggests systematic (33.7%) “state” (Time and Person × Time) components in the variability in EMA scores. Finally, the results of our analyses with the MSSD and PAC indices revealed moderate correlations between affective instability and trait anxiety (MSSD, r = .39, and PAC r = .31, both ps < .005). These correlations were lower than the correlations with individual anxiety symptoms or aggregated EMA anxiety scores (Supplementary Material, Table S5).
Discussion
We developed a smartphone app to assess anxiety longitudinally following EMA principles and assessed its feasibility and psychometric properties. We have shown that evaluating anxiety in real life using a smartphone for long periods is feasible and can be done reliably and validly.
Our feasibility (retention and compliance) results were excellent for a 6-month-long study. Only 4% of participants abandoned the study, overall compliance was around 80%, and most participants answered at least half of the notifications received. Retention and compliance rates in EMA studies are variable (see, for example, Vachon et al., 2019; Wen et al., 2017) and some authors have proposed compliance rates of about 75% as acceptable (see Trull & Ebner-Priemer, 2020). However, such estimates are based on much shorter (e.g., 1 month) studies than ours. Of note, in long studies like ours, if the reliability estimates are high, and the missing at random assumption is met, relatively “low” response rates in one individual would still be usable depending on the question addressed.
We assessed anxiety using “only” four items (some of them administered several times throughout the day), but four items may be sufficient to evaluate complex constructs in EMA studies (Cranford et al., 2006; Shrout & Lane, 2012; Trull & Ebner-Priemer, 2020). Previous research also suggests that a high number of items may decrease compliance in EMA studies (Eisele et al., 2020; Morren et al., 2009; but see also Wen et al., 2017). Our compliance and psychometric results suggest that we found an excellent balance between low burden and high psychometric performance. The app showed excellent within-subject and between-subject reliability, indicating high consistency over time and over time across individuals. It also showed moderate/good convergent and discriminant validity, that is, it was highly correlated to anxiety and less so to depression. We must note that correlations between EMA-based and retrospective recall measures (such as self-report questionnaires) are not expected to be “very” high and that, in general, recall measures tend to overestimate clinical symptoms (Shiffman et al., 2008). We have also provided evidence for the incremental validity of EMA anxiety measures, in agreement with the idea that EMA can complement other assessment sources (Solhan et al., 2009).
We also investigated to what extent we can use EMA anxiety scores to assess trait anxiety. Our results suggest that we may get closer to assessing trait anxiety as we aggregate EMA scores for long periods. However, they also indicate that EMA-based trait scores do not have the temporal precision to track reliable change in how individuals vary in their anxiety reports over time. A previous study concluded that although the trait component of EMA ratings of anxiety is large, traditional self-report questionnaires of trait anxiety correspond only weakly with EMA-defined traits (Edmondson et al., 2013). Of note, the proportion of variance in EMA scores attributable to trait-like individual differences may vary with different constructs (e.g., trait rumination or emotional awareness; see Rosenkranz et al., 2020; Versluis et al., 2021).
We tested whether adding “state anxiety” data could be increasingly converging on a “trait.” We used two measures of instability (PAC and MSSD) because we thought this could give us more traction in asserting that our measure was state or trait. Even those with severe anxiety do not experience anxiety constantly; the distinguishing factor is that they experience it acutely and that its effects persist. We think that PAC and MSSD are better indicators of a general tendency to react acutely, which partially defines anxiety, and in a more psychometrically valid way than asking someone to “aggregate it in their head” before responding to a single item. We found consistent evidence regarding states mapping onto traits across the three EMA indices we used to assess trait anxiety. However, the association was small, which aligns with context-dependent theories of personality (Mischel & Shoda, 1995).
Implications and Directions for Future Research
Our results have significant implications: Anxiety phenotypes based on longitudinal EMA data can be reliably and validly established, which opens the door to studies that assess, for example, the neurobiological correlates (or predictors) of such phenotypes. This strategy, called hybrid design, may facilitate discovering biomarkers in mental health (Treadway & Leonard, 2016). Some studies have already identified predictive biomarkers of behavior (other than anxiety) in clinical and nonclinical populations using EMA (Moran et al., 2019; Webb et al., 2021). Given our high compliance rates, longer EMA assessment periods may be feasible, although this awaits further research.
Limitations
Our study has some limitations. First, our EMA anxiety measures included only subjective self-report data, that is, we did not assess objective physiological or behavioral data that can be collected through smartphones and using EMA. Future research that integrates these different types of data is warranted to evaluate their convergent and complementary attributes toward integrating the cognitive, behavioral, and physiological reactions that define anxiety. Second, we focused on nonclinical participants. The use of nonclinical samples in anxiety research is well established (Van Den Hout et al., 2017) and permits circumvention of typical caveats of clinical research (comorbidity, treatment effects, etc.). However, future research will have to assess the feasibility/psychometric properties of the app in patients with mental health disorders, especially in those with pathological anxiety (i.e., anxiety-related disorders). Finally, we used a convenience sample and our results’ generalization to other contexts or populations is unknown.
Conclusion
To summarize, we have shown that assessing anxiety longitudinally using a smartphone and following EMA principles is feasible and can be done reliably and validly. Although studies in clinical samples are still needed, our data suggest that EMA-based anxiety longitudinal phenotypes can be investigated and open the door to studies combining such phenotypes with other assessment methods.
Supplemental Material
sj-docx-1-asm-10.1177_10731911211065166 – Supplemental material for Development and Validation of a Smartphone-Based App for the Longitudinal Assessment of Anxiety in Daily Life
Supplemental material, sj-docx-1-asm-10.1177_10731911211065166 for Development and Validation of a Smartphone-Based App for the Longitudinal Assessment of Anxiety in Daily Life by Lydia Fortea, Miquel Tortella-Feliu, Asier Juaneda-Seguí, Víctor De la Peña-Arteaga, Pamela Chavarría-Elizondo, Laia Prat-Torres, Carles Soriano-Mas, Sean P. Lane, Joaquim Radua and Miquel A. Fullana in Assessment
Footnotes
Acknowledgements
The authors thank CERCA Programme/Generalitat de Catalunya for Institutional Support.
Declaration of Conflicting Interests
The author(s) declared no potential conflicts of interest with respect to the research, authorship, and/or publication of this article.
Funding
The author(s) disclosed receipt of the following financial support for the research, authorship, and/or publication of this article: M.A.F., J.R., and C.S.-M. have received support from the Spanish Ministry of Science and Innovation integrated into the Plan Nacional de I+D+I and co-financed by the Instituto de Salud Carlos III (ISCIII)-Subdirección General de Evaluación and the Fondo Europeo de Desarrollo Regional (FEDER) (PI16/00144, PI19/00272, PI19/00394, CPII19/00009, PI16/00889, and PI19/01171). C.S.-M. has received research support from the Departament de Salut, Generalitat de Catalunya (PERIS SLT006/17/249), and the Agència de Gestió d’Ajuts Universitaris i de Recerca (2017 SGR 1262). S.P.L. is supported by the National Institutes of Health through a National Institute on Alcohol Abuse and Alcoholism R01 grant (R01 AA027264; PI: Lane/Hennes). V.d.l.P.-A. has received support from the “la Caixa” Foundation (ID 100010434, fellowship code LCF/BQ/IN17/11620071).

Supplemental Material
Supplemental material for this article is available online.
References
Supplementary Material
Please find the following supplemental material available below.
For Open Access articles published under a Creative Commons License, all supplemental material carries the same license as the article it is associated with.
For non-Open Access articles published, all supplemental material carries a non-exclusive license, and permission requests for re-use of supplemental material or any part of supplemental material shall be sent directly to the copyright owner as specified in the copyright notice associated with the article.
