



Abstract
The Reading the Mind in the Eyes test (RMET) is a widely used measure of theory of mind (ToM). Despite its popularity, there are questions regarding the RMET’s psychometric properties. In the current study, we examined the RMET in a representative U.S. sample of 1,181 adults. Key analyses included conducting an exploratory factor analysis on the full sample and examining whether there is a different factor structure in individuals with high versus low scores on the 28-item autism spectrum quotient (AQ-28). We identified overlapping, but distinct, three-factor models for the full sample and the two subgroups. In all cases, each of the three models showed inadequate model fit. We also found other limitations of the RMET, including that nearly a quarter of the RMET items did not meet the criteria for inclusion in the RMET that were established in the original validation study. Due to the RMET’s weak psychometric properties and the uncertain validity of individual items, as indicated by our study and previous studies, we conclude that significant caution is warranted when using the RMET as a measure of ToM.
Keywords
Broadly defined, theory of mind (ToM) is the ability to impute mental states to oneself and others (Premack & Woodruff, 1978). Baron-Cohen (1995) proposed that a deficit in ToM ability is an underlying cause of autism. Noting an absence of ToM tests suitable for use with adults, Baron-Cohen and colleagues developed a new measure, the Reading the Mind in the Eyes test (RMET, Baron-Cohen et al., 1997; Baron-Cohen, Wheelwright, Hill et al., 2001), to identify subtle ToM deficits in adults. Specifically, the RMET was designed to measure the ability to use information from people’s eyes to infer mental states as an indication of ToM ability.
The RMET
The RMET comprises 36 items, with each item consisting of a black and white photograph of a person’s eyes and four mental state descriptors that the authors selected to be of a similar valence (e.g., terrified, upset, arrogant, annoyed). 1 Participants are instructed to select “the word that best describes what the person in the picture is thinking or feeling” (see Figure S1). The photographs were collected from magazines and the mental state descriptors were selected by the authors of the test. The individual test items were validated in a sample of 225 participants in Britain, consisting of 122 members of the general public and 103 undergraduate students from Cambridge University. The validation criteria for each RMET item were that (a) at least 50% of participants chose the target response and (b) no more than 25% selected the same incorrect response. The RMET consists of 36 out of 40 items that met these validity criteria. It is widely used in empirical research and the article that introduced it is extensively cited, having 3,438 citations on the Web of Science as of September 10, 2022.
Baron-Cohen, Wheelwright, and Hill et al. (2001) did not evaluate the RMET’s test–retest reliability or internal consistency, and these statistics are rarely reported in subsequent studies using the RMET. When reported, the test–retest reliability of the RMET is generally acceptable (e.g., Fernández-Abascal et al., 2013; Hallerbäck et al., 2009; Khorashad et al., 2015; Prevost et al., 2014). Conversely, there is considerable variation in reported levels of internal consistency based on Cronbach’s alpha (α), which is the most frequently reported measure of internal consistency for the RMET (Kittel et al., 2021). While some studies have reported moderate (e.g., Kuczynski et al., 2020; Soker-Elimaliah et al., 2020) to high levels of internal consistency (e.g., Ozturk et al., 2020; Israelashvili et al., 2020), other studies have reported low levels of internal consistency (e.g., Giordano et al., 2019; Khorashad et al., 2015; Koo et al., 2021; Meyer & Shean, 2006; Vellante et al., 2013). A recent meta-analysis of the psychometric properties of the RMET reported an acceptable α value of .73 (95% confidence interval [CI] [.65, .79]) based on 21 effect sizes (Kittel et al., 2021). However, as the authors note, longer psychometric instruments such as the RMET can inflate α values.
The variation in levels of internal consistency reported for the RMET might relate to the use of α as a measure of internal consistency because α relies on the assumption that a test is unidimensional (Goodboy & Martin, 2020; Olderbak et al., 2021). While the RMET was designed to evaluate a single ability (attributing mental states based on images of eyes) as an indicator of ToM capacity, Baron-Cohen, Wheelwright, and Hill et al. (2001) did not evaluate the test’s factor structure, and subsequent research is yet to clearly establish its factor structure. To our knowledge, Olderbak et al. (2015) are the only researchers to conduct an exploratory factor analysis (EFA) on the 36-item English version of the RMET. They identified a five-factor model. However, they rejected the five-factor model because nine items (i.e., 25% of the items) failed to load on to any of the factors, the factors were weakly related to each other, and none of the factors related to any theoretically motivated subscales previously proposed in the literature. Using confirmatory factor analysis (CFA), they evaluated two theoretically driven models, a single-factor model and a three-factor model proposed by Harkness et al. (2005), in which test items were divided into positive, negative, and neutral factors based on the valence of each item. However, key measures of model fit provided inconsistent results and the factor loadings were low, so the authors ultimately rejected both the single-factor and the three-factor valence models.
We are only aware of three other studies that conducted factor analyses on the English language RMET. Black (2019) also conducted CFA on a single-factor model. While the author concluded that the single-factor model had an acceptable model fit, similar to the results reported by Olderbak et al. (2015), the reported model fit statistics were inconsistent. Individual factor loadings were not reported. It is difficult to reconcile the findings of Olderbak et al. (2015) and Black (2019) because, despite similar results from a CFA on a single-factor model for the RMET, these two studies came to opposite conclusions about the acceptability of the model. Nonetheless, Kline (2016, p. 264) emphasizes the importance of evaluating model fit against multiple fit indices, “Because a single statistic reflects only a particular aspect of fit, a favorable value of that statistic does not by itself indicate acceptable fit.” This supports the rejection of the single factor model due to the inconsistent results across key model fit measures. Two other studies (Benau et al., 2020; Sherman et al., 2015) briefly report the results of a CFA for a single-factor model as evidence for acceptable internal consistency of the RMET. While the authors of both studies stated that they found good model fit, the fit statistics that they provided were not comprehensive and did not include the fit statistics that showed poor model fit in the analyses conducted by Olderbak et al. (2015) and Black (2019). This lack of detail limits our ability to evaluate their claim of good model fit. Overall, the lack of clear evidence in support of a single factor model for the RMET is of concern because, as noted above, the most frequently reported measure of internal reliability for the RMET is α, which assumes unidimensionality (Goodboy & Martin, 2020; Olderbak et al., 2021). If the RMET is not unidimensional, then α is not appropriate as a measure of its internal consistency.
In line with the proposition that ToM deficits are an important underlying cause of autism, Baron-Cohen (1995) and Baron-Cohen, Wheelwright, Hill, et al. (2001) validated the RMET as a measure of ToM based on differences in RMET performance between autistic and non-autistic participants and correlations between RMET scores and scores on a measure of autistic traits, the Autism Spectrum Quotient (AQ; Baron-Cohen, Wheelwright, Skinner, et al., 2001). The authors found that autistic individuals 2 scored significantly lower on the RMET than non-autistic individuals and that RMET scores negatively correlated with AQ scores in both autistic and non-autistic participants. While these findings offered initial support for the validity of the RMET as a measure of ToM based on the proposed relationship between autism and ToM, establishing the validity of the RMET as a measure of ToM through the differential performance of autistic individuals and individuals with high levels of autistic traits is potentially problematic for at least three reasons.
First, it relies on the assumption that autistic individuals (and individuals with higher levels of autistic traits) have a deficit in ToM ability, 3 which is not without contention. For example, Deschrijver and Palmer (2020) have proposed that atypical performance in ToM tasks in autistic individuals might relate to differences in how they process conflict between their own mental states and the mental states of others rather than a problem with imputing mental states per se. Moreover, Gernsbacher and Yergeau (2019) recently challenged the body of research purportedly establishing the existence of ToM deficits in autistic individuals.
Second, it relies on the assumption that autistic individuals’ lower scores on the RMET are caused by a deficit in ToM ability. However, the RMET might tap into other abilities or dispositions that result in autistic individuals having low scores. For example, there is evidence that the RMET measures emotion recognition abilities and alexithymia (a condition in which an individual has difficulty recognizing and describing their own and others’ emotions) frequently co-occurs with autism (Bird & Cook, 2013). Importantly, Oakley et al. (2016) recently found that alexithymia is more predictive of performance on the RMET than an autism diagnosis or autistic traits measured using the AQ. Consequently, they concluded that differences in autistic individuals’ RMET performance are better explained by atypical emotion recognition related to co-occurring alexithymia than by differences in ToM ability. In addition, a recent meta-analysis revealed that RMET performance is more strongly associated with performance in measures of emotion perception than measures of ToM (Kittel et al., 2021).
Third, the RMET might not be an appropriate measure of ToM ability for autistic individuals due to the nature of the stimuli. There is evidence that autistic individuals can find looking directly at other people’s eyes uncomfortable or even overwhelming (Hadjikhani et al., 2017; Stuart et al., 2022; Trevisan et al., 2017). Thus, some autistic individuals may find the stimuli used in the RMET aversive, predisposing them toward poorer performance on the task, regardless of their underlying ToM ability. Autistic traits, as indexed by the AQ, have been shown to be normally distributed within the population (Hurst et al., 2007; Ruzich et al., 2015), and there is evidence that AQ scores correlate negatively with RMET scores in the general population (Gökçen et al., 2016; Kallitsounaki & Williams, 2020). Thus, the influence of the stimuli on performance might also extend to individuals who exhibit high levels of autistic traits. This possibility is consistent with recent research showing that members of the general population study who scored higher on the AQ spend more time looking at the bottom half of a face than those with lower AQ scores (Wegner-Clemens et al., 2020).
Despite the limited evidence of the validity of the RMET, it is regularly claimed that the RMET is a “well-validated measure” without providing supporting evidence (see Table S1 for a list of quotations). This illustrates a form of research bias in the psychological sciences that Flake and Fried (2020) have recently dubbed a “measurement schmeasurement” attitude that is characterized by the use of psychometric instruments without sufficient evidence for their validity. A reevaluation of the validity of the RMET is critical because, as Flake and Fried note, if a test is not a valid measure of its target construct, then the inferences drawn from the study are invalid and “[n]either rigorous research design, nor advanced statistics, nor large samples can correct such false inferences” (Flake & Fried, 2020, p. 456). Thus, if it turns out that the RMET is not a valid measure of ToM, then the consequences for the sprawling body of literature using this measure are profound.
As a step toward addressing the limited evidence of the validity of the RMET, the current study evaluated the RMET’s factor structure. We also examined the possibility that individuals with higher versus lower levels of autistic traits might exhibit different factor structures due to aspects of the test that are unrelated to ToM ability. For example, if individuals high in autistic traits find viewing the RMET stimuli to be uncomfortable and/or rely on compensatory strategies for identifying the correct response (Baron-Cohen, Wheelwright, Hill et al., 2001; Golan et al., 2015; Livingston et al., 2020), this might help explain inconsistencies in earlier factor analyses.
Aims and Hypotheses
The present study was preregistered, with six primary aims. First, to evaluate the factor structure of the RMET in a large demographically representative U.S. sample. Second, to test whether there are different factor structures in individuals with higher versus lower levels of autistic traits (as measured using an abbreviated, 28-item version of the AQ; AQ-28; Hoekstra et al., 2011). Third, to test whether individuals with higher levels of autistic traits who score lower on the RMET might do so as a result of co-occurring alexithymic traits (as measured by the Toronto Alexithymia Scale, TAS, Bagby et al., 1994). Fourth, to evaluate the convergent validity of the RMET with another measure of ToM, the Imposing Memory Test (IMT, Launay et al., 2015). Fifth, to examine relationships between performance on the RMET, autistic traits, and the level of comfort participants reported when viewing the eye stimuli (using an ad hoc single-item measure of level of comfort measure). Sixth, to examine the factor structures of the TAS and the AQ-28.
We report full results for our first four aims in the main article. We provide a brief summary of our results testing our fifth aim in the main article, while detailed results are reported in the Supplemental Materials (Part 2, section 2). All information related to the sixth aim are available on the project’s Open Science Framework (OSF) page. 4
Method
We report how we determined our sample size, all data exclusion criteria, all manipulations, and all measures in the study. The preregistration, data, R scripts, and Supplemental Materials are available on the project’s OSF page. 4
Participants
The sample size for this study was determined based on Goretko et al.’s (2019) recommended minimum of 400 participants for exploratory factor analysis (EFA) when the number of factors is unknown. Because we planned to conduct separate EFAs on two subsets of our data consisting of (a) participants with the lowest third of AQ-28 scores and (b) participants with the greatest third of AQ-28 scores, our target sample size was 1,200 participants.
Participants were recruited using Lucid Theorem, an online recruitment platform that uses quota sampling to provide a sample that matches the U.S. national distribution in terms of age, gender, ethnicity, and geographic region (Coppock & McClellan, 2019). Participants were compensated directly with cash, gift cards, or loyalty reward points by Lucid’s partner companies according to the terms of their agreements with these partner companies. In all, 2,678 participants were recruited for the study. We had three preregistered exclusion criteria. First, for analyses involving gender, only participants who selected “male” or “female” gender categories were analyzed (to ensure that the categories were large enough for statistical analysis). No participants were excluded based on this criterion because all participants identified as male or female in the demographic information they provided to the Lucid Theorem. Second, 863 participants failed an attention check question that was presented near the end of the survey in which they were asked to show that they have read the questions by moving a slider to “0.” 5 These participants were immediately sent to a debriefing page and were excluded from all analyses. Third, 39 participants who did not finish the IMT were excluded from the analyses involving this measure. In addition, an examination of the data revealed that 41 participants provided straight-line responses to the AQ-28, TAS, and/or IMT, which means that they selected the same response across all items for at least one of these measures. Because approximately half of the items on these measures are reversed scored, it is extremely unlikely that these are sincere responses, so these participants were excluded too. This was not a preregistered exclusion criterion. Results with these participants retained, which are very similar to the results reported in the main paper, are included in Part 3 of the Supplemental Materials.
The final sample included 1,181 (652 female) participants with ages ranging from 18 to 88 (M = 47.7, SD = 17.0). The sample was representative of the U.S. population in terms of levels of educational attainment (high school 23.5% [USA 28.3%], 6 some university study 20.1% [17.7%], 2-year degree 8.4% [9.8%], 4-year degree 25.9%, [21.2%], postgraduate studies 13.2% [10.8%]) and race (White 76.6% [76.3%], Black 9.3% [13.4%], Asian 2.7% [5.9%], other 9.3%, and prefer not to answer 3.7%).
Measures
Reading the Mind in the Eyes Test (Revised Version)
The original revised RMET was a pen and paper test with one test item per page and the mental state terms printed around the four corners of the image (e.g., flustered, convinced, desired, and joking). To avoid any response bias due to the placement of response options, we presented the four mental state descriptors below the image with the order of response options randomized across participants (Figure S1). The original version of the test includes a glossary of terms to ensure that participants know the meaning of all the mental state descriptors. Accordingly, for each RMET question, we included an “extra help” section that participants could click to see the definitions of the mental state descriptors for that test item. Items were scored with 1 point for a correct response and 0 points for an incorrect response, with the total possible score ranging from 0 to 36. Higher scores purportedly indicate higher levels of ToM ability.
Autism Spectrum Quotient Brief Version (AQ-28)
The AQ-28 (Hoekstra et al., 2011) is a 28-item reduced version of Baron-Cohen, Wheelwright, Skinner et al.’s (2001) 50-item Autism Spectrum Quotient questionnaire. In this self-report measure, participants rate their level of agreement with statements about themselves. Each item is scored from 1 to 4, (1 = “definitely agree’’; 2 = “slightly agree”; 3 = “slightly disagree” and 4 = “definitely disagree”), with the total possible scores ranging from 28 to 112. Higher scores indicate more autistic traits. Hoekstra et al. (2011) found that the AQ-28 has acceptable internal consistency (α = .78) and correlates highly with the original 50-item scale (r = .93). Hoekstra et al. (2011) identified a five-factor structure (social skills, routine, switching, imagination, and numbers and patterns) and a two-factor higher order factor structure (numbers and patterns and social behavior, which incorporates the other four first-order factors).
Toronto Alexithymia Scale
The Toronto Alexithymia Scale (TAS; Bagby et al., 1994) is a self-report measure of alexithymia that comprises 20 statements. The TAS has three subscales, difficulty identifying feelings (identify), difficulty describing feelings (describe), and externally oriented thinking (external). Bagby et al. (1994) reported acceptable levels of test–retest reliability (r = .77, p < .01) and internal consistency (with the exception of the external subscale): α for full test = .81, identify = .78, describe = .75, and external = .66. Each item was scored from 1 to 5, with total possible scores ranging from 20 to 100 and higher scores indicating higher levels of alexithymic traits.
The Imposing Memory Task (IMT)
The IMT (originally created by Kinderman et al., 1998) is a story test similar to the more widely used Strange Stories task (Happé, 1994). For this study, we used a single story of approximately 200 words from Launay et al.’s (2015) version of the IMT (adapted from Stiller & Dunbar, 2007). Participants read the story and then answered true/false questions based on its content. Some of the true/false questions required mental state reasoning (e.g., “Carolyn thought that Hannah liked Emma’s boyfriend Matt”), whereas others were memory control questions (e.g., “Carolyn told Hannah that Emma had been at training”). We used a subset of 16 of the 22 questions related to the story, comprising eight ToM questions and eight memory control questions. Questions scored 1 point for a correct response and 0 points for an incorrect response. Both memory and ToM scores were calculated with a range of 0 to 8 for each category.
We made two small amendments to the questions by replacing a pronoun with a character’s name to reduce ambiguity and replacing the word “friend” with the word “colleague” in another question as it was not clear from the story that the two characters were friends.
Procedure
Participants completed the survey online. The median completion time was 18 min. After the consent page, the RMET, TAS, and AQ-28 were presented with their order randomized across participants. The question about comfort viewing eye stimuli was always presented immediately after the RMET. Following these tasks, the IMT was presented. Finally, the participants were asked demographic questions, which included a measure of belief in God that will be analyzed as part of a separate project that we will report elsewhere. Ethics approval for this study was granted by Macquarie University Human Research Ethics Committee (reference number: 52020625515320).
Analytic Approach
Model fit was assessed using seven metrics: χ2, root mean square of residuals (RMSR), standardized root mean square of residuals (SRMR), root mean square error of approximation (RMSEA), comparative fit index (CFI), Tucker–Lewis index (TLI), and Bayesian information criterion (BIC). A nonsignificant χ2 indicates good model fit; however, as sample sizes increase, χ2 becomes significant independent of model fit (Bergh, 2015). We have reported χ2 for all models, however, because our sample size was very large, it is not at all surprising that χ2 was always significant. CFI and TLI are relative fit measures, which means that they compare model fit with a null model. Higher values indicate better model fit. In contrast, RMSR, SRMR, and RMSEA are absolute fit measures, and the model fit is evaluated without comparison to a null model. Lower values indicate better model fit. Lower values also indicate a better model fit for BIC, and the value can be used to select between competing models.
Model fit for EFA and structural equation modeling (SEM) analyses were determined according to the following fit criteria: RMSR < .05, SRMR < .08, RMSEA < .08 acceptable fit, < .05 good fit, TLI ≥ .95, CFI ≥ .90, χ2, p > .05, and lower values indicate better model fit for BIC (Hu & Bentler, 1999). However, it should be noted that these values are guidelines and were not designed as strict cutoff criteria (Kline, 2016; Marsh et al., 2004). In addition to evaluating models according to these metrics, we made decisions based on the conceptual applicability of the models.
Omega (ω) has been recommended as a more appropriate indicator of internal consistency than α (Flora, 2020). In contrast to α, which assumes unidimensionality (Goodboy & Martin, 2020; Olderbak et al., 2021), ω provides information related to a measure’s dimensionality as well as its internal consistency. However, calculating ω requires knowledge of the factor structure of a measure (Flora, 2020). As noted earlier, previous research has not been able to identify a well-fitting factor model for the RMET. Because we also could not find a well-fitting factor model for the RMET, we report α based on the test’s proposed single factor (Baron-Cohen, Wheelwright, Hill et al., 2001) and to allow for direct comparison with previous studies, which have predominantly reported α values for the RMET. In line with the findings of Black (2019) and Olderbak et al. (2015), an exploratory CFA on our data resulted in inconsistent fit statistics (see Supplemental Materials, Part 2, section 1). Following Flora’s (2020) guidelines, we report omega hierarchical (ω h ) as a measure of internal consistency for the AQ-28 and the TAS because the measures’ proposed multidimensional structures are supported by CFA model fit statistics. We also report α for these measures for comparison with previous studies. There are no strict cutoff values for these measures to indicate acceptable levels of internal consistency (Green & Yeng, 2015). Nonetheless, minimum values of ≥.70 are often cited for α (Christmann & Van Aelst, 2006), and researchers have also used the value of ω ≥ .70 as indicative of acceptable reliability (Bado et al., 2018). We also report the mean interitem tetrachoric correlation for the RMET, which indicates the level of agreement between test items. The recommended range is .15 to .50 (Clark & Watson, 1995).
Results
Descriptive Statistics
Supplementary Tables S2 and S3 contain the descriptive statistics for the outcome variables and the correlation matrix for all key variables. RMET scores had a slight left skew (Figure S2), but the level of skew was within the acceptable range to assume a normal distribution (skew = −0.73; kurtosis = 0.35; Hair et al., 2014; Hancock et al., 2018). Scores ranged from 5 (14% correct) to 34 (94% correct). The mean score (M = 23.49, 65% correct, SD = 5.51) was comparable but lower than in the general population reported by Baron-Cohen, Wheelwright, Hill et al. (2001, M = 26.2 SD = 3.6). There were eight test items that failed Baron-Cohen, Wheelwright, Hill et al.’s (2001) criteria for validating test items: specifically, more than 25% of participants selected the same foil for Items 6, 10, 17, 23, 25, 28, 34, and 35; and less than half of participants selected the correct response for Items 23 and 25 (see Table S4). Reliability was acceptable according to α at .75. We also found a weak positive correlation between reported levels of comfort viewing the eye stimuli and RMET performance (r = .19, p < .001).
The mean interitem tetrachoric correlation for the RMET was .13 (range from -.12 to .36, see Table S5 for the full correlation matrix) which is consistent with previously reported values (.10, Black, 2019; .08, Olderbak et al., 2015) and falls below the recommended range of .15 to .50 (Clark & Watson, 1995). A subset of items were also negatively correlated with each other. This indicated low levels of agreement between items. Also, in line with Olderbak et al. (2015), correlations between items with same target were low (“fantasizing” r = .21, “cautious” r = .10, “preoccupied” r = .32, “interested” r = .15).
AQ-28 scores were normally distributed (Figure S3). Scores ranged from 39 to 102 (M = 66.0, SD = 9.5). Internal consistency was within the acceptable range for the full scale (ω h = .80; α = .77) and the social skills (ω h = .71; α = .82) and the numbers and patterns subscales (ω h = .72; α = .72). However, the reliability of the other three subscales were below the recommended range (routine [ω h = .46; α = .57], switching [ω h = .57; α = .57], imagination [ω h = .66; α = .69]).
TAS scores were normally distributed. Scores ranged from 22 to 83 (M = 49.4, SD = 12.3). Internal consistency was within an acceptable range for the full scale (ω h = 0.87, α = .85) and the TAS describe and TAS identify subscales (ω h = .78, α = .77; ω h = .85, α = .86 respectively). However, consistent with Bagby et al. (2014, 1994), the internal consistency of the TAS external subscale was low (ω h = .47, α = .54).
EFA of the Overall RMET Factor Structure
We used EFA to evaluate the factor structure of the RMET. An item was considered to load onto a factor if the rotated factor weighting was ≥ 0.3 (Hair et al., 2014). Model fit was evaluated against the criteria outlined in Section 2.4.
For the full sample, we ran a parallel analysis to determine the number of factors to retain, using the psych package (version 2.0.9, Revelle, 2020) in R (version 4.0.1, R Core Team, 2020). Because the items are dichotomous, we used a tetrachoric correlation matrix, weighted least squares factoring method with an oblique rotation (geominQ) and 50 iterations (Susana et al., 2017). Parallel analysis suggested 12 factors, and model fit measures for this solution approached good-fit levels (CFI = .889, TLI = .732, RMSEA = .051, 95% CI [.045-.055], RMSR = .02, BIC = -782, χ2 = 1086, p < .001). However, in this model, 11 items failed to load onto any factor, seven factors consisted of only a single item, and the other five factors lacked any obvious conceptual explanatory power.
Because there was a poor conceptual fit for the model retaining the number of factors indicated by parallel analysis, we conducted an exploratory analysis using Cattell’s scree plot 7 (Figure S3). This approach indicated a three-factor solution. This model had acceptable fit when evaluated by RMSEA (.059, 95% confidence interval [CI]: [.057–.061]) and good model fit according to RMSR (.05) and χ2 (2,693, p <.001.) However, model fit was poor according to global fit indices (CFI = .706, TLI = .647, BIC = −1,021). Similar to the model with more factors retained, we found that nine items did not load onto any of the three factors, three items had cross-loading on two factors, and the maximum factor loading was only 0.550 (see Table 1). The cumulative variance explained was also low (.20), indicating that a significant amount of variance is not explained by this model.
Factor Loadings for Three Factor EFA on the Full Sample.

Note. Items were considered to load onto a factor if the factor loading was ≥ 0.3. RMET = Reading the Mind in the Eyes test.
Despite the poor model fit and a high number of items failing to load onto any factor, the three-factor solution did have conceptual explanatory power, with one factor relating to internally oriented attention and thinking (e.g., pensive and preoccupied), one factor relating to negative emotions (e.g., hostile and despondent), and one factor relating to flirtation (e.g., flirtatious and fantasizing). The flirtatious factor overlaps with one of the five factors identified by Olderbak et al. (2015), with five items in common: “desire” (3), “flirtatious” (30), “fantasizing” (21, 6) and “interested” (25). However, a number of items failed to load as would be expected. The target “reflective” (29) did not load onto the thoughtful factor. The targets “upset” (2), “worried” (5), and “accusing” (14) did not load onto the negative factor. Only one of the two RMET items with the target “interested” loaded onto the flirtatious factor.
EFA of RMET Factor Structure in Participants Low in Autistic Traits
To evaluate the possibility that individuals with lower levels of autistic traits show a different factor structure for the RMET, we conducted EFA on the RMET scores of the participants with the highest and lowest AQ-28 scores. While there are no strict guidelines for the minimum sample size for EFA, Goretzko et al. (2019) recommend a minimum of 400 participants when the number of items per factor and the amount of variance the factors will account for are unknown. In line with this recommendation and because there is currently little information related to the factor structure of the RMET, we specified in our preregistration that we would select the top and bottom third of participants based on AQ-28 scores to ensure adequate group sizes for robust factor analyses. Scores for participants in the bottom third ranged from 39 to 62 (M = 56.2, SD = 4.8). This subgroup consisted of 422 (233 female) participants with a mean age 49.2 (SD = 16.1). This subgroup was demographically similar to the full sample (White 78%, Black 11%, Asian 3%, other 6%, and prefer not to answer 2%). The mean RMET score was 24.2 (SD = 4.7). Internal consistency was below the “acceptable” range for α at .68, and some items negatively correlated with the scale, suggesting that these items do not all represent a single factor.
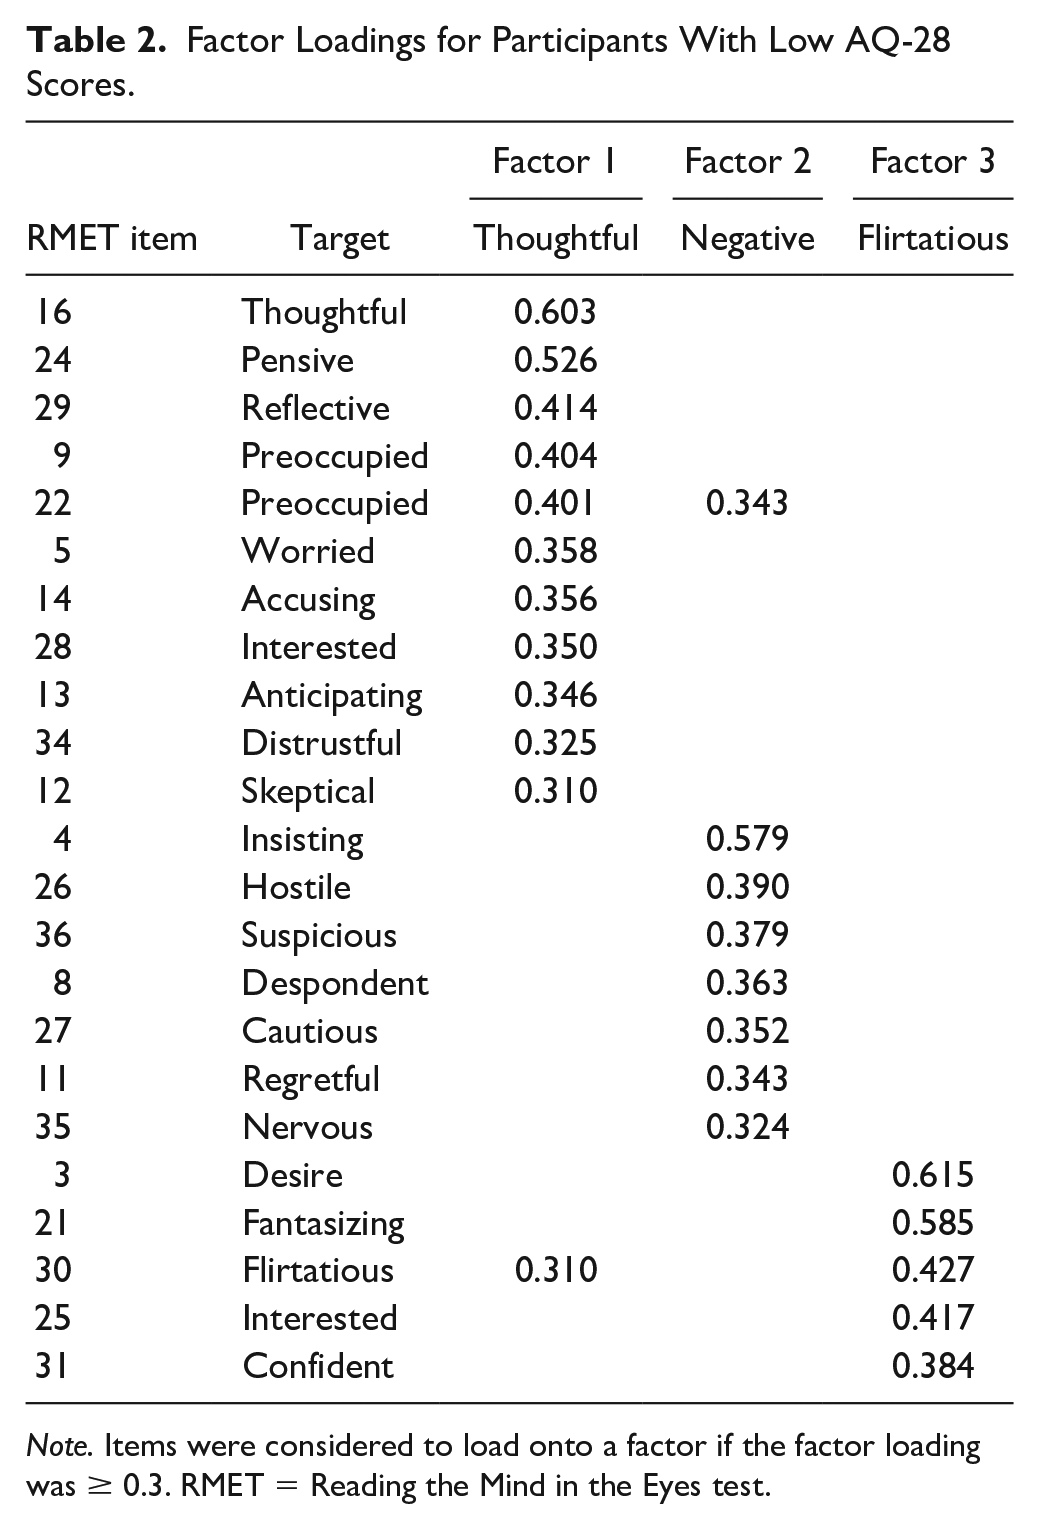
Parallel analysis suggested 13 factors; however, the 13-factor model did not converge. In fact, no factor solution from 1 to 13 resulted in a good model fit. Cattell’s scree plot (Figure S3) indicated a three-factor solution, but all fit measures indicated poor model fit (CFI = .430, TLI = .312, RMSEA = .094, 95% CI [.090-.098], RMSR = .07, BIC = −704, χ2 = 2469, p < .001), 13 items did not load onto any factor, and three items had cross-loadings (see Table 2). The three factors overlapped considerably with the results from the full sample, and conceptually matched the division into thoughtful, negative, and flirtatious factors. The maximum factor loading of .615 was higher than for the full sample. The cumulative variance explained was comparable to the full sample (.19).
Factor Loadings for Participants With Low AQ-28 Scores.
Note. Items were considered to load onto a factor if the factor loading was ≥ 0.3. RMET = Reading the Mind in the Eyes test.
Five items failed to load as expected on to the negative factor. The items “upset” (2), “worried” (5), and “uneasy” (7) did not load on to any factor, while “distrustful” (34), and “sceptical” (12), which loaded onto the negative factor in the full sample, loaded onto the thoughtful factor in the low AQ-28 scores subgroup. In addition, “fantasizing” (6) did not load on to the flirtatious factor.
EFA of RMET Factor Structure in Participants High in Autistic Traits
Scores for the group of participants with AQ-28 scores in the top third ranged from 70 to 102 (M = 76.1, SD = 5.9). This subgroup consisted of 409 (234 female) participants with a mean age of 45.7 (SD = 17.0). Demographics were similar to the full sample (White 74%, Black 10%, Asian 3%, other 5%, and prefer not to answer 5%). The mean RMET score for this subgroup was 23.5 (SD = 5.7). Internal consistency of the RMET was acceptable according to α at .78.
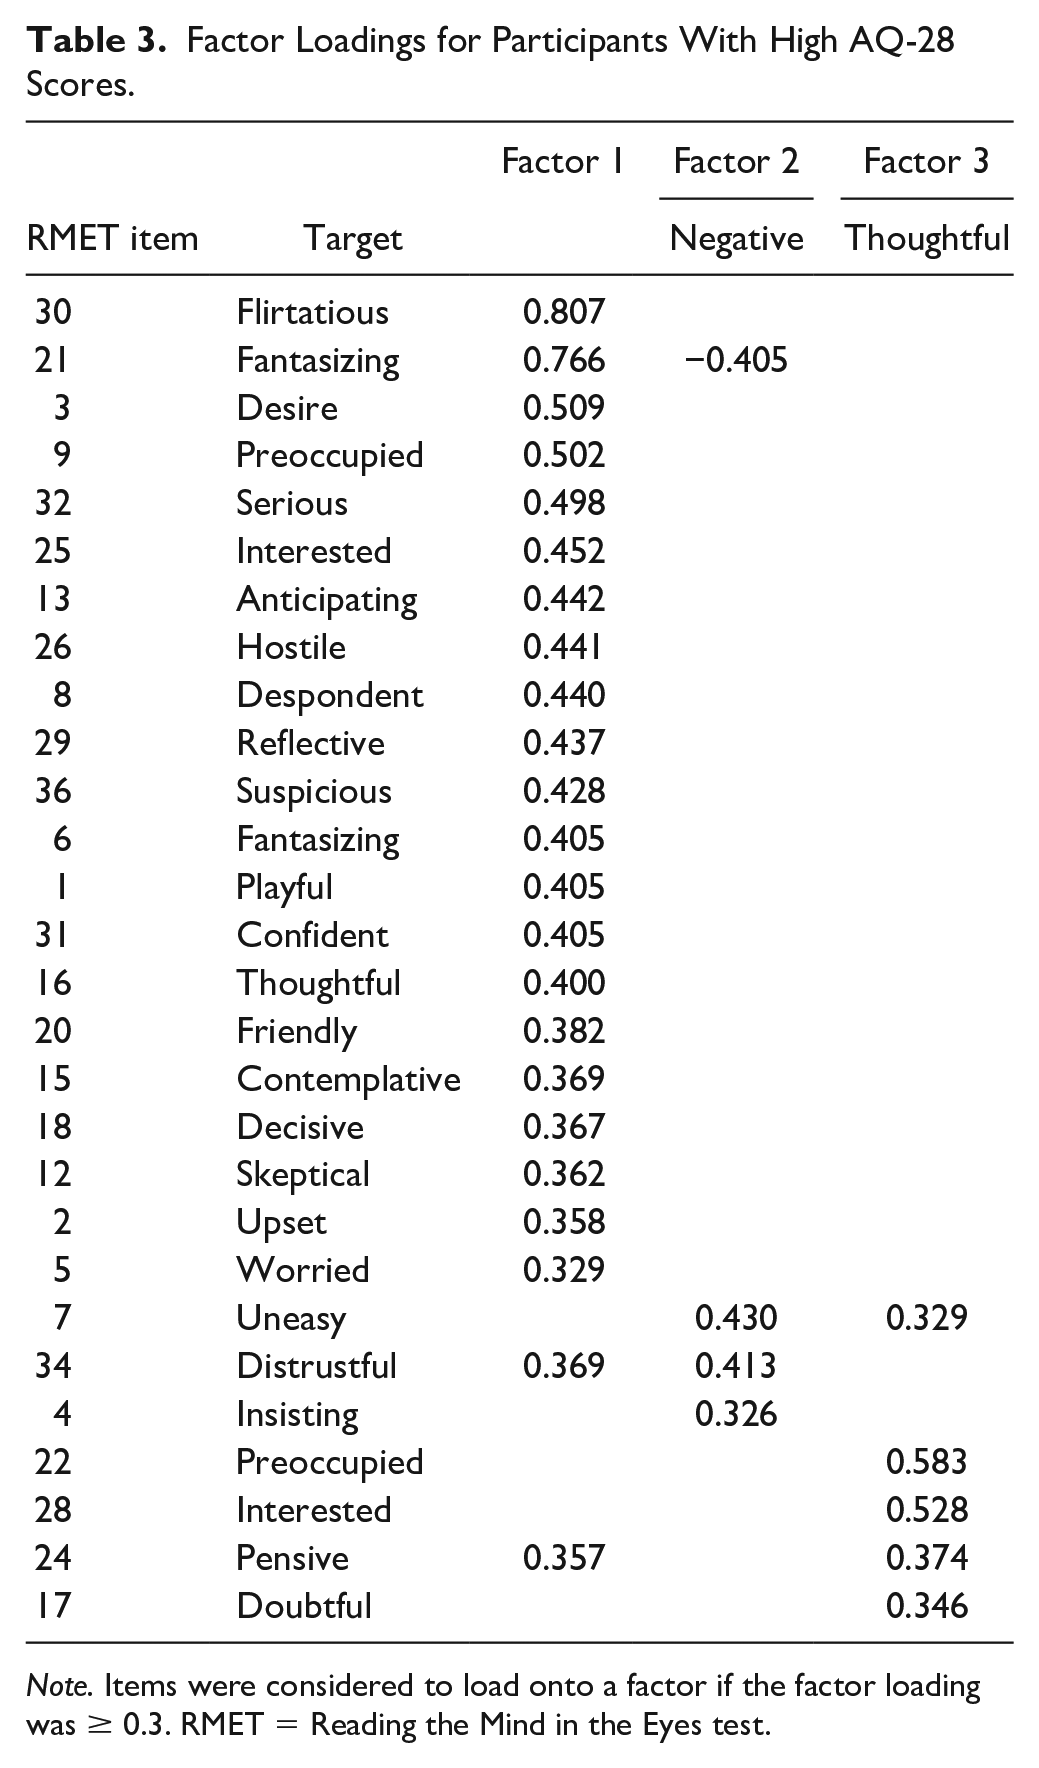
Parallel analysis suggested 14 factors; however, the 14-factor model did not converge. Cattell’s scree plot (Figure S3) indicated a three-factor model, but all fit indices indicated poor model fit (CFI = .486, TLI = .379, RMSEA = .107, 95% CI [.104–.111], RMSR = .07, BIC = −154, χ2 = 3003, p < .001), eight items did not load on to any factor, and four items had cross-loadings on two factors (see Table 3). The high AQ-28 subgroup had the highest maximum factor loading (0.807), and the factor structure for this subgroup was notably different from the full sample and the low AQ-28 subgroup. Factor 1 had 21 items loaded onto it. Factor 2 only had three items, and two of these items had cross-loadings. Factor 3 only had four items, one of which had a cross-loading on Factor 1. The cumulative variance explained was 0.25.
Factor Loadings for Participants With High AQ-28 Scores.
Note. Items were considered to load onto a factor if the factor loading was ≥ 0.3. RMET = Reading the Mind in the Eyes test.
Evaluation of the Construct Validity of the RMET
To assess (a) whether alexithymia traits and/or autistic traits are associated with RMET performance and (b) whether the RMET performance correlates with the IMT, another measure of ToM, we used SEM to evaluate relationships between performance on the RMET and performance on the TAS, AQ-28, and IMT, while controlling for gender (gender has been shown to be associated with performance on the RMET in individuals without an autism diagnosis, Baron-Cohen et al., 2015]). In line with the preregistration, 39 participants who did not complete the IMT were excluded from this analysis, leaving 1,142 (624 female) participants.
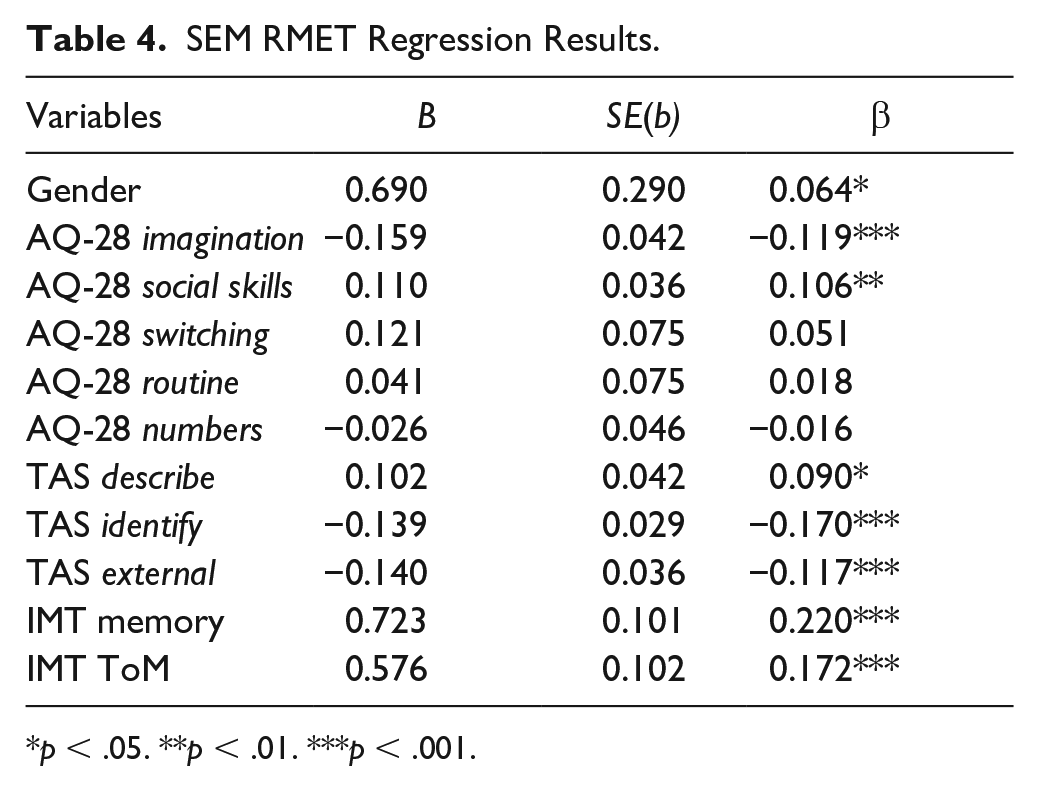
We tested an SEM model with paths to the RMET from gender, TAS subscale scores, the AQ-28 first-order subscale scores, IMT memory scores, and IMT ToM scores. The resulting model had 0 degrees of freedom, indicating a saturated model. This means that model fit could not be evaluated, and the SEM resulted in multiple linear regression of RMET scores on the variables (see Table 4), which indicated that all three TAS subscales and the AQ-28 imagination and social skills subscales correlated with RMET scores as did the IMT memory and ToM scores. AQ-28 total score was not significantly correlated with RMET scores (see Table S3).
SEM RMET Regression Results.
p < .05. **p < .01. ***p < .001.
Discussion
Factor Structure of the RMET
In this study, we evaluated the factor structure of the RMET in a demographically representative U.S. sample of 1,181 participants. We hypothesized that the RMET is a multidimensional measure of ToM ability and conducted EFA to identify the hypothesized multifactorial structure. Consistent with Olderbak et al. (2015), we failed to identify an appropriate factor structure for the RMET. The best statistical model fit was obtained by retaining 12 factors; however, this model was not viable because more than half of the factors only contained a single item, and for those factors that did contain multiple items, there was no obvious conceptual connection between the items. To ensure that we had not missed a well-fitting model due to our decision to use parallel analysis to determine the number of factors to retain, we also tested a three-factor model based on the method of using Cattell’s scree plot to determine the number of factors to retain. This model provided conceptual explanatory power but resulted in poor statistical model fit.
We evaluated the possibility that conducting separate analyses on the data from participants with high versus low levels of autistic traits would result in separate factor structures and a better model fit for both subgroups. While we did find evidence that within our sample the factor structure was different between groups, rather than improving model fit, the fit indices indicated worse fit for both subgroups, and many items failed to load on to any factor.
The failure of this study and previous studies (Black, 2019; Olderbak et al., 2015) to identify a well-fitting factor structure for the RMET raises important questions about the reliability of this measure. Moreover, responses to particular RMET items in our study are of concern. As previously noted, the initial validity of the target mental states in the RMET was based on consensus. Baron-Cohen, Wheelwright, Hill et al. (2001) validated the individual RMET items in a combined sample of 225 participants consisting of Cambridge University students and members of the general public. The cutoff levels for consensus were “arbitrarily selected but with the aim of checking that a clear majority of the normal controls selected the target word and that this was selected at least twice as often as any foil” (Baron-Cohen, Wheelwright, Hill, et al., 2001, p. 244). In our study, eight items (22%) failed to pass one or both of the original criteria for retention in the test (i.e., <50% of participants selecting the target and >25% of participants selecting the same incorrect foil). While it is very rare for studies to provide a breakdown of target and foil response rates for individual RMET items, those studies that have done so regularly find that some RMET items do not meet these criteria (e.g., Eddy & Hansen, 2020; Olderbak et al., 2015; Prevost et al., 2014; Van Staden & Callaghan, 2021). We suggest that in future studies, researchers using the RMET should report which items within their sample meet these criteria and provide raw data so that other researchers can explore further validity checks.
Do Levels of Autistic Traits or Alexithymic Traits Correlate Most Strongly With RMET Scores?
The third primary aim of this study was to assess the construct validity of the RMET by evaluating whether performance on the test is better explained by levels of autistic traits or alexithymic traits and whether performance correlates with another measure of ToM. Due to the limitations that we identified with the RMET in the factor analyses, we recommend caution in drawing inferences from these analyses.
We predicted that both autistic traits as indexed by the AQ-28 and alexithymic traits as indexed by the TAS would negatively correlate with RMET scores but that the relationship between RMET scores and AQ-28 scores would no longer be significant after controlling for TAS scores. This pattern of results would suggest that the poorer performance of individuals with high levels of autistic traits on the RMET more likely results from emotion recognition deficits associated with alexithymic traits than ToM deficits associated with autistic traits. We found that AQ-28 total scores did not correlate with RMET scores, even prior to controlling for TAS scores. This result is consistent with Oakley et al.’s (2016) finding that TAS scores are more predictive of RMET performance than AQ scores. However, looking at the subscales of the AQ-28 revealed a more complicated relationship. Two of the AQ-28 subscales, imagination and social skills, did correlate with RMET scores, but in opposite directions. Unexpectedly, the social skills subscale positively correlated with RMET scores, indicating that RMET scores increased with an increase in autistic traits related to social skills. In contrast, the imagination subscale correlated negatively with RMET scores.
We also hypothesized that AQ-28 scores, but not TAS scores, would correlate with the IMT ToM scores. However, we found the opposite result with TAS scores, but not AQ-28 scores, correlating with IMT ToM scores. One potential limitation of the IMT is that participants do not have access to the text when they are answering the questions. Thus, while the task provides both memory and ToM scores, both scores rely on memory ability, which may confound the results.
Does Comfort Viewing Eyes Impact RMET Performance
We found that comfort viewing eye stimuli was positively correlated with RMET scores. That is, people who reported feeling more comfortable looking at the images of the eyes tended to score higher on the RMET. A detailed description of these analyses is provided in Part 2, section 2 of the Supplemental Materials. It is important to note that our measure of comfort viewing the eye stimuli was an ad hoc, single-item, self-report measure designed for this study. However, if researchers continue to use the RMET, our results indicate that further research should be conducted to determine the impact that comfort viewing eye stimuli has on RMET performance.
Conclusion
The RMET is a widely used measure of ToM ability in a variety of clinical and nonclinical populations. Despite being widely reported to be a well-validated tool, there is little empirical evidence to support this assertion, and converging evidence from the present study and other studies (Black, 2019; Kittel et al., 2021; Olderbak et al., 2015) raises considerable doubts about the reliability and validity of the RMET as a measure of ToM. Of particular concern, we failed to identify a well-fitting unidimensional or multidimensional factor model for the RMET suggesting that there are no discrete, consistent factors driving RMET response patterns.
Considering these issues, we suggest that the RMET may not be apt as a measure of ToM. The psychometric difficulties that come with the RMET indicate that past conclusions may need to be revised, and researchers should consider these issues before using the RMET or citing the conclusions of studies that use the RMET. The ongoing widespread use of the test despite evidence of its psychometric shortcomings is puzzling and may indicate insufficient attention being paid to measurement validity. Such “measurement schmeasurement” attitudes result in the use of measures without the provision of adequate evidence of their validity. This is a pervasive problem in psychology research, which threatens to undermine the validity of research conclusions (Flake & Fried, 2020).
Supplemental Material
sj-docx-1-asm-10.1177_10731911221124342 – Supplemental material for The “Reading the Mind in the Eyes” Test Shows Poor Psychometric Properties in a Large, Demographically Representative U.S. Sample
Supplemental material, sj-docx-1-asm-10.1177_10731911221124342 for The “Reading the Mind in the Eyes” Test Shows Poor Psychometric Properties in a Large, Demographically Representative U.S. Sample by Wendy C. Higgins, Robert M. Ross, Robyn Langdon and Vince Polito in Assessment
Footnotes
Declaration of Conflicting Interests
The author(s) declared no potential conflicts of interest with respect to the research, authorship, and/or publication of this article.
Funding
The author(s) disclosed receipt of the following financial support for the research, authorship, and/or publication of this article: W.C.H. was supported by an Australian Government Research Training Program (RTP) Scholarship, a Macquarie University Research Excellence Scholarship, and a Macquarie University Cognitive Science Postgraduate Grant. V.P. was supported by a Macquarie University Research Fellowship. And R.M.R. was supported by the Australian Research Council (DP180102384) and a Macquarie University Research Fellowship.

Supplemental Material
Supplemental material for this article is available online.
Notes
References
Supplementary Material
Please find the following supplemental material available below.
For Open Access articles published under a Creative Commons License, all supplemental material carries the same license as the article it is associated with.
For non-Open Access articles published, all supplemental material carries a non-exclusive license, and permission requests for re-use of supplemental material or any part of supplemental material shall be sent directly to the copyright owner as specified in the copyright notice associated with the article.
