
Abstract
The study of individual differences in emotion regulation has typically focused exclusively either on the stage of the emotion generation process at which regulation occurs or on the engagement versus disengagement orientation of the regulation efforts. We introduce a new measure that samples equally across each stage of the process model of emotion regulation and from both engagement and disengagement orientations. Through five studies (ntotal = 2,543), we present the development and convergent, discriminant, and predictive validity evidence for the Process Model of Emotion Regulation Questionnaire (PMERQ). We show the final 10-scale 45-item questionnaire has acceptable internal consistency, is invariant between genders and across the age range, and has sufficient convergent and discriminant validity. The PMERQ also predicts affective and relationship functioning with strategies occurring earlier in the process model generally showing the strongest effects. We propose the PMERQ is a valuable measure to assess individual differences in the use of emotion regulation strategies.
The frequent use or avoidance of specific emotion regulation strategies can have long-term cumulative effects on our functioning and well-being. For example, frequently suppressing one’s emotions has been shown to increase psychological distress (Hatzenbuehler et al., 2009), whereas emotional expression is related to greater positive affect (Kashdan & Breen, 2008). While research on individual differences in emotion regulation is not new (e.g., Gross & John, 2003), much remains to be learned (Gross, 2015). One impediment to further progress is the difficulty of measuring individual differences in emotion regulation strategy use in a sufficiently comprehensive manner. According to the process model of emotion regulation, regulation strategies have different impacts depending on the specific stage of the emotion generation process at which regulation occurs (Gross, 2015). Most existing measures of individual differences in emotion regulation (e.g., Garnefski & Kraaij, 2007) or coping (e.g., Carver et al., 1989) do not represent each of the five theoretically posited stages (although see Guassi Moreira et al., 2021 for one that is approaching this goal). In the present article, we introduce a short yet comprehensive measure that assesses individual differences in the use of specific emotion regulation strategies at each stage of the process model.
In addition to the strategy stage, the new measure also distinguishes between the engagement and disengagement orientation of the strategy (e.g., Compas et al., 2001). Engagement strategies involve physically or mentally approaching the stimuli that have elicited the to-be-regulated emotion or some of its components, whereas disengagement strategies involve distancing from the stimuli or components of the to-be-regulated emotion. Research into engagement and disengagement strategies often does not consider the strategy stage, and when both are considered, they tend to be confounded (e.g., Sheppes et al., 2011), which means that the specific role of the strategy stage or orientation is unclear. The instrument presented here enables one to tease apart these two aspects of emotion regulation.
Strategy Stage
Emotions unfold over time, typically following a general sequence beginning with a situation, followed by attention to the situation, an appraisal of the situation, and a response. This response often affects the situation that initially gave rise to the emotion, and the cycle continues in what is referred to as a “modal model” of emotion (Gross, 2015). At each stage in this emotion-generative sequence, one can intervene to change the emotion. The goal can be to increase positive emotion, decrease negative emotion, or also, though less common, decrease positive emotion or increase negative emotion (Tamir, 2016). Actions taken to alter one or more aspects of emotion are referred to as emotion regulation strategies (Barrett et al., 2007; Gross, 1998, 2015).
The process model of emotion regulation identifies five families of emotion regulation strategies based on their relation to the emotion-generative sequence of situation, attention, appraisal, and response (see Figure 1). The first strategy family, situation selection, involves preemptive action regarding the situation, such as actively confronting or avoiding it (Aspinwall & Taylor, 1997). The second, situation modification, involves reactive action regarding the situation such as resolving or sidestepping problems (e.g., conflicts). The third, attentional deployment, involves changing one’s attention to the situation, such as directing attention away from certain information and toward other information, depending on how that information makes one feel (Gross, 1998). The fourth, cognitive change, involves changing how one thinks about the current situation to alter how one feels about it (Uusberg et al., 2019). Finally, response modulation occurs after the emotion has been generated and involves changing components of the generated emotion such as subjective feelings, physiological arousal, and expressive behaviors.
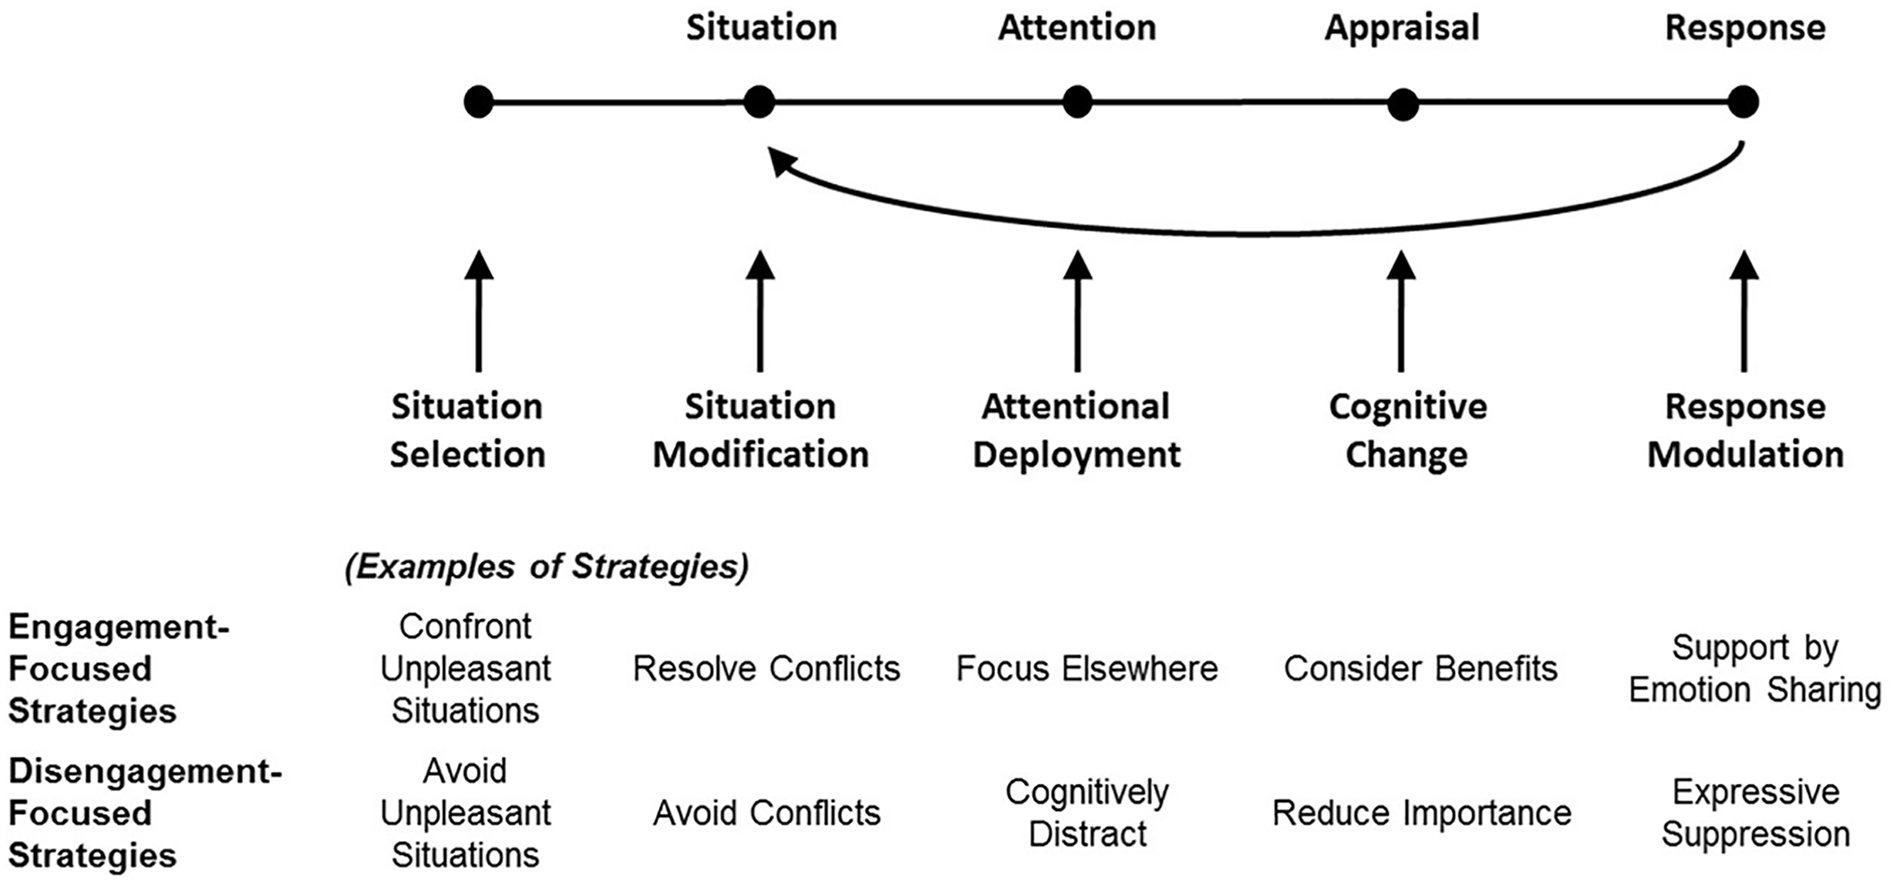
Illustration of the Process Model of Emotion Regulation with examples of specific emotion regulation strategies at each stage, as organized between an engagement- or disengagement focus.
According to the process model, strategies occurring earlier in the sequence tend to have a stronger impact on the emotion being regulated than those occurring later in the emotion-generative process (Gross, 1998). For example, frequent use of the cognitive change strategy of cognitive reappraisal was found to be better for one’s well-being and interpersonal functioning, relative to the response modulation strategy of expressive suppression (Gross & John, 2003). However, the stage at which a strategy intervenes with emotion generation is not sufficient for understanding its effects on well-being. For instance, a meta-analysis of the last three stages of the process model showed the effectiveness of each stage was highly dependent on the specific strategy, suggesting that other factors are at play (Webb et al., 2012). One such factor may be whether the emotion regulation strategy has an engagement versus a disengagement orientation.
Strategy Orientation
The distinction between engagement- and disengagement-oriented regulation strategies arises from research on coping. Engagement-oriented coping strategies are focused on dealing with the stressor and/or dealing with the emotions resulting from the stressor. Disengagement-oriented strategies, in contrast, are focused on avoiding the stressor and/or avoiding the emotions resulting from the stressor (Carver, 2011). This distinction can be generalized to the process model, whereby engagement-oriented emotion regulation strategies involve actions that approach core aspects of the stage in the emotion-generation sequence that a strategy seeks to alter, while disengagement-oriented emotion regulation strategies involve actions that avoid or withdraw from core aspects of the given stage.
Strategy orientation is associated with several aspects of well-being. In general, engagement-oriented strategies, such as confronting unpleasant situations (Livingstone & Isaacowitz, 2015), resolving conflicts (Marchand, 2004), and seeking emotional support from others (Kato, 2015), are associated with higher well-being and lower ill-being. Engagement-oriented strategies are also associated with better relationship functioning. For example, positive reappraisal and seeking emotional support are associated with lower feelings of loneliness (Preece et al., 2021), and sharing one’s emotions predicts greater feelings of connection and relationship satisfaction (Cameron & Overall, 2018). In contrast, disengagement-oriented strategies, such as avoiding conflict (Birditt et al., 2015), and suppressing the expression of emotion (Gross & John, 2003) are associated with lower well-being and higher ill-being. Likewise, general withdrawal is associated with poorer relationship functioning (Cameron & Overall, 2018), while suppressing expressions of emotion and blaming others are associated with higher feelings of loneliness (Cameron & Overall, 2018; Preece et al., 2021).
The Present Research
The present research aims to develop and validate a comprehensive measure of emotion regulation strategies. Specifically, we present the development of a new questionnaire to assess emotion regulation strategies across the process model, equally balanced by an engagement- and disengagement orientation. The first three studies focus on the development of the questionnaire, including choices of subscales and item wording.
The next two studies looked at the convergent, discriminant, and predictive validity of the scale, both in general and in response to the COVID-19 pandemic. To estimate convergent validity, we analyzed PMERQ correlations with a broad set of existing measures of emotion regulation and coping. We expected the subscales of the PMERQ to be positively related to conceptually related subscales of existing measures. To estimate divergent validity, we analyzed PMERQ correlations with social desirability and personality traits. To estimate predictive validity, we analyzed the correlations between the PMERQ and outcome variables indicating levels of well-being, ill-being, and relationship functioning. We expected to find significant relationships between emotion regulation strategies and indicators of well-being, ill-being, and relationship functioning.
Finally, using data from the last two studies, we also illustrate the value of simultaneously distinguishing the emotion regulation stage and regulation orientation. We tested several predictions that arise from the literature reviewed above. First, we tested if frequent use of engagement-oriented strategies would be positively related to well-being, negatively related to ill-being, and positively related to better relationship functioning. Likewise, we tested if frequent use of disengagement-oriented strategies would be negatively related to well-being, positively related to ill-being, and positively related to poorer relationship functioning. Finally, in line with theoretical expectations surrounding the process model, we tested whether those strategies occurring earlier in the emotion-generative process would have a stronger relation to both well- and ill-being, relative to those strategies occurring later.
Study 1—Initial Scale Derivation
Our goal was to identify a range of emotion regulation strategies for each emotion regulation stage and to produce an initial set of items for each strategy. To this end, we sought to populate each stage with specific strategies evident in the literature. Through a review of the literature (Gross, 1998, 2015; Gross & Thompson, 2007; Livingstone & Srivastava, 2012; Peña-Sarrionandia et al., 2015; Vitaliano et al., 1985; Webb et al., 2012), we identified 22 proposed emotion regulation strategies ranging across the process model:
Method
Sample
A sample of 152 persons was recruited on Mturk and paid US$2.00 as compensation; eight persons were removed 1 resulting in a final sample of 144 persons. Participants were on average 33.0 years (SD = 10.04), with 64.6% self-identified as female, 66.7% White, 11.8% Black, 20.8% Asian, and 3.4% other. The majority said they were native English speakers (89.6%), and most (98.6%) could speak English well or very well, with 17.4% having completed high school or an equivalent degree, 9.7% with a trade certificate or similar degree, 61.1% with a bachelor’s degree, and 11.1% with a graduate degree. Due to a technical error, the location of the participants was not recorded; however, others have shown the vast majority of Mturk workers live in the United States and Canada (e.g., Peer et al., 2017).
This study, and the following studies, was conducted according to the ethical guidelines for online studies of the German Society for Online Research (Deutsche Gesellschaft für Online-Forschung, 2007) and per the local legislation. Consent of each participant was requested in digital form on the first page of the survey and the anonymity of participants was guaranteed. In addition, for this study and the following studies, we report how we determined our sample size, all data exclusions, all manipulations, and all measures in the study.
Procedure
Participants completed the full set of subscales with the response options ranging from 1 = strongly disagree to 7 = strongly agree (see Supplemental Material for the scale).
Results
All of the subscales had acceptable internal consistency (Cronbach’s α estimates ranged from .61 to .97). However, when we estimated confirmatory factor analysis measurement models for each scale, using ML and the lavaan package in R 2 (Rosseel, 2012), in many instances a single latent construct was insufficient for modeling the relation between items, indicating there was additional unexplained variance. In addition, the mean score for substance use was very low indicating a low frequency of use. Finally, in a series of exploratory factor analyses and a conceptual review of the scales and the individual items, we found that, because the scales sampled different regulation goals, this added unnecessary variance to the scale.
We identified several necessary revisions. First, we decided to exclude scales that asked about the upregulation of positive affect (i.e., focus on the positive, positive reappraisal) or the upregulation of negative affect (i.e., rumination) and focus the remaining analyses on scales that oriented participants to the downregulation of negative affect. In addition, we removed situation prediction because it was unclear whether it sufficiently represented the situation selection stage of emotion regulation, and added confrontation, to represent an engagement-oriented strategy at this stage. Within cognitive change, we decided to revise the scales of challenge appraisal, self-efficacy appraisal, and downward social comparison to expectancy, accountability, and desirability, to capture the proposed components of reappraisal (Uusberg et al., 2019). In addition, within response modification, we removed verbal/physical aggression, food, and exercise because we thought the construct coverage was too wide. Finally, most questions were revised so that each question clearly oriented the reader to the downregulation of negative affect (e.g., “When I want to feel less bad. . .”) and to remove potential redundancy with other items of that subscale.
The revised scale now included 17 subscales. For situation selection, the scales were: (a) confrontation and (b) avoidance. For situation modification, they were: (c) support seeking, (d) problem-focused coping, and (e) conflict resolution. For attentional deployment, they were: (f) cognitive distraction and (g) mindfulness. For cognitive change, they were (h) desirability, (i) denial, (j) self-distancing, (k) acceptance, (l) accountability, and (m) self-efficacy appraisal. For response modification, they were (n) emotion sharing, (o) substance use, (p) expressive suppression, and (q) relaxation techniques.
Study 2—Further Scale Development
In this study, we further investigated the psychometric properties of the revised questionnaire. Our goal was to identify an internally consistent set of items and to conduct a preliminary investigation into the general factor structure of the scales.
Method
Sample
We recruited 814 participants across the age range and evenly divided between males and females, through Prolific Academic with a payment of £4.00 each. After applying preregistered cleaning procedures (see Note 1), the final sample was n = 640 (aged 18–80, M = 41.0, SD = 14.4), with 50.3% female. Participants were 94.4% White, 2.2% Black, 2.5% Asian, and 2.7% other. All participants could speak English “very well,” with 97% native English speakers, 84% living in a predominantly English-speaking country (e.g., England), 30.5% having completed high school or an equivalent degree, 22.5% with a trade certificate or similar degree, 33.6% with a bachelor’s degree, and 12.7% with a graduate degree.
Procedure
Participants completed the revised scale, which included seven to 10 questions for each subscale (127 questions in total). The midpoint response option was excluded (Simms et al., 2019; Weems & Onwuegbuzie, 2001), and each item was rated using a 6-point Likert-type scale (strongly disagree to strongly agree; see Supplemental Material for the scale). Participants also completed a measure asking about the regulation of others’ emotions (MacCann et al., 2022).
Results
First, we evaluated each subscale and chose a final set of items that met the following criteria: (a) When modeled in one-factor confirmatory factor analysis, each model had a good fit to the data as indicated by a comparative fit index (CFI) ≥ .90 (we also report the root mean square error of approximation [RMSEA], although we did not incorporate this estimate in our decisions because it is known to be untrustworthy with models with a low number of degrees of freedom (Kenny et al., 2015)); (b) no correlations were needed between item residuals; and (c) the latent factor had adequate factor saturation, as indicated by McDonald’s Omega hierarchical (McDonald, 1999).
With these pruned item sets, we estimated scale-level averages for each subscale, looked at scale-level distributions, and correlated the scales. We also conducted a series of exploratory factor analyses and evaluated several theoretically derived structures in confirmatory factor analysis (e.g., single factor, separate factors for each emotion regulation stage, separate factors for engagement and disengagement scales).
We found the data generally fit a structure with separate factors for each emotion regulation stage and factors for engagement orientation and disengagement orientation. These factors were largely orthogonal, or weakly correlated, with one another. However, some scales had unexpected loadings patterns (e.g., expressive suppression and relaxation techniques loaded positively on the engagement- and disengagement factors). Other scales, namely, support seeking and emotion sharing, were so strongly correlated as to suggest they should be a single scale. Finally, we found substance abuse again had a low prevalence in the sample.
The data seemed to largely support both separate dimensions for the regulation stage and the regulation orientation. We decided to revise the scale again to better embrace that factor structure and to specifically sample an engagement- and disengagement-oriented emotion regulation strategy within each stage of the process model.
First, we created a new scale, called “Support by Emotion Sharing,” that was based on items of support seeking and emotion sharing, because the two were so strongly correlated, and revised the items so that they clearly matched the response modulation family. Second, we replaced problem-focused coping with conflict avoidance, to provide a disengagement-oriented balance to conflict resolution. Third, we excluded mindfulness because we decided it was too broad and not exclusively focused on the downregulation of negative affect. Instead, we added focus elsewhere as an engagement-oriented attentional deployment strategy that would balance cognitive distraction.
From the cognitive change stage, we excluded denial because we thought participants may lack sufficient conscious access to this behavior to reliably report it. We also excluded self-efficacy and acceptance because a closer review deemed their items as insufficiently focused on the downregulation of negative affect. Rather, the cognitive change strategies were revised in light of models suggesting the family may be further differentiated into (a) reconstrual, when people change something about the way they mentally represent the situation or (b) repurposing, when people change something about the motivational concerns that are used to evaluate the situation (Uusberg et al., 2019). Within each kind of cognitive change, we added an engagement- and a disengagement-oriented scale. Finally, we excluded relationship techniques because it did not clearly match a specific strategy stage or orientation. All items were revisited and edited to ensure they effectively met the construct description of the scale.
The new PMERQ included 12 scales. With the scales oriented toward engagement or disengagement respectively, they were: situation selection: (a) confront unpleasant situations, (b) avoid unpleasant situations; situation modification: (c) resolve conflicts, (d) avoid conflicts; attentional deployment: (e) focus elsewhere, (f) cognitively distract; cognitive change through reconstrual: (g) realize coping potential, (h) question interpretation; cognitive change through repurposing: (i) consider benefits, (j) reduce importance; response modification: (k) support by emotion sharing, (l) expressive suppression.
Study 3—Finalize PMERQ Scale
In this study, we evaluated the psychometric properties of the new scales and sought to identify an internally consistent set of items for each subscale that was invariant between genders and age groups.
Method
Sample
A sample of 779 persons was recruited on Prolific Academic and paid £1.88 each. We specifically sampled participants across the age range and evenly divided between males and females. After applying the previous sets of data cleaning procedures, the final sample was n = 744 (ages 18 to 92, M = 45.8, SD = 16.8) with 52.0% female, 87.6% White, 7.9% Black, 4.0% Asian, and 3.9% other. All participants were living in the United States at the time of the study (99% were native English speakers), and all participants could speak English well or very well, with 27.8% having completed high school or an equivalent degree, 16.7% with a trade certificate or similar degree, 34.1% with a bachelor’s degree, and 21.0% with a graduate degree.
Procedure
Participants completed the revised questionnaire, which included six to eight items for each of the 12 subscales with 83 questions in total (see Supplemental Material for the scale).
Results
We again evaluated each subscale and chose a final set of items that met the following criteria: (a) when modeled in confirmatory factor analysis, the model had a good fit to the data (Table 1); (b) no correlations were needed between item residuals, and (c) the latent factor had adequate factor saturation according to Omega Hierarchical. In addition, we selected items so that: (d) there was strong measurement invariance between men and women and (e) between younger (40 years or less) and older (41+ years) adults (see Supplemental Material for details).
Scale Properties of the Final Version of the Process Model of Emotion Regulation Questionnaire (PMERQ).
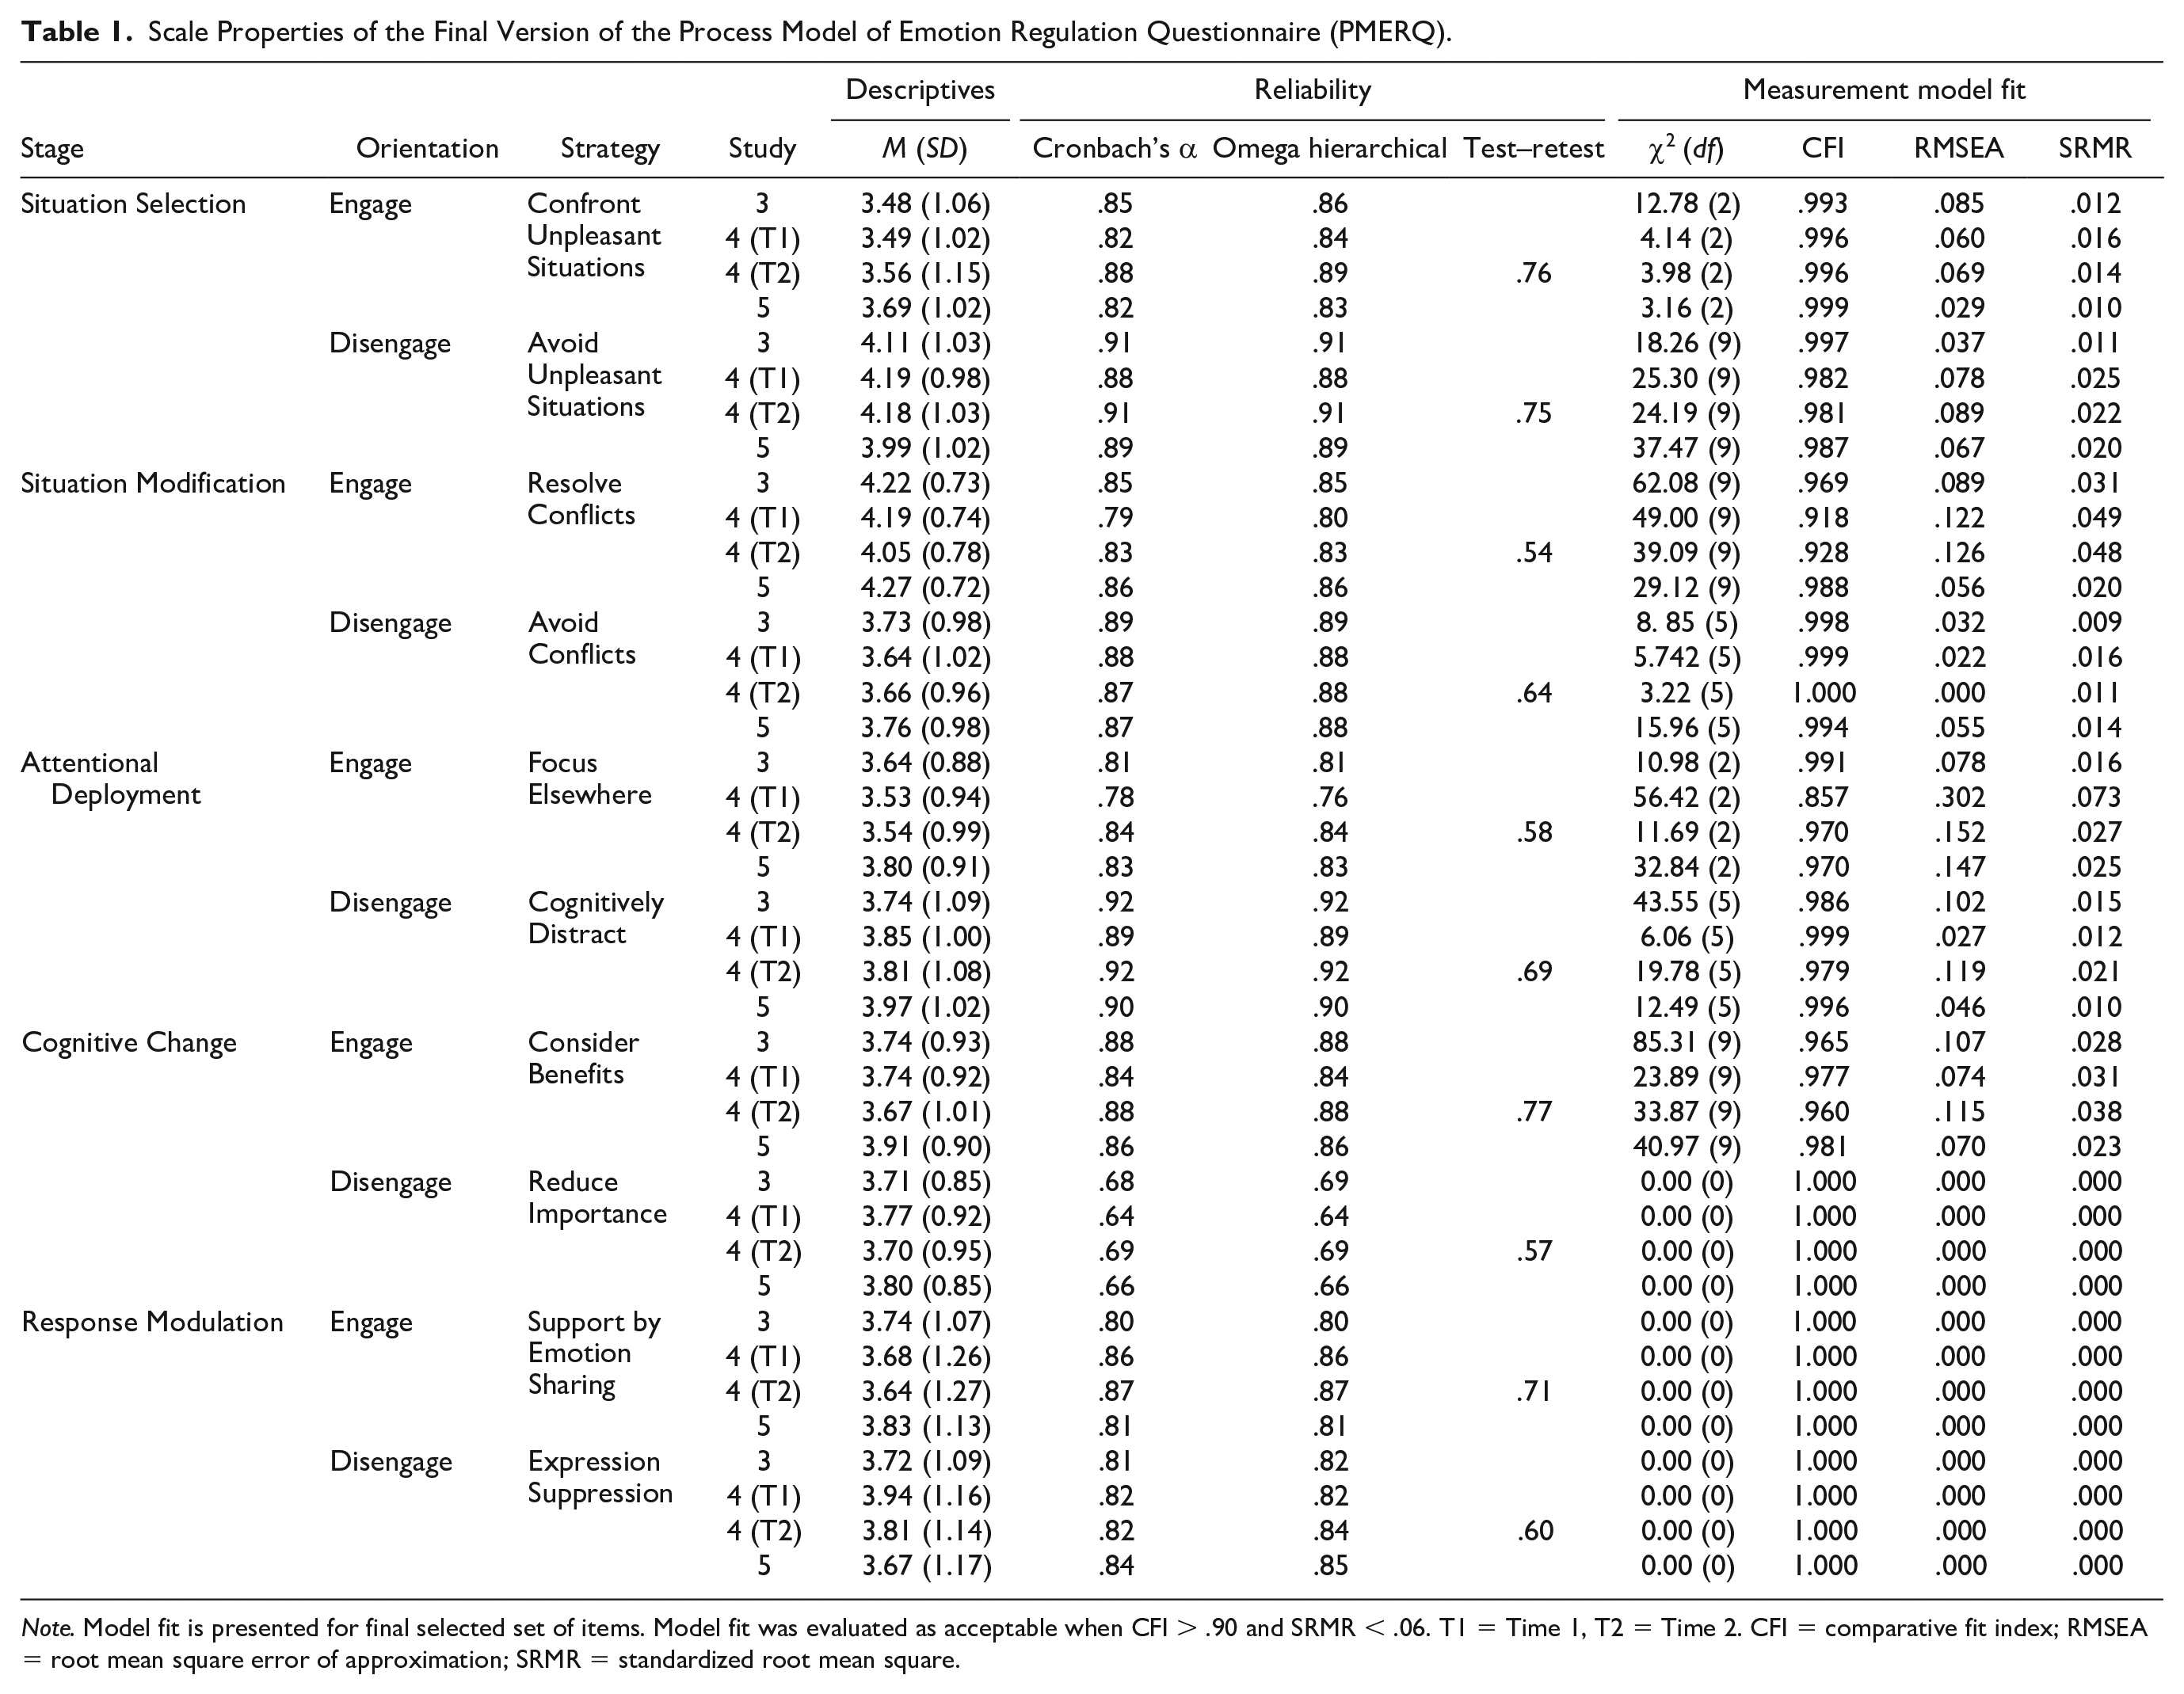
Note. Model fit is presented for final selected set of items. Model fit was evaluated as acceptable when CFI > .90 and SRMR < .06. T1 = Time 1, T2 = Time 2. CFI = comparative fit index; RMSEA = root mean square error of approximation; SRMR = standardized root mean square.
With a final item set, we estimated a single confirmatory factor analysis where each scale was modeled as a latent variable and allowed to correlate with the other scales. Because two items from separate scales were strongly related to each other, indicating the possibility of an additional factor, they were removed (Worthington & Whittaker, 2006), and the aforementioned criteria were again reassessed and confirmed. The model fit the data well, χ2(1,418) = 3523.49, p < .001, CFI = .913, RMSEA = .045, standardized root mean square (SRMR) = .061. Most scales were significantly correlated with one another and all correlations were significantly different from 1.0, 3 indicating sufficient discriminant validity between the scales (Wilhelm et al., 2010).
Having established that the retained items reflect a consistent set of separate latent variables, we turned to testing whether these variables align with the intended structure of the emotion regulation stage crossed with disengagement/engagement orientation. To this end, we modeled the data with an additional second-order latent factor predicting the engagement-oriented scales and an orthogonal second-order factor predicting the disengagement-oriented scales. Scales belonging to one emotion regulation stage were allowed to correlate (see Figure 2). The model had a poor fit to the data, χ2(1,462) = 4540.00, p < .001, CFI = .873, RMSEA = .053, SRMR = .135, suggesting further changes were needed.
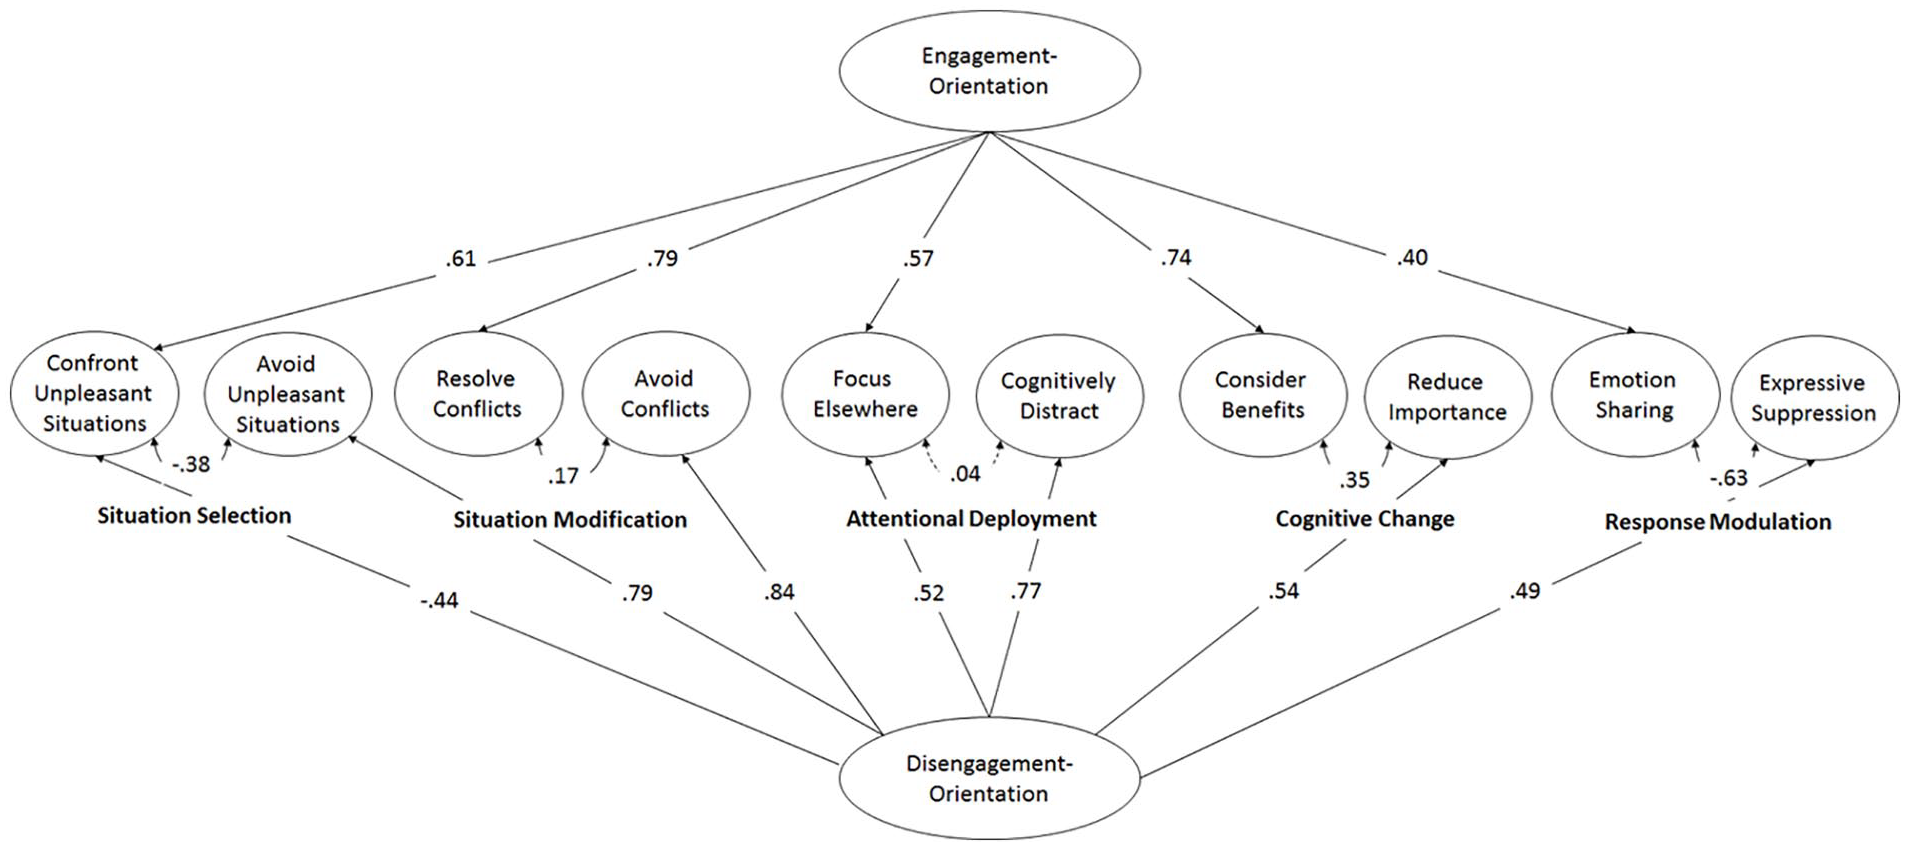
Study 3: Illustration of the best fitting measurement model of the Process Model of Emotion Regulation Questionnaire (PMERQ).
After investigating the modification indices, we decided to remove one item from focus elsewhere and one item from reduce importance to improve the conceptual alignment of these scales. We also allowed the engagement-oriented scales of focus elsewhere and confront unpleasant situations to be simultaneously predicted by the disengagement-oriented factor. Finally, we removed two scales from the cognitive change stage. Specifically, we removed the disengagement-oriented scale of question interpretation, as it was only positively related to the disengagement-oriented factor. It also had a strong correlation with other cognitive change scales suggesting it was relatively redundant. To maintain symmetry and keep two scales per each regulation stage, we also excluded the engagement-oriented cognitive change scale of coping potential, which also had relatively high correlations with the retained scales.
With the remaining 10 scales and 45 items, the model with orthogonal engagement- and disengagement-oriented factors and correlations between the strategies of the same emotion regulation stage had an acceptable fit to the data, χ2(928) = 2,346.21, p < .001, CFI = .926, RMSEA = .045, SRMR = .073. In this model, all scales matched their intended orientation, except for Focus Elsewhere, which was positively related to both the engagement-oriented and disengagement-oriented factors (see Figure 2). Likewise, we found shared variance between scales of the same emotion regulation stage, except for the attentional deployment scales. Correlations between the final set of subscales and item sets are presented in Table 2, χ2(900) = 2,069.70, p < .001, CFI = .939, RMSEA = .042, SRMR = .050.
Study 3 and 5: Correlations Between the Process Model of Emotion Regulation Questionnaire (PMERQ) Subscales When Modeled as Latent Factors.
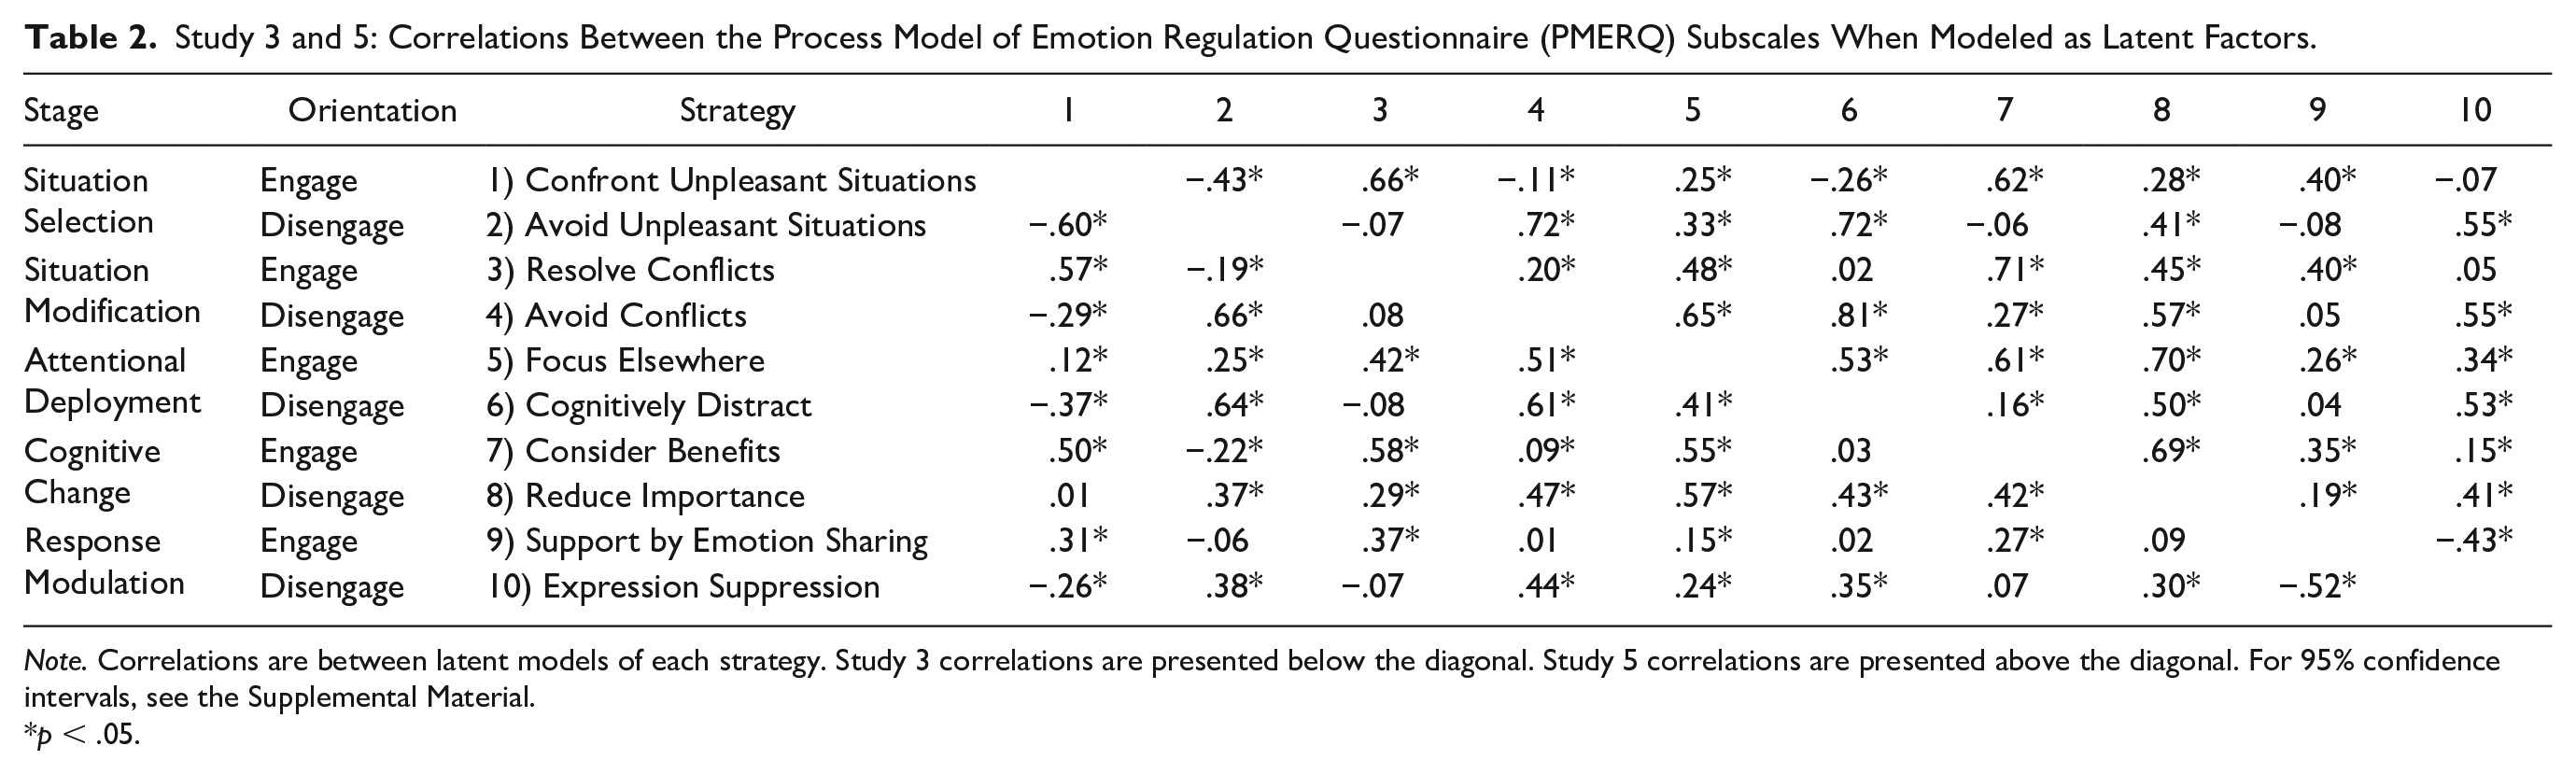
Note. Correlations are between latent models of each strategy. Study 3 correlations are presented below the diagonal. Study 5 correlations are presented above the diagonal. For 95% confidence intervals, see the Supplemental Material.
p < .05.
Conclusion
The final set of items, referred to now as the PMERQ, included 10 scales with 45 items in total (see Table 3). We concluded that the PMERQ sufficiently sampled strategies across the process model stages and with an engagement- and disengagement-orientation. The PMERQ includes two subscales for each stage of the process model, with one subscale assessing an engagement-oriented strategy and one subscale assessing a disengagement-oriented strategy. Thus, there are five engagement-oriented scales and five disengagement-oriented scales. For a description of each subscale, see Table 3. We showed each scale has sufficient psychometric properties, sufficient discriminant validity from the other strategies, sufficient internal consistency, and measurement invariance across gender and age.
Overview of the Final Version of the Process Model of Emotion Regulation Questionnaire (PMERQ).
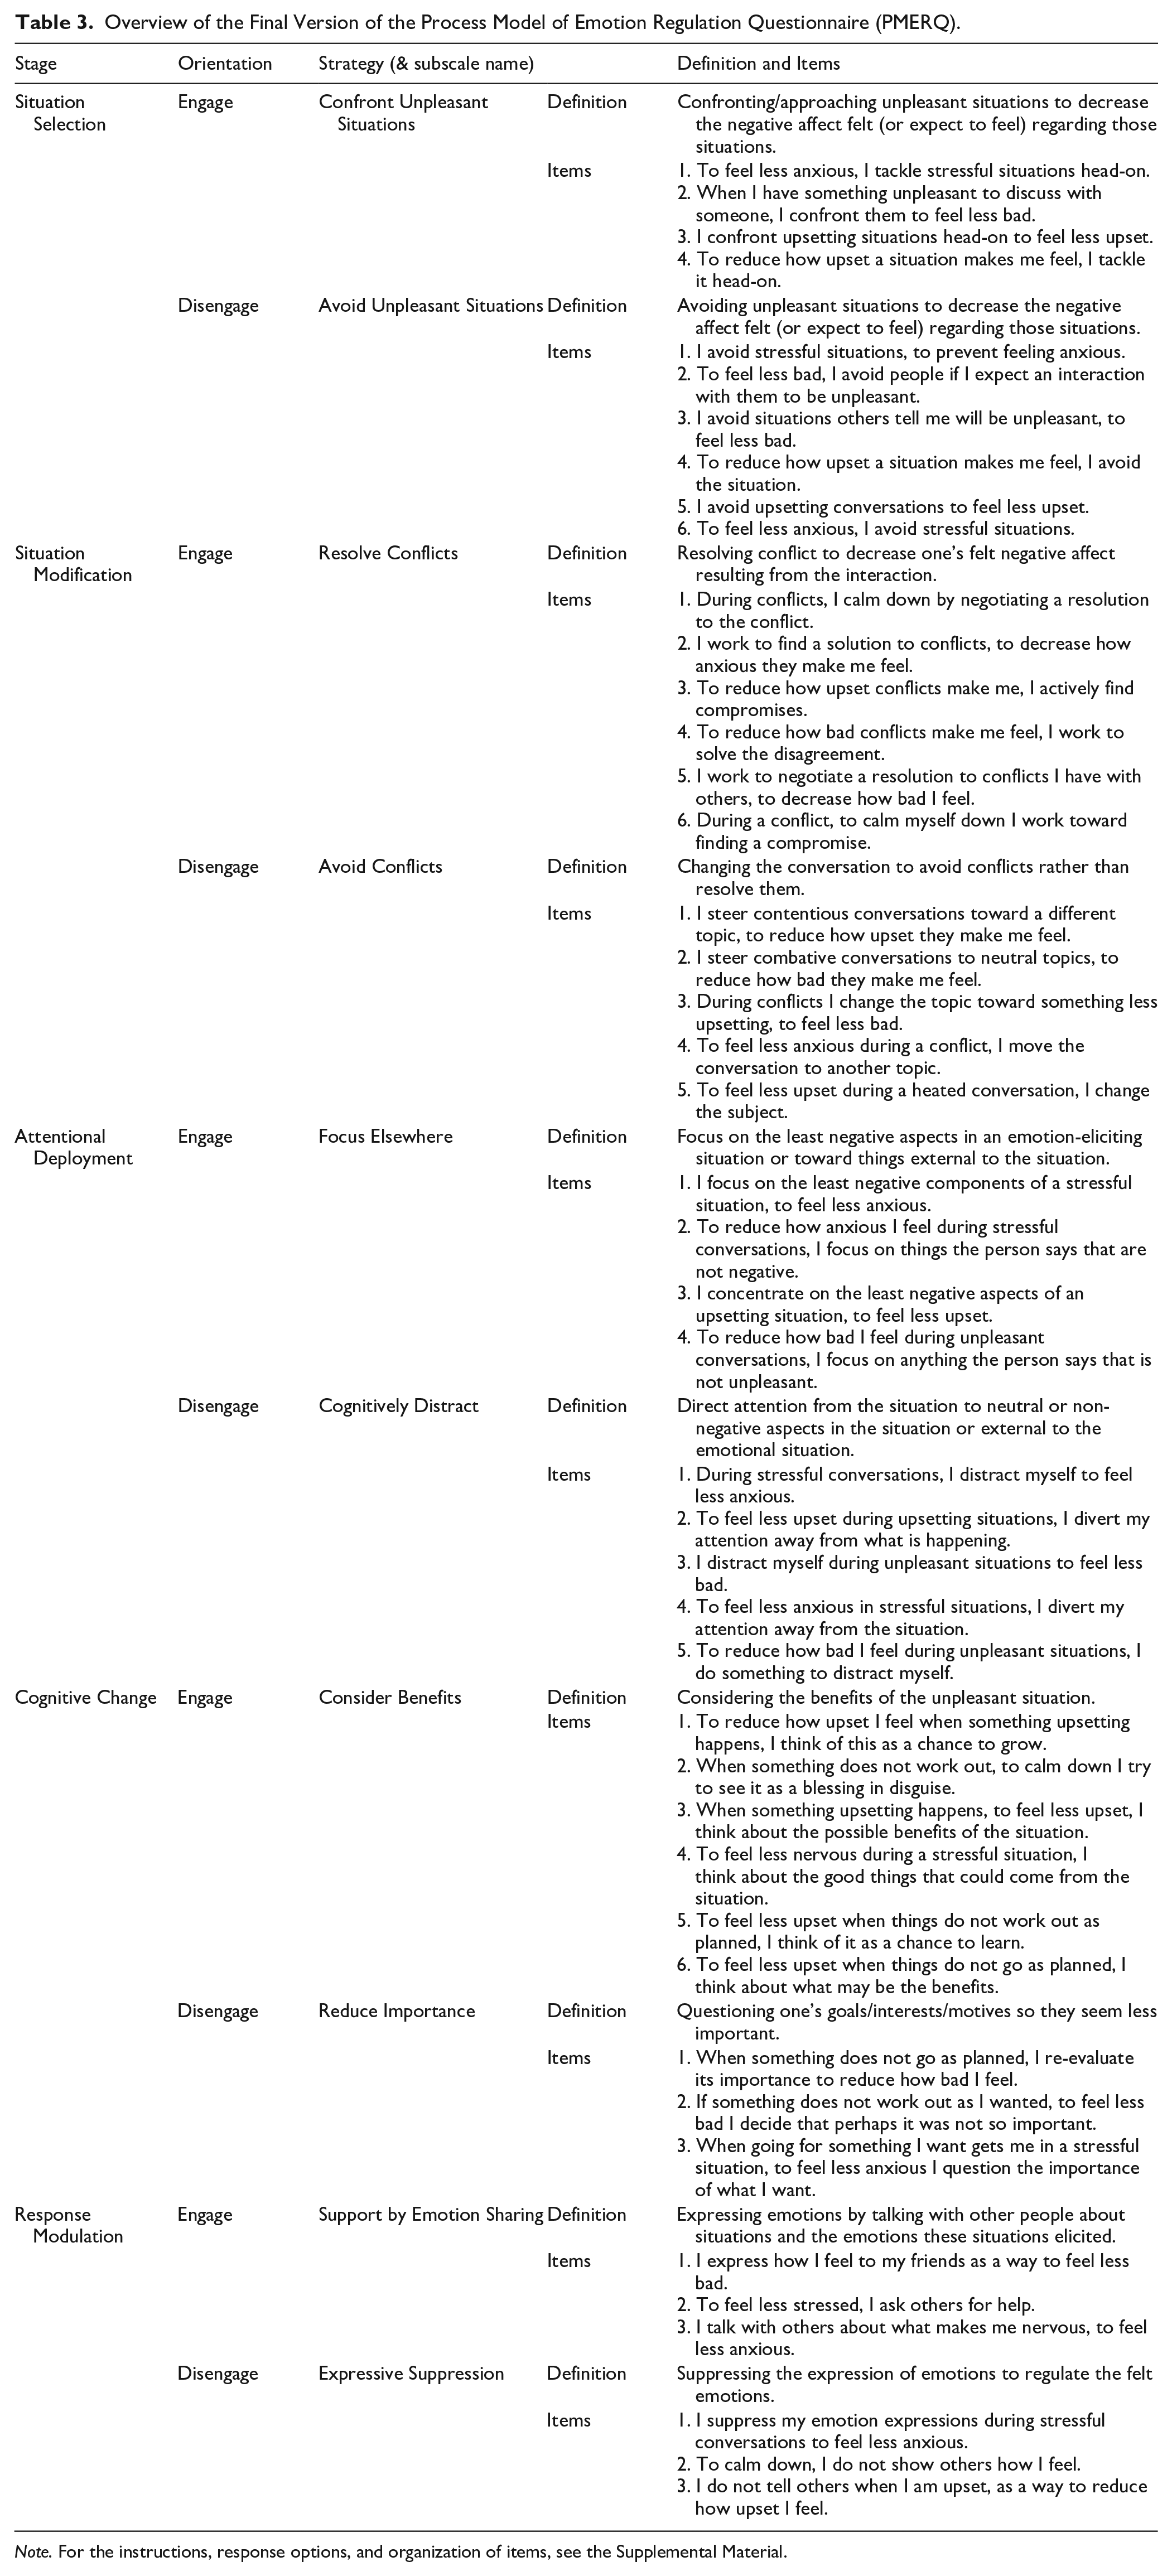
Note. For the instructions, response options, and organization of items, see the Supplemental Material.
Study 4—PMERQ Validity
Through Study 4, we sought to confirm the psychometric properties of the PMERQ, including invariance between genders using an independent sample. We also sought to test its test–retest reliability, investigate the convergent and discriminant validity as well as its capacity to predict affective and social functioning. To these ends, we administered the PMERQ twice and on the first occasion asked participants to also fill in a series of emotion regulation and coping measures (for assessing convergent validity), a social desirability and a personality measure (for assessing discriminant validity), and a series of measures of well-being, ill-being, and social functioning (for assessing predictive validity).
Method
Sample
A sample of 331 persons, recruited on Prolific Academic, participated in the study with a payment of £7.50 each. After applying the previous sets of data cleaning procedures, the final sample was n = 300 (aged 18–60, M = 25.8, SD = 8.5) with 49.3% female, 82.6% White, 3.7% Black, 4.0% Asian, and 2.7% other. Nearly all (99.7%) could speak English well or very well; however, only 18% were Native English speakers with 86% living in a country that is not predominantly English-speaking. Most (44.0%) completed high school or an equivalent degree, with 9.3% having received a trade certificate or similar degree, 32.0% with a bachelor’s degree, and 12.7% with a graduate degree.
Procedure and Measures
Participants completed the PMERQ in addition to several measures. Those included in the analysis are listed below (Time 1; see the Supplemental Material for the full list). They also completed the PMERQ again, 1 month following (Time 2).
The following measures were administered to assess the convergent validity of the PMERQ, and for each scale, we selected subscales of existing measures that were conceptually most similar to those included in the PMERQ. These benchmark subscales for each PMERQ subscale are indicated in Table 5 with shaded backgrounds of their correlations.
COPE Inventory
We included seven subscales designed to assess specific kinds of problem-focused coping, emotion-focused coping, and coping resources (Carver et al., 1989). Participants completed the questionnaire with items like “I discuss my feelings with someone.” using a 4-point response scale from 1 = I usually don’t do this at all to 4 = I usually do this a lot. Each subscale had four items and acceptable internal consistency: active coping (α = .79), behavioral disengagement (α = .83), self-distraction (α = .65), positive reframing (α = .82), using emotional support (α = .93), using instrumental support (α = .87), and venting (α = .82).
Cognitive Emotion Regulation Questionnaire
We included four subscales developed to assess specific cognitive components of emotion regulation (Garnefski & Kraaij, 2007). Participants completed items like “I think that I have to accept the situation.” and used a 5-point response scale from 1 = Almost never to 5 = Almost always. Each subscale had four items and acceptable internal consistency: acceptance (α = .67), refocus on planning (α = .67), positive refocusing (α = .82), and positive reappraisal (α = .84).
(Extended) Emotion Regulation Questionnaire
This measure is an extension to the Emotion Regulation Questionnaire (Gross & John, 2003; Guassi Moreira et al., 2021), which measured the uses of cognitive reappraisal and expressive suppression and includes additional subscales to assess distraction, selective attention, and situation selection. Participants completed items like “When I want to feel a more positive emotion (such as joy), I change what I’m thinking about.” and used a 7-point response scale from 1 = strongly disagree to 7 = strongly agree. Each subscale had acceptable internal consistency: cognitive reappraisal (six items; α = .87), expressive suppression (four items, α = .81), situation selection (three items, α = .70), selective attention (four items; α = .83), and distraction (five items, α = .86).
Heidelberg Form for Emotion Regulation Strategies
We included five subscales developed to assess specific emotion regulation strategies (Izadpanah et al., 2019). Participants completed items like “When I feel bad, I try to see the positive aspects of a situation.” and used a 5-point response scale from 1 = never to 5 = always. Each subscale had acceptable internal consistency: avoidance (three items; α = .68), problem solving (four items; α = .74), reappraisal (four items; α = .78), activity/social support (two items; α = .75), expressive suppression (four items; α = .70).
Behavioral Emotion Regulation Questionnaire
We selected three subscales, with four items each, that assess emotion regulation in response to stress (Kraaij & Garnefski, 2019). Participants completed items like “I try to do something about it.” and used a five-point response scale from 1 = (almost) never to 5 = (almost) always. Each subscale had acceptable internal consistency: actively approaching (α = .88), seeking social support (α = .93), and withdrawal (α = .84).
Regulation of Emotion Systems Survey
We selected four subscales that assess the use of specific emotion regulation strategies (de France & Hollenstein, 2017). Participants completed items like “Using facial expressions to show that I was upset.” and used a five-point response scale from 1 = Never to 5 = Always. Each subscale had acceptable internal consistency: distraction (four items; α = .91), reappraisal (eight items; α = .94), engagement (eight items; α = .94), and suppression (eight items; α = .94).
The next two measures were included to evaluate the discriminant validity of the PMERQ.
Marlowe-Crowne Social Desirability Scale
Developed to assess socially desirable responding, participants answered items like “It is sometimes hard for me to go on with my work if I am not encouraged (Reynolds, 1982).” using the response options true and false. The 13-item scale had acceptable internal consistency: α = .64
HEXACO100
Participants completed the 100-item measure assessing the Big 6 personality factors—honesty-humility, emotional stability, extraversion, agreeableness, conscientiousness, and openness to experience—in addition to altruism (Lee & Ashton, 2018). Each factor included four subscales assessing a distinct facet of that factor and each subscale included four items. Participants completed items like “I would be quite bored by a visit to an art gallery.” and used a 5-point response scale from 1 = strongly disagree to 5 = strongly agree. The majority of factors and subscales had acceptable internal consistency: honesty-humility (α = .81), sincerity (α = .72), fairness (α = .76), greed avoidance (α = .77), modesty (α = .67), emotionality (α = .80), fearfulness (α = .57), anxiety (α = .70), dependence (α = .79), sentimentality (α = .67), extraversion (α = .86), social self-esteem (α = .67), social boldness (α = .63), sociability (α = .72), liveliness (α = .77), agreeableness (α = .83), forgivingness (α = .80), gentleness (α = .55), flexibility (α = .57), patience (α = .74), conscientiousness (α = .82), organization (α = .69), diligence (α = .68), perfectionism (α = .61), prudence (α = .68), openness to experience (α = .75), aesthetic (α = .66), inquisitiveness (α = .62), creativity (α = .67), unconventionality (α = .32), and altruism (α = .53). While some of the internal consistency estimates were low, they are comparable to that obtained in other samples and have acceptable discriminant and convergent validity (Lee & Ashton, 2018). Nevertheless, correlations with these scales should be interpreted with caution.
The following scales were used to assess general well- and ill-being.
Emotion Adjectives (Positive and Negative Affect)
Participants described their current emotional state with items like “Afraid” and used a 7-point response scale from 0 = Not at all to 6 = A great deal (Barrett et al., 2004). Through applying exploratory factor analysis, we identified item sets that indicated positive affect (happy, satisfied, interested; α = .78) and negative affect (sad, disappointed, nervous, afraid, angry, irritated, frustrated; α = .92).
Satisfaction With Life
Participants completed items like “In most ways my life is close to my ideal (Diener et al., 1985).” and used a seven-point response scale from 1 = strongly disagree to 7 = strongly agree. The five-item scale had acceptable internal consistency (α = .88).
Psychological Well-Being
Participants completed items like “I like most parts of my personality (Ryff et al., 2010; Ryff & Keyes, 1995).” and used a 7-point response scale from 1 = strongly disagree to 7 = strongly agree. The 18-item scale had acceptable internal consistency (α = .82).
Ultra-Brief Screening Scale for Anxiety and Depression
Participants completed items like “Feeling nervous, anxious, or on edge” and used a four-point response scale from 1 = Not at all to 4 = Nearly every day (Kroenke et al., 2009). Both subscales (two items each) had acceptable internal consistency: anxiety (α = .89) and depression (α = .72).
The following scales were used to assess relationship functioning.
Multidimensional Scale of Perceived Social Support
This 12-item scale assesses perceived social support from family, friends, and a significant other (Zimet et al., 1988). Participants completed items like “ There is a special person who is around when I am in need.” and used a five-point response scale from 1 = very strongly disagree to 5 = very strongly agree. The scale had acceptable internal consistency (α = .93).
Revised UCLA Loneliness Scale (R-UCLA)
Participants completed items like “I feel in tune with the people around me (Russell et al., 1980).” and used a four-point response scale from 1 = Never to 4 = Often. The 20-item scale had acceptable internal consistency (α = .94).
Results
Psychometric Evaluation
We modeled the Time 1 and Time 2 PMERQ data for each subscale using confirmatory factor analysis, using the methods and evaluation criteria described in Studies 2 and 3. For both time points, each subscale had acceptable internal consistency and acceptable saturation of the latent factor (Table 1). Each model had an acceptable model fit, with one exception. With the Time 1 data, for focus elsewhere, an additional covariance was needed between two items. However, this exception did not hold for the Time 2 data. Likewise, each scale was invariant between age and gender, with three exceptions. For the Time 1 data, Resolve Conflicts had only metric invariance for age and gender while Reduce Importance only had metric invariance for age. However, none of these conditions held for the Time 2 data. Overall, we concluded that the PMERQ has acceptable scale properties.
When all scales were modeled in a single model, there was an acceptable fit to the data for both Time 1, χ2(899) = 1,574.34, p < .001, CFI = .903, RMSEA = .050, SRMR = .063, 4 and Time 2, χ2(900) = 1,410.85, p < .001, CFI = .912, RMSEA = .052, SRMR = .062. As can be seen by the interscale correlations (Table 4), there was sufficient discriminant validity between the scales. Although some scales were strongly correlated, most coefficients remained low (median absolute r = .32). Interestingly, some engagement- and disengagement-oriented strategies that share an emotion regulation stage were negatively correlated whereas others were positively correlated. Specifically, negative correlations were found for pairs of strategies that would be difficult to perform at the same time: confronting and avoiding unpleasant situations as well as sharing and suppressing emotions were negatively correlated. By contrast, positive correlations were found for pairs of strategies that can complement each other: focusing elsewhere within a situation and distracting from it as well as reducing importance and considering benefits of a situation.
Study 4 (Time 1 and Time 2): Correlations Between the Process Model of Emotion Regulation Questionnaire (PMERQ) Subscales When Modeled as Latent Factors.
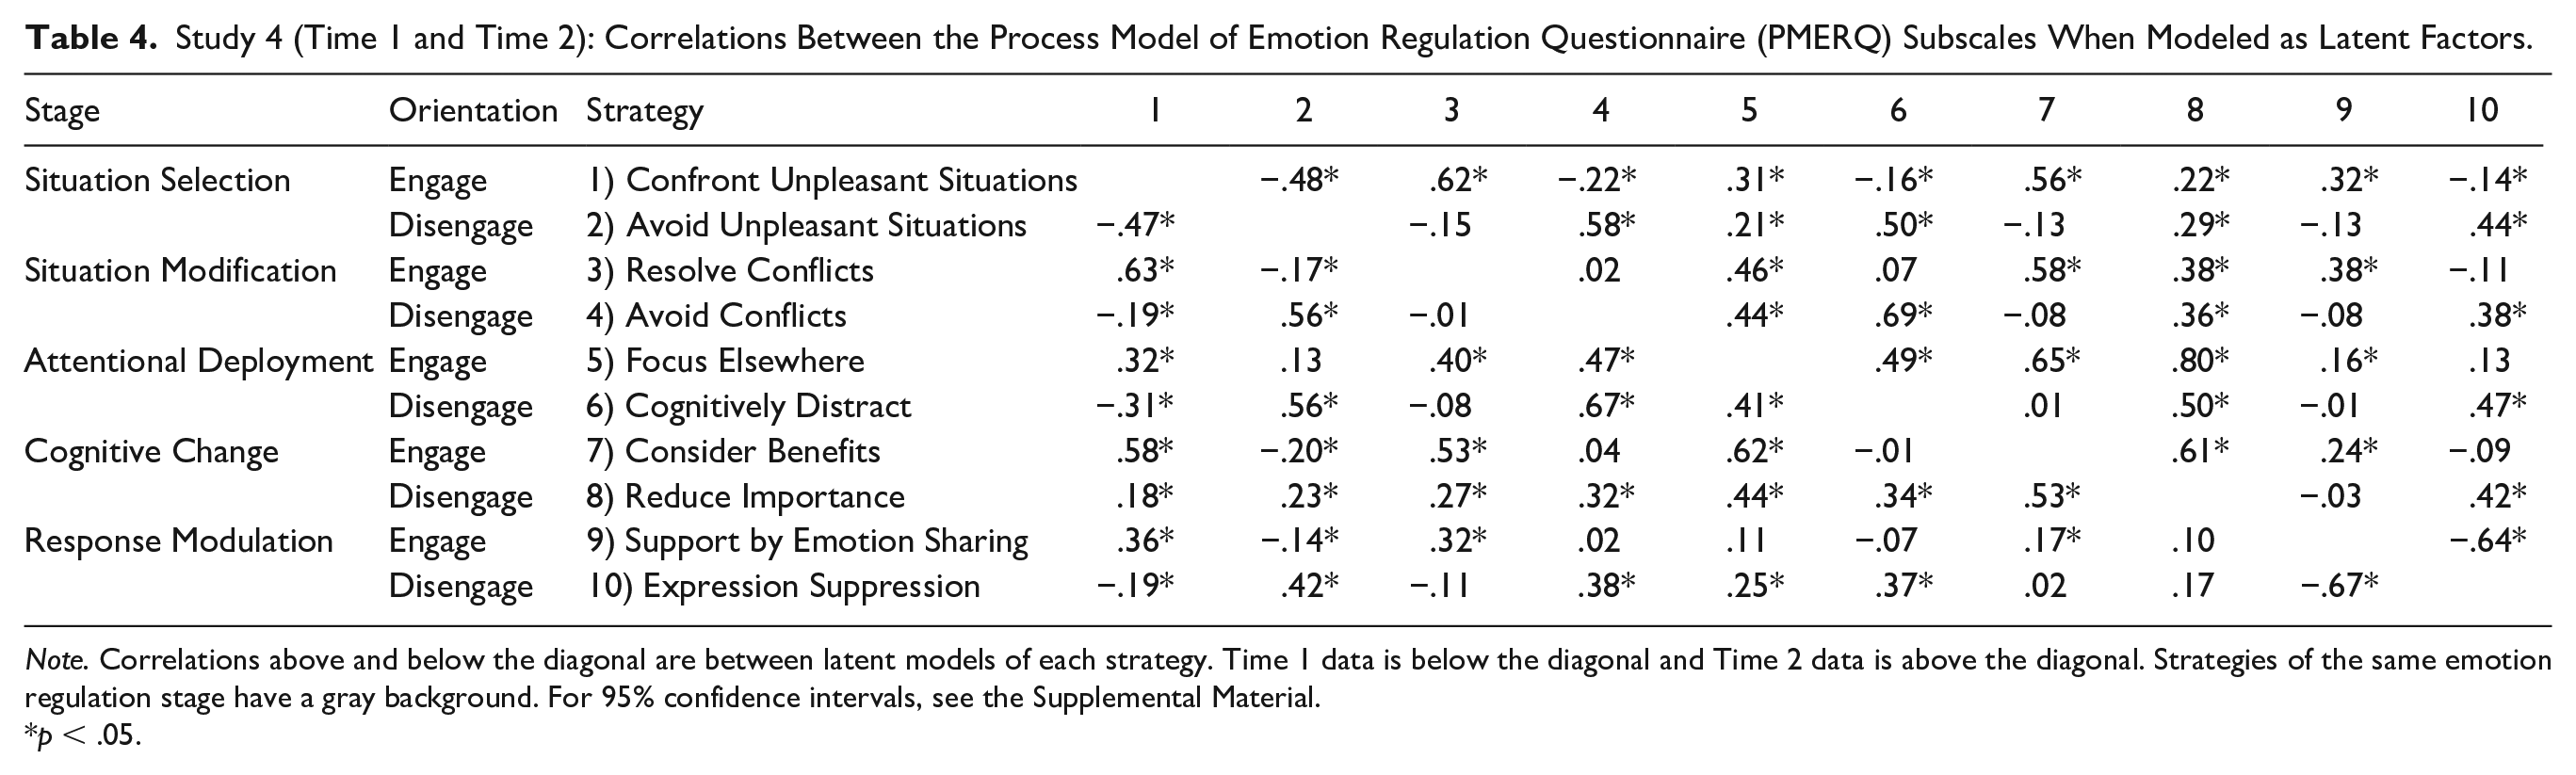
Note. Correlations above and below the diagonal are between latent models of each strategy. Time 1 data is below the diagonal and Time 2 data is above the diagonal. Strategies of the same emotion regulation stage have a gray background. For 95% confidence intervals, see the Supplemental Material.
p < .05.
We also found strong test–retest reliability (computed by correlating the manifest scores of each time point; see Table 1). Likewise, when modeled with second-order factors for engagement-oriented and disengagement-oriented, and correlations between the residuals of scales from the same emotion regulation stage, there was acceptable fit (Marsh et al., 2004) 5 to the data for Time 1, χ2(927) = 1,671.82, p < .001, CFI = .893, RMSEA = .052, SRMR = .080 (see Note 1) and Time 2, χ2(928) = 1,560.43, p < .001, CFI = .892, RMSEA = .057, SRMR = .089.
Convergent Validity
We next investigated the convergent validity of the PMERQ subscales with those of existing emotion regulation and coping questionnaires. We hypothesized that scales assessing similar strategies would be more strongly correlated, relative to those assessing different strategies. For example, the PMERQ expressive suppression subscale will be strongly correlated with the expressive suppression subscale of the E-ERQ, the expressive suppression subscale of the Heidelberg Form for Emotion Regulation Strategies, and the suppression subscale of the Regulation of Emotion Systems Survey. Because of the strong shared variance between scales, we estimated relations with manifest variables.
In general, we found strong convergent validity between the PMERQ and existing measures of emotion regulation and coping suggesting a similar construct is measured (see shaded cells in Table 5). Of the 40 hypothesized pair-wise correlations, 36 were statistically significant with a median size of the Pearson correlation coefficient of r = .46. For example, we found strong correlations for confront unpleasant situations (with the Behavioral Emotion Regulation Questionnaire [BERQ] actively approaching), avoid unpleasant situations (with the Heidelberg Form for Emotion Regulation Strategies [HFERS] avoidance), resolve conflicts (with the COPE active coping), cognitively distract (with the (Extended) Emotion Regulation Questionnaire [EERQ] distraction), consider benefits (with the COPE positive reframing), support by emotion sharing (with the BERQ seeking social support), and expressive suppression (with the EERQ expressive suppression). The fact that several PMERQ scales have only weak, but still positive, correlations with scales assessing a similar area—avoid conflicts with the HFERS avoidance, focus elsewhere with the EERQ selective attention, and reduce importance with the HERS reappraisal—indicates that the PMERQ captures unique variance not captured by many existing instruments.
Study 4: Convergent Validity of the PMERQ.
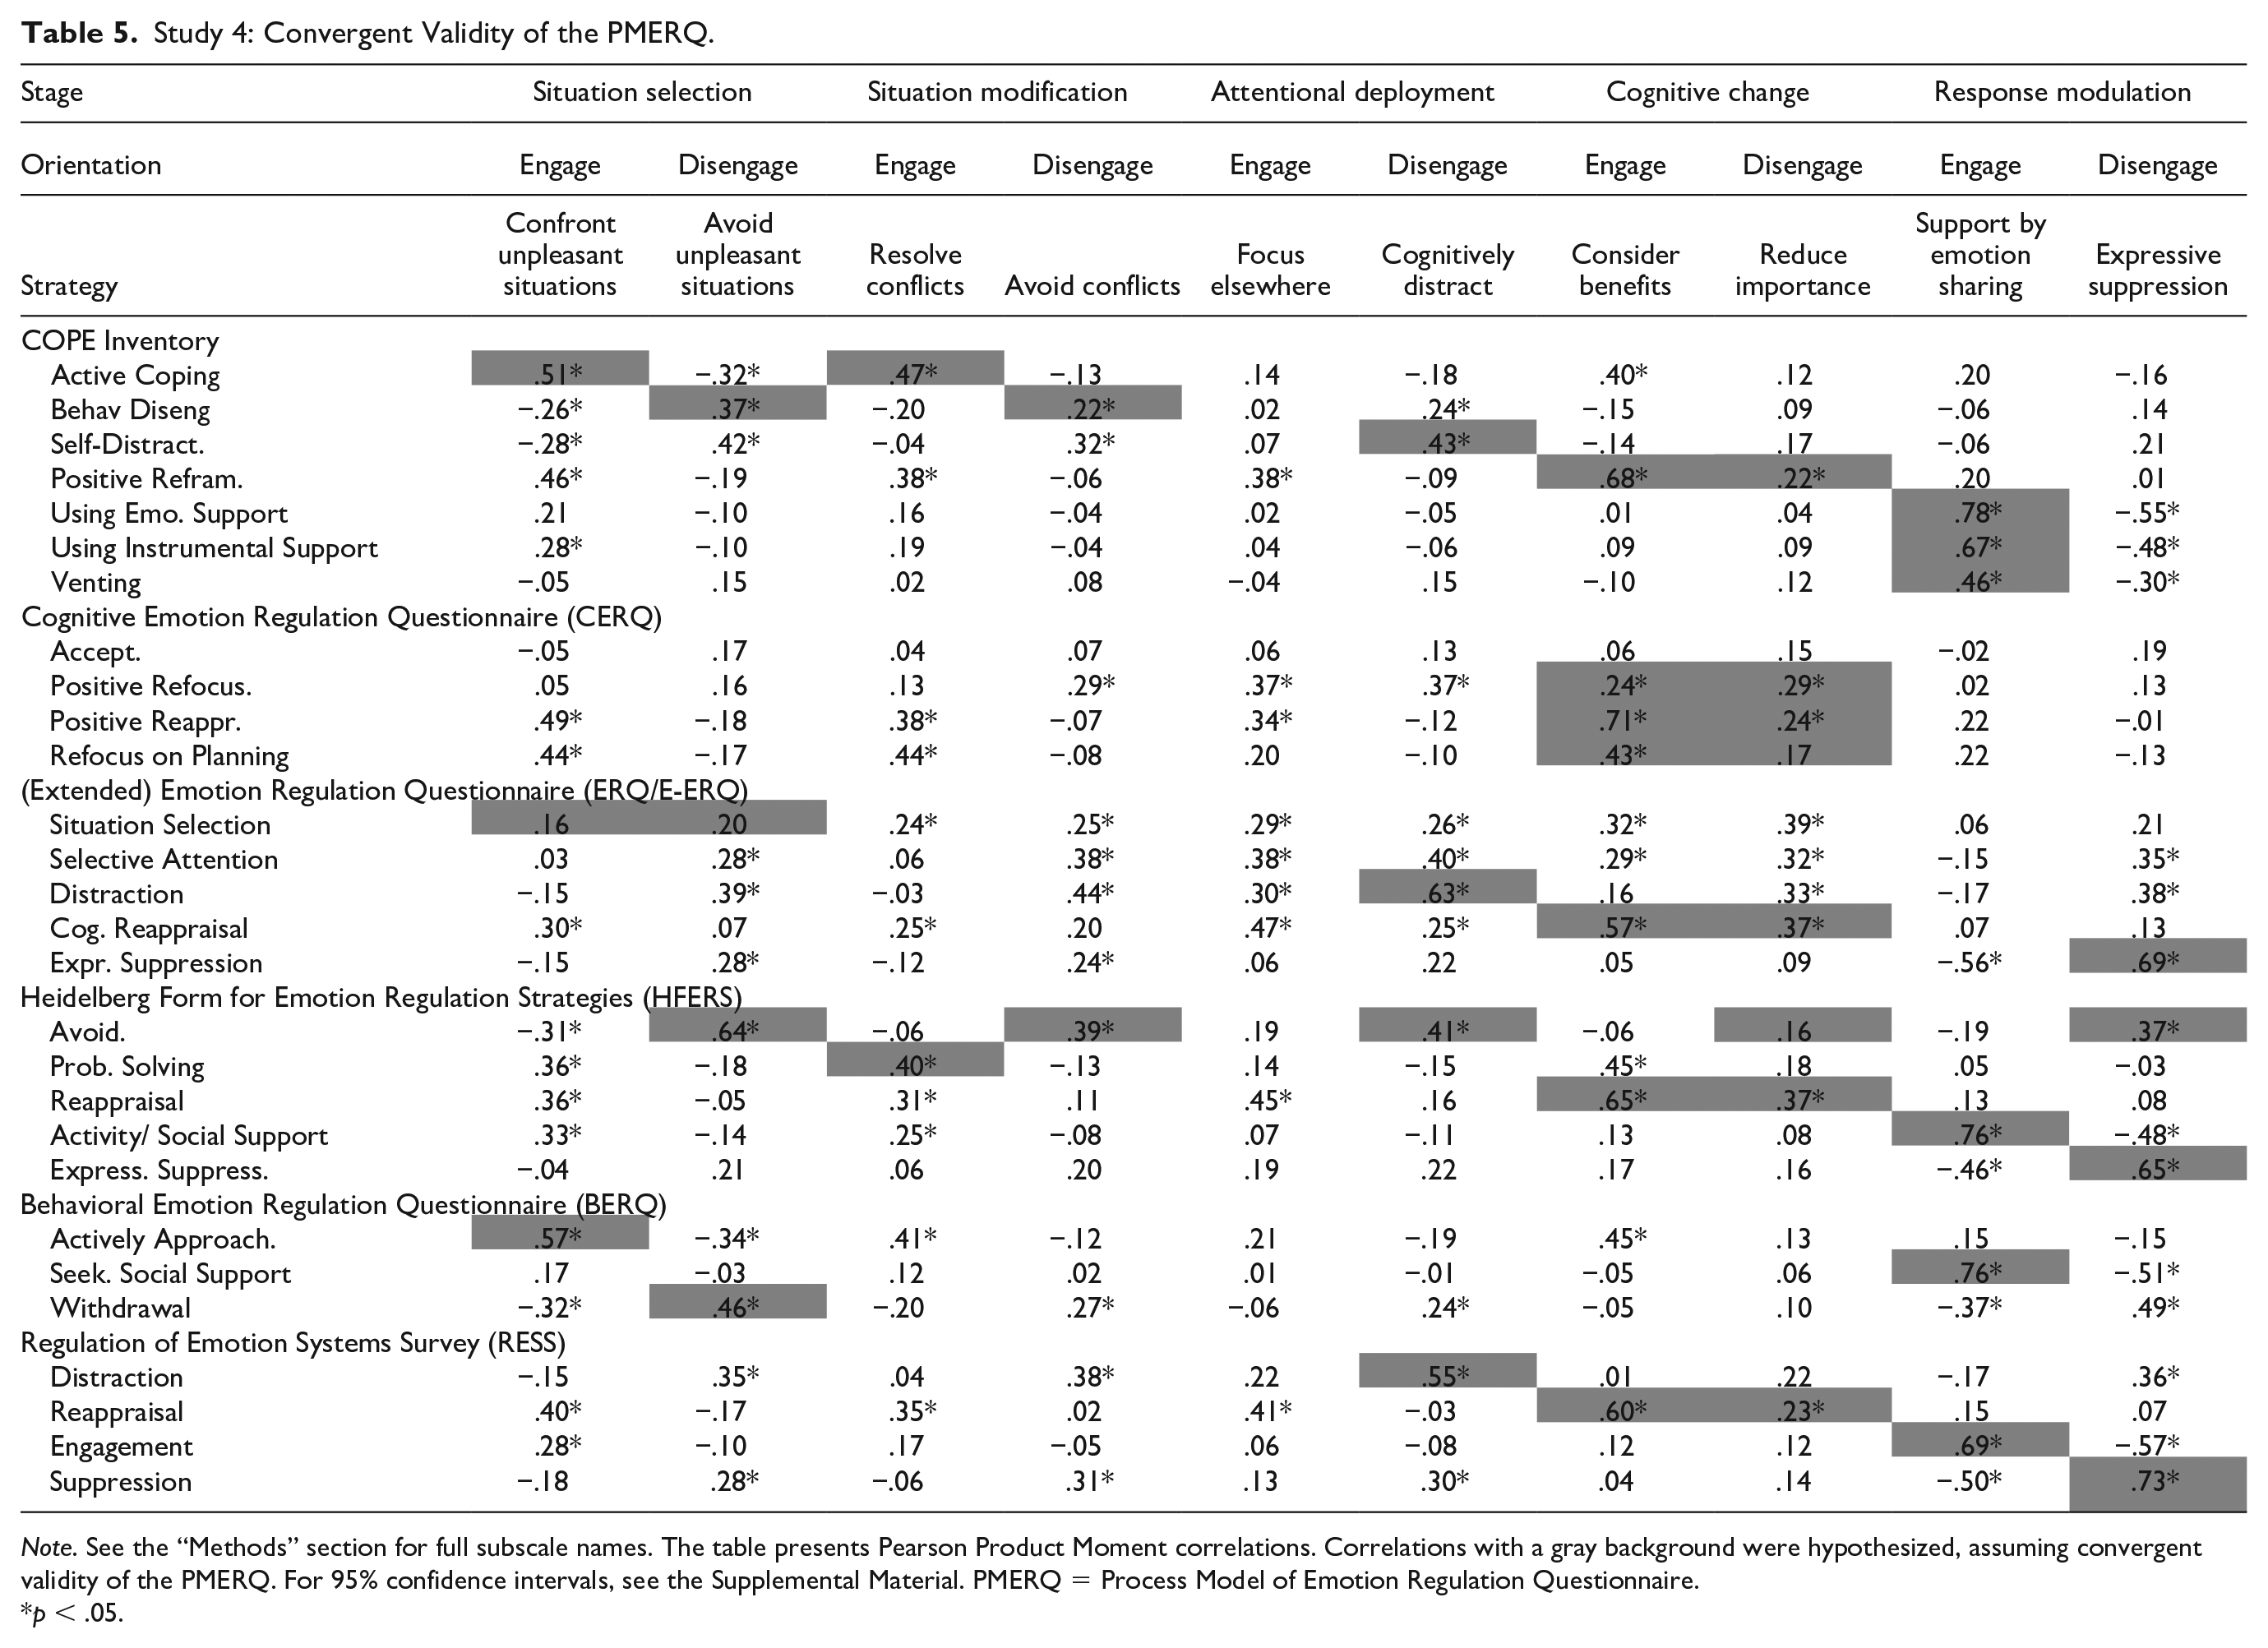
Note. See the “Methods” section for full subscale names. The table presents Pearson Product Moment correlations. Correlations with a gray background were hypothesized, assuming convergent validity of the PMERQ. For 95% confidence intervals, see the Supplemental Material. PMERQ = Process Model of Emotion Regulation Questionnaire.
p < .05.
Likewise, there are many unexpectedly strong correlations (e.g., PMERQ Confront Unpleasant Situations with the COPE Inventory Positive Reframing scale). As mentioned earlier, because other emotion regulation or coping scales contain an unsystematic mix of regulation goal and strategy orientation, the extent to which a scale emphasizes the same regulation goal and/or strategy orientation acts as a confound. In addition, one would expect groupings of strategies that go beyond stage or orientation such that individuals who use one strategy are also more likely to us another. This is an avenue that should be explored in the future.
Discriminant Validity
Next, we investigated the discriminant validity of the PMERQ by estimating manifest correlations (again, selected because of expected strong shared variance) between the PMERQ subscales with social desirability, with the HEXACO personality factors and facets (Table 6). We expected to observe non-zero correlations between the PMERQ and social desirability as well as personality because emotion regulation behaviors can be socially desirable and are known to systematically relate to personality traits (Hughes et al., 2020). However, we expected the correlations to be modest in size indicating that the PMERQ captures at least in part unique variance. With one exception, all correlations were equal to or less than the absolute value of .53, indicating that there was no linear dependency between the personality facets and the PMERQ subscales. The one exception was a strong (r = .68) correlation between support by emotion sharing with the emotionality facet of dependence. We remodeled this correlation using confirmatory factor analysis with each construct modeled as a latent variable. The model fit the data, χ2(13) = 59.06, p < .001, CFI = .931, RMSEA = .109, SRMR = .052, and the constructs were correlated at r = .85, indicating the shared variance is 72% with 28% of the variance not shared. We then re-estimated the model, equating the correlation to 1.0 (Hildebrandt et al., 2012, 2015; Wilhelm et al., 2010). The model fit was significantly, Δ χ2(1) = 24.55, p < .001, and meaningfully worse (ΔCFI = .039), indicating the two constructs are distinct. Thus, we found that the PMERQ subscales have sufficient discriminant validity from social desirability, the HEXACO personality factors, and the HEXACO personality facets.
Study 4: Discriminant Validity of the Process Model of Emotion Regulation Questionnaire (PMERQ).
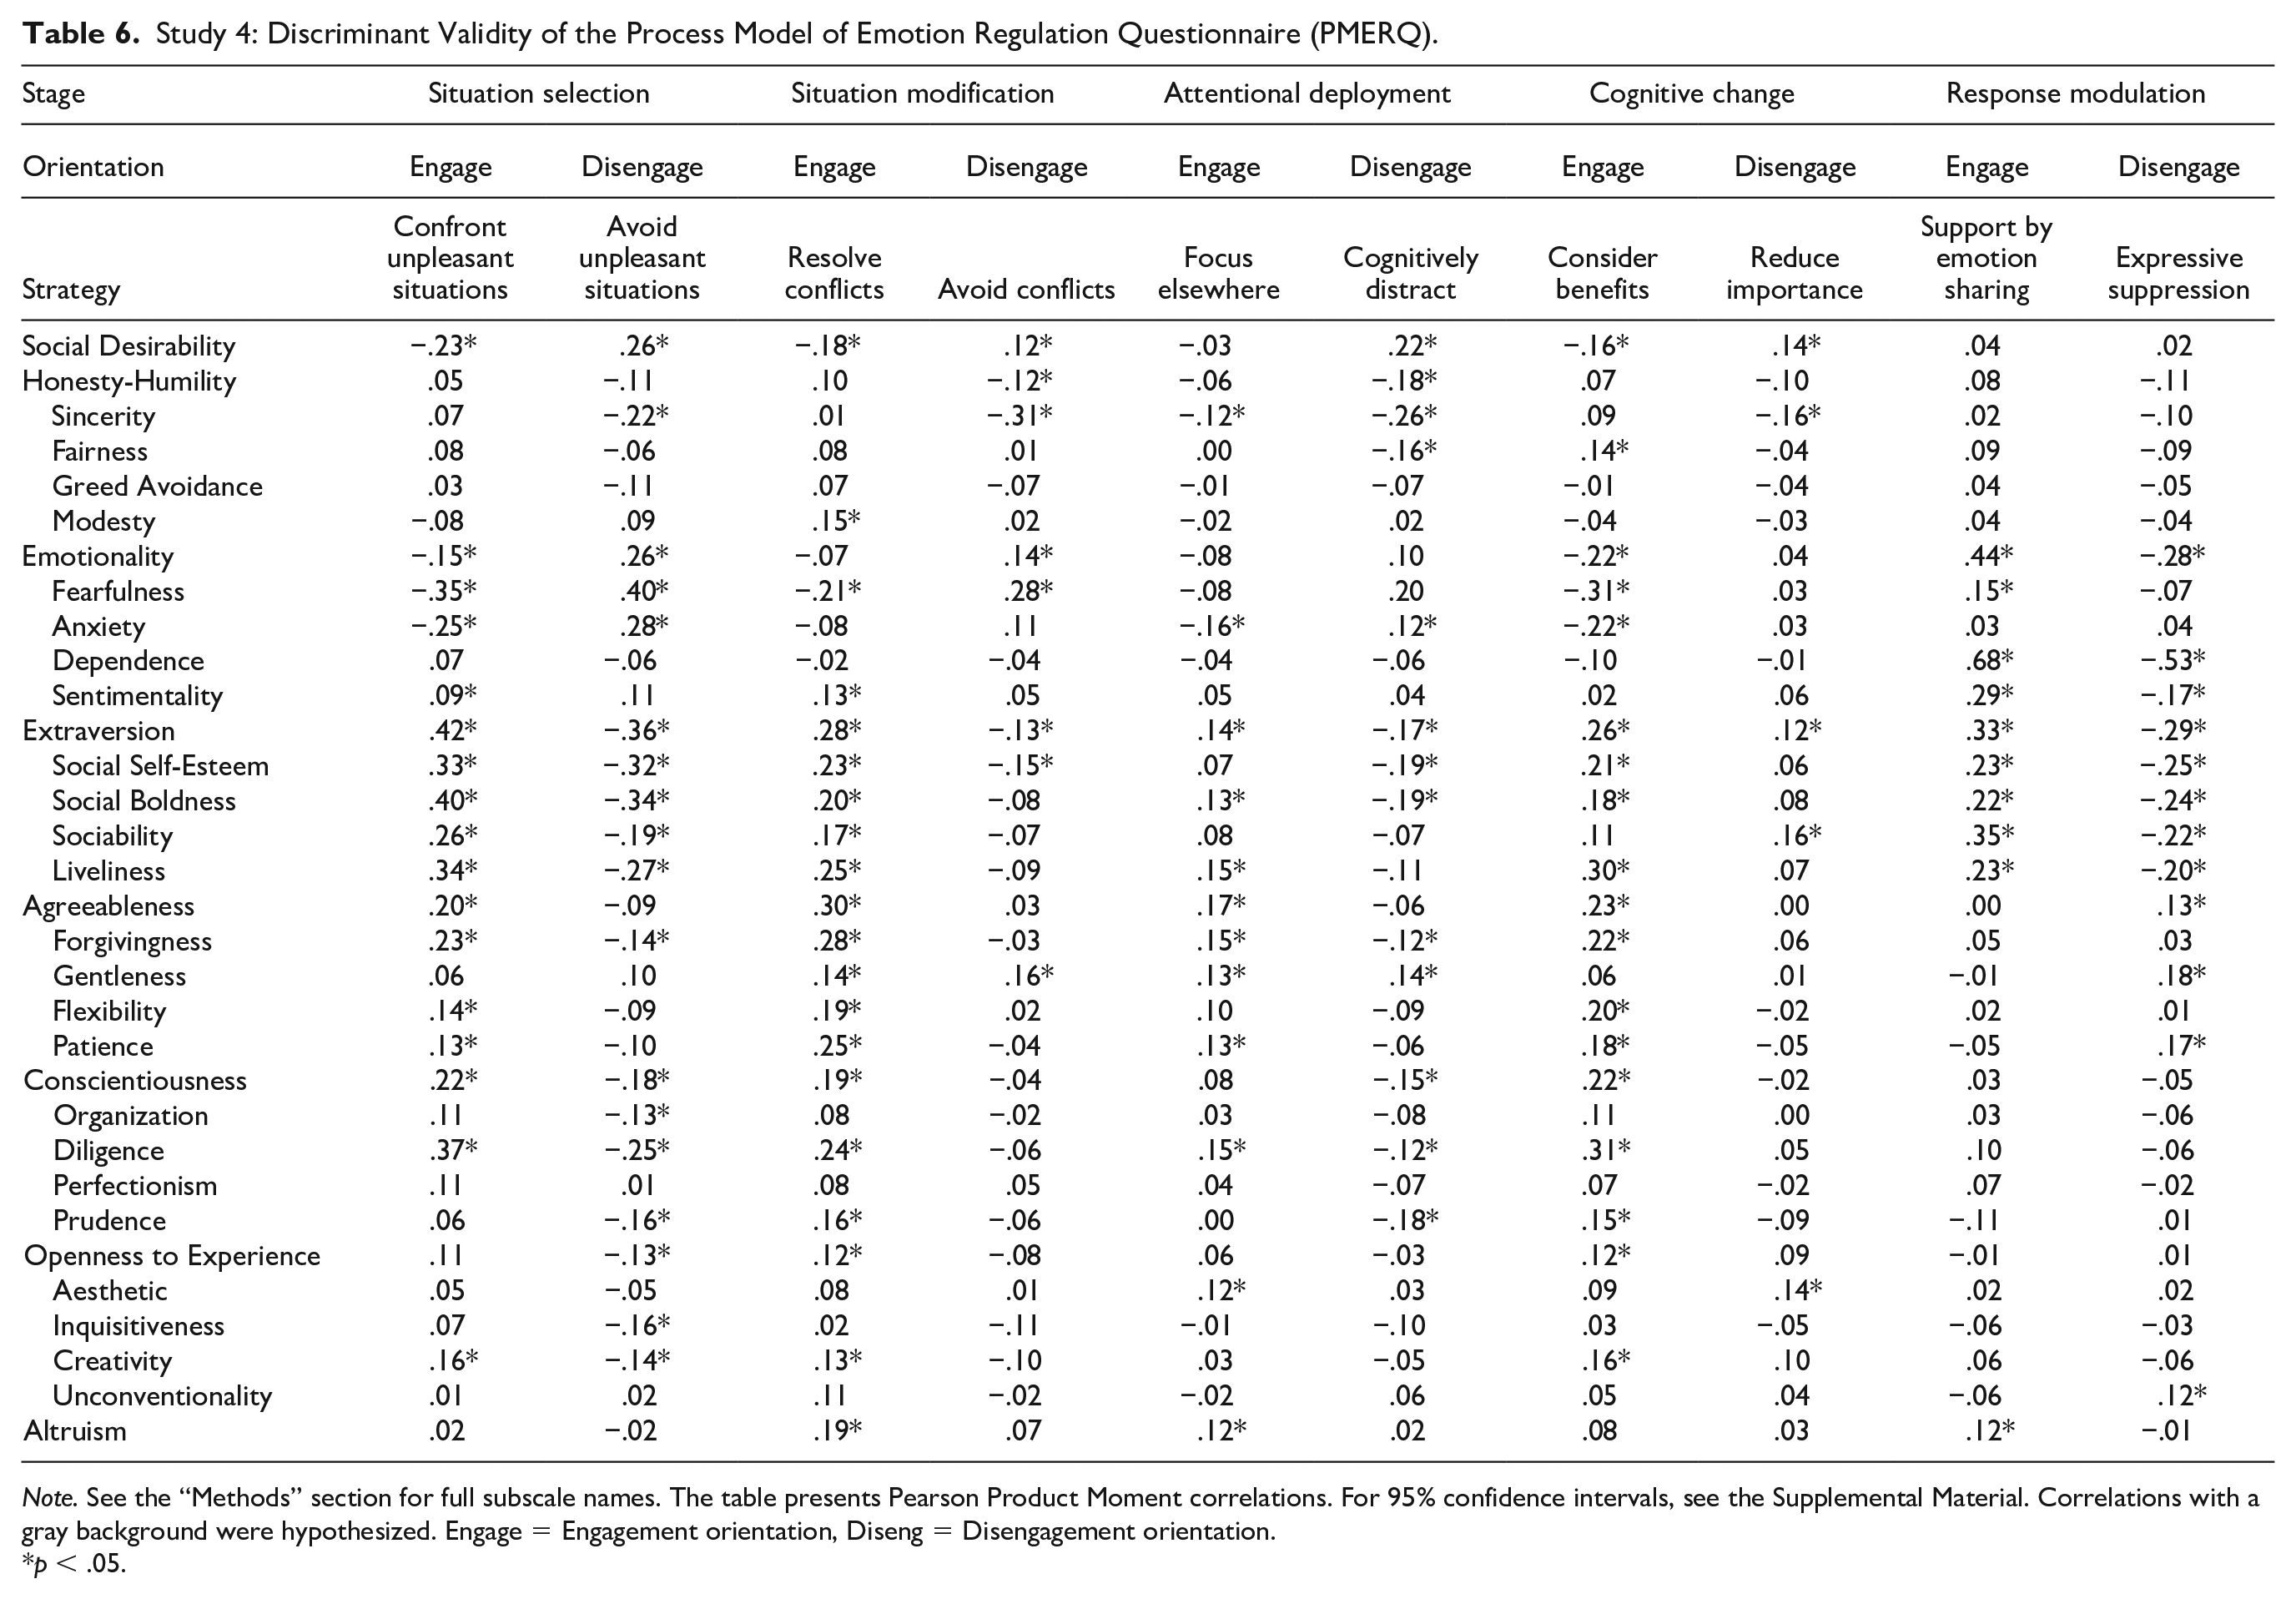
Note. See the “Methods” section for full subscale names. The table presents Pearson Product Moment correlations. For 95% confidence intervals, see the Supplemental Material. Correlations with a gray background were hypothesized. Engage = Engagement orientation, Diseng = Disengagement orientation.
p < .05.
Predictive Validity
Having confirmed the psychometric characteristics of the PMERQ, as well as its convergent and discriminant validity, we next evaluated our hypotheses regarding the relation between the emotion regulation strategies with well- and ill-being. Rather than estimate relations with individual indicators of well- and ill-being, we modeled both constructs as latent variables providing a more precise estimate of each. Well-being was indicated by psychological well-being, satisfaction with life, and positive affect while ill-being was indicated by anxiety, depression, and negative affect. Both factors had acceptable saturation: well-being ωH = .77, ill-being ωH = .78. We then let each factor correlate with each other and with each emotion regulation strategy, where strategies were also modeled as latent variables indicated by their respective items, χ2(1157) = 1,964.95, p < .001, CFI = .897, RMSEA = .048, SRMR = .062. 6
We found support for our hypothesis that individual differences in the use of emotion regulation strategies would be significantly related to indicators of well-being, ill-being, and relationship functioning (see Table 7 and Figures 3 and 4). For ill-being and well-being, of the 20 tested relationships, 15 were significant. The pattern of relationships revealed that each PMERQ subscale was related to well-being, ill-being, or both. Specifically, although avoid conflicts and cognitive distraction were unrelated to well-being, they were significantly related to ill-being. Likewise, focus elsewhere, reduce importance, and support by emotion sharing were unrelated to ill-being but related to well-being. For relationship functioning, of the 20 tested relationships, 11 were significant. Here, seven strategies were related to at least one relationship functioning indicator whereas focus elsewhere, consider benefits, and reduce importance did not relate to either indicator. This suggests that cognitive strategies may be less relevant for social outcomes compared with personal outcomes. Overall, the rich pattern of relationships points toward the PMERQ having good predictive validity.
Studies 4 and 5: Process Model of Emotion Regulation Questionnaire (PMERQ) as It Relates to Affective and Social Functioning.
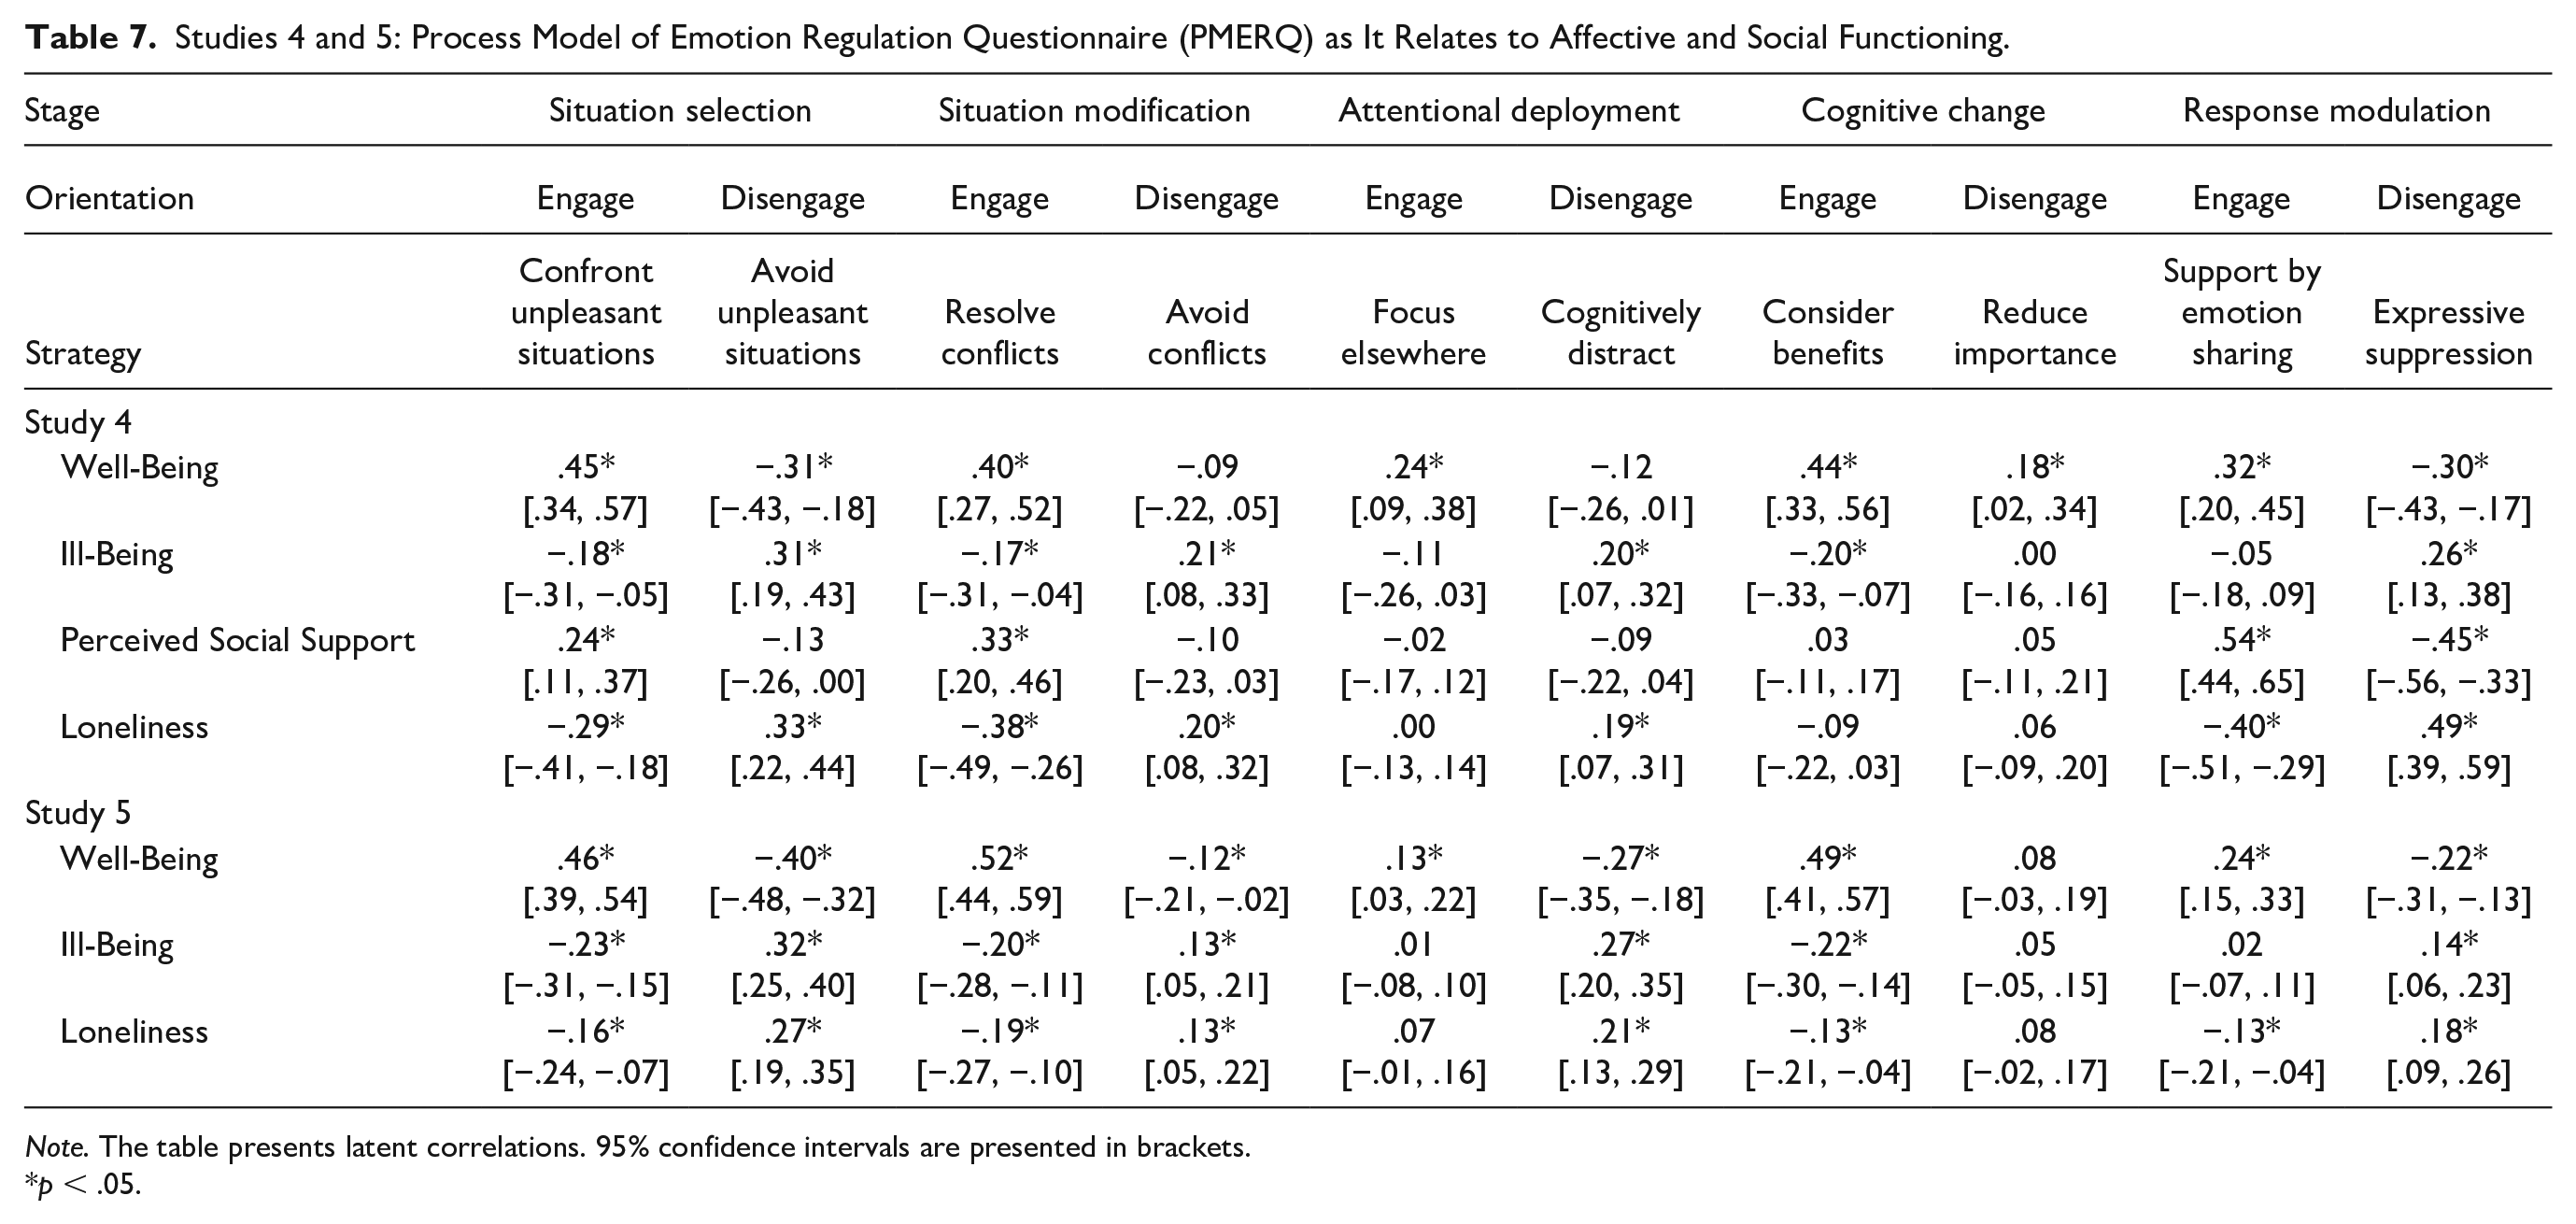
Note. The table presents latent correlations. 95% confidence intervals are presented in brackets.
p < .05.
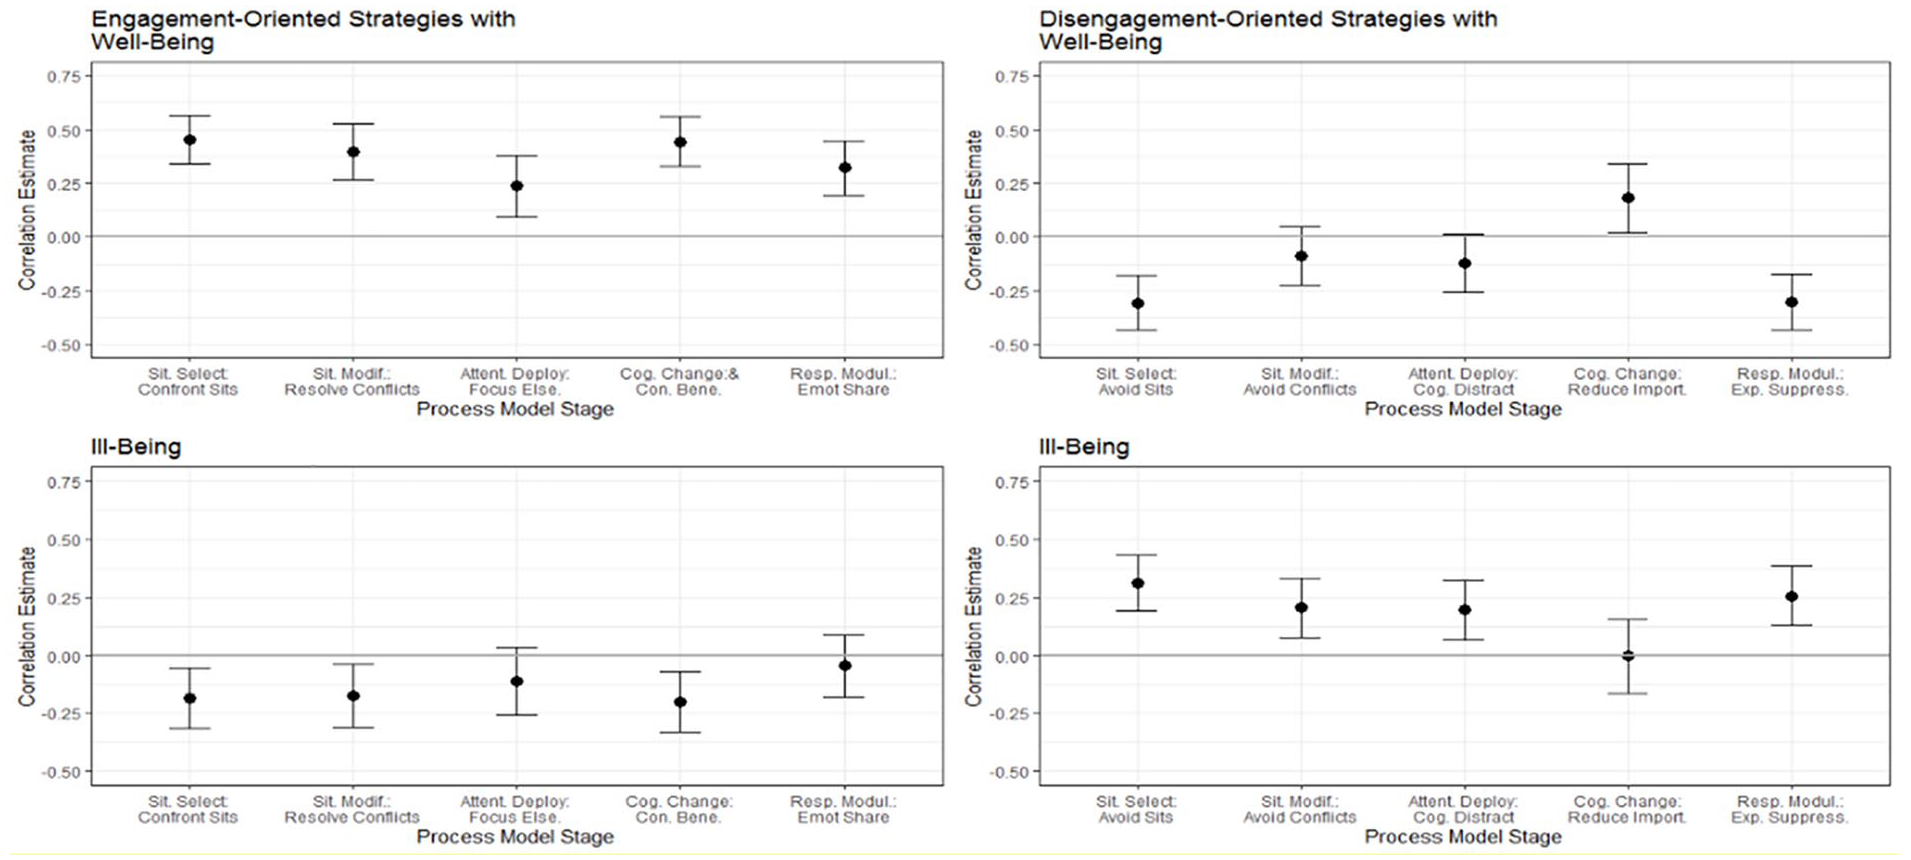
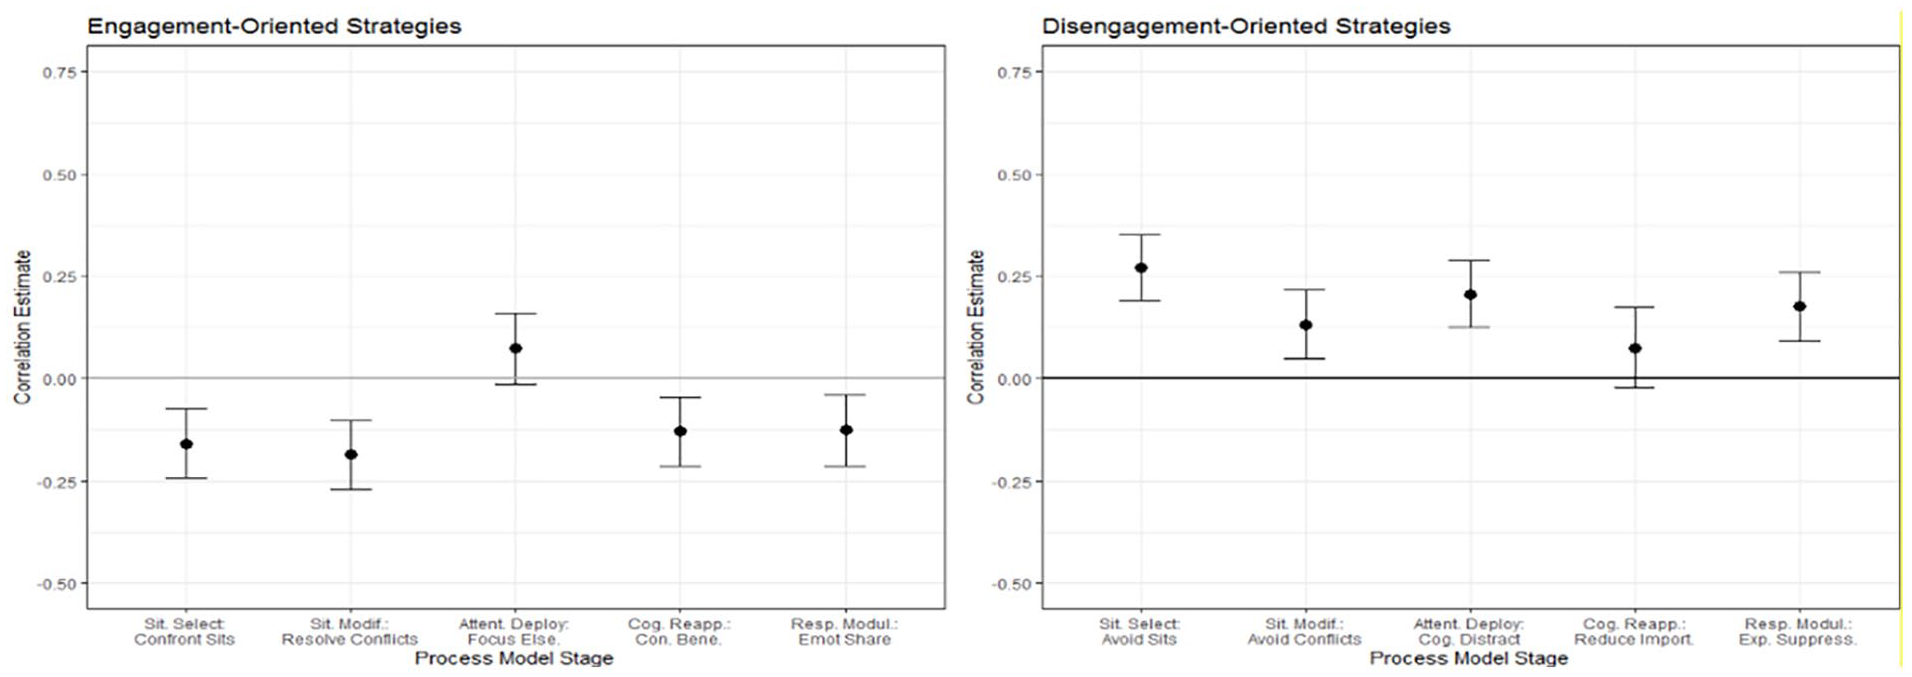
Study 4: Illustration of the correlations between emotion regulation strategies with affective functioning variables when modeled as latent factors.
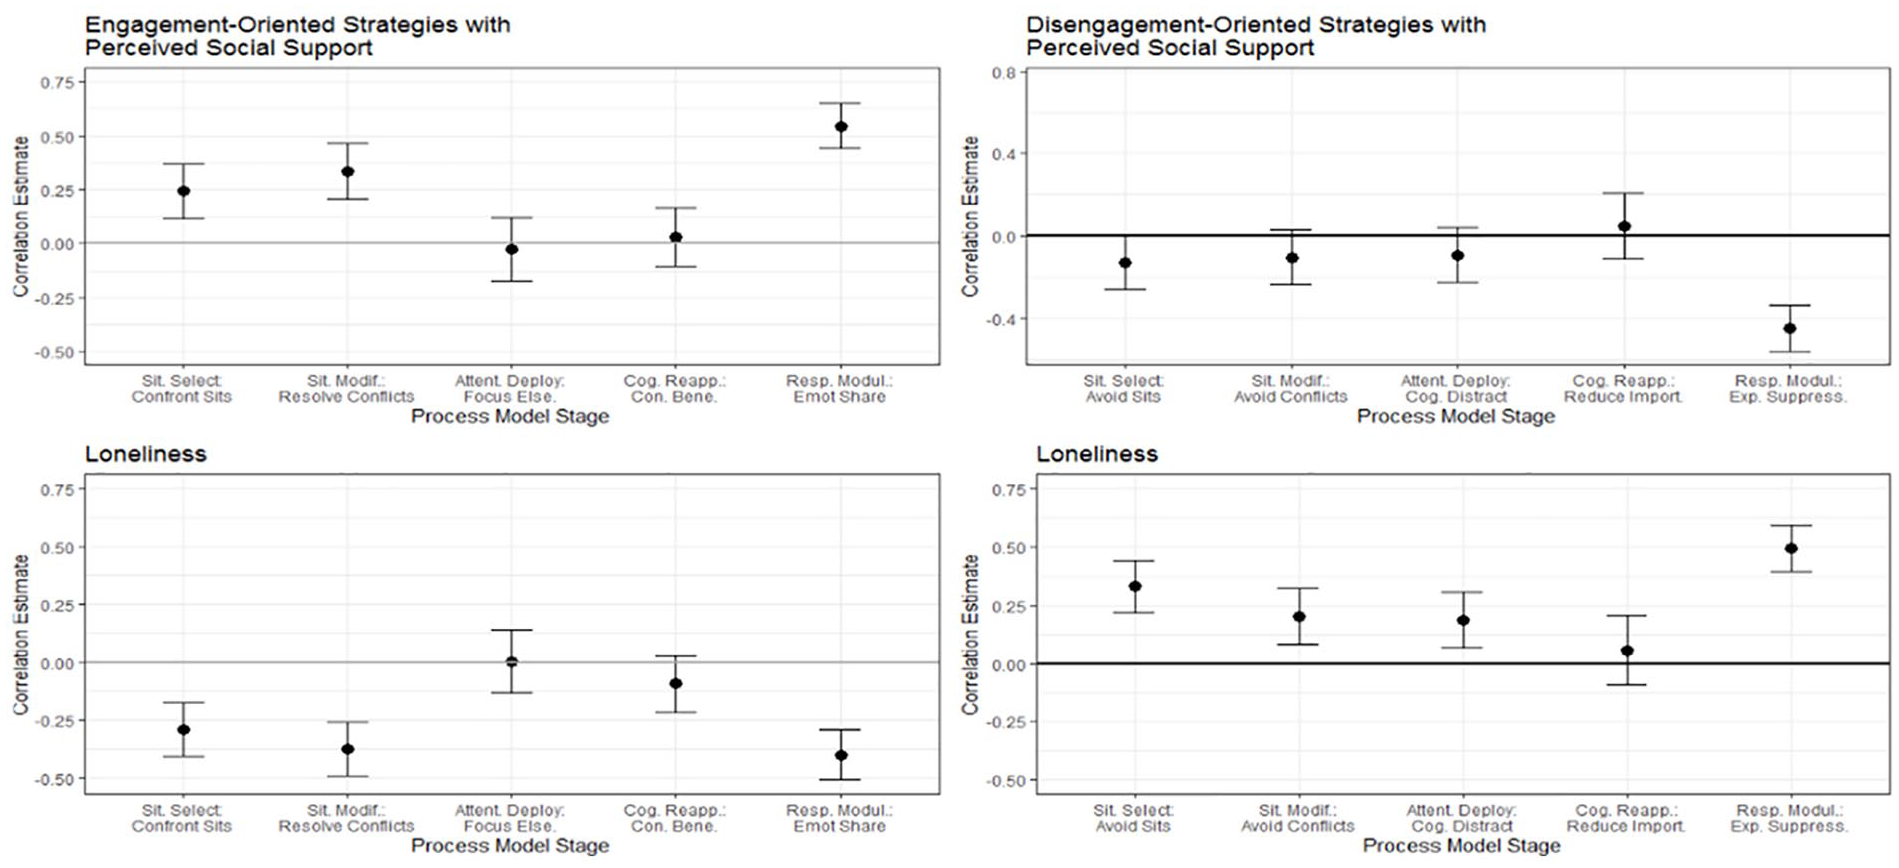
Study 4: Illustration of the correlations between emotion regulation strategies with relationship functioning variables when modeled as latent factors.
In a demonstration of how the PMERQ can be used to investigate important ideas in the field of emotion regulation, we explored the relationships between strategy stages and orientation to well-being, ill-being, and relationship functioning. We found considerable support for the idea that engagement-oriented strategies would be more strongly related to positive outcomes such as well-being and perceived social support than disengagement strategies which in turn would be more strongly related to negative outcomes such as ill-being and loneliness. Well-being was significantly positively related to all engagement-oriented strategies but also negatively related to two disengagement-oriented strategies and positively related to the disengagement-oriented cognitive change strategy of reduce importance. Perceived social support was significantly and positively related to three engagement-oriented strategies but also negatively related to the disengagement-oriented strategy of expressive suppression. Ill-being was positively related to all disengagement-oriented strategies except reduce importance but also negatively related to three engagement-oriented strategies. Loneliness was significantly positively related to four disengagement-oriented strategies but also negatively related to three engagement-oriented strategies.
We also investigated whether the strategies occurring earlier in the process model would have stronger relations with well-being, ill-being, and social functioning relative to strategies occurring later in the process model (see Figures 3 and 4). We found only limited support for this idea. For well-being and ill-being, the slopes in Figure 3 trend in the expected direction, however, at a very shallow angle. The relationship magnitudes of several strategies also lie at a considerable distance from the slope. For social functioning, the expected trend was stronger among the first four regulation stages. However, the response modulation strategies had the strongest relation to perceived social support as well as loneliness. This may indicate that intra-individual adaptiveness of different strategy stages need not match the interindividual adaptiveness.
Conclusion
In this study, we replicated evidence for the internal consistency of the PMERQ and complemented it with evidence for convergent, divergent, and predictive validity. We also demonstrated the usefulness of the PMERQ for addressing important substantive research questions. Overall, the pattern of relations between strategy use and important outcomes suggested that regulation stage and regulation orientation can explain some but not all of the variance in the adaptiveness of emotion regulation.
Study 5—PMERQ Applied in Relation to COVID-19
In Study 5, we sought to replicate the evidence for the psychometric properties as well as predictive validity of the PMERQ in an independent sample. We also sought to reduce the contextual variance present in Studies 1 to 4 by focusing on a shared source of negative affect: the COVID-19 pandemic. During its early stages, many countries imposed lockdown orders in some form, restricting individuals to socially isolate and/or stay at home. During this time, individuals reported decreases in their overall well-being and increases in symptoms of anxiety and depression as was evidenced for instance in the United States (Holman et al., 2020), Germany (Zacher & Rudolph, 2021), Denmark (Sønderskov et al., 2020), and New Zealand (Sibley et al., 2020).
We used this backdrop to assess how well the PMERQ could predict well-being, ill-being, and relationship functioning among participants facing a common and substantial stressor.
Method
Sample
Participants from the United Kingdom and the United States from areas with high COVID-19 mortality rates were recruited at the beginning of 2020 through the crowdsourcing platform Prolific Academic. Because stress from COVID-19 is differentially related to living conditions, with those living alone or with children experiencing more stress (Kowal et al., 2020), we equally sampled individuals from different living situations, namely, living alone, living with a romantic partner, and living with children, to control for their impact as well as gender. A total of 832 persons participated in the study with a payment of £3.13 each. After removing those who did not meet our preregistered criteria (see Note 1; n = 117), the final sample of 715 people was on average 37.9 years old (SD = 11.8), with 52% identifying as female, and all could speak English well or very well. Participants were on 85.6% White, 5.9% Black, 2.5% Asian, 2.9% other, with 15.0% having completed high school or an equivalent degree, 15.9% with a trade certificate or similar degree, 42.5% with a bachelor’s degree, and 25.7% with a graduate degree. More than half of the sample (52%) agreed with the statement that they were worried about their health, with 9% reporting at least one preexisting health condition, and 62% reporting at least some change in their employment, since the coronavirus outbreak.
Procedure and Measures
Participants completed several measures online (see Supplemental Material). This included the final 10-scale 45-item version of the PMERQ.
Well-Being and Ill-Being
Well-being and ill-being were assessed with the same scales used in Study 4. Namely, well-being was assessed with: (a) psychological well-being (α = .85), (b) satisfaction with life (α = .90), and (c) the aforementioned positive affect items (α = .82). Ill-being was assessed with: (a) the Ultra-Brief Screening Scale for Anxiety and Depression (PHQ–4) anxiety (α = .88), (b) PHQ-4 depression (α = .85), and (c) the aforementioned negative affect items (α = .91).
Loneliness
For relationship functioning, we again assessed loneliness, this time using the brief measure of loneliness (Roberts et al., 1993). Participants completed items like “I feel left out” using a 4-point response scale ranging from never, to rarely, sometimes, and often. This 4-item measure had acceptable internal consistency (α = .83).
Throughout the study, we directed participants’ attention to the coronavirus pandemic with instructions like “Please consider only the time since social-distancing and shelter-in-place were recommended because of the coronavirus outbreak.”
Results
Psychometric Evaluation
Each PMERQ subscale had acceptable internal consistency, factor saturation, and model fit (see Table 1). Likewise, each scale had scalar invariance between males and females and between older and younger adults (see Supplemental Material). When modeled in a single model, with separate factors for each strategy, the strategies were sufficiently distinct from one another and there was good fit to the data, χ2(900) = 2,191.57, p < .001, CFI = .928, RMSEA = .045, SRMR = .049; see Table 2.
Predictive Validity
We again applied structural equation modeling to evaluate the relation between each emotion regulation strategy with our outcomes of interest. The well-being factor (ωH = .72) and the ill-being factor (ωH = .81) had acceptable factor saturation and the model had an acceptable fit to the data, χ2(1,158) = 2,783.45, p < .001, CFI = .919, RMSEA = .044, SRMR = .052. Loneliness was modeled as a single latent variable, indicated by its four items, and allowed to correlate with each PMERQ strategy. The loneliness factor had acceptable saturation (ωH = .84) and the model had acceptable fit to the data, χ2(1,072) = 2,526.95, p < .001, CFI = .924, RMSEA = .044, SRMR = .049.
Replicating the predictive validity results of Study 4, we found that all emotion regulation strategies were significantly related to indicators of well-being, ill-being, and relationship functioning (see Table 7 and Figures 5 and 6). For ill-being and well-being, 16 of the 20 tested relationships were significant. Each PMERQ subscale was related to well-being, ill-being, or both except for reduce importance which was related to neither. For loneliness, 8 of the 10 tested relationships were significant. The strategies of focus elsewhere and reduce importance that remained unrelated to loneliness were again cognitive in nature. Overall, the pattern of findings closely resembled the pattern observed in Study 4 further supporting the predictive validity of the PMERQ.
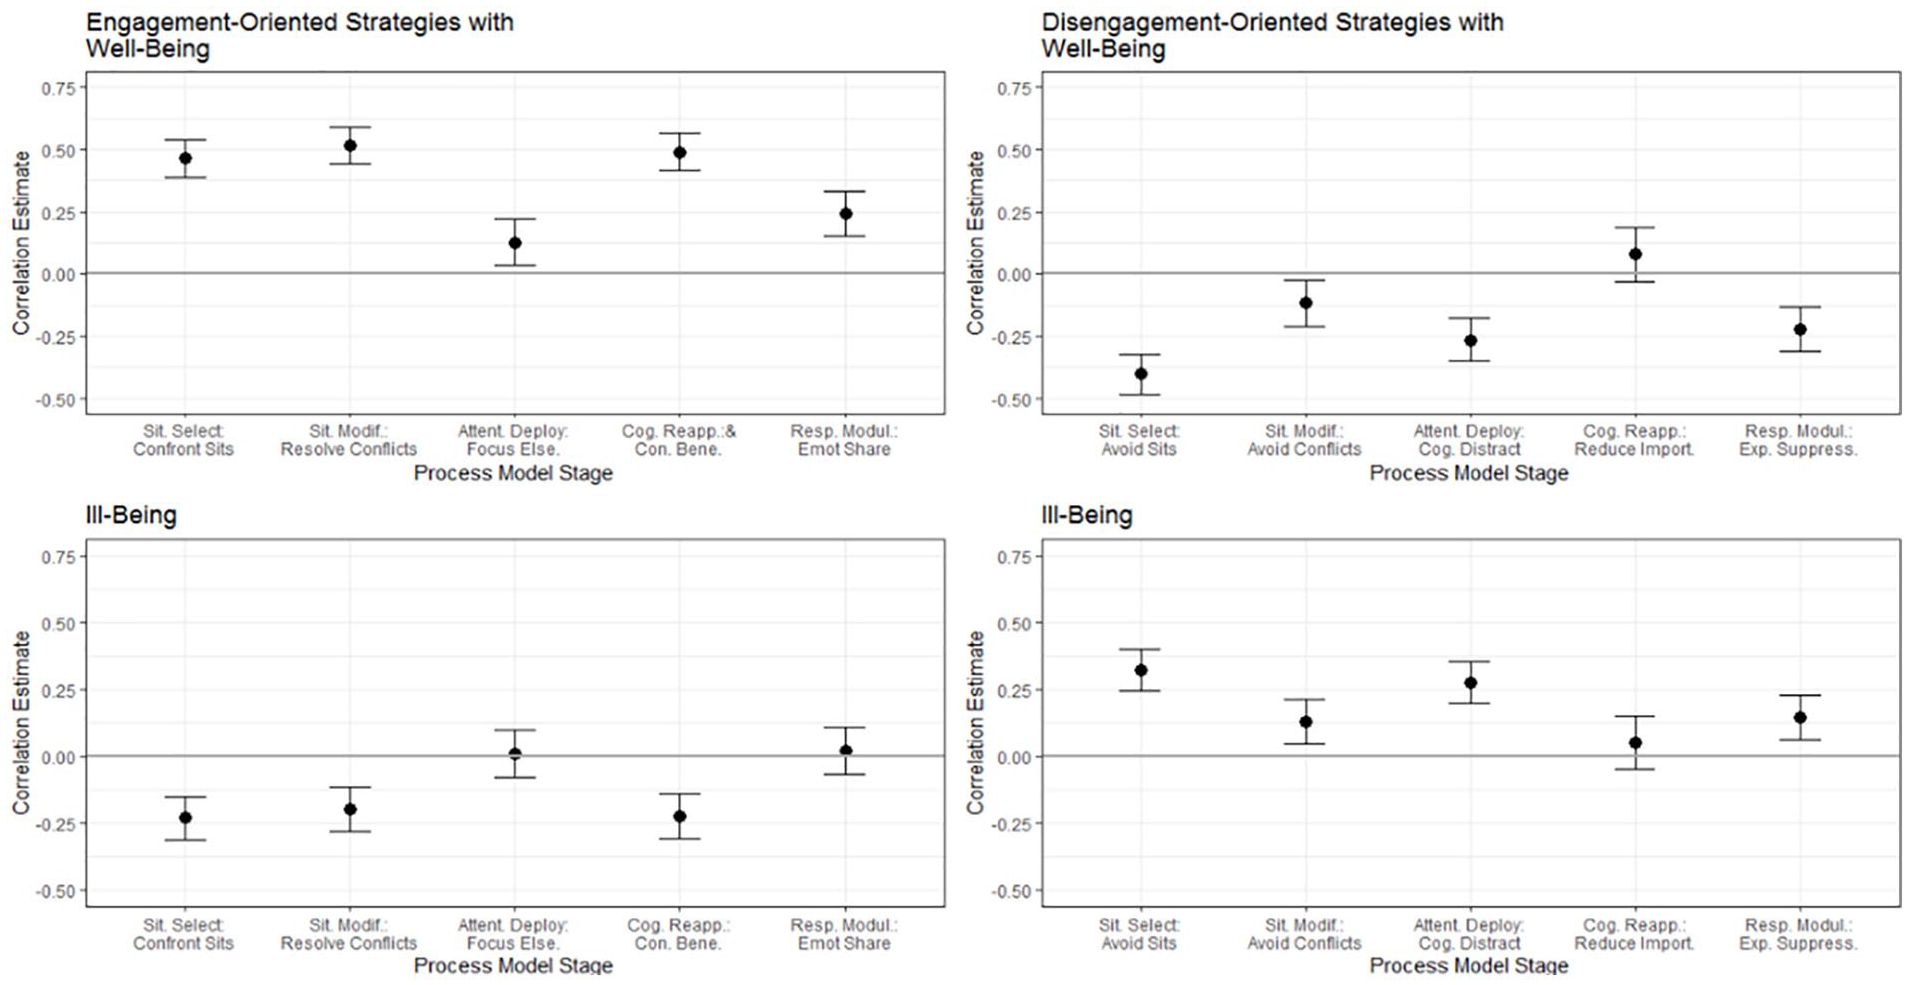
Study 5: Illustration of the correlations between emotion regulation strategies with affective functioning variables, when modeled as latent factors, during the COVID-19 pandemic.
Study 5: Illustration of the correlations between emotion regulation strategies with the relationship functioning variable of Loneliness, when modeled as latent factors, during the COVID-19 pandemic.
In Study 5, we also attempted to replicate the findings concerning the role of strategy stage and orientation in explaining well-being, ill-being, and relationship functioning. We found broadly similar but somewhat weaker support for the idea that engagement-oriented strategies would be more strongly related to positive outcomes than disengagement strategies and vice versa. Specifically, focusing on significant relationships we found that well-being was related positively to all five engagement-oriented strategies but was also negatively related to four disengagement-oriented strategies. Ill-being and loneliness were positively related to four disengagement strategies but also negatively related to four engagement strategies. It is possible that the pandemic context altered the adaptiveness of different strategies leading to a higher proportion of “crossed” relationships whereby engagement-oriented strategies not only facilitate positive but also inhibit negative outcomes and disengagement-oriented strategies not only inhibit positive but also facilitate negative outcomes.
Concerning the role of the regulation stage, we again found a broadly similar and slightly different pattern of results. Like in Study 4, the slopes of trend lines in Figures 5 and 6 point in the direction consistent with the idea that strategies occurring earlier in the process model would have stronger relations with important outcomes relative to strategies occurring later in the process model. It is possible that unwanted emotions and related social tensions accompanying the COVID-19 pandemic are less sensitive to regulation through response modulation strategies.
Conclusion
These results confirm the psychometric quality and predictive validity of the PMERQ in a specific context. It also underlines the usefulness of the PMERQ for addressing important substantive questions by largely replicating patterns observed in Study 4 while also identifying interesting differences that can be explained by the nature of COVID-19 as a stressor.
Discussion
Through a series of five studies, we presented the development and a psychometric evaluation of the PMERQ, a new measure to assess the use of specific emotion regulation strategies across the stages of the process model and balanced between engagement and disengagement orientation.
Strong Psychometric Properties
Through a series of three studies, we developed a 10-scale questionnaire that samples the use of emotion regulation strategies across five stages of emotion generation while distinguishing between the engagement and the disengagement orientation at each stage. We found the subscales to have sufficient internal consistency, factor saturation, and test–retest reliability. The scales were only weakly related, or unrelated, to social desirability and most personality traits suggesting reasonable divergent validity. The scale was largely invariant between men and women and across age, indicating it operates comparably between these different demographic groups. The measure showed strong convergent validity with established measures of emotion regulation, supporting the construct validity of this scale. Finally, we found differential relations between the use of individual emotion regulation strategies, assessed through individual PMERQ subscales, with well- and ill-being, as well as with different indicators of relationship functioning, supporting the predictive validity of the scale.
We found the process model stage and strategy orientation largely described the overall structure of the scale; however, individual subscales varied in the extent to which they matched this pattern. In particular, focus elsewhere, developed as an engagement-oriented attentional deployment scale, was related to both an engagement-oriented factor and = a disengagement-oriented factor. This can be explained by the item content of focus elsewhere which concerns actively directing attention to less negative aspects of an emotion-eliciting situation. For the most part, this falls under the definition of engagement as it involved cognitively engaging with the emotion-eliciting situation. However, the movement away from the negative aspects of a situation also involves a disengagement orientation. Nevertheless, focus elsewhere was a significant predictor of well-being but not of ill-being in line with its categorization as a primarily engagement-oriented strategy. Future research could consider revising this subscale to more closely align with an engagement orientation.
Impact of Strategy Stage and Orientation
In addition to psychometric properties, we also sought to demonstrate the usefulness of such a comprehensive scale for the field of emotion regulation. A lack of instruments that would cover the full range of strategy families envisioned by the process model of emotion regulation has made it difficult to address important questions such as the hypothesized role of the strategy stage in the helpfulness of emotion regulation. Our findings indicated that emotion regulation strategies that intervene earlier versus later in the emotion-generative process tend to have a small advantage in terms of being related to high well-being and low ill-being. While this has been shown with experimental designs, we are the first to show that a similar pattern can be observed from an individual differences perspective.
In addition, the frequent use of strategies with an engagement orientation was generally related to higher well-being and lower ill-being while the frequent use of strategies with a disengagement orientation was generally related to lower well-being and higher ill-being. While this pattern has been generally documented for individual differences, we were the first to show the pattern largely extends across the process model with strategy orientation being a dominant indicator of the impact of a strategy. We also found important exceptions to this pattern. Specifically, the disengagement-oriented cognitive change strategy reduce importance predicted well-being rather than ill-being. Also, we found that the pattern of relationships between engagement and disengagement strategy use and outcomes shifted slightly when people reported on their emotion regulatory behaviors in relation to the COVID-19 pandemic.
When predicting relationship functioning, we found that strategy orientation was again an important predictor. We additionally found that strategies occurring earlier in the process model had a stronger relation to relationship functioning, with the exception of response modulation. It may be that the use of response modulation strategies that have a social component transcend the general trend that intervening early is better, at least for relationship functioning. Future research should evaluate the relation of other response modulation strategies, to compare between those that are nonsocial (e.g., exercise, eating) and those that are social, but not specifically about sharing emotions (e.g., group yoga).
Limitations and Future Directions
The limitations of the present work include the inherent problems of self-report measurement such as misremembering or misrepresenting actual behaviors. It is also likely that people may not be aware and are thus unable to accurately report some of the emotion regulatory behaviors they engage in. Another inevitable limitation of our work is that although PMERQ successfully covers the full range of emotion regulation strategy families proposed by the process model, it relies on a finite set of strategies to represent each family. It is possible that different strategies belonging to the same family have different causes and consequences that will remain hidden from the PMERQ scores. Likewise, the subscales were written to focus on a specific regulation goal and thus cannot be generalized to use of the strategy for an alternative goal. One direction for future research involves sampling the different strategies that fall within the process model families to determine if the PMERQ could be further improved by adding or replacing some of its subscales. Another direction for future research is to develop a short-form version of the scale. Finally, the samples included are relatively homogeneous (e.g., ethnicity and education), which limits the generalizability of our results.
More broadly, we hope that the present work opens the door to incorporating the PMERQ into many different lines of research concerning the causes and consequences of emotion regulation strategy use. For instance, the instrument could be used to investigate how strategy use relates to emotion regulation goals, beliefs about emotions, and ways of regulating them. The PMERQ could also help expand the research on the processes that govern decisions about which emotion regulation strategy to use. Finally, the instrument enables to more comprehensively investigate the outcomes of using different combinations of strategies, in conjunction with personality traits as well as situational variance.
Conclusion
Given the overall strong psychometric properties of the PMERQ, we can recommend its use to assess individual differences in the use of emotion regulation strategies. Likewise, we found that the traditional “take” on the process model of emotion regulation, that it is more effective (all else being equal) to intervene at an earlier stage, using antecedent-focused rather than response-focused processes, is incomplete. Looking at engagement versus disengagement-oriented strategies within each emotion regulation family shows that the strategy orientation, and not just the stage, is critical for the overall effectiveness of emotion regulation strategies. This is important both as a theoretical point, to advance the theory of emotion regulation, and to guide clinical advice and interventions.
Supplemental Material
sj-docx-1-asm-10.1177_10731911221134601 – Supplemental material for The Process Model of Emotion Regulation Questionnaire: Assessing Individual Differences in Strategy Stage and Orientation
Supplemental material, sj-docx-1-asm-10.1177_10731911221134601 for The Process Model of Emotion Regulation Questionnaire: Assessing Individual Differences in Strategy Stage and Orientation by Sally Olderbak, Andero Uusberg, Carolyn MacCann, Katja M. Pollak and James J. Gross in Assessment
Footnotes
Authors’ Note
The authors confirm that the data supporting the findings of this study are available within the supplementary materials, as are the pre-registered data cleaning procedures, R syntax, and analysis output.
Declaration of Conflicting Interests
The author(s) declared no potential conflicts of interest with respect to the research, authorship, and/or publication of this article.
Funding
The author(s) disclosed receipt of the following financial support for the research, authorship, and/or publication of this article: Analysis and publication of these results are supported by a grant from the Margarete von Wrangell-Habilitationsprogramm für Frauen and ProTrainU from Ulm University awarded to Sally Olderbak, an Estonia Research Council grant PSG525 awarded to Andero Uusberg, and an Australian Research Council Discovery grant (DP150101158) awarded to Carolyn MacCann.
Supplemental Material
Supplemental Material for this article is available online.