
Abstract
Scientific and systematic data collection and analysis have long been a crucial foundation in psychological assessment systems. It is only through this process that psychology professionals can effectively measure and interpret individuals’ mental states, behavioral patterns, and standing on underlying latent constructs. However, obtaining high-quality task-specific data remains challenging due to issues of cost, time, and scalability, all further complicated by ethical and privacy concerns associated with sensitive psychological information. To address this, we apply alignment training of large language models (LLMs) to generate artificial intelligence (AI)-augmented data. This method uses existing participant responses to create personalized, plausible answers to new or unanswered questions. The augmented data match individuals’ linguistic style and psychological characteristics, thereby simulating plausible personalized responses. We evaluated this method using an archival dataset of life-narrative interviews originally collected for personality trait prediction. We compared the augmented data with the real data, at both the linguistic levels (i.e., via the perplexity metric and the multidimensional tagger) and utility levels (i.e., similar functions, such as personality trait prediction). Finding that AI-generated data closely resemble human data and can therefore support pilot testing or modeling missing responses. Overall, the augmented data approach offers a scalable, effective solution to enriching datasets in AI-based psychological assessments.
Keywords
“Data is the new oil.”
Data have always been the cornerstone of psychological research and practice, whether for building scientific theories or for developing and validating assessment tools. The effectiveness and accuracy of psychological assessment systems rely on the reliable measurement of individuals’ psychological states, behavioral patterns, and standing on latent constructs—a process that depends on systematic and standardized data collection and analysis. From early paper-and-pencil tests to today’s computerized assessments, psychologists have continually explored and refined technological approaches to data acquisition and processing to enhance the reliability and validity of assessment tools (e.g., Epstein & Klinkenberg, 2001). In recent years, the rapid advancement of artificial intelligence (AI) technologies, particularly natural language processing (NLP) and large language models (LLMs), has driven psychological assessment into a new phase of technological innovation (e.g., Brickman et al., 2025; Hua et al., 2025; Wang et al., 2026). The latest generation of psychological assessment systems is increasingly data-dependent, presenting researchers and practitioners with great opportunities, but also growing challenges related to the need for richer datasets (e.g., Alexander et al., 2020; Mandal et al., 2025).
Specifically, the training of AI models generally relies on large-scale, high-quality datasets. However, in the specialized domain of psychological assessment, data resources that are labeled according to psychological constructs, structurally designed, and derived from reliable sources remain rather limited. This situation is particularly common in certain assessment scenarios, such as predicting personality traits from specific types of textual data, where the limitation on available data hinders the development and implementation of AI-driven psychological assessments. Nonetheless, many AI-based inroads to psychological assessment have been made, ones that would benefit from additional data. For example, a growing body of research has explored how text data can be used to infer personality traits (e.g., Fan et al., 2023; Kosinski et al., 2013; Park et al., 2015), assess depression risk (De Choudhury et al., 2013), analyze video data to detect emotional states (Dhall et al., 2015), and predict educational outcomes (Ahmed et al., 2025). At the same time, various organizations have begun applying these technologies to talent selection processes, including resume screening (Harsha et al., 2022), interview performance evaluation (Hickman et al., 2022), job performance assessment (Speer, 2018), scoring of open-ended tasks (Campion et al., 2016; Thompson et al., 2023), and even career trajectory prediction (Song et al., 2023) and employee attrition risk analysis (Somers, 1999).
For AI to move forward in these and related areas of psychological assessment, multiple real-world obstacles must be faced. On one hand, the collection of psychological data must strictly adhere to ethical review procedures (e.g., Institutional Review Boards) that can be complex and time-consuming (Roberts et al., 2024) and only contribute further to the problem of obtaining large-scale, high-quality datasets. In addition, respondents frequently provide incomplete answers during assessments, such as through careless responding (Northcutt et al., 2021) or by skipping items entirely, creating missing data (e.g., Graham, 2009). These types of issues can limit the depth of AI model training and the value of its practical application.
To address the challenges outlined above, this study proposes an AI-augmented data approach based on alignment training (e.g., Ding et al., 2024), aiming to offer one feasible pathway for mitigating the problem of data scarcity. By leveraging participant information/responses collected from existing data sources, the generative model learns individual personality traits and linguistic styles, thereby inferring potential responses to other related questions. This process might support the creation of augmented data. Of course, you cannot get “something for nothing” here. Instead, the point is that the enriched data reflect patterns of variables and profiles in the original data that would not be discovered otherwise.
The structure of this article is organized as follows: First, we define the concept of augmented data and potential application scenarios. Next, drawing on computer science research on alignment training, we outline the key steps and core considerations for generating augmented data and propose an analytical framework for evaluating their effectiveness. We then conduct an empirical study using personality-related life-narrative textual data as a case study to compare augmented and real data. The generation and validation processes of the augmented data are described in detail, and complete code is provided to support replication and further research. Finally, we explore the conceptual implications of augmented data within the field of psychology and reflect on potential ethical and methodological challenges in real-world applications, aiming to offer a sustainable and responsible path forward for psychological assessment research.
Augmented Data: Answering Key Questions
What Is Augmented Data?
In this study, we define augmented data as new, semantically plausible data generated from original data through language modeling or other generative mechanisms. This article focuses on textual data (see the “Why Study Textual Data?” section), though other types of augmented data are possible. This type of augmentation involves learning the underlying patterns, semantic style, and logical structure of the original data to produce new data points that are possible but not actually observed. The goal of data augmentation is to expand the expressive space of the existing data, thereby supplementing information and enriching the modeling input (e.g., Kobayashi, 2018; Wei & Zou, 2019).
For example, suppose we have a substantial amount of interview responses from a particular participant. These responses reflect the individual’s unique characteristics in specific contexts, including their expression habits, attitudinal tendencies, and linguistic style (i.e., the external presentation of personality). When generating augmented data, we can construct a personalized model based on the existing responses and further infer how this participant might respond to other questions that were not originally asked. Although these newly generated responses are not part of the original dataset, they remain consistent in style and semantics with the participant’s actual statements, thereby maintaining a certain level of fidelity. This process thus extends and enhances the richness of the data, allowing researchers to simulate an individual’s reactions and attitudes across new and diverse contexts that were not part of the original research.
It is also important to emphasize that the generation of such augmented data remains highly dependent on the quality and diversity of the original/real data. If the original data are narrow in scope, lack informational depth, or contain significant errors (e.g., those introduced through transcription), the resulting augmented data may, of course, inherit similar limitations. Conversely, to the extent that the original data are wider-ranging and reliable in the characteristics measured, then augmented data can provide additional value.
Why Study Textual Data?
Textual data hold significant value in psychological assessment, as they offer a rich and natural medium for individuals to express their thoughts, emotions, and behavioral tendencies (e.g., Pennebaker et al., 2003; Pennebaker & King, 1999). Language is not only a central means of human communication but also a vital window into personality traits, cognitive styles, and interpersonal dynamics. In everyday life, people routinely use language to describe their experiences, beliefs, and social interactions, making text a dense source of information about individual differences. By analyzing textual data, researchers and clinicians can infer personality, emotional states, and even potential mental health concerns (e.g., Rude et al., 2004; Stange et al., 2017; Tausczik & Pennebaker, 2010).
Using personality as an example, MacKinnon (1944) distinguished between two ways of defining personality: (a) Internal factors, which emphasize the internal organization of the individual, including temperament, emotional rhythms, and strategies for managing social relationships. These internal characteristics influence social behavior, including how individuals perceive and respond to personality questionnaires. (b) External factors, which focus on how others perceive and evaluate an individual’s behavior, conceptualize personality as a “reputation” formed through interpersonal interactions. This external perspective foreshadows the methodological orientation later adopted in lexical and observer-based approaches to personality, in which personality structure was identified through factor analysis of trait descriptors and observer ratings (e.g., McCrae & Costa, 1987; Norman, 1963; Thurstone, 1934; Tupes & Christal, 1992). Together, these two perspectives highlight, from complementary angles, the role of personality in shaping patterns of thinking and behavior in social interactions (Hogan et al., 1996). Internal motivations drive individuals’ language expression in communication, whereas externally observable behaviors serve as the basis for others to form impressions. In the external presentation of personality, factors such as language style, word choice, and narrative structure are all important clues for understanding an individual’s personality.
Using textual data instead of traditional personality questionnaires has several potential advantages. Traditional psychometric tools, such as Likert-type scales in personality questionnaires, often simplify the process of capturing individual differences. For example, in the Big Five Inventory-2 (BFI-2) scale (Soto & John, 2017), one item reads, “Is outgoing, sociable.” Respondents are asked to rate this statement on a scale from 1 (strongly disagree) to 5 (strongly agree). Even when different individuals give the same score (e.g., 4, somewhat agree), the underlying psychological motivations and specific manifestations can be vastly different. For instance, one individual might think, “I am very outgoing around people I know well and enjoy organizing social gatherings, but I tend to be more reserved in formal settings or with strangers.” Another individual might think, “I used to be quite introverted, but recently I have been making an effort to be more proactive in making friends—especially at work, where I have become more open to socializing.” From this perspective, textual data provide richer information than a single numerical rating, as they can reveal the diverse psychological mechanisms behind the responses within each person. Therefore, studying textual data can enable a deeper and more nuanced understanding of individual differences, thus expanding both the breadth and depth of psychological assessment. In addition, augmented data generated from textual responses can better reflect individual personality traits and language styles, further highlighting personal variation.
Why Would One Augment Data?
The primary motivation for generating augmented data is to address the issue of certain forms of data scarcity in psychological research. As previously mentioned, psychological data often involve sensitive personal information (e.g., emotional states, psychological disorders) which must be collected in strict accordance with ethical review procedures, including approval from an IRB (e.g., Roberts et al., 2024). This process typically involves detailed research design, the preparation and review of informed consent forms, and comprehensive protection of participant rights, making the overall process slow and unsuited for rapid, iterative experimentation.
Moreover, acquiring psychological data is relatively costly. Unlike data that can be automatically gathered via web crawlers, high-quality psychological data often rely on participants completing structured assessments, interviews, or questionnaires. These methods require significant human resources and are constrained by time, location, and sample accessibility—challenges that are particularly pronounced when working with specific clinical populations or representative samples (e.g., Northcutt et al., 2021). To ensure scientific validity and comparability, substantial resources must also be invested in the standardization and quality control of measurement tools. Against this backdrop, the generation of augmented data offers a practical alternative to help enrich the qualities of an existing dataset. Augmented data should be viewed as extending and enriching existing data, rather than replacing real data. Essentially, augmented data reflect predictions from existing data, through the use of LLMs, as described below. In this way, results based on augmented data can provide future directions for data collection and research, thus accelerating the pace of scientific inquiry.
Furthermore, the augmented data approach can generate data for situations that would be sensitive, difficult, or even impossible to investigate through real-world experiments. By constructing hypothetical question-response pairs via LLMs, researchers can simulate individuals’ potential reactions to scenarios they have not actually experienced. For instance, researchers can model how individuals might respond verbally when faced with high-pressure environments or moral dilemmas, thereby gaining insights into their psychological response patterns and value orientations. Such scenarios are often challenging to implement in real-life studies due to ethical constraints. However, augmented data methods offer an alternative path for exploring extreme or sensitive situations within ethically permissible boundaries, similar to how the vignettes technique is used to study real-world phenomena that are difficult to manipulate or ethically risky (e.g., Aguinis & Bradley, 2014; Hughes, 1998).
How Do Augmented Data Differ From Other Methods?
In this section, we primarily compare augmented data and synthetic data. Although both involve generating new data based on original data, they differ significantly in terms of their purpose, methods of generation, and usage scenarios.
In this study, we adopt the following definition as one of the established interpretations of synthetic data in the literature: Synthetic data aim to replicate the statistical structure and characteristics of the original data as closely as possible without disclosing any real observations (e.g., Wang et al., 2024). This approach is commonly used in situations where the original data cannot be directly used—such as those involving privacy concerns, legal and ethical constraints, or restricted access to data (Fonseca & Bacao, 2023; Jordon et al., 2022). As such, synthetic data are considered an alternative in sensitive or restricted environments, with the core objective being to “simulate” the original data while strictly avoiding the reconstruction of actual individuals’ information. Common synthetic data generation techniques include synonym replacement, random deletion, and sentence shuffling, which introduce perturbations within the representational space of the original data without expanding their original semantic boundaries.
In contrast, the generation of augmented data is based on individual expression styles and semantic patterns present in the original data, making it a generation process with implicit semantic constraints. Such data must not only align with the subject on a semantic level but also preserve their linguistic habits, expressive style, and ideological tendencies. In other words, augmented data are not entirely fabricated from scratch; rather, they represent a conditional extrapolation and expansion within the semantic space of the original subject. They emphasize “semantic fidelity” and “subject consistency,” aiming to broaden data coverage while maintaining strong alignment in style, stance, and semantic expression with the original individual. This type of generation often requires subject-level modeling (e.g., linguistic style modeling) to learn and reproduce the subject’s distinctive patterns of expression.
As shown in Figure 1, although both are based on original data, synthetic data focus on privacy protection and structural replication, with the goal of “simulating the original data,” whereas augmented data emphasize the expansion and enrichment of individual semantics, aiming to “generate more data.”
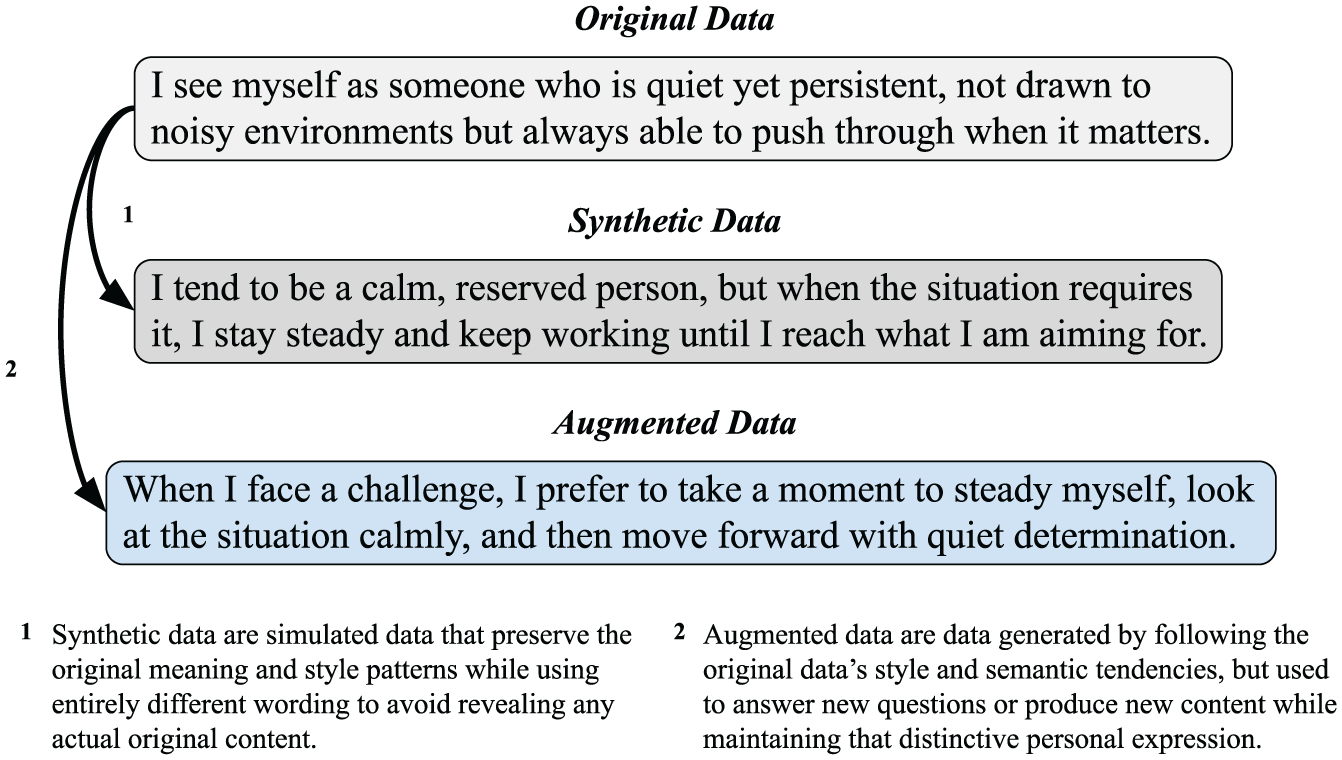
Example of original data, synthetic data, and augmented data.
How Can a Researcher Generate Augmented Data?
Researchers can train models to align with human expressive features, thereby generating augmented data that show similar consistency in linguistic expression (e.g., Ouyang et al., 2022; Rafailov et al., 2023).
In recent years, LLMs have demonstrated remarkable capabilities in natural language processing, particularly in natural language generation. These models are typically pretrained on massive corpora containing hundreds of billions of words, encompassing a wide range of text types, such as books, news articles, and web pages. The scale of this training data is equivalent to millions of articles or even hundreds of thousands of books (e.g., Touvron et al., 2023). Such extensive language input endows the models with broad linguistic knowledge and highly transferable generative abilities, laying a solid foundation for further modeling of individualized language styles (e.g., Brown et al., 2020; OpenAI, 2023). Building on this foundation, researchers can further fine-tune LLMs (already equipped with general knowledge) through post-training alignment methods to better match specific tasks or individual expression preferences. Common alignment training approaches include Supervised Fine-Tuning (SFT; e.g., Ouyang et al., 2022), Reinforcement Learning (RL; e.g., Christiano et al., 2017), and Direct Preference Optimization (DPO; e.g., Rafailov et al., 2023). This article primarily adopts the DPO approach to explore how to generate individualized augmented data that are stylistically consistent and semantically reliable.
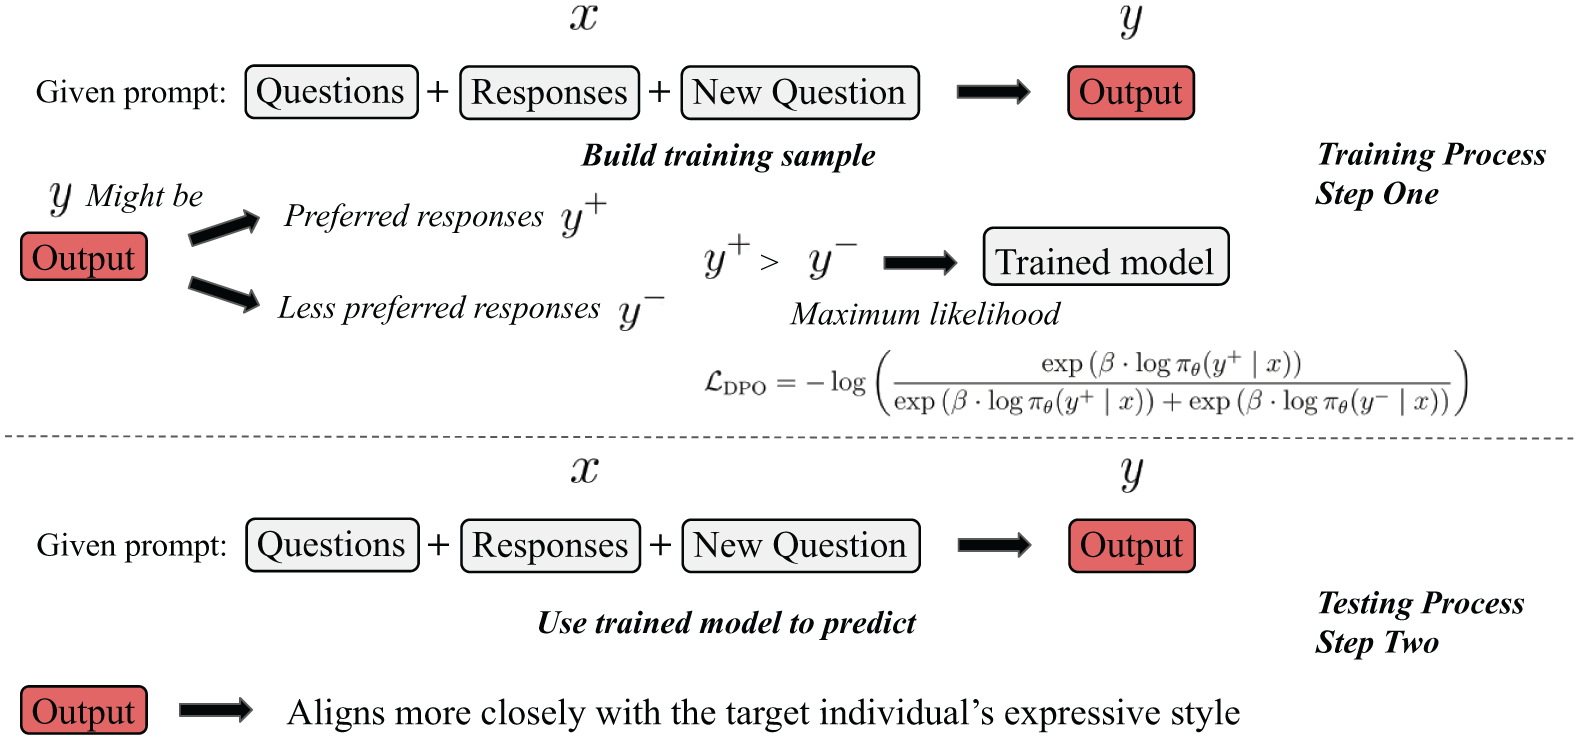
Figure 2 illustrates how the DPO method can be used to train a model for generating augmented data. Specifically, suppose we have collected a substantial number of responses from an individual across multiple interview questions. These responses reflect the individual’s language style, viewpoint tendencies, and habitual expressions in specific contexts. We can then select a portion of the existing data and treat it as if the individual has not yet answered those questions. Based on the remaining collected data, we generate predicted responses to these held-out questions.
Example of DPO.
Based on the individual’s collected responses, we can construct the preference-pair dataset required for DPO training: the authentic responses from the original corpus are treated as the “preferred responses,” while randomly selected responses from other individuals or outputs generated by unaligned models are considered “less preferred responses.” Since an individual often demonstrates a high degree of consistency across different responses (e.g., word choice, language style, narrative approach, content organization, and even personality), this consistency is precisely what DPO training aims to capture and reinforce. By constructing preference comparisons between “preferred responses” and “less preferred responses,” the model is guided during training to recognize and favor the generation of text that aligns more closely with the target individual’s expressive style. In this way, we can build effective training pairs for alignment without relying on additional human annotations, allowing the model to gradually learn to produce text that better reflects the linguistic style and expressive preferences of the target individual.
The training objective of DPO can be formalized as the following optimization objective function:
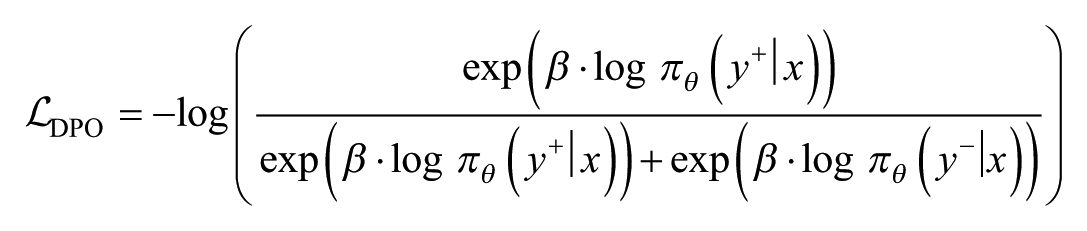
where
In addition to the DPO method, RL approaches are also commonly used for alignment training. These methods typically require an external reward model or human-provided feedback signals as the basis for training. In contrast, the DPO method does not require an explicit reward function or additional human feedback, making it more practical and efficient in resource-constrained settings. The process of DPO optimizing the policy involves an implicit reward signal (i.e., derived from preference data) that guides the learning process.
How Can Augmented Data Be Validated?
After generating augmented data, an important step is to validate these data to ensure their practical value. Here, we will focus on two key questions: first, what types of data should the augmented data be compared with; and second, from which dimensions or characteristics should the augmented data be evaluated.
Comparison With Other Data
To validate the effectiveness of the generated augmented data, the first step is to establish clear comparison benchmarks. In the process of constructing preference pairs (e.g., Rafailov et al., 2023), we typically regard responses genuinely written by the user in the original corpus as the preferred responses, while treating randomly selected responses from other individuals or responses generated by a non-personalized model as less preferred responses. This approach is based on a reasonable assumption: responses from the same user are more likely to reflect their unique linguistic style and personality traits, aligning more closely with their authentic expression in terms of interaction logic, emotional tone, and manner of expression. In contrast, randomly selected responses or those generated by an uncalibrated model often lack coherence and may appear generic or inconsistent with the target individual’s style.
Therefore, when assessing the effectiveness of augmented data, we suggest systematically comparing it with the following three types of data: (a) the target individual’s original, authentically written responses (real data), (b) randomly selected responses from other individuals (random data), and (c) generalized responses generated by an uncalibrated model/original not fine-tuned model (baseline data). If the augmented responses exhibit greater similarity to the real data than the other two comparison sets (random data vs. real data and baseline data vs. real data), it would indicate the effectiveness of the augmented data.
Utility and Linguistic Properties
After establishing the basis for comparison, we also need to clarify which aspects of the data should be evaluated. Given that augmented data are generated through language modeling or other generative mechanisms to produce semantically reasonable new data, we need to examine two main aspects: utility and linguistic properties.
Utility
First, we need to examine the utility of the data. If the primary purpose of the real data is to infer an individual’s personality traits, then it is especially important to check whether the augmented data retain similar capability. One approach to do so is by training models to perform personality scoring tasks separately on augmented data and other types of data, and then comparing their predictive outcomes (e.g., self-reported Big Five scores).
Given that the augmented data generated in this study consists of responses to a single question, we first need to evaluate prediction performance using single-question inputs. Specifically, we need to compare models trained on augmented data with those trained on real data, random data, and baseline data. This comparison enables us to assess how the augmented data perform relative to these alternative data sources. Second, in practical applications, augmented data are typically used in conjunction with existing data. Therefore, we also need to evaluate prediction performance when combining each type of data (i.e., augmented data and other comparative data) with participants’ previously collected responses to 31 questions. This approach reflects real-world usage scenarios and enables a more comprehensive comparison of the utility of augmented data across different input conditions. We anticipate that the augmented data will exhibit performance highly comparable to that of the real data.
Linguistic Properties
Second, on the linguistic level, different individuals often display distinct language usage patterns, such as in vocabulary choice, syntactic structures, and expressive rhythm. To further evaluate whether the augmented data preserve these individualized linguistic features, we propose using two analytical methods: Perplexity (e.g., Miaschi et al., 2021) and Multidimensional Tagger Analysis (MTA; e.g., Nini, 2019).
Perplexity
Perplexity is a commonly used metric for evaluating the performance of language models, originally introduced in 1977 in the context of speech recognition Jelinek et al. (1977). It measures the model’s uncertainty when predicting a sequence of text. The lower the perplexity, the more confident the model is in predicting the next word, and thus the better its performance. Suppose we have a language model and a test corpus consisting of
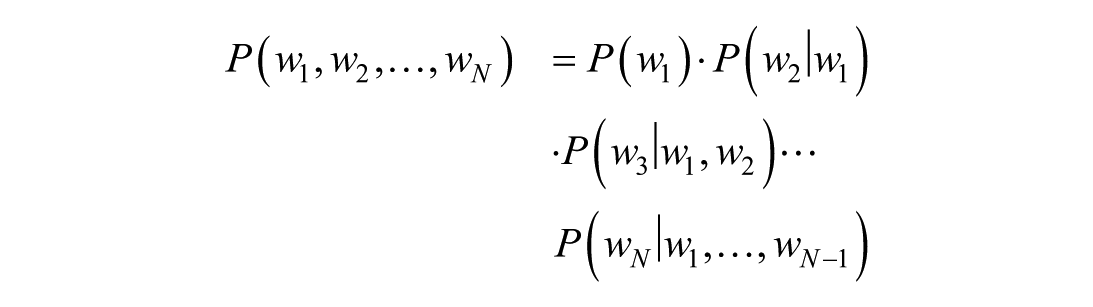
The definition of perplexity is as follows:

where
A language model is constructed by learning language patterns from a large corpus (e.g., Bengio et al., 2003; Mikolov et al., 2010). Its predictive ability heavily depends on how well the input text aligns with the language distribution on which it was trained. Therefore, when the linguistic style, vocabulary usage, and syntactic structure of the input data are similar to those encountered during training, the model can make more accurate predictions, resulting in lower perplexity. Conversely, if the linguistic characteristics of the input data deviate from what the model expects (e.g., different grammar, word combinations, or structures), the prediction accuracy decreases, resulting in a significant increase in perplexity (e.g., Jurafsky & Martin, 2023).
Thus, by comparing the perplexity scores generated by the model for different types of data, we can effectively assess how similar those data types are to the language distribution the model has learned. This, in turn, indirectly reflects the differences in language distribution between various datasets. If two types of data share similar linguistic features, the model should exhibit comparable perplexity scores when processing them. However, if there are substantial differences between datasets, the perplexity values will differ accordingly. In this way, perplexity serves as an effective metric for evaluating the similarity of linguistic characteristics across different datasets.
Multidimensional Tagger Analysis
MTA is a text analysis method developed by Nini (2019). Its theoretical foundation traces back to Biber’s (1988) Variation across Speech and Writing tagger, which supports the multidimensional functional analysis of English texts. This approach involves tagging and quantitatively analyzing texts across multiple linguistic dimensions to uncover linguistic features and functional distinctions. By applying this method to different types of data, researchers can systematically assess whether augmented data differ from different types of data in terms of multidimensional stylistic distribution, thereby verifying their linguistic fidelity. This analytical approach is widely adopted in the field of linguistics, particularly for exploring the linguistic properties and communicative functions of texts.
In the present study, we evaluated six core functional dimensions to conduct a comparative analysis between augmented data and various types of data, examining the similarity of their linguistic property distributions. These six dimensions each reflect a distinct communicative focus of the text and are defined as follows: (a) Involvement vs. Informational: Measures the degree of interactivity and information density in the text, indicating whether the author writes with a personal attitude or audience awareness versus a focus on conveying dense factual information; (b) Narrative vs. Non-narrative: Assesses whether the text is structured primarily around the recounting of events in temporal order; (c) Situation-independent vs. Situation-dependent: Analyzes whether the text can be understood independently of a specific context, reflecting the universality of its meaning; (d) Overt Persuasion: Identifies the frequency of subjective evaluation, stance-taking, or persuasive language in the text; (e) Abstract Information Expression: Measures the degree of technicality, formality, and abstraction in the language used; (d) Online Informational Elaboration: Reflects the characteristics of densely informative expressions produced in real-time, often seen in spontaneous or task-driven texts.
Current Study: Empirical Demonstration of Augmented Data
In the previous section, we systematically introduced what augmented data are, why generating augmented data holds research significance, and the methods and evaluation approaches for their generation. To further validate the feasibility of augmented data and their value in research applications, this study presents an empirical investigation that systematically demonstrates the generation process and evaluation results of augmented data. In this study, we used a set of life-narrative interview data, which was initially collected for personality trait prediction. Based on these interview contents, we generated augmented data and evaluated these data from the following dimensions: utility (downstream task performance effectiveness), the extent to which personality trait information was preserved, and consistency in language style.
Based on the above goals, we propose two research questions:
During the augmented data generation process, we train the model based on individuals’ existing responses so that it can generate potential replies they might give to other related questions. Since this content is generated based on real responses, the augmented data may contain richer personality trait information. This may be because the model is able to integrate an individual’s reactions across different contexts during generation, thus constructing a more comprehensive profile of the individual. In contrast, when individuals face new questions in real-life situations (especially in the absence of clear context or guidance), they often provide only partial information or selectively express certain traits. Therefore, in some cases, the generated augmented data may more fully reflect an individual’s personality traits than their actual responses.
For the linguistic properties, we expect the augmented data to closely resemble the individual’s real responses. This expectation is based on the fact that augmented data are typically generated through fine-tuning with the individual’s original responses. As a result, the model tends to follow the individual’s original language patterns during the generation process.
Method
Transparency and Openness
We report how we determined our sample size, all data exclusions, all manipulations, and all measures in the study. Additional study materials are provided in the Appendices. The analytic codes for all studies are available via the project’s GitHub repository: https://github.com/wpengda/Augmented_Data. We used Python 3.9 with pandas 2.0.0 (The Pandas Development Team, 2020), numpy 1.24.2 (Harris et al., 2020), tenacity 8.2.2 (https://github.com/jd/tenacity), as well as API interfaces from OpenAI (gpt-4.1-mini-2025-04-14; https://openai.com), Qwen3 (Qwen3-30B-A3B-Instruct-2507; Yang et al., 2025), and LLaMA-Factory (Zheng et al., 2024) to fine-tune the model and generate the augmented data. Psychometric analyses were conducted using R (version 4.4.0; R Core Team, 2024). This study was not preregistered.
Sample and Procedure
To increase statistical power and enhance the generalizability of findings, archival data from three studies were combined for the current analyses, each involving an undergraduate student sample and a working adult sample. All participants employed identical measures. Undergraduate students were recruited from a large public university in the Midwest and granted research credit for participation. Working adult participants were recruited from two high-quality crowdsourcing platforms, Prolific and Cloud Research Connect, and received payment for participation.
The first study aimed to validate the AI chatbot for personality assessment; the second study aimed at comparing the chatbot interview to essay-like methods; the third study aimed at assessing the faking resistance of the chatbot interview in simulated high-stakes contexts. We only used data from participants who completed the BFI-2 (Soto & John, 2017) and the same life-narrative personality interview (data all collected through chatbots) under honest reporting conditions (i.e., they were asked to respond honestly) for the current analysis. After excluding responses that failed attention checks (n = 140) or were incomplete (n = 422), a total of 808 valid participants remained for analysis. The average participant age was 26.7 years (SD = 11.4). Regarding gender identity, 55.5% identified as women, 42.6% as men, and 2.0% as another gender. In terms of racial/ethnic identification, 59.2% identified as White, 21.3% as Asian, 10.4% as Hispanic/Latinx, 8.5% as Black or African American, and 0.2% as Other. On average, participants produced 20.79 words in response to each question (SD = 10.92). Specific sample descriptions for each sample can be found in Table 1.
Demographic Characteristics of Participants Across Three Samples and the Total Sample.
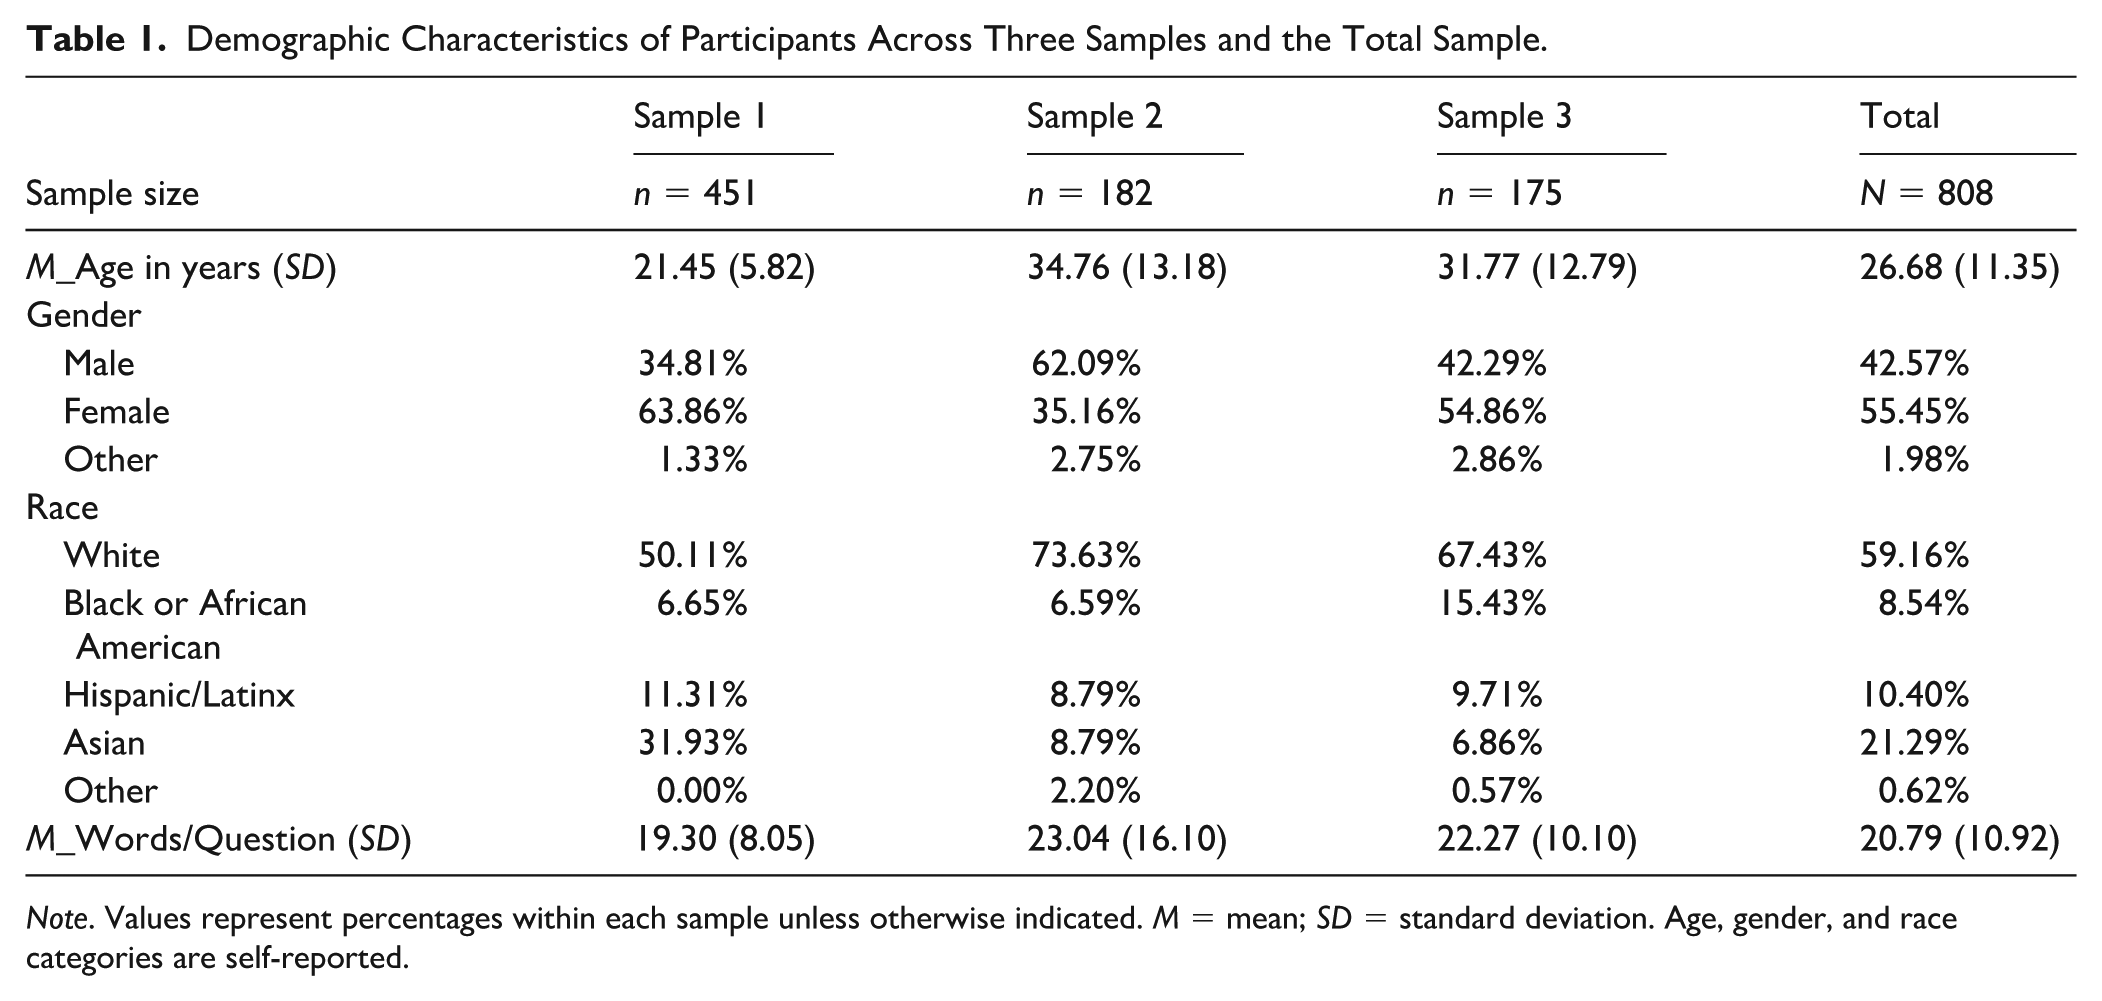
Note. Values represent percentages within each sample unless otherwise indicated. M = mean; SD = standard deviation. Age, gender, and race categories are self-reported.
Measures
Self-Reported Scale-Derived Personality
The BFI-2 (Soto & John, 2017) was used. The BFI-2 is designed to capture three core facets of each of the Big Five personality domains: Open-Mindedness (Openness), Conscientiousness, Extraversion, Agreeableness, and Negative Emotionality (Neuroticism). Each facet is measured by two positively worded items and two negatively worded items, resulting in 60 items in total. Human respondents were instructed to indicate the degree to which they agree with each item on a 5-point scale (1 = “Strongly disagree”, 2 = “Somewhat disagree”, 3 = “Neither agree nor disagree”, 4 = “Somewhat agree”, 5 = “Strongly agree”). The reliability of their 15 Facets scores and the Big Five personality domains in the current samples is presented in Table 2.
Cronbach’s Alpha for BFI-2 Human Responses.
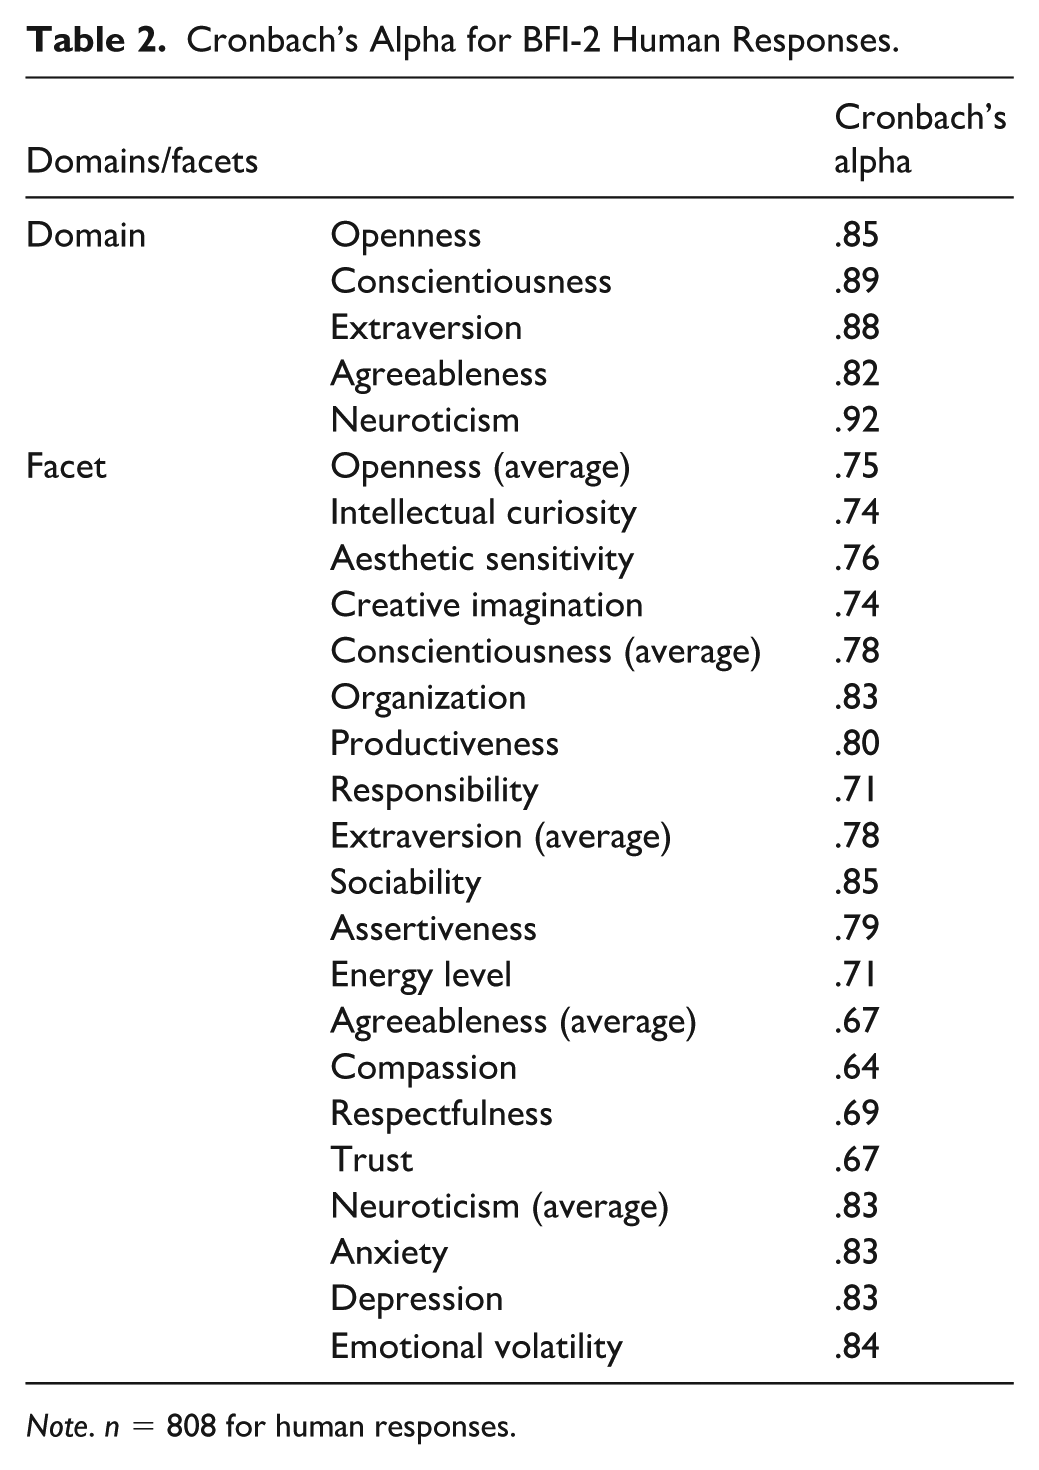
Note. n = 808 for human responses.
Life-Narrative Interview Responses
This study employed the Life-Narrative Personality Interview to collect textual data from each participant. The interview was adapted and modified from McAdams’ life history interview and narrative identity approach (McAdams, 1995, 1996, 2001), incorporating elements from the Structured Interview of the Five-Factor Model (SIFFM; Trull et al., 1998). These interview questions have been used in multiple studies (e.g., Fan et al., 2023; Sun, 2021; Wang et al., 2026), and their reliability and validity have been supported in previous research. The full list of interview questions is provided in Table 4 of Appendix A.
Model Fine-Tuning and Augmented Data Generation
We mentioned the need to fine-tune the model using DPO (e.g., Rafailov et al., 2023) to generate augmented data. To ensure the training process is both controllable and evaluable, we divided the full dataset into a training set and a test set, allowing for reliable validation of the model’s performance on independent data. Given the limited total amount of data, our data-splitting strategy balanced the sufficiency of training data with the statistical power of the test set (medium effect size; e.g., Faul et al., 2007, 2009). Specifically, we reserved 200 cases as the test set, while the remaining 608 were used for training to construct a preference-pair dataset suitable for DPO. We conducted all the analyses using augmented data generated for the testing sample (n = 200).
We treat personality traits and linguistic style as complementary conditioning signals for response simulation. Although linguistic style may inherently reflect personality-related characteristics, disentangling these dimensions is not the primary aim of this work. Rather, we focus on integrating both sources of information to improve the fidelity of personalized augmented data generation. Accordingly, in constructing model inputs, we combined each participant’s BFI-2 self-report results with their responses to 31 questions from the life-narrative personality interview to generate corresponding prompts (see Appendix B for details). The remaining question was randomly selected and treated as an unanswered question, serving as the target for augmented data generation. This does mean that results are contingent on the target question chosen, and other questions could have been chosen as well. But the goal is the same: we want augmented data (i.e., data generated by the DPO-trained model) to perform as close as possible to the unseen real data (i.e., the unseen target individual’s own data). For training data, the participant’s actual response to each prompt was considered the “preferred response,” whereas responses to the same prompt either from other randomly selected individuals or generated by an untrained model were considered “less preferred responses.” These preference pairs were used to support the DPO training process.
For all model outputs, the temperature hyperparameter was set to 0.0, rendering the model’s output nearly deterministic. In general, lower temperature values introduce less randomness during generation. At a temperature of 0.0, the model adopts a greedy decoding strategy, selecting the highest-probability token at each step without considering lower-probability alternatives. This configuration ensures that repeated generations produce highly consistent results with minimal variation, thereby maximizing the reproducibility of our experimental findings. It is worth noting, however, that while a temperature setting of 0.0 is typically regarded as producing fully deterministic outputs, some studies have suggested that non-determinism may still occur due to factors such as hardware-level variability and the inherent non-determinism of floating-point operations (e.g., Atil et al., 2024).
Analytic Strategy
In this study, we conducted a comparative analysis between the augmented data generated for the testing sample (n = 200) and the following three types of data: (a) the original, authentic responses written by the target individual (real data); (b) responses randomly selected from other individuals in testing sample (random data); and (c) generic responses generated by an uncalibrated model (baseline data). For all four types of data, we performed the previously described analyses on utility and linguistic properties.
Utility
For the utility analysis, given that the original core purpose of the life-narrative personality interview is personality assessment, we incorporate the augmented data into the same downstream task for validation. Specifically, each type of data is used as input to predict the corresponding individual’s Big Five personality traits. Figure 3 illustrates the specific steps of this process: first, the textual data are converted into numerical representations (embeddings); then, using these embeddings along with corresponding self-report scores to train models for trait prediction.
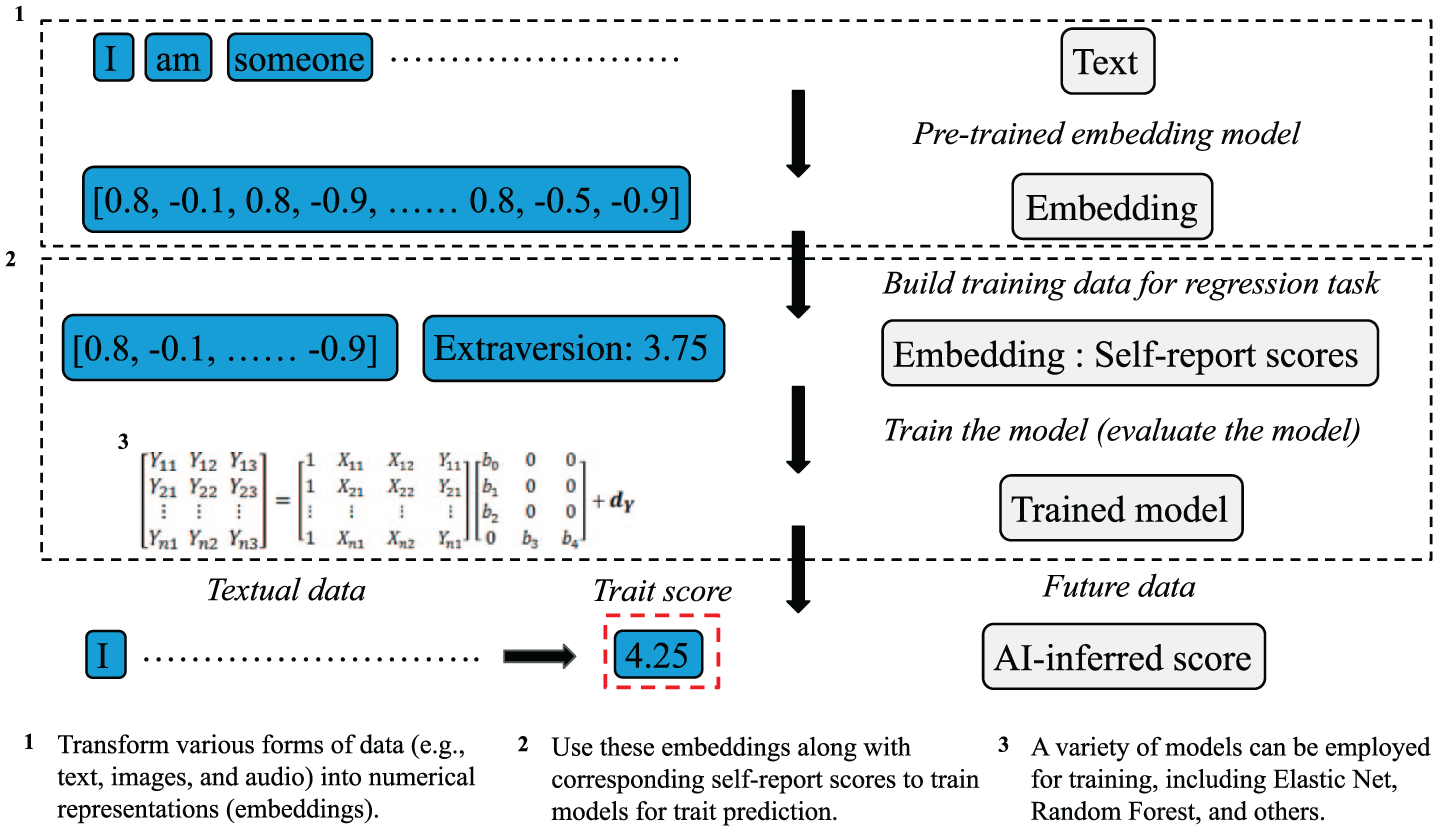
AI-driven assessment process: personality assessment based on textual data as an example.
To evaluate utility, we trained models under two input conditions. First, models were trained using single-question inputs derived from four data sources: augmented data, real data, random data, and baseline data. Second, to simulate practical usage, each data type was combined with participants’ prior responses to 31 questions, and models were trained on these combined inputs. For both input strategies, separate prediction models were constructed for each of the Big Five personality traits. Predictive performance was then compared across conditions.
We employed an Elastic Net and fivefold cross-validation for each task to ensure the robustness and generalizability of the model results. Hyperparameters were tuned using ElasticNetCV from the Python scikit-learn library to select the optimal regularization strength (α) and the L1–L2 mixing parameter (l1_ratio; see Appendix C for details). In total, we trained 200 models (2 × 4 × 5 × 5), systematically evaluating the utility of different data types in the personality prediction task.
Linguistic Properties
For the linguistic properties, we conducted the aforementioned perplexity analysis and Multidimensional Tagger Analysis (MTA). For perplexity, we used GPT-2 as the language model to evaluate the relative perplexity across various types of data (e.g., Radford et al., 2019). Specifically, we first tokenized the text into sequences and then input them into the model to compute the cross-entropy loss. We then exponentiated the loss to obtain the perplexity scores. Given that the distribution of perplexity scores is typically right-skewed, we applied a logarithmic transformation (log-perplexity) to approximate a normal distribution, thereby facilitating subsequent statistical comparisons and visualizations. For MTA, we used the algorithm developed by Nini (2019), based on Biber’s (1988) Variation across Speech and Writing tagger, to analyze the different types of data along six core functional dimensions of linguistic features (see “How Can Augmented Data Be Validated?” section for the specific description).
In addition to the above two analyses, we also selected a subset of data as case examples to illustrate the specific differences in language use between augmented data and other types of data intuitively.
Results
Utility
To evaluate the utility of different data types in predicting personality, we conducted a series of trait prediction tasks using each data type under two input conditions: (a) using only responses to the single generated question, and (b) combining these responses with the participant’s original responses to 31 additional questions. The model architecture and training procedures remained consistent across all conditions, and we employed fivefold cross-validation to ensure generalizability and robustness. Detailed results are reported in Table 3.
Utility Results for Augmented, Real, Baseline, and Random Data.
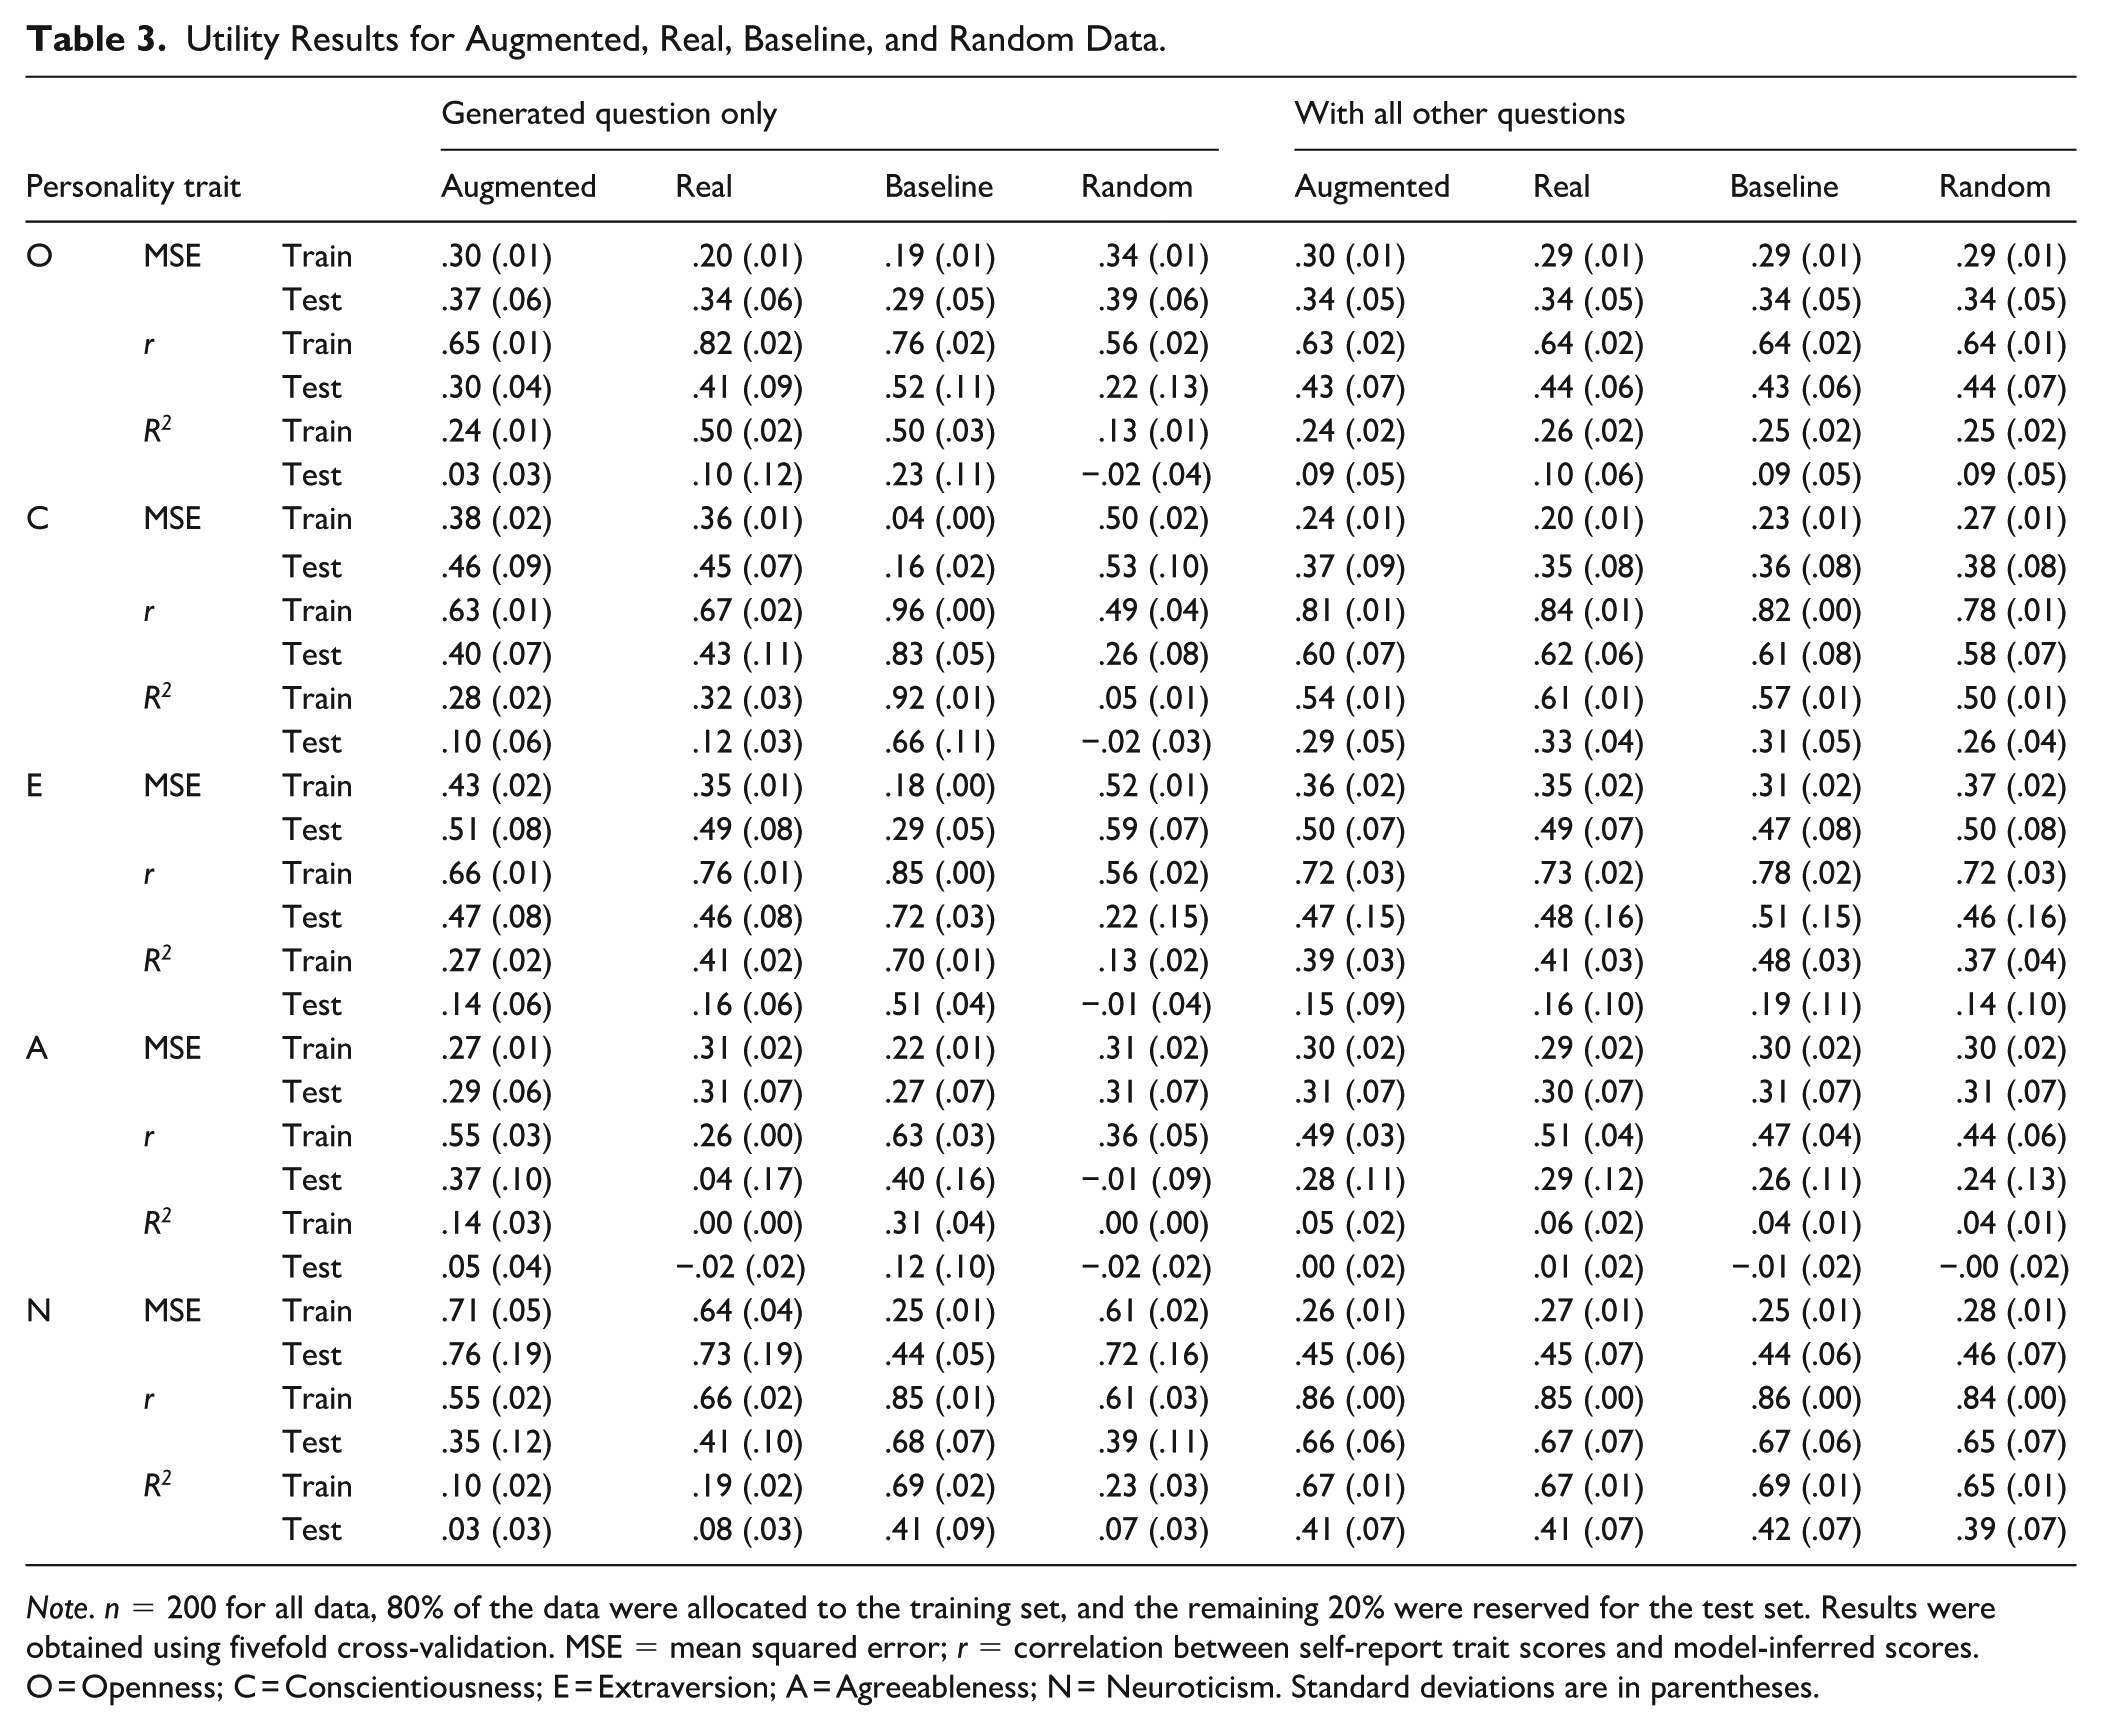
Note. n = 200 for all data, 80% of the data were allocated to the training set, and the remaining 20% were reserved for the test set. Results were obtained using fivefold cross-validation. MSE = mean squared error; r = correlation between self-report trait scores and model-inferred scores. O = Openness; C = Conscientiousness; E = Extraversion; A = Agreeableness; N = Neuroticism. Standard deviations are in parentheses.
When using only augmented data (or any other type of data) as input for predicting personality traits, we find that the performance of models trained on real data closely mirrors that of models trained on augmented data. This pattern holds consistently across all five personality traits. For instance, in the case of Extraversion, both augmented data and real data yield nearly identical results on the test set. Specifically, for R2, the augmented data achieve a test set R2 of .14 (SD = .06), while the real data yield an R2 of .16 (SD = .06). Similarly, for convergent validity, the augmented data yield a value of .47 (SD = .08), compared to .46 (SD = .08) for real data. These results suggest that augmented data capture a level of predictive information similar to that found in real data when modeling personality traits.
Interestingly, the baseline data often outperform the real data. This pattern also holds consistently across all five personality traits. For instance, in the case of Conscientiousness, the baseline data yield better results than the real data on the test set. Specifically, for R2, the baseline data achieve a test set R2 of .66 (SD =.11), whereas the real data only reach an R2 of .12 (SD = .03). Similarly, for convergent validity, the baseline data produce a value of .83 (SD = .05), compared to .43 (SD = .11) for the real data. This phenomenon may be attributed to the fact that the baseline data are generated by the model in its non-fine-tuned state. In other words, this generation process may, to some extent, integrate the individual’s tendencies across various contexts, resulting in a more “idealized” personality profile. In contrast, when individuals respond to questions in reality, their answers tend to be more fragmented, one-sided, or even influenced by their current mood, cognitive state, or social motivations. As such, the actual data may contain more noise and offer less expression of stable personality traits. By comparison, the augmented data are generated by a fine-tuned model, with the aim of more closely mirroring real response patterns, which, based on the results from the utility analysis, it appears to have successfully achieved.
As expected, and in contrast to the aforementioned data, the random data consistently perform the worst across all traits and evaluation metrics. For example, in the prediction of Conscientiousness, the random data achieve a test set R2 of .02 (SD = .03), and the real data yield an R2 of .12 (SD = .03). For convergent validity, the random data yield a value of .26 (SD = .08), compared to .43 (SD = .11) for the real data.
Notably, when the generated responses are combined with participants’ original answers to the other 31 questions, the performance across all data types becomes highly similar for all personality traits. This convergence is clearly reflected in metrics such as test set R2, MSE, and convergent validity. For example, in the case of Openness, the test set R2 for all four data types falls within a narrow range of .09 to .10, with convergent validity stabilizing around .43 to .44, showing minimal differences, and all variances are also very similar. This similarity can be explained by the relative proportion of information: when the model is provided with real responses to 31 questions, these answers offer a large volume of stable, individual-specific information. In comparison, a single generated or substituted response constitutes only a small fraction of the total input. As a result, its impact is diluted, and the model’s predictive performance is primarily driven by the rich, consistent, and authentic responses, thereby minimizing the influence of differences between the four data types.
Linguistic Properties
Perplexity
Figure 4 presents the log-perplexity distribution results for four types of data (augmented data, real data, baseline data, and random data) along with the mean and standard deviation for each. Overall, the mean log-perplexity values are relatively close across the four data types (Maugmented = 3.37; Mreal = 3.52; Mbaseline = 3.60; Mrandom = 3.41). However, the variance of the baseline data is significantly lower than that of the other types (SDbaseline = .50, compared to SDaugmented = .80; SDreal = .81; SDrandom = .73). This difference may stem from the untrained model’s limited ability to capture the heterogeneity inherent in human language expression.
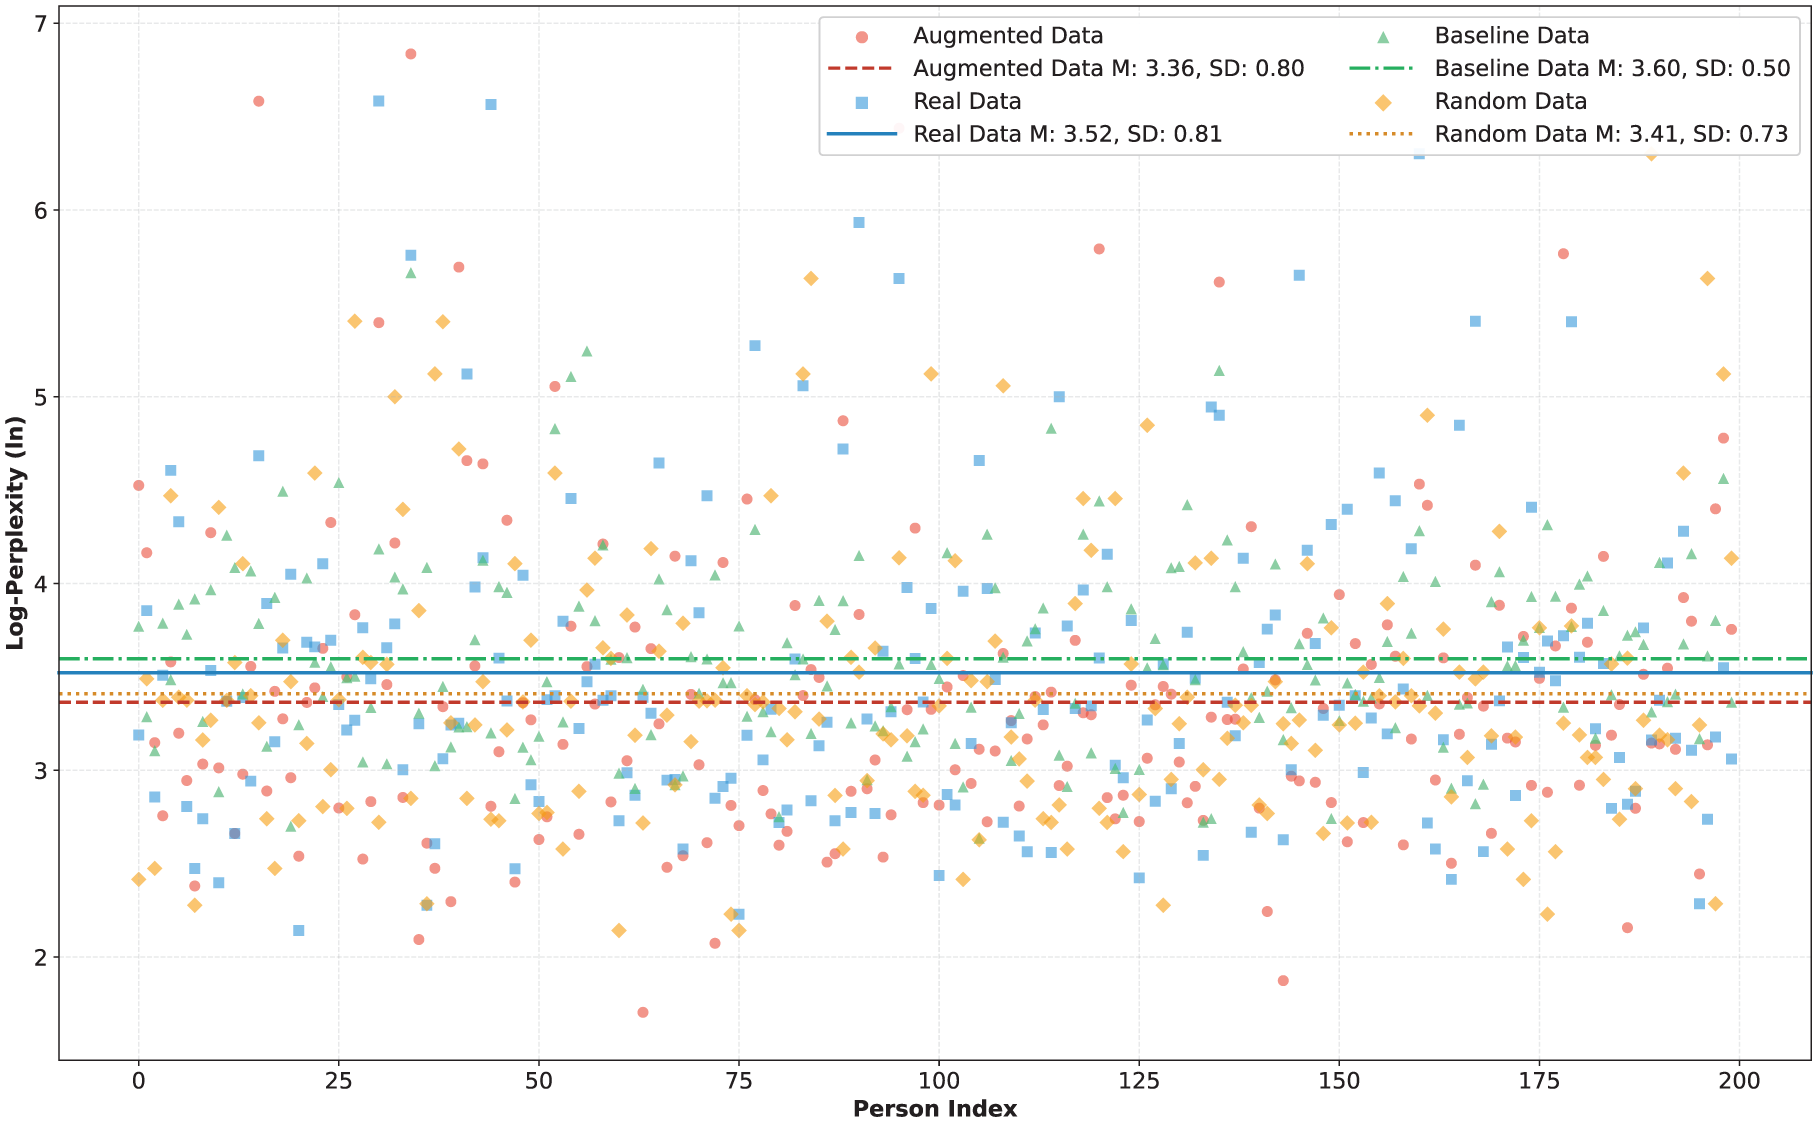
Scatterplot of individual log-perplexity results.
These baseline data come from a model that has not undergone personalized training. As such, they lack the ability to model complex language expressions, diverse sentence structures, and individualized linguistic features. Consequently, the generated text tends to reflect a kind of “model-default style.” In contrast, real data are derived from actual user input and naturally exhibit a high degree of linguistic heterogeneity. Augmented data, generated through techniques such as fine-tuning based on real-world data, retains human language characteristics. Although random data are not tailored to individuals, they are still based on human-generated content and therefore also reflect heterogeneity in linguistic expression.
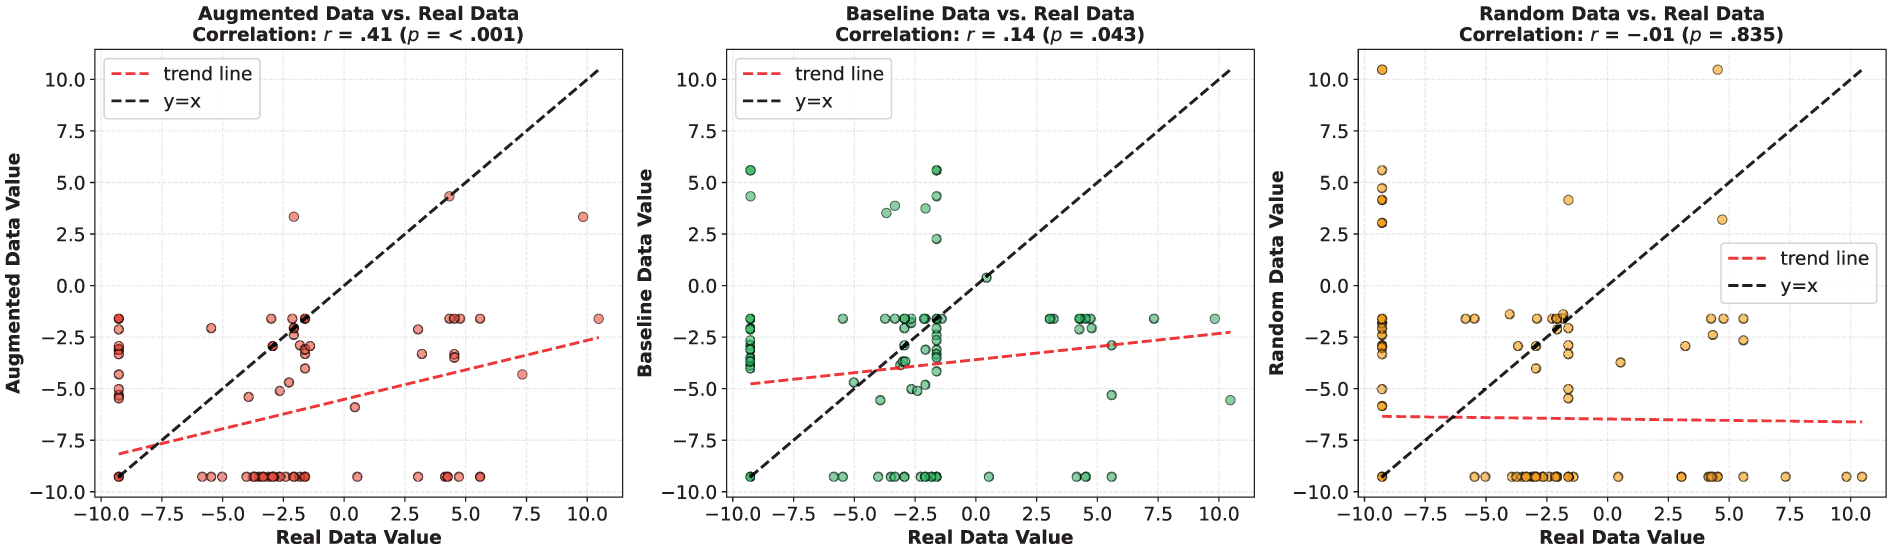
To further explore the similarity of different data types at the individual level, Figure 5 presents a correlation analysis of the log-perplexity distributions between augmented data, baseline data, and random data in relation to their corresponding real data. The results are as follows: Augmented data show a moderate positive correlation with real data, r = .41, p < .001, indicating that the augmented data are able to preserve the linguistic expression features of the original individual’s language fairly well during generation. Baseline data show a weaker correlation with real data, r = .20, p = .004, suggesting that while some relationship exists, the similarity is noticeably limited, further supporting the notion that untrained models have restricted generalization capabilities in terms of linguistic properties. Random data show virtually no significant correlation with real data, r = −.03, p = .674, which aligns with expectations, as random data do not originate from or relate to the individual’s original corpus and therefore lack linguistic expression consistency.
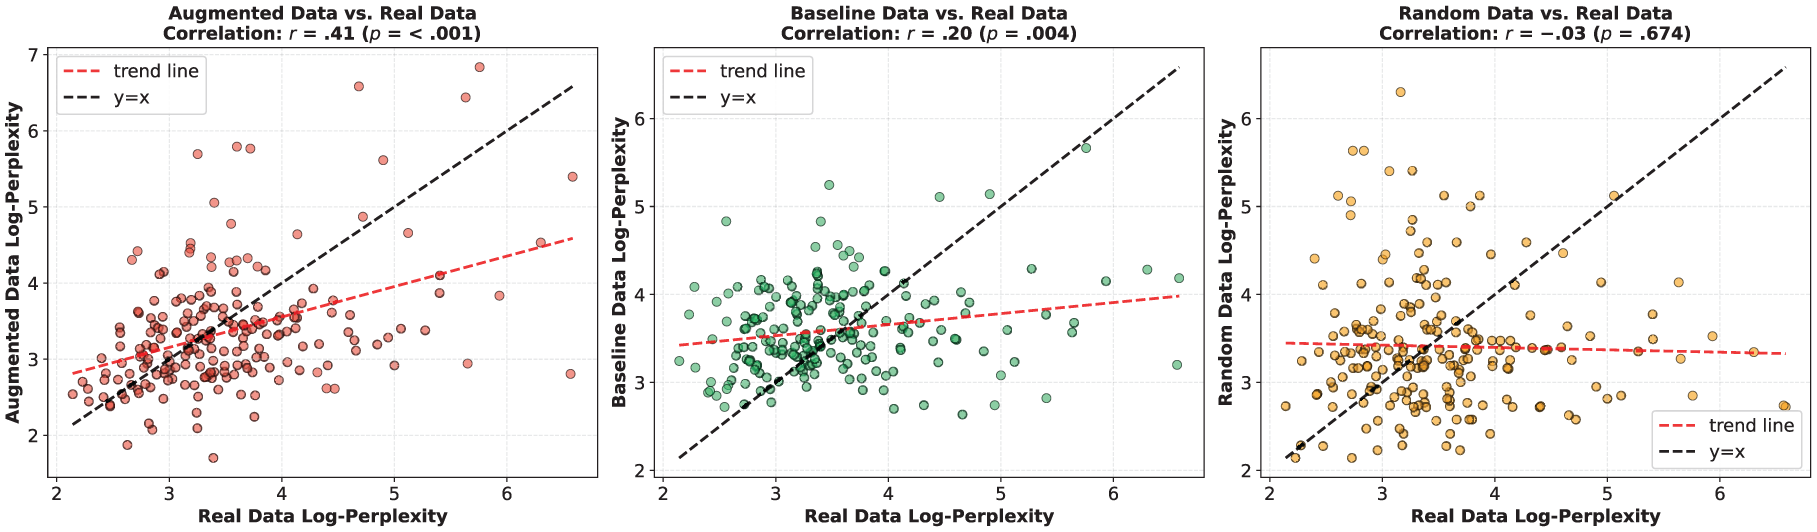
Log-perplexity comparison of augmented, real, baseline, and random data.
Taken together, these results support a central conclusion: personalized training processes are essential for models to generate text that closely aligns with individual linguistic patterns. In particular, augmented data, which integrates the model’s generative capabilities with guidance from real data, effectively captures individual linguistic styles, resulting in a log-perplexity distribution that more closely resembles that of real data. This not only demonstrates the effectiveness of data augmentation strategies but also highlights that, in tasks requiring the simulation of personal language styles, relying solely on general-purpose pretrained models (as represented by baseline data) is clearly insufficient.
Multidimensional Tagger Analysis
Figure 6 presents radar charts illustrating the performance of four data types across six Multi-Dimensional Analysis (MDA) dimensions. As an initial visual overview, the radar plots suggest that the real data and random data exhibit considerable similarity. The real and augmented datasets also display relatively comparable overall profiles across most dimensions, whereas the baseline data deviate more substantially from the others. These preliminary visual impressions are further examined through the quantitative analyses presented in Figures 7 to 13. These analyses indicate that, across the six MDA dimensions, the real data and augmented data demonstrate the highest degree of similarity. It is worth noting that the apparent similarity between real data and random data in the radar plots may be attributable to their shared origin in human-generated texts. Because the random data are sampled from the same corpus as the real data, they naturally reflect a comparable overall distribution of linguistic features at the macro level. However, as demonstrated by the correlation analyses in Figures 7 to 13, this surface-level similarity does not translate into systematic alignment at the text level. Although the aggregate profiles appear similar, the random data do not preserve the dimension-specific relationships observed in the real data, resulting in weak or nonsignificant correlations.
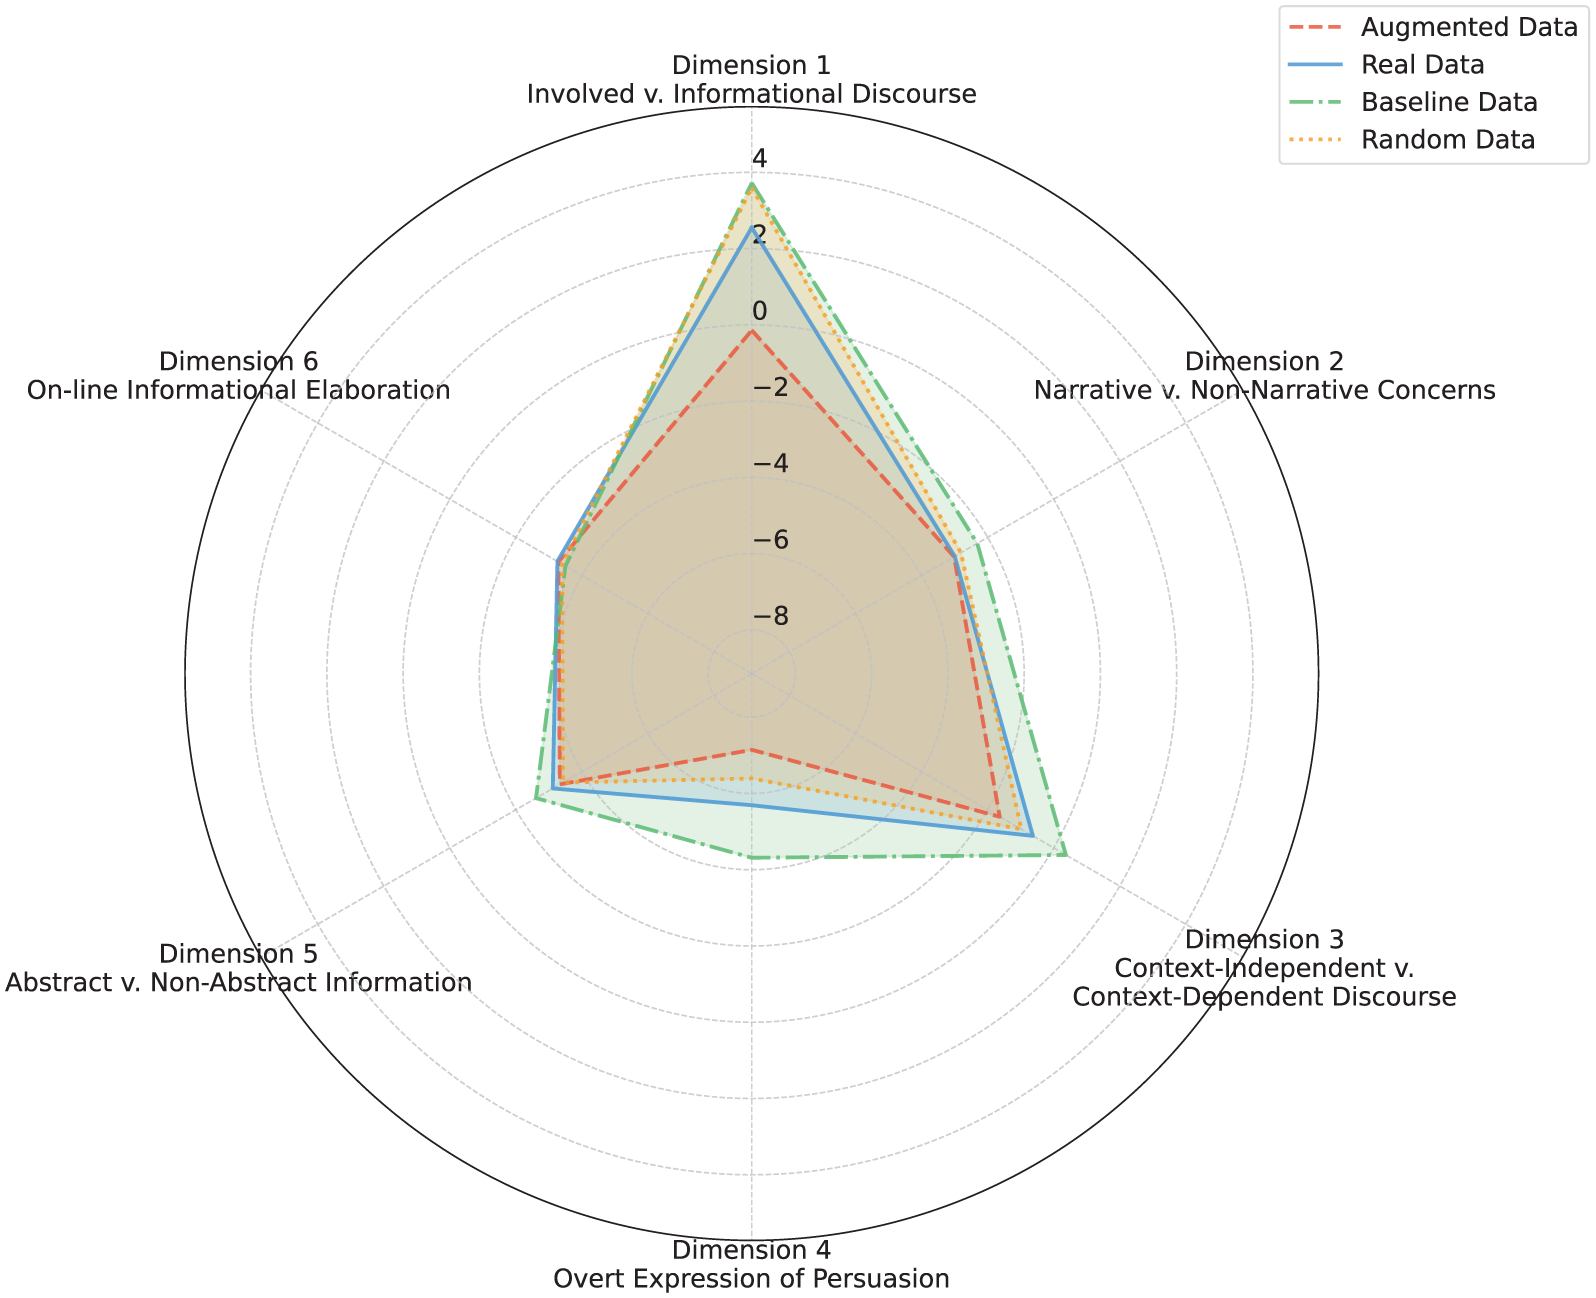
Radar plot of multidimensional tagger analysis of six dimensions.
Multidimensional tagger analysis dimension involvement vs. informational correlation results.
Multidimensional tagger analysis dimension narrative vs. non-narrative correlation results.
Multidimensional tagger analysis dimension context-independent discourse vs. context-dependent discourse correlation results.
Multidimensional tagger analysis dimension overt expression of persuasion correlation results.
Case example of augmented, real, baseline, and random data.
With regard to the augmented and baseline data in Figure 6, the augmented data align most closely with real data on four of the six dimensions, excluding Dimension 1 (Involved vs. Informational Discourse) and Dimension 4 (Overt Expression of Persuasion). In contrast, baseline data show comparatively greater divergence from real data across multiple dimensions, including Dimension 1, Dimension 2 (Narrative vs. Non-narrative), Dimension 3 (Context-Independent vs. Context-Dependent Discourse), Dimension 4, and Dimension 5 (Abstract vs. Non-Abstract Information).
This divergence may partly stem from the baseline model’s reliance on highly structured and formulaic expression templates in the absence of authentic context and individual language styles, resulting in language that is denser in information, more abstract in concept, and less narrative in nature. In addition, in an effort to compensate for semantic gaps, the model tends to use more modal verbs and evaluative markers, thereby exhibiting stronger persuasive features. Collectively, these tendencies cause the baseline data to display linguistic features that lean toward formality, abstraction, and non-narrativity.
In comparison, the augmented data (aside from random data) are the closest to real data, which demonstrates that the generated augmented data have successfully captured key features of individual language expression, including lexical choices, syntactic preferences, and modes of information organization. However, their score on Dimension 4 (Overt Expression of Persuasion) is lower than that of real data. This may be due to the generative model’s tendency to maintain a neutral tone during training, avoiding strong subjective expressions and thereby reducing the use of persuasive markers such as modal verbs and stance markers. This phenomenon may reflect a “conservative” strategy adopted by the model when imitating human discourse: it tends to capture structural features of language more readily, while underperforming in learning subjective linguistic features such as evaluative expressions and modality.
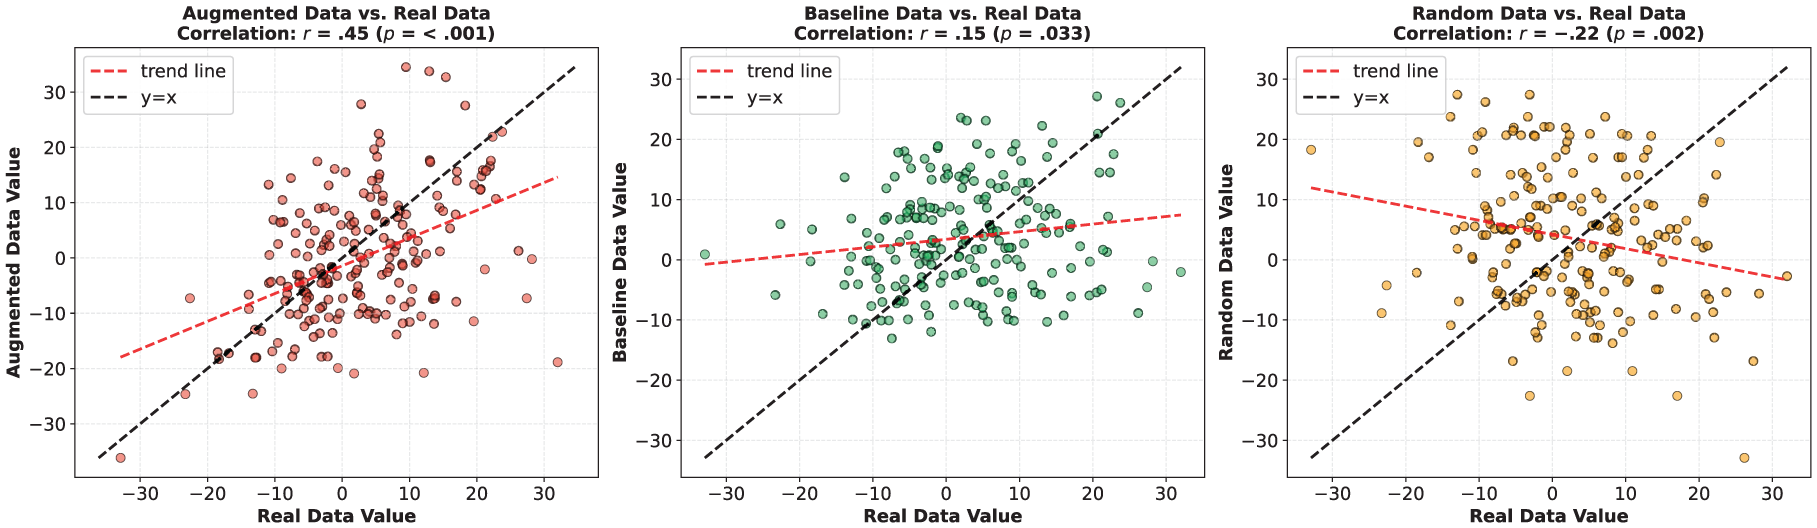
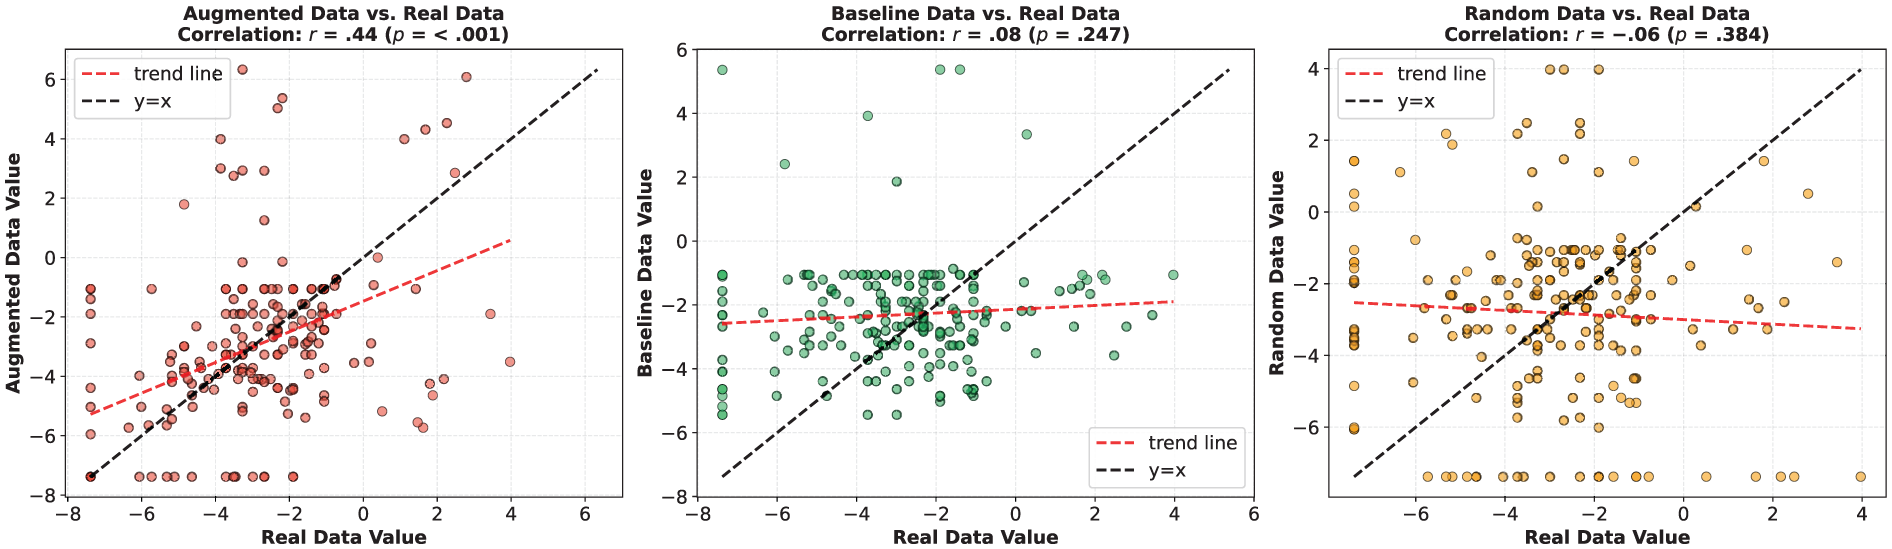
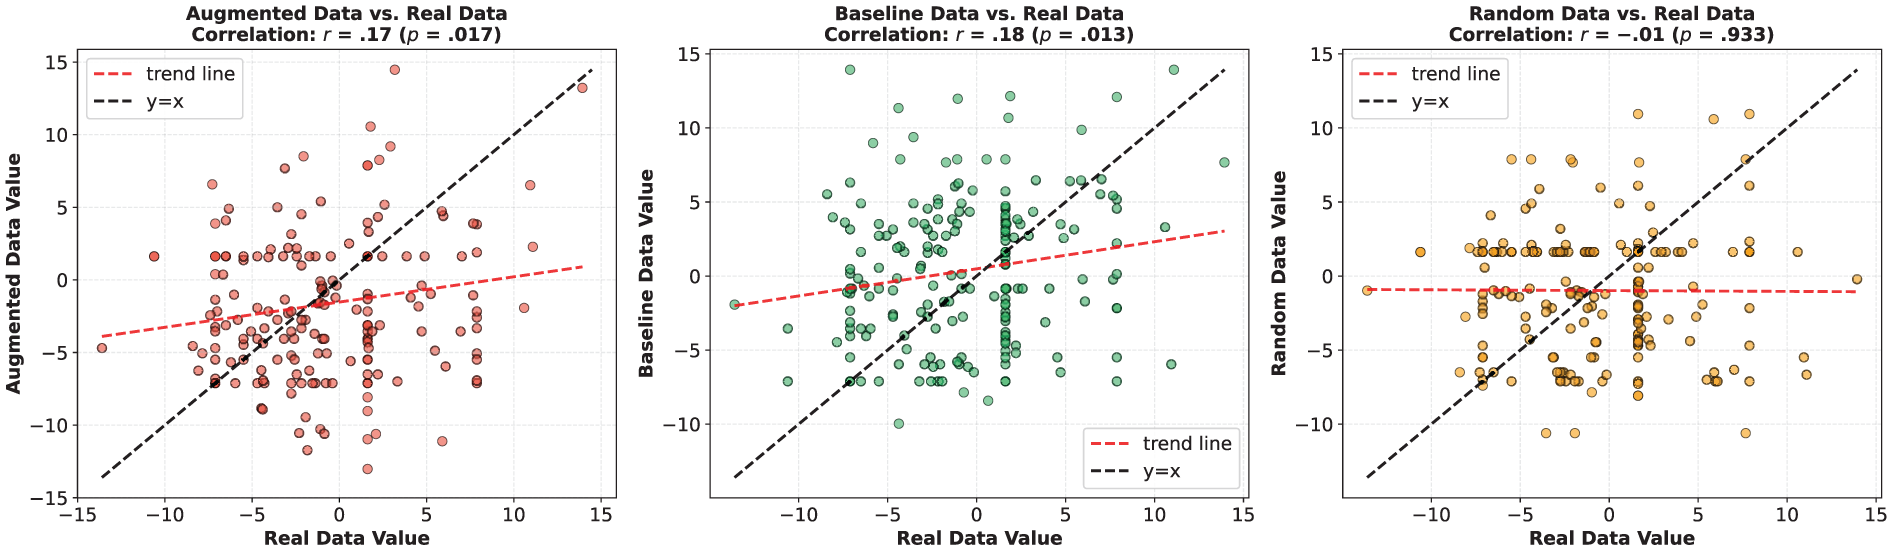
Figures 7 to 13 further present the correlation analysis of each linguistic feature dimension between augmented data, baseline data, and random data in relation to their corresponding real data. Similar to the previous correlation analysis on perplexity, augmented data show the highest correlation with real data across most dimensions, followed by baseline data, while random data exhibit little to no correlation with real data. For example, on Dimension 2 (Narrative vs. Non-narrative), the correlation coefficient between augmented data and real data is r = .44, p < .001; between baseline data and real data, r = .08, p = .25; and between random data and real data, r = −.02, p = .38. These results suggest that the generated augmented data are able to effectively mimic the structural and linguistic characteristics of the human real expression.
However, on certain dimensions, the correlation analysis is limited due to substantial overlap in the scores of these dimensions. As shown in Figures 12 and 13 in Appendix D, there is a notable clustering of data points in the scatter plots for Dimension 5 (Abstract vs. Non-Abstract Information) and Dimension 6 (Online Informational Elaboration). This overlap primarily stems from the distributional characteristics of the data themselves. Specifically, both dimensions exhibit extremely low variability within the corpus used in this study: regardless of whether the texts are real or model-generated, their scores fall within a very narrow range, typically between −2 and +2. This low variability may be related to the nature of the dimension and the textual data we analyzed. For example, Dimension 6 focuses on features of online processing (such as spontaneous elaboration and post-nominal modification commonly found in spoken language), yet the texts used in this study are all well-structured, stylistically consistent written expressions, which lack clear traces of online processing. As a result, scores on this dimension are highly similar.
Overall, augmented data show a good degree of consistency with real data across most linguistic properties, demonstrating a much stronger similarity than that observed between baseline data and real data, and significantly outperforming the alignment between random data and real data. These results strongly indicate that the generated augmented data are relatively effective in capturing and preserving the linguistic features of the original texts (e.g., structural, stylistic, and pragmatic), exhibiting high corpus quality and strong representational capacity.
Case Example
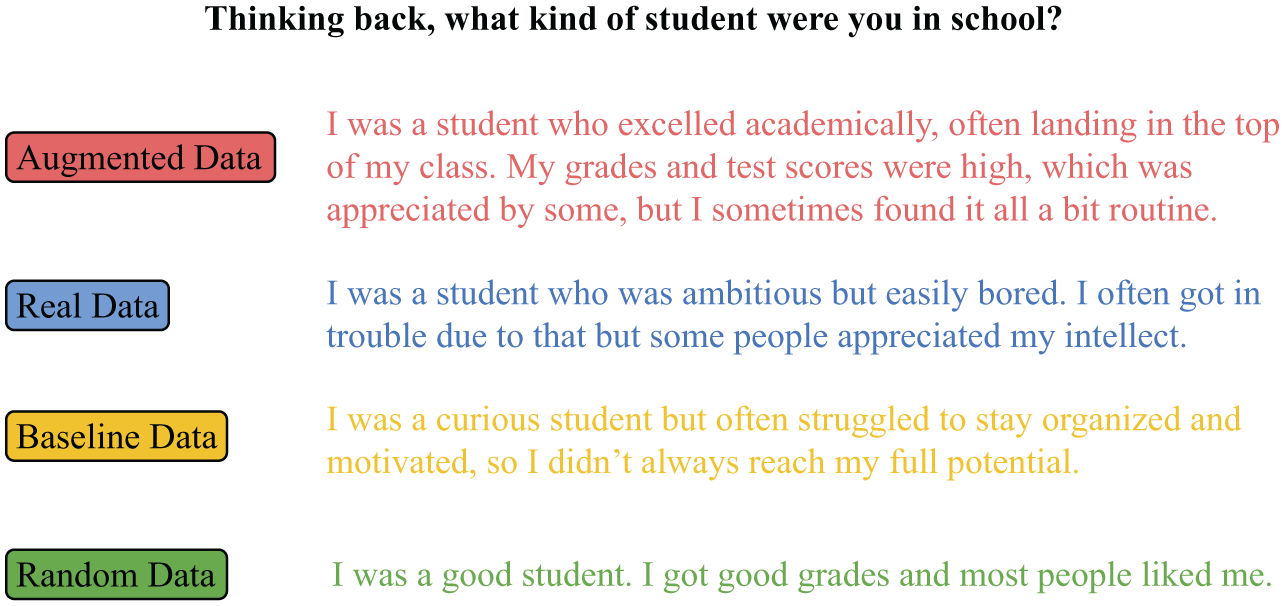
To further illustrate the differences among the four types of data, this study selected a representative case for comparative analysis. The details are presented in Figure 11.
In this case, the real data provide rich and highly individualized personality-related cues. For example, descriptions such as “ambitious but easily bored” and “often got in trouble” reflect a coexistence of behavioral and emotional traits. These not only indicate a strong sensation-seeking tendency but also suggest lower patience or impulse control—features that are highly diagnostic in personality inference. Although the augmented data do not fully replicate these behavioral indicators, they still retain content related to learning motivation and internal attitudes, such as “excelled academically” and “sometimes found it a bit routine.” These expressions continue to convey personality traits similar to those found in the subject. The baseline data also preserve some personality information; expressions like “curious student” and “struggled to stay organized and motivated” bear some resemblance to traits found in the subject. In contrast, the random data almost completely strip away individual differences, containing only generic statements like “good student” and “most people liked me,” which offer little value for personality inference. This outcome is expected, as both the augmented and baseline data are generated based on the individual’s personality report and other textual responses and thus tend to reflect personality information similar to that in the real data. The random data, by contrast, originate from different individuals and therefore naturally diverge in personality content.
For the linguistic properties, this case also illustrates some interesting findings. The real data, as the original response from the target individual, display a distinct personal narrative style—for example, they weave together motivation (“ambitious”), emotional states (“easily bored”), and behavioral outcomes (“got in trouble”) to create layered, natural, and richly detailed expressions. The augmented data most closely resembles the real data in terms of language style. They retain individualized characteristics in syntactic choices, tone, and narrative pacing, as seen in the nuanced descriptions of academic engagement and subjective experience (“excelled academically”; “found it a bit routine”). This suggests that the generative model effectively captured the target individual’s linguistic expression characteristics. Meanwhile, although the baseline data also include some personality-related content (“curious”; “struggled to stay organized”), their overall expressions are more templated and generalized, lacking the expressive detail found in real discourse. The random data, while also produced by real human individuals, reflect a different style altogether, as they do not originate from the target individual. Their expressions are more generic (“good student”; “people liked me”) and reflect a different set of linguistic characteristics from those found in the target individual’s responses.
Overall, augmented data are the most similar to real data, followed by baseline data, whereas random data were used as the lowest baseline for comparison.
Discussion
This study proposes and pursues a personalized data augmentation method based on alignment training, designed to address the issue of having limited types of data in psychological research. We develop a systematic framework to guide both the generation and evaluation of augmented data using LLMs, promoting their broader application in psychological research. Within this framework, we empirically validate a data augmentation approach that integrates individual personality traits and linguistic expression characteristics. Specifically, we construct preference pairs based on real participant data and fine-tune the model using the DPO method (e.g., Rafailov et al., 2023). Results show that this approach can generate texts that closely resemble real data in terms of personality expressiveness, downstream task utility, and linguistic characteristics. This provides a valuable strategy for data expansion in psychological research. Our goal is to offer psychologists and practitioners a systematic understanding of augmented data generation mechanisms and to inspire further exploration of their methodological advancements and practical applications.
Potential Limitations and Ethical Considerations
Although this study has achieved preliminary exploration in the augmented data, several limitations and ethical concerns must still be acknowledged. First, the quality of the augmented data largely depends on the quality of the input reference data. In our approach, augmented data are generated based on an individual’s existing data. However, when the original data fail to comprehensively capture the individual’s characteristics, the generated data can only “fill in the gaps” based on the limited available information. This inevitably leads to a one-sided representation of the individual. For example, if a participant’s original data only reflect their linguistic behavior under stress and lack data from calm or positive emotional states, the generated augmented data may disproportionately represent their stress response, thereby introducing a potential distortion and misjudgment of the individual.
Second, the ideal objective of personalization is to learn a general mapping of the form (persona + historical examples + arbitrary new question) → augmented data. Such a formulation enables the model to capture stable, person-specific traits that generalize across diverse topics and contexts. However, due to limited data availability, our current training setup restricts the formulation to (persona + historical examples + a fixed new question) → augmented data. This constraint allows the model to reliably learn individual-specific variation within a controlled prompt setting, but it does not fully support broad generalization to unseen questions. Expanding the diversity of training prompts would be necessary to learn a more generalizable persona-conditioned response function.
In addition, although augmented data can, to some extent, simulate an individual’s linguistic expression patterns and personality traits, demonstrating a high degree of similarity in terms of semantic fidelity and linguistic characteristics, they are fundamentally not derived from naturally occurring data. Therefore, in research design and analysis, augmented data should be regarded as an inferior substitute for real data, and their validity and applicability must be carefully evaluated. Nonetheless, augmented data hold significant practical value in certain contexts—particularly when real data are difficult to obtain, costly, or constrained by privacy and ethical considerations. In such cases, they offer a feasible alternative, especially for early-stage model development, debugging, or feasibility testing. As a more accessible and controllable resource, augmented data can be effectively utilized in pilot studies and exploratory analyses.
Treating augmented data as equivalent to real data may raise ethical concerns regarding data transparency, informed usage, and boundary management. This highlights the increased ethical responsibility of researchers and practitioners when using augmented data. It is essential to clearly label such data as artificially generated, ensure its traceability, and maintain transparency in the generation process. This distinction is not only a fundamental requirement for scientific rigor but also a basic form of respect toward research subjects, data users, and potential audiences. Neglecting this responsibility can introduce various risks in practical applications, such as reinforcing existing stereotypes, obscuring genuine individual differences (e.g., in personality or linguistic diversity), or even misleading judgments in sensitive contexts like psychological assessment or clinical intervention. Moreover, disclosing the source, generation methods, and applicable boundaries of augmented data contributes to the reproducibility of research and upholds academic integrity, providing essential context for reviewers, peer evaluators, and end users.
Data Augmented Recommendations
Based on the findings and analysis of this study, we offer the following recommendations to guide researchers and practitioners in the practical use of augmented data:
Clarify the Role and Boundaries of Augmented Data
During the research design and data utilization stages, it is recommended to treat augmented data as a supplementary resource to real-world data, rather than a replacement. Augmented data are particularly suitable for the early stages of model development, such as exploratory analysis, algorithm pretraining, and feasibility testing. However, caution should be exercised when using augmented data in contexts that involve precise judgments, high-stakes decisions, or individual-level interventions.
Ensure Transparency in the Data Generation Process
When involving augmented data, people should clearly disclose key information about how the data were generated, including the sources of the original data, as well as the modeling and fine-tuning methods used. It is recommended that the “Methods” section explicitly indicate the proportion of augmented data, the generation logic, and the selection criteria. In addition, relevant details that support reproducibility should be provided in the Appendix to enhance the transparency of the research and its academic credibility.
Balance Individual Differences and Contextual Factors
When generating and using augmented data, it is important to fully consider individual diversity and contextual dependencies. Researchers should be cautious not to generalize models based on data derived from a single context. Instead, efforts should be made to incorporate diverse contextual simulations during the data generation process to increase the realism of the language and personality dimensions reflected within the augmented data.
Future Research
Although this study explored a method for personalized augmented data generation and verified its potential value in the field of psychological assessment, there are still many research directions worth further exploration.
First, the current data augmentation mechanism still has room for improvement in terms of generalizability. Existing methods primarily rely on individuals’ static characteristics (such as personality traits and language style). Future research could incorporate dynamic psychological state variables (such as mood fluctuations and stress levels) as conditional factors in the generation process. This enhancement is expected not only to improve the sensitivity and adaptability of the augmented data to contextual changes but also to strengthen its effectiveness and practicality in complex application scenarios.
Second, the identification and correction of biases in augmented data need to be strengthened. Existing generative models may unintentionally inherit or even amplify contaminated aspects of the original data during training, leading to random distortions or systematic biases. Future research could incorporate fairness metrics or develop dedicated modules for bias detection and regulation, systematically identifying and addressing those factors that might create irrelevant distortions (e.g., gender, cultural background, language style). This would enhance the ethical management of the generated data.
Overall, the application of augmented data in psychological research is still in its early stages, with its theoretical foundation, technical system, and practical framework yet to be fully developed. Future research should not only advance scientific rigor and methodological innovation but also incorporate ethical standards and practical applications. This will help position augmented data as a vital tool for understanding individual psychological characteristics and predicting behavioral trends.
Conclusion
The method of augmented data for LLMs has been receiving increasing attention in psychological research. By applying technological approaches such as generative models to expand existing datasets, researchers can not only address the issue of the limitations in a given psychological dataset but also deepen and broaden analyses without directly accessing sensitive information. However, the effectiveness and validity of augmented data still require systematic evaluation. This article reviews key stages in the creation of augmented data, including methods for data augmentation and multidimensional testing of their effects. We then demonstrate how augmented data were implemented and evaluated using a life-narrative personality interview dataset, aiming to promote broader application and standardized development of this method in psychology.
Footnotes
Appendix A: Interview Questions
Table 4 presents the full list of interview questions.
Appendix B: Used Prompts
Below is the system prompt and user prompt used in this study. The system prompt functions as the model’s “fundamental constitution” or “operating rules,” specifying how it should reason when responding to user queries. Compared to a user prompt, the system prompt imposes stricter constraints. {person_profile} represents the individual’s input data, which includes their responses to all items on the BFI-2 questionnaire (Soto & John, 2017), as well as their complete answers to 31 questions from the life-narrative personality interview. In contrast, the user prompt is relatively simple and consists primarily of {question_description}, which is a question that we assume the participant has not yet answered. This question serves as the target, guiding the model to generate corresponding augmented data based on its content.
Appendix C: Hyperparameter Tuning Procedure for Elastic Net
To ensure robust and reproducible model estimation, hyperparameter optimization for the Elastic Net models was conducted using the ElasticNetCV function implemented in the scikit-learn library (version 1.8.0).
Appendix D: Additional Results
Acknowledgements
The authors gratefully acknowledge the Ken Kennedy Institute and the Center for Research Computing at Rice University for their educational resources and technical support. The authors also wish to thank the members of the Selection, Methodology, and Assessment Research via Technology (SMART) Lab at Rice University for their valuable feedback and thoughtful comments on earlier versions of this work.
Authors’ Note
Portions of this research were accepted for presentation at the 22nd European Conference on Personality (ECP22), July 2026, Edinburgh, Scotland.
Ethical Considerations
This study was conducted using archival data; therefore, a new ethics review was not required. The original data collection was approved by the Institutional Review Board of the Office of Research Integrity, Compliance, and Security at Kansas State University (Approval Number: IRB-11153).
Consent to Participate
Informed consent was obtained in writing from all participants prior to their participation in the study, which was administered online. All participants were informed of the purpose, procedures, and potential risks of the study and provided verbal informed consent.
Consent for Publication
Consent for publication of de-identified data has been obtained from all participants.
Author Contributions
PW: conceptualization, methodology, software, formal analysis, investigation, data curation, writing – original draft, writing – review & editing, visualization, and project administration.
HC: methodology, validation, resources, and writing – review & editing.
FO: validation, funding acquisition, and writing – review & editing.
TS: conceptualization, methodology, investigation, resources, data curation, writing – review & editing, supervision, project administration, and funding acquisition.
Funding
The authors disclosed receipt of the following financial support for the research, authorship, and/or publication of this article: This research project is partially supported by the Center for Computational Insights on Inequality and Society at Rice (CIISR) and by the National Science Foundation (NSF) under Awards 2522411 and 2614053.
Declaration of Conflicting Interests
The authors declared no potential conflicts of interest with respect to the research, authorship, and/or publication of this article.