
Abstract
Background
Previous studies demonstrated the superiority of a genotype-guided warfarin dosing (GWD) method for warfarin initiation. International GWD models such as Gage et al model were validated in diverse populations but Arab patients were not well represented in these studies.
Objective
To derive and validate a GWD model in an Arab population and compare the outcomes to Gage et al model.
Methods
In this cross-sectional study, DNA was collected through saliva kits from a cohort of recruited Arab patients on warfarin. Clinical factors and demographics were recorded and genotyping for VKORC1 (−1639G > A), CYP2C9*2, CYP2C9*3 and CYP4F2*3 was performed. Subjects were randomly divided to derivation and validation cohorts. Simple and Multiple linear regression analyses were used to identify factors associated with warfarin dose and derive a warfarin dosing model. The warfarin dose was also calculated using Gage et al model. Accuracy of the 2 models were compared through the mean absolute error (MAE) and percentage of predicted warfarin doses within 20% of the actual warfarin dose
Results
The Arab cohort included 405 patients. In the derivation cohort (n = 270), multiple regression analysis showed a dosing model consisting of VKORC1 (−1639G > A), CYP2C9*2 & CYP2C9*3 genotypes, along with other clinical factors (R 2 = 51.6%) (P < 0.05). When compared to Gage et al model, the Arab model had a significantly lower MAE of weekly warfarin dose (9.3 ± 7.6 mg/week vs 12.4 ± 10.4 mg/week, p = 0.03)
Conclusion
A model derived and validated in an Arab population had better prediction accuracy compared to an internationally validated one.
Keywords
Introduction
Thrombotic disorders are highly associated with morbidity and mortality, as one in four people die due to thromboembolism (TE) worldwide. 1 Oral anticoagulants are used to prevent and treat thrombotic disorders like venous thromboembolism and stroke prevention for patient suffering from atrial fibrillation. 2 Conventionally, vitamin K antagonists (VKA), eg: warfarin, were the cornerstone of TE management. A number of factors affect warfarin dose. Genetic factors like variations in the CYP2C9 and VKORC genes and clinical factors like age, weight, drug interactions, etc…, are responsible for about 40% and 10% of the warfarin dose variability, respectively. 3 This has led to the warfarin inter-dose variability which is considered one of the main drawback of VKAs. As a consequence, there is always a need for frequent INR monitoring, especially during the initial phase. 2 With the introduction of direct oral anticoagulants (DOACs) in 2009, 4 they became the drug of choice for the treatment and prevention of various TE disorders due to their ease of use and the relatively minimal monitoring requirements.5,6 However, VKAs are still prescribed in a number of indications where DOACs failed to show better outcomes. 7 These indications include but are not limited to: Mechanical heart valve, atrial fibrillation with moderate to severe rheumatic mitral stenosis and antiphospholipid syndrome with thrombosis. A number of methods exist for warfarin initiation. Firstly; fixed warfarin dosing (FWD): where patients are started empirically on a dose of warfarin for one to two days and INR is checked on day three to four, with warfarin dose adjusted accordingly. 8 Another method is clinical warfarin dosing (CWD) that relies on clinical factors of the patient to be incorporated into a model that suggests a warfarin dose. 8 Lastly is the genotype-guided warfarin dosing (GWD), where the patient's clinical and genetic factors are incorporated into a warfarin dosing model to predict a warfarin dose. 8 The International Warfarin Pharmacogenetics Consortium (IWPC) group showed that GWD can predict warfarin dose with higher accuracy compared to CWD. 9 Other clinical studies also showed superiority of the GWD compared to other methods.10,11 In the Arab region, a number of models were proposed for GWD but each was studied in a specific population in silo. 12 Internationally validated models are also available and although studied in diverse populations they were not validated in the Arab population.9,13 In this paper, we aim to derive and validate a GWD model in a mixed Arab population and compare its outcomes to Gage et al model (available from www.warfarindosing.org), one of the most commonly used and validated international models.
Methods
Study Design and Setting
This is a single-nation multi-centre cross sectional sub-study from previously published work.14–16 As previously explained, subjects were recruited from three hospitals in Hamad Medical Corporation, which is the leading healthcare provider in Qatar. These hospitals were Hamad General Hospital, Al Wakra Hospital and Heart Hospital.
Participants, Inclusion Criteria and Data Collection
Between September 2016 and August 2023, Arab patients receiving warfarin and having a stable dose were screened for recruitment.
To meet the inclusion criteria, patients should be from an Arab country and on a stable warfarin dose (defined as having three subsequent INR readings at least 48 h apart within the therapeutic range). Patients were excluded from the study if they were less than 18 years of age, have a life expectancy less than 6 months, having severe liver diseases defined as Alanine aminotransferase, Aspartate aminotransferase or total bilirubin > 2 times the upper limit of normal, INR > 1.45 at baseline and if non-adherent to warfarin dosing protocol as suggested by warfarin prescriber.
After signing a written informed consent, patients were asked to provide saliva sample using the Oragene-DNA ® (OG-500) self-collection kit (DNA genotekTM, Canada) as instructed by manufacturer. Thereafter the sample was sent for analysis at the College of Pharmacy, Qatar University. Clinical and demographic data were obtained from patients’ medical records and confirmed with the patient.
DNA Extraction, Quantification and Genotyping
DNA extraction was performed according to PrepIT®•L2P manual protocol. DNA quantification was carried out using The Nanodrop 2000c Spectrophotometer (Thermo Fisher ScientificTM). DNA genotyping and Single Nucleotide Polymorphism (SNP) detection was performed using the real-time polymerase chain reaction (RT-PCR) 7500 Fast System with the TaqMan drug metabolizing enzyme genotyping assay, Applied BiosystemsTM, Life Technologies. The following genotypes were tested: CYP2C9*2 (rs1799853), CYP2C9*3 (rs1057910), VKORC1-1639G > A (rs9934438) and CYP4F2*3 (rs2108622).
Study Outcomes
The primary outcome was the calculated warfarin maintenance dose using the derived Arab warfarin dosing and Gage et al dosing model. Validation was done by calculating the correlation coefficient between the predicted and the actual warfarin dose. To assess and compare the accuracy of the 2 models, we calculated the mean absolute error (MAE) which is the mean of the absolute difference between the predicted dose and the actual dose. We also observed the percentage of predicted warfarin doses within 20% of the actual warfarin dose. MAE and percentage of predicted warfarin doses with 20% were compared between both models. Subgroup analyses were performed by stratifying results based on origin, age ≥75 years and warfarin weekly dose > 35 mg
Sample Size Calculation
Sample size was calculated using www.danielsoper.com calculator for multiple regression with the following parameters: anticipated effect size of 0.2, alpha error = 0.05 and 20 predictors. Accordingly, 148 subjects were required to achieve 90% power.
Statistical Analysis
Baseline characteristics were tested for normality and descriptive statistics were performed. Normally distributed continuous variables were compared using the Student t-test and ANOVA whereas Chi-square was used to compare categorical variables. Variables that were not in normal distribution were compared using Mann Whitney U and Kruskal -Wallis tests for unpaired data and Wilcoxon signed rank test for paired data. Genetic variants were tested for Hardy-Weinberg Equilibrium (HWE) and results with p > 0.05 meant that the minor allele frequencies (MAF) was in equilibrium. Deviation from the HWE was examined using the Michael H. Court's (2005-2008) online calculator Excel-based HWE Test.
Recruited patients were randomly divided (using SPSS IBM 25) into a derivation (67%) and a validation (33%) cohorts. Warfarin doses were log-transformed prior to linear regression modelling. Simple Linear Regression (SLR) was used to identify variables that were associated with warfarin dose in the derivation cohort and all variables with a p-value < 0.2 were included. Multiple linear regression was used with backward elimination to assess the significance of the resulting variables’ effect on warfarin dose in the derivation cohort with a cut point p-value<0.05. The resulting equation was then used to calculate warfarin maintenance dose in the validation cohort.
Spearman's correlation coefficient was used to measure the degree of association between the predicted weekly warfarin dose using the derived model in the validation cohort and the actual dose. Paired T test was used to compare the MAE of weekly warfarin dose where as McNemar test was used to compare the percentage of predicted warfarin doses within 20% of the actual weekly warfarin dose between the derived model and Gage et al MAE was also compared between groups in the following categories (warfarin dosing, age, and patient's origin) to assess their impact on the accuracy of the warfarin dosing model.
Results
The analysis included 405 subjects recruited between 2016-2023 and were randomly divided into a derivation cohort (n = 270) and a validation cohort (n = 135). Baseline characteristics of the overall population and individual cohorts are listed in Table 1. In summary, the population mean age was 58 years with almost equal proportion of both genders. Mean BMI was 32 Kg/m2% and 60% of the population were from Gulf Council Countries (GCC) and Yemen. No significant differences existed between the two cohorts with regards to the baseline demographics. MAFs were calculated for the overall population and the two cohorts (Table 2). The overall prevalence of VKORC1, CYP2C9*2 and CYP2C9*3 were 47%, 11%, and 6%, respectively.
Baseline Characteristics.
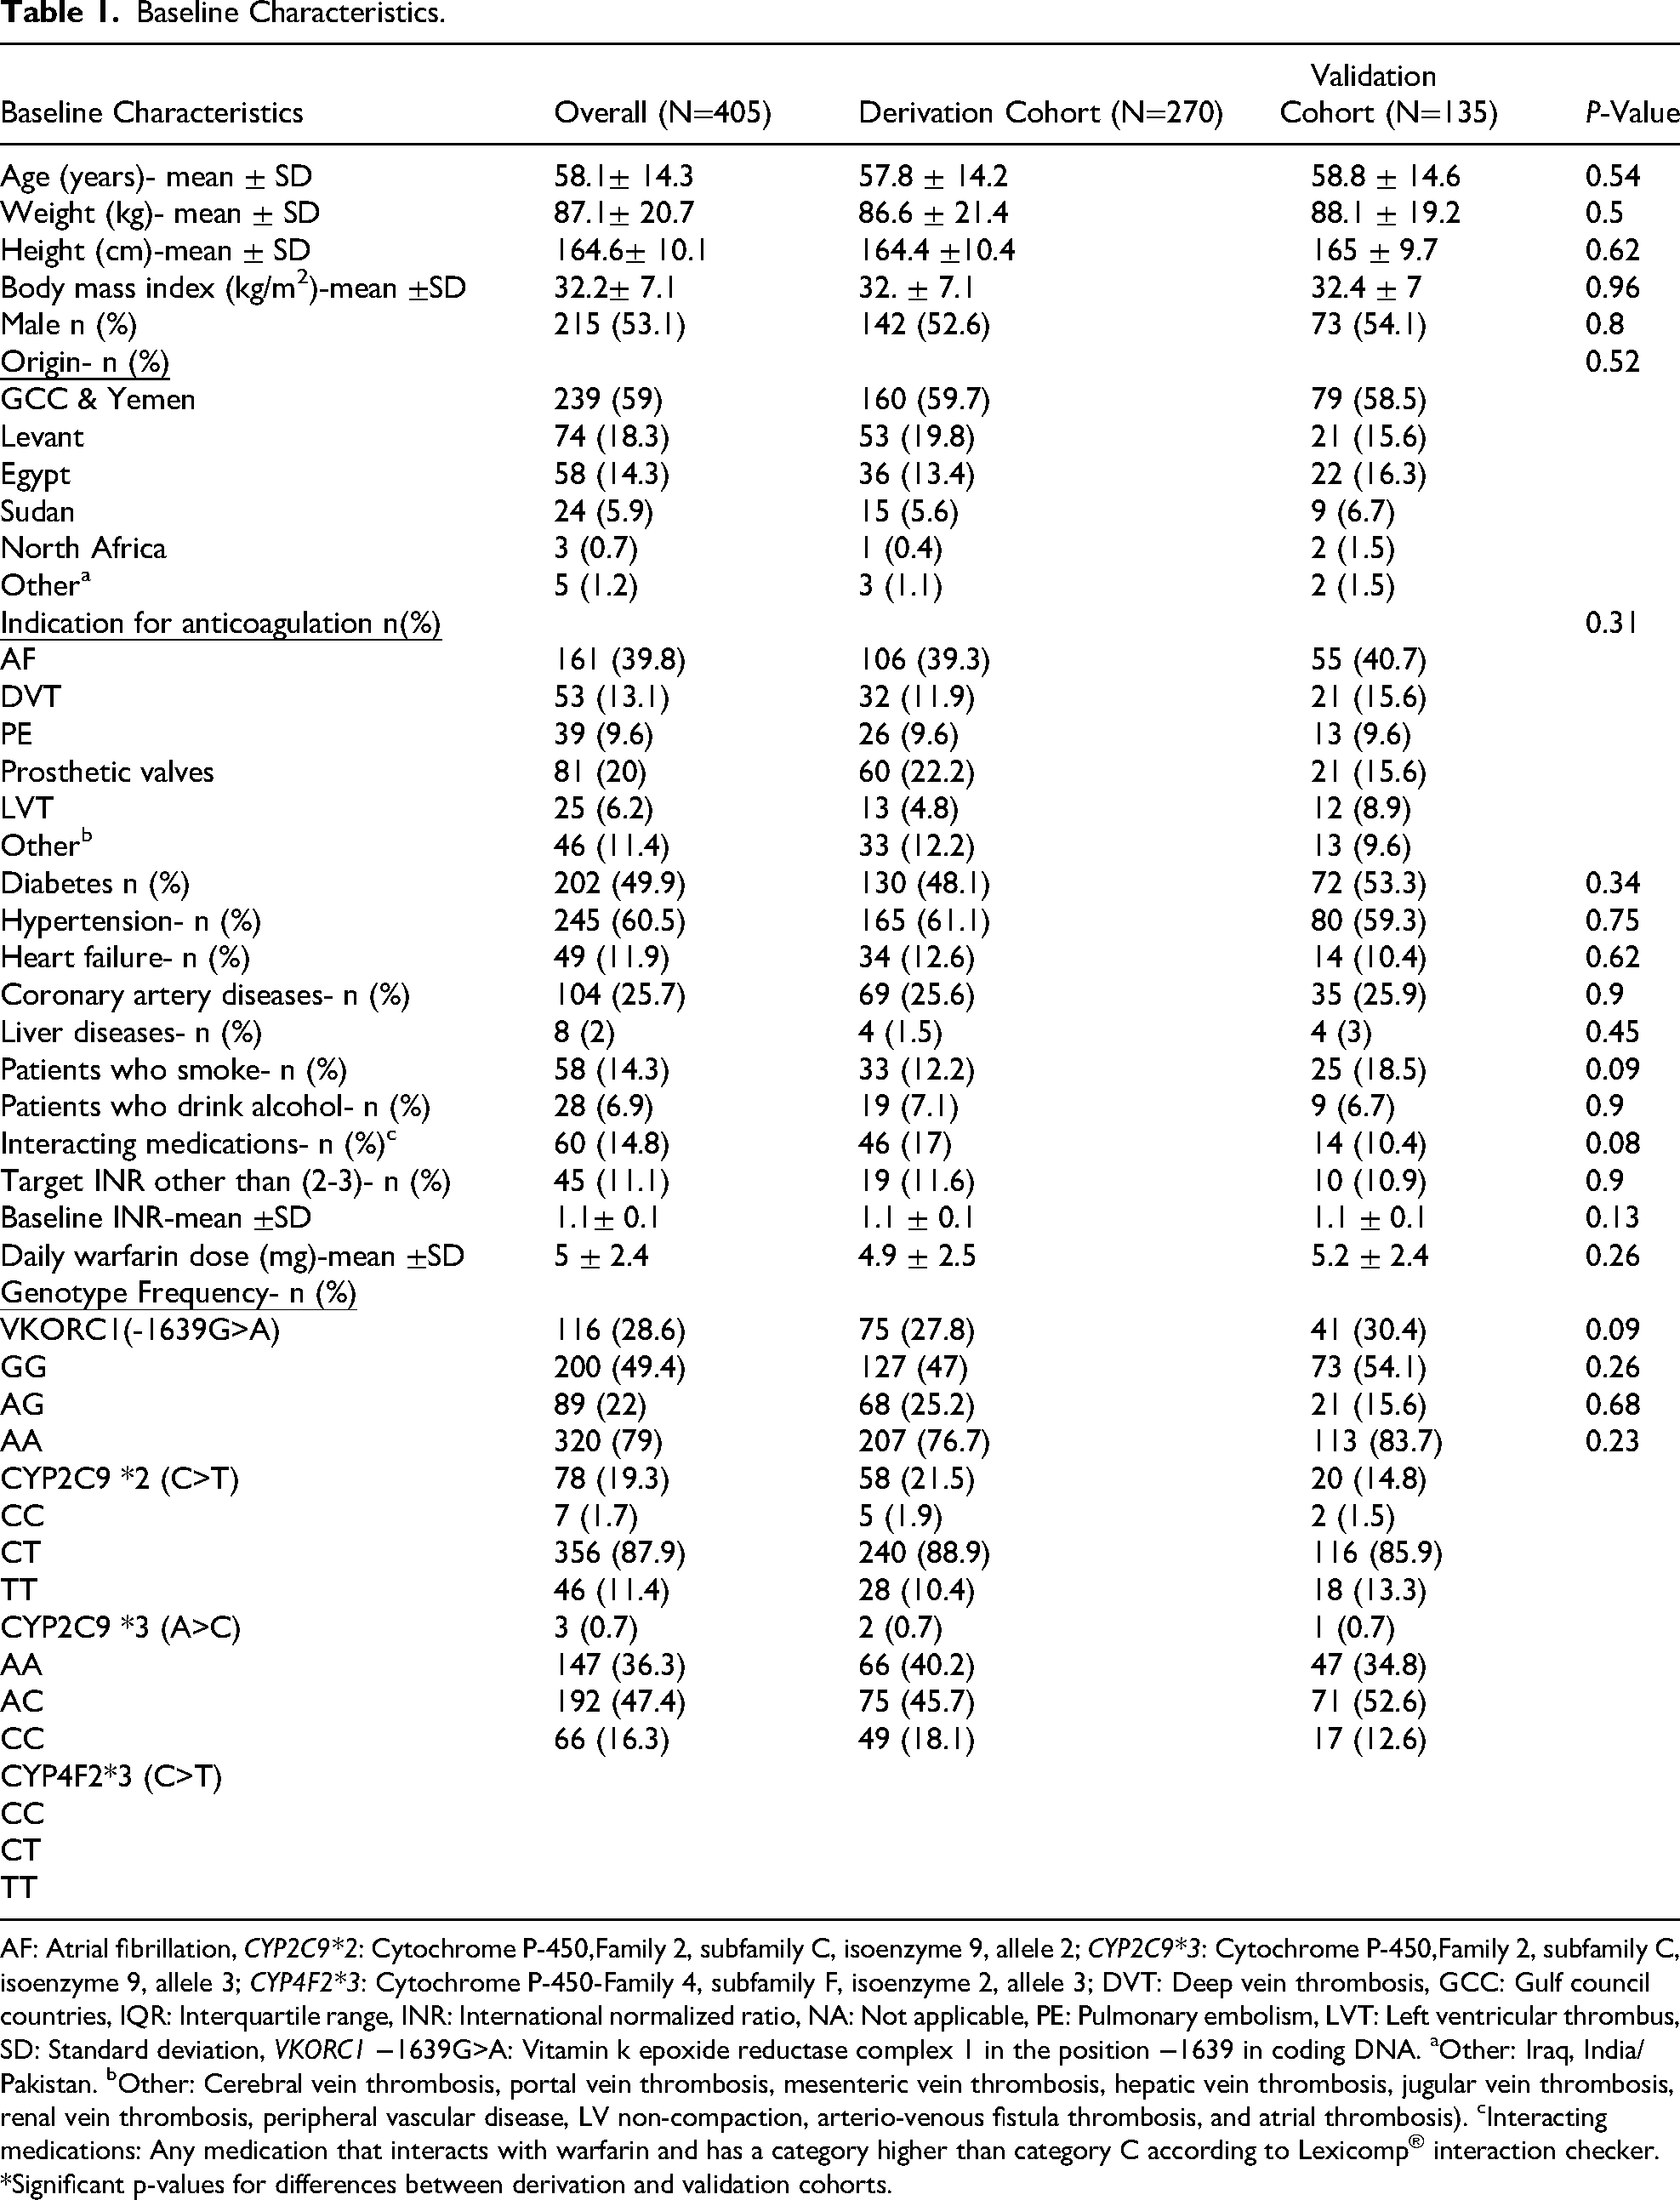
AF: Atrial fibrillation, CYP2C9*2: Cytochrome P-450,Family 2, subfamily C, isoenzyme 9, allele 2; CYP2C9*3: Cytochrome P-450,Family 2, subfamily C, isoenzyme 9, allele 3; CYP4F2*3: Cytochrome P-450-Family 4, subfamily F, isoenzyme 2, allele 3; DVT: Deep vein thrombosis, GCC: Gulf council countries, IQR: Interquartile range, INR: International normalized ratio, NA: Not applicable, PE: Pulmonary embolism, LVT: Left ventricular thrombus, SD: Standard deviation, VKORC1 −1639G>A: Vitamin k epoxide reductase complex 1 in the position −1639 in coding DNA. aOther: Iraq, India/ Pakistan. bOther: Cerebral vein thrombosis, portal vein thrombosis, mesenteric vein thrombosis, hepatic vein thrombosis, jugular vein thrombosis, renal vein thrombosis, peripheral vascular disease, LV non-compaction, arterio-venous fistula thrombosis, and atrial thrombosis). cInteracting medications: Any medication that interacts with warfarin and has a category higher than category C according to Lexicomp® interaction checker. *Significant p-values for differences between derivation and validation cohorts.
Minor Allele Frequencies of Different Genetic Variations.

CYP2C9*2: Cytochrome P-450,Family 2, subfamily C, isoenzyme 9, allele 2; CYP2C9*3: Cytochrome P-450,Family 2, subfamily C, isoenzyme 9, allele 3; CYP4F2*3: Cytochrome P-450-Family 4, subfamily F, isoenzyme 2, allele 3; VKORC1 −1639G>A: Vitamin k epoxide reductase complex 1 in the position −1639 in coding DNA.
Derivation and Validation of the Warfarin Dosing Model
Data for the derivation cohort's weekly warfarin dose was not normally distributed and therefore the data was log transformed before the regression analysis. All potential demographic and clinical factors (listed in Table 1) were tested for association with warfarin using single linear regression. Variables with a p-value < 0.2 were included in the multiple linear regression. The following significant variables resulted as predictors of warfarin dosing in the derivation cohort (adjusted R2 = 0.51, p < 0.05): Age, weight, having a prosthetic heart valve, using azole containing drugs, using trimethoprim-sulfamethoxazole combination and variations in CYP2C9*2, CYP2C9*3 and VKORC1 genes (Table 3). Table 4 shows the proposed warfarin dosing model for the Arab population which was based on the multiple linear regression analysis.
Multiple Linear Regression Showing Genetic and non-Genetic Factors Associated with Warfarin Dose.

CYP2C9*2: Cytochrome P-450,Family 2, subfamily C, isoenzyme 9, allele 2; CYP2C9*3: Cytochrome P-450,Family 2, subfamily C, isoenzyme 9, allele 3; CYP4F2*3: Cytochrome P-450-Family 4, subfamily F, isoenzyme 2, allele 3; VKORC1 −1639G>A: Vitamin k epoxide reductase complex 1 in the position −1639 in coding DNA.
Outcomes of the Arab Model Compared to the Gage et al Model in Predicting Actual Warfarin Dose in the Validation Cohort.

*Paired T-test.
** McNemar test.
Carrying 2 copies of the “A” variant (2), 1 copies of the “A” variant (1), non-carriers (0)
Carrying 2 copies of the “T” variant (2), 1 copies of the “T” variant (1), non-carriers (0)
Carrying 2 copies of the “C” variant (2), 1 copies of the “C” variant (1), non-carriers (0)
Age in years
Weight in Kgs
Presence of prosthetic valve (1), absence of prosthetic valve (0)
Use of Azole: yes= (1), no= (0)
Use of TMP-SMX: yes= (1), no= (0)
Target international normalized ratio= 2.5 or 3
Use of Amiodarone: yes= (1), no= (0)
Smoking status: yes (1), no (0)
Presence of DVT and/or PE (1), absence of DVT and/or PE (0)
Validation of the warfarin dosing model and comparing the outcomes to Gage et al model:
In the validation cohort, the warfarin dose calculated using the Arab derived model was found to be in a strong correlation with the actual warfarin dose evident from a Spearman's rho correlation coefficient = 0.71 (p < 0.001) (Figure 1). Comparing between the accuracy of the 2 models (Table 4), MAE for the weekly doses was significantly lower in the Arab model compared to Gage et al [9.3 ± 7.6 mg versus 12.4 ± 10.4 mg, p = 0.006]. Additionally, the percentage of predicted warfarin doses within 20% of the actual doses was higher using the Arab model compared to Gage et al, but did not reach statistical significance [55 (40.7%) versus 40 (29.6%), p = 0.073].

Correlation between the predicted warfarin dose by the arab model with the actual warfarin dose in the validation cohort. *Significant p-value.
MAE comparison based on warfarin dosing, age, and patient's origin showed significantly lower MAE (mean ± SD) in those requiring lower doses (<35 mg/week) and in the elderly (age ≥75 years), respectively:(7.3 ± 5.4 mg vs 11.4 ± 8.9 mg, p = 0.002) and (7.1 ± 4.1 vs 9.6 ± 8 mg p = 0.012)]. However, origin of the patients had no significant effect on MAE (p = 0.32).
Discussion
In this study, we derived and validated a genotype- guided warfarin dosing model in an Arab population with mixed nationalities and compared its outcomes to an internationally validated warfarin dosing model (Gage et al model available from www.warfarindosing.org). We also reported the prevalence of the genetic variants associated with warfarin dose (VKORC1-1639G > A, CYP2C9*2, CYP2C9*3 and CYP4F2 genes), which were similar to those published in previous studies from the Arab region. 12 MAF of CYP2C9*2 and CYP2C9*3 was 11% and 6% in the overall population of the study which showed resemblance to MAF from studies of different populations residing in the Arab region: 7-11.7% and 4.3-10.7% in Egyptians, 12% and 2%–4% in Qataris, 13% and 2% in Saudis, 14% and 4% in Kuwaitis, 13% and 6% in Jordanians, 15% and 7% in Lebanese, 6% and 6% in Omanis, 5% and 0% in Sudanese, respectively. With regards to VKORC1-1639G > A gene; MAF was 47% in the overall population of the study. MAF from other studies from the region were mostly similar as seen in the following: 46%–72% in Egyptians, 47% in Qataris, 42% in Saudis, 40% in Kuwaitis, 52% in Lebanese, 35% in Omanis, 37% in Sudanese, respectively. With regards to CYP4F2, MAF was 40% in our population. Other studies reported similar MAF, eg: 38%–43% in Qataris, 42% in Egyptians, respectively.
The model derived in the Arab population showed high association with the actual dose in the validation cohort with a correlation coefficient of 0.71. Additionally, the Arab model showed higher accuracy when compared to Gage et al model. This was evident from a significant 25% reduction in the MAE (9.3 (±7.6) versus 12.4 (±10.4), p = 0.006). Another measure of model accuracy, the percentage of predicted warfarin doses within 20% of the actual dose, was higher using the Arab model compared to Gage et al, but it was not statistically significant [55 (40.7%) versus 40 (29.6%), p = 0.073]. Additionally, the Arab model showed better accuracy in patients requiring lower warfarin doses (< 35 mg/week) and the elderly; this was evident from a 35% and 25% lower MAE, respectively, compared to their counterparts. On the other hand, there were no differences in model accuracy when the patients were stratified according to their origin.
Clinical utility of GWD was studied in a number of landmark trials. Compared to non-GWD, GWD achieved better outcomes in terms of percentage of time in therapeutic range (PTTR), percentage of patients with INR>4 and time to therapeutic range.17,18 This was especially the case when the studied population was relatively homogenous in terms of ethnicity. CWD was argued to have similar outcomes when compared to GWD in the Clarification of Optimal Anticoagulation through Genetics (COAG) study where the population was diverse (27% African American and 73% European). 19 However, in another study comparing CWD to GWD in a homogenous population, GWD resulted in superior outcomes. 11 Hence, the clinical pharmacogenetics implementation consortium (CPIC) recommended in their recent warfarin pharmacogenomics to use pharmacogenetic-validated algorithms. 20 The used algorithm should rely on the population ancestry (African vs non-African ancestry) which emphasizes the importance of comparing validated algorithms according to the studied population.
From that prospective, we believe that our results will help in the implementation of warfarin pharmacogenomics in the Arab population, especially when the genotyping results are available. Our model included the following factors: Age, weight, having a prosthetic valve, using azole containing drugs, using trimethoprim-sulfamethoxazole combination and having variants in the VKORC and/or CYP2C9 genes. The model could explain 51.6% of warfarin dose variability in the validation cohort. Previous models validated in populations from the same region had similar factors and an R2 in a similar range. 12
Some limitations of this study include: not testing for other genetic variants like CYP2C9*5, CYP2C9*6, CYP2C9*8, CYP2C9*11 and CYP2C cluster. We acknowledge that although these variants are highly associated with warfarin dose, but were not prevalent in most of the populations that our patients originated from and are rather associated with patients from other African regions (West Africa).8,12 We did not account for vitamin k containing diet in this study. Although efforts were made to include all Arab nationalities, Most of the study population were from three main regions: Gulf countries(Qatar, Saudi Arabia, Bahrain, Oman), Levant (Syria, Jordan, Palestine and Lebanon), Egypt and Sudan. Countries like Morocco, Tunisia, Algeria, Libya and Mauritania were underrepresented. Nearly 15% of the overall study population had a significant drug interaction which is an important variable mentioned in previous studies. The rather small percentage may have led to a lower contribution to the overall warfarin dose variability in the derivation cohort.
Conclusion and Future Directions
A model derived from an Arab population showed that: Age, weight, having a prosthetic valve, use of an azole containing drug, use of trimethoprim-sulfamethoxazole and having a variation in CYP2C9 and VKORC1 genotypes are predictors of warfarin dose and explained more than 50% of warfarin dose variability in this population. The derived model correlated well with the actual warfarin dose with improved accuracy compared to Gage et al's model in the validation cohort. Whether that improved accuracy would result in superior clinical outcomes is an important question that remains to be tested in prospective studies.
Footnotes
Acknowledgements
The authors acknowledge support from the clinical pharmacy section: Dr Hassan Mitwally, Dr Raja Barazi, Dr Safa Alrawi, Dr Dania Alkhiyami, Dr Sara Hayder Ahmed and Dr Eman Elhmoud.
Ethical Approval
Ethical approval granted by HMC MRC.
Author Contributions
AM and AB are equal contributors as first author. HE is the corresponding author. AM, AB, HE and MS helped in all study roles and reviewed the manuscript. AF, IJ and LB helped in data collection and analysis.
Funding
The authors disclosed receipt of the following financial support for the research, authorship, and/or publication of this article: This work was supported by the Medical Research Center, Hamad Medical Corporation, (grant number IRGC-06-JI-19-205). Open Access funding provided by Qatar University.
Declaration of Conflicting Interests
The authors declared no potential conflicts of interest with respect to the research, authorship, and/or publication of this article.
Data Availability
Study data is available on reasonable request.