




Abstract
The Implementation Leadership Scale (ILS) is a brief, pragmatic, and efficient measure that can be used for research or organizational development to assess leader behaviors and actions that actively support effective implementation of evidence-based practices (EBPs). The ILS was originally validated with mental health clinicians. This study validates the ILS factor structure with providers in community-based organizations (CBOs) providing child welfare services. Participants were 214 service providers working in 12 CBOs that provide child welfare services. All participants completed the ILS, reporting on their immediate supervisor. Confirmatory factor analyses were conducted to examine the factor structure of the ILS. Internal consistency reliability and measurement invariance were also examined. Confirmatory factor analyses showed acceptable fit to the hypothesized first- and second-order factor structure. Internal consistency reliability was strong and there was partial measurement invariance for the first-order factor structure when comparing child welfare and mental health samples. The results support the use of the ILS to assess leadership for implementation of EBPs in child welfare organizations.
Evidence-based practices (EBPs) have been developed to address critical service needs in child welfare services. However, there is a research-to-practice gap in the effective use of such EBPs (Proctor et al., 2009). In order to shrink this gap and identify and address barriers to implementation, research has expanded to examine implementation processes involved in introducing, adapting, and maintaining EBPs in real-world service settings (Aarons, Hurlburt, & Horwitz, 2011; Damschroder et al., 2009; Kohl, Schurer, & Bellamy, 2009; Raghavan, Inoue, Ettner, & Hamilton, 2010). Previous research has investigated individual-level factors involved in implementation such as attitudes toward EBPs (Aarons, 2004) and training in EBPs (Aarons, 2004; Nelson & Steele, 2007), as well as other factors beyond provider characteristics by studying the inner (i.e., organization) and outer (i.e., system) context of service delivery (Aarons et al., 2011). Such work has recognized organizational factors as influential in the implementation of EBPs (Aarons, Horowitz, Dlugosz, & Ehrhart, 2012; Ferlie, 2009; Kimberly & Cook, 2008).
Leadership is a critical factor for organizational change (Bass, 1985; Bass & Avolio, 1990). Research on leadership and implementation has tended to focus on the role of general leadership style, such as the relationship between leaders and followers (i.e., leader–member exchange) and transformational leadership (Aarons & Sommerfeld, 2012; Michaelis, Stegmaier, & Sonntag, 2009, 2010). Recent work in management of allied health services organizations has suggested the potential for identifying and focusing on strategic leadership specific to effective EBP implementation (Aarons, Ehrhart, Farahnak, & Hurlburt, 2015). For example, during EBP implementation, the role of the leader may be to influence buy-in, help problem solve, adapt EBP to settings and clients, and act as a resource and a guide.
Efficient and pragmatic measures that capture implementation constructs must be developed and tested across service settings to advance research and improve implementation (Glasgow & Riley, 2013; Martinez, Lewis, & Weiner, 2014; Proctor et al., 2009). The development of the Implementation Leadership Scale (ILS) was guided by the need for a brief and efficient measure to assess leader behaviors and actions that support effective implementation (Aarons, Ehrhart, & Farahnak, 2014). Exploratory and confirmatory factor analyses supported a 12-item scale with 4 subscales: (1) Proactive Leadership: anticipating and addressing implementation challenges; (2) Knowledgeable Leadership: having a deep understanding of EBP and implementation issues; (3) Supportive Leadership: supporting clinicians’ adoption and use of EBP; and (4) Perseverant Leadership: being consistent, unwavering, and responsive to EBP implementation challenges.
Although there are many similarities between mental health service settings and child welfare service settings (Aarons et al., 2011), there are also implementation challenges unique to each. For example, the structure of the child welfare systems can be highly bureaucratic, which has been shown to influence provider attitudes toward using EBPs (Aarons, 2004). Workforce issues such as high turnover and buy-in for EBPs are also a concern for implementation. Even if child welfare professionals are open to EBPs and skilled in their delivery, effective leadership may help to support implementation climate and efforts. Effective implementation leadership requires the demonstration of EBP knowledge, proactively identifying and solving problems, supporting staff, and providing consistent and ongoing oversight of implementation. The ILS was developed to assess these leader behaviors.
The purpose of the present study was to assess the factor structure and reliability of the ILS in a sample of child welfare service providers. We hypothesized that the factor structure and strong reliability identified with mental health clinicians (Aarons et al., 2014) would be replicated in this sample of child welfare service providers. As a secondary analysis, we examined the factorial invariance of the ILS across both child welfare and mental health settings, should researchers seek to make direct comparisons between these contexts.
Method
Participants
Participants were 214 child welfare service providers working for 12 different community-based organizations in California (6 agencies), Illinois (1 agency), Oklahoma (4 agencies), and Washington State (1 agency). Of the 230 eligible providers, 214 (93.0%) participated. Providers were organized into 43 teams, with an average team size of 5.0 (standard deviation [SD] = 3.0, range 1–16). Each team was comprised of providers, all reporting to the same supervisor. The sample consisted of 92.5% female and with an average age of 39.6 years (SD = 10.1, range 23–72). The racial distribution of the sample was 61.8% Caucasian, 16% African American, 5.7% Native American, 3.8% Asian American, and 12.7% other, with 21% of participants identifying as Hispanic. Highest level of education was 0.9% PhD/MD, 43% master’s degree, 37.9% bachelor’s degree, 6.1% some college but no degree, and 0.9% no college. For the measurement invariance analysis, the results from the child welfare sample were compared with mental health providers used in the confirmatory factor analyses (CFAs) (N = 230) in the original scale development study (Aarons et al., 2014).
Procedure
Agency executives provided permission to recruit service providers for participation; providers were then contacted via e-mail and phone. This study was approved by the appropriate institutional review boards. Data were collected as part of a larger survey that took approximately 20–30 min to complete. The majority of participants (93%, n = 199) completed surveys online; only 7% (n = 15) completed in-person surveys. The method of participation was determined by distance from the research team. There were no significant differences in the ILS measure or subscales based on the method of survey completion. Participants provided informed consent and received a US$15 gift certificate for their participation. Instructions indicated that individual participant responses would not be shared with team supervisors. For online surveys, each participant was e-mailed a unique password and username, in addition to the link to the survey. For in-person data collection, the research team reserved an hour during a regularly occurring team meeting. If participants were not able to complete the survey in-person and collecting data online was not practical, surveys were left or mailed to the participating agencies.
Measures
Providers completed the ILS, reporting about their primary supervisor’s leadership behaviors. The ILS is comprised of 12 items scored on a 0 (not at all) to 4 (to a very great extent) scale (Aarons et al., 2014). Subscales include Proactive Leadership (3 items, α = .95), Knowledgeable Leadership (3 items, α = .96), Supportive Leadership (3 items, α = .95), and Perseverant Leadership (3 items, α = .96). The mean of the subscales is computed to create the total ILS score (α = .98). The full items and scoring for the ILS can be found in the “additional files” accompanying the original measurement development study (Aarons et al., 2014) which is freely available online at http://www.implementationscience.com/content/9/1/45
Statistical Analyses
CFAs were conducted using Mplus 7 statistical software, accounting for the nested data structure and using maximum likelihood estimation with robust standard errors (MLR) to adjust the standard error and χ2 values for nonnormality (Muthén & Muthén, 1998–2015). Although minimal, missing data were imputed using full information maximum likelihood estimation. To determine model fit, several fit indices were utilized: comparative fit index (CFI), with values greater than .95 indicating good fit; the root mean square error of approximation (RMSEA), with values less than .06 indicating good fit, and the standardized root mean square residual (SRMR), with values less than .08 indicating acceptable fit (Hu & Bentler, 1999). Cronbach’s α was also assessed. Intraclass correlations (ICC[1]s) and the average correlation within group (a wg(j)) for each subscale were calculated to evaluate the aggregation of the individual-level responses to the unit (i.e., team) level (excluding teams with only one respondent). ICC(1) is the proportion of variance within each subscale that is attributed to the team (i.e., the proportion of variance that is between teams as opposed to within teams).
To further establish cross validation and confirm the assumption that the ILS measures the same psychological construct in child welfare and mental health settings, measurement invariance was examined between the participants in the child welfare sector and the mental health clinician CFA sample (N = 230) from initial scale development study (Aarons et al., 2014). Measurement invariance analyses were conducted using Mplus 7 statistical software, accounting for the nested data structure and using maximum likelihood estimation with robust standard errors (MLR) to adjust the standard error and χ2 values for nonnormality (Muthén & Muthén, 1998–2015). Because of convergence issues due to the large number of parameters being estimated relative to the sample size, the measurement invariance analysis focused on a first-order model only (i.e., correlated first-order factors instead of the second-order factor). The χ2 of a model with all parameters allowed to be unequal across groups was compared to the χ2 of a model with first-order factor loadings constrained to be equal across groups. The χ2 value has been sparingly used when determining whether models fit well (Roesch, Norman, Merz, Sallis, & Patrick, 2013). Statisticians have suggested that because the χ2 test statistic and the χ2 difference test are dependent on sample size and biased against invariance for large sample size (MacCallum, Browne, & Cai, 2006), the χ2 difference test should be supplemented with information on the changes in the fit indices, with ΔCFI differences that are less than −.01 and ΔRMSEA values less than .015 or ΔSRMR values less than .030, specifying no meaningful difference between nested models when the combined sample size is over 300 (Chen, 2007; Cheung & Rensvold, 2002). As such, we examined both χ2 difference and change in fit indices in our analyses. No means or intercepts were estimated in these models. This approach is consistent with the recommendations from Meredith (1993) for establishing weak factorial invariance, which is necessary for making meaningful comparisons across groups (Ployhart & Oswald, 2004).
Results
The four-factor implementation leadership model with a second-order overall factor was tested using CFA. The four dimensions were each indicated by three observed variables and the four dimensions were then indicators for the second-order factor. The higher order factor model showed acceptable fit, χ2(50) = 115.018, p < .001; CFI = 0.97, RMSEA = .078, 90% CI [.059, .097], probability RMSEA ≤ .05 = .008; SRMR = .047, providing support for the cross validation of the ILS. Although there was a significant χ2 and higher than recommended RMSEA, we deemed the model acceptable as RMSEA tends to be negatively influenced by small sample sizes and χ2 tests tend to be overly sensitive when correlations among items in the model are high (the average interitem correlation among all items was .97). As shown in Table 1, the first-order standardized factor loadings ranged from .85 to .99 and the second-order standardized factor loadings from .83 to .90. All factor loadings were statistically significant (ps < .001).
CFA Results and Summary Statistics for the Implementation Leadership Scale.

Note. a wg(j) = average correlation within group; CFA = confirmatory factor analysis; EBP = evidence-based practice; ICC(1) = intraclass correlation (proportion of variance attributed to the unit); ILS = Implementation Leadership Scale; SD = standard deviation. n = 214. All loadings p < .001.
The ILS scale reliabilities, item means, SDs, and the aggregation statistics are shown in Table 1. Cronbach’s α for the subscales and ILS total score ranged from .93 to .97, demonstrating excellent internal consistency reliability. The ICC(1) for the overall ILS scale subscales ranged from .17 to .29. The a wg(j) values for the total ILS scale and all but one of the four ILS dimensions were strong, ranging from .70 to .71 and Knowledgeable Leadership demonstrated acceptable agreement levels (.69). The pattern of all the aggregation statistics supports the ILS subscales and total scale as unit-level constructs in child welfare services.
Measurement invariance results are displayed in Table 2. The first-order model with all parameters freely estimated in the two groups demonstrated acceptable fit, χ2(104) = 222.38, p < .001; CFI = .970, SRMR = .043, RMSEA = .072. We then increased the constraints on this model and tested a metric invariance model with first-order factor loadings held equal in the two groups. This model demonstrated adequate fit, χ2(116) = 259.30, p < .001; CFI = 0.963, SRMR = 0.127, RMSEA = 0.075. We found a significant difference in the Yuan-Bentler (Y-B)-corrected χ2 values between the model with all parameters estimated freely and the model with first-order factor loadings constrained to equal, Y-BΔχ2(12) = 45.45, p < .01, but the change in fit indices was very small (ΔCFI = −.007; ΔRMSEA = .003; see Chen, 2007), indicating that the metric invariance model held and providing support for weak factorial invariance across groups (Meredith, 1993). Nevertheless, because of the large SRMR value and the significant χ2 difference test, we also conducted additional analyses to assess which items may not have invariant loadings across groups. Modification indices showed only 1 item (“Knows what he or she is talking about” from the Knowledgeable Leadership dimension) that potentially contributed to non-invariant loadings across the child welfare and mental health groups. We reran the loadings constrained to equal model again, but this time allowing that item to load freely. The Y-Bχ2 difference test (all parameters free model vs. this partial metric invariance mode) still produced a significant χ2, and the modification indices did not indicate that any additional item loadings should be released.
Measurement Invariance for ILS First-Order Factor Model Comparisons.
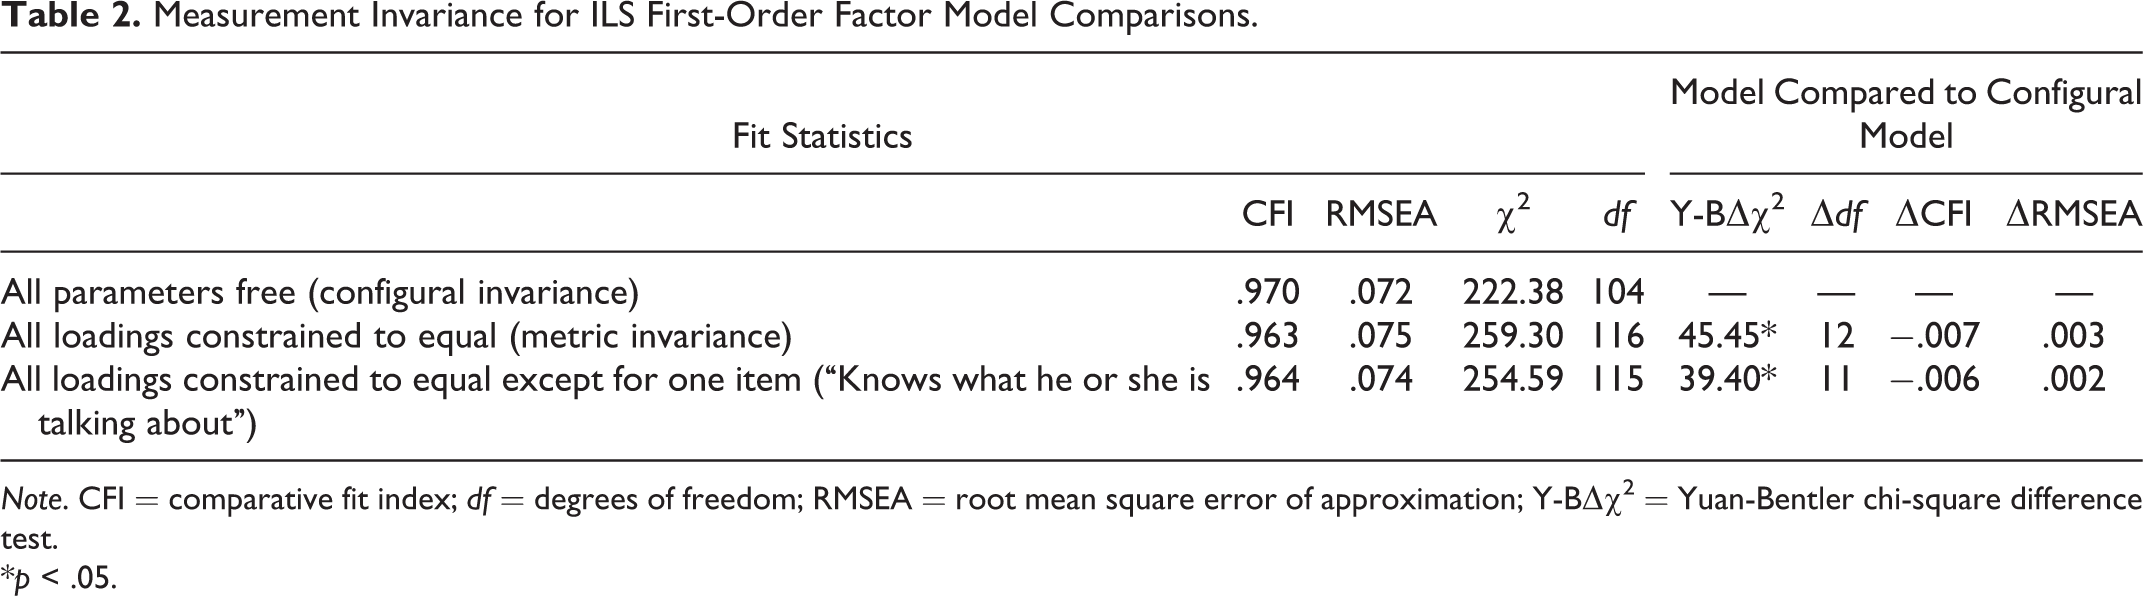
Note. CFI = comparative fit index; df = degrees of freedom; RMSEA = root mean square error of approximation; Y-BΔχ2 = Yuan-Bentler chi-square difference test.
*p < .05.
Discussion
This study provided support for the factorial validity and psychometric soundness of the ILS in a sample of child welfare service providers. The first- and second-order factor structure of the ILS were supported based on child welfare providers’ ratings of their supervisors’ implementation leadership behaviors. Additionally, for the first-order model, results indicated weak factorial invariance across child welfare and mental health settings, providing preliminary support for the use of this scale in making comparisons across child welfare and mental health service organizations.
The focus of the ILS on strategic leadership to support implementation efforts allows for a more targeted approach to the complexities of studying implementation. As organizations anticipate implementation and approach sustainment of an EBP, the ILS can aid in identifying strengths and weaknesses of leader support for EBP. This knowledge can assist upper level management in directing preparation efforts and continued support. Furthermore, it is essential to have a metric for evaluating more formalized implementation leadership efforts, such as leadership interventions tailored to preparing leaders for creating climate for implementation (Aarons et al., 2015). To fully understand how leadership influences implementation outcomes, future research should include measures of both general leadership (e.g., the full range leadership model; Bass & Avolio, 1990) and strategic implementation leadership to examine their simultaneous impact.
This study has some limitations that should be addressed. First, although the factor structure of the ILS in child welfare was supported, the results for the comparisons with the mental health sample were not as strong, and we were unable to directly compare the second-order factor structure across the two samples using MLR estimation. Thus, future research with larger samples is needed to address these issues and provide further support for measurement invariance of the second-order factor model across child welfare and mental health samples. Second, this study focused on staff perceptions of leadership for the implementation of EBPs in general, but future research should examine leadership for implementation of specific EBPs as well, as outcomes are likely to vary depending on the referent used. Although the present study includes staff perceptions of immediate supervisors’ implementation leadership, we believe that the ILS may be useful to examine implementation leadership at multiple levels of leadership, and future research should examine the psychometric properties of the ILS when measuring staff perceptions of higher level leaders. Third, future research should continue to build on this work by examining the concurrent and predictive validity as well as psychometric properties of the ILS in other settings where organizations implement EBPs such as nursing or substance use disorder treatment. Finally, models integrating the role of implementation leadership in implementation effectiveness are needed; such models should include both proximal (e.g., the implementation climate in the leader’s unit; Ehrhart, Aarons, & Farahnak, 2014; Jacobs, Weiner, & Bunger, 2014) and distal (e.g., EBP fidelity or provider implementation citizenship behavior; Ehrhart, Aarons, & Farahnak, 2015) outcomes of implementation leadership. Understanding how these factors come together to create effective implementation will advance EBP planning and support.
Conclusion
Implementation is presently a nascent area of research in the field of child welfare and there is a need for the development and validation of measures to drive this research forward. Strong strategic leadership for implementation may be vital to successfully supporting staff as they face EBP challenges. Supervisors often act as change agents and should receive targeted attention and support from upper management because of their crucial role influencing others, and the ILS can help to create structure and guidelines for these efforts.
Footnotes
Acknowledgments
The authors thank the community-based organizations and service providers that made this study possible.
Declaration of Conflicting Interests
The author(s) declared no potential conflicts of interest with respect to the research, authorship, and/or publication of this article.
Funding
The author(s) disclosed receipt of the following financial support for the research, authorship, and/or publication of this article: This study was supported by National Institute of Mental Health grants R21MH082731 (PI: Aarons), R21MH098124 (PI: Ehrhart), R01MH072961 (PI: Aarons), P30MH074678 (PI: Landsverk), R25MH080916 (PI: Proctor), and by the Child and Adolescent Services Research Center (CASRC) and the Center for Organizational Research on Implementation and Leadership (CORIL).