




Abstract
As with previous years, enrollments in journalism and mass communication programs in the United States have continued to decline. In 2015, such decline among undergraduate student enrollments was particularly prevalent in journalism sequences; in contrast, undergraduate enrollments in strategic communication sequences have seen some growth since 2013. Findings also reveal potential for journalism and mass communication programs regarding the growth and emergence of online degree programs and online course offerings, the development of the competencies and skills desired by employers, and other opportunities for the professional development of today’s practically minded students.
Keywords
Since its first iteration appeared in Journalism Quarterly in 1934 (Banner, 1934), the Annual Survey of Journalism and Mass Communication Enrollments has been a valuable tool in chronicling the changing nature of our discipline. The survey has been instrumental in gauging student interest in journalism and mass communication and has helped illuminate important trends in a field that has grown and diversified throughout the years (Becker & Vlad, 2013). Furthermore, the survey has been pivotal in raising attention to potential concerns (e.g., declining undergraduate enrollment, demographic disparities) as well as identifying changes within the field (e.g., students’ shifting academic interests). In short, the survey has provided a vital source of information about the field of journalism and mass communication.
Key strengths of the survey have been its continuity and longevity. In 1988, Dr. Lee Becker took responsibility for the survey, and it remained under his stewardship for more than 25 years. Countless people were also instrumental in conducting the annual survey, including Dr. Becker’s colleagues at Ohio State University from 1988 to 1997, followed by his team at the Grady College of Journalism and Mass Communication at the University of Georgia, where the survey was housed from 1997 to 2013.
When Dr. Becker retired from conducting the annual survey, the Association of Schools of Journalism and Mass Communication (ASJMC) assumed ownership of the survey to ensure its continued value as a source of information about the field. We are excited to have the opportunity to work in conjunction with ASJMC to administer the survey, retaining key elements to track enrollment while also adapting to the evolving media landscape. We hope to honor the rich tradition of the survey and help to ensure the mantle continues to be passed down for future generations, as the survey sheds great light on the history of our discipline.
The need to monitor and understand trends within the rapidly changing field of journalism and mass communication is as pressing as ever. In recent years, broad changes within both the professional world and the academy have taken root. The types of jobs available to journalism and mass communication majors are changing (Steffen, 2014), as are the skill sets those entering the workforce are expected to have (Boudreaux, 2016). Although some of these changes have seemingly led to a loss of opportunities (e.g., the notable struggles of legacy media), new opportunities and professions are also proliferating. In many ways, the communications industry is thriving (Bland, 2013), and a wide array of businesses and organizations list communication skills as one of the most desirable traits in new employees (Heck, 2015; Levy & Rodkin, 2015; Steffen, 2014).
Not only is the industry changing but so too is the training students seek, the way they learn and interact in the classroom (Boudreaux, 2016), and, increasingly, what the nature of today’s classroom looks like—as online degrees have become a common and viable means of acquiring an education (Castaneda, 2011).
All these changes make this both a challenging and exciting time for the field of journalism and mass communication. Core concerns with enrollment, degrees granted, areas of emphasis, the demographic makeup of students, and program finances and administration persist. Thus, the goal of capturing trends in these areas remains a key purpose of the Survey of Journalism and Mass Communication Enrollments.
However, the 2015 survey has also been adapted to capture emerging trends in the field. This entails the inclusion of new items to track (a) enrollment in online and distance-learning opportunities, (b) changes in curriculum (e.g., the competencies and skills emphasized in the classroom), (c) infrastructure for professional development (e.g., student-run media, internship opportunities), and (d) multicultural and/or global experiences (e.g., study abroad opportunities).
This report not only reveals that enrollment in journalism and mass communication programs remains a concern but also suggests that in other ways the future of the field is ripe with opportunity for growth, diversification, and expansion.
Method
This report uses data from the 2015 Survey of Journalism and Mass Communication Enrollments and the most recent Annual Survey in 2013. As with the previous Annual Surveys (Becker, Vlad, & Simpson, 2014), the population of journalism and mass communication programs for the 2015 survey was constructed using The Journalism & Mass Communication Directory (published by the Association for Education in Journalism and Mass Communication [AEJMC]) and The Journalist’s Road to Success: A Career Guide (published online by the Dow Jones News Fund). The AEJMC Directory lists colleges and universities that offer courses in journalism and mass communication, and the Career Guide includes colleges that offer journalism majors. Together, these directories generated a list of 474 programs in colleges and universities. This list includes programs that are members of the ASJMC—accredited by the Accrediting Council on Education in Journalism and Mass Communications (ACEJMC) as well as not accredited—and programs that are neither accredited by ACEJMC nor are members of the ASJMC.
Journalism and mass communication program administrators were contacted in mid-March 2016 with an invitation email that contained a link to the survey hosted in the Qualtrics online survey platform. Administrators were also provided with the option to complete an Adobe Acrobat or Word version of the survey and return it via email. Email reminders were sent late March, early April, and mid-June. In addition, phone call reminders were made mid-April, mid-May, and late June, although the third round of phone calls was made only to ASJMC member programs. A fourth round of phone calls was also made in early November to nonresponding ASJMC member programs with a request to complete a shortened (one-page) version of the survey that included only the basic enrollment questions. These efforts resulted in a sample of 182 programs—60 (33%) were ASJMC member programs accredited by the ACEJMC, 47 (25.8%) were ASJMC member programs not accredited by ACEJMC, and 75 (41.2%) were nonaccredited and non-ASJMC member programs. 1
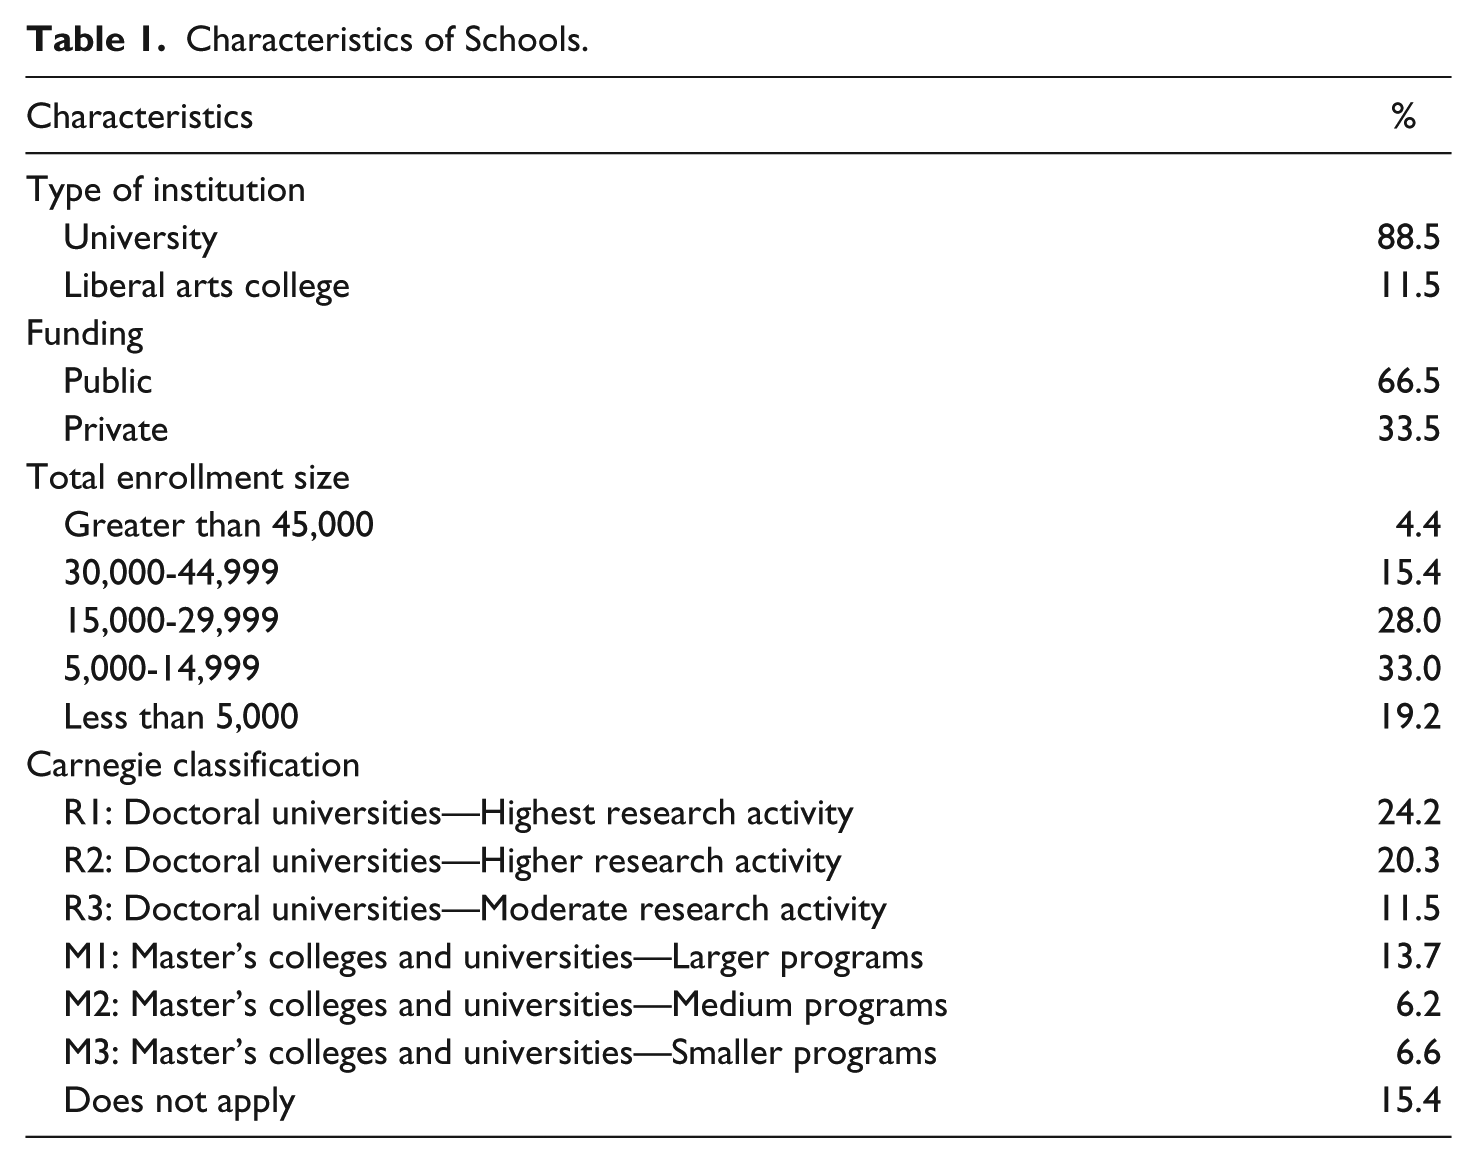
The survey asked administrators questions about enrollments (fall 2015) and the number of degrees granted (2014-2015 academic year) in their undergraduate and graduate degree programs, as well as enrollments and the number of degrees granted broken down by sequence area and demographics. In addition, the survey asked questions about curriculum and student development (e.g., competencies, student-run media, internship opportunities, study abroad opportunities, online courses), finances and administration (e.g., operating budget changes, hiring freezes, program changes), and institution characteristics (e.g., type of institution, funding, total enrollment size, and Carnegie classification) to facilitate comparisons with peer institutions. For institution characteristics, see Table 1.
Characteristics of Schools.
Trends were captured by comparing data from the 177 programs that responded to the 2013 Annual Survey of Journalism and Mass Communication Enrollments (Becker et al., 2014) and the 2015 Survey of Journalism and Mass Communication Enrollments. As in past years, there was significant variability in the number and types of questions answered by program administrators (Becker et al., 2014). Whereas some program administrators provided data for each question, others only provided data for certain types of questions. Moreover, a handful of programs provided only basic enrollment data. Comparisons were made only among the 177 overlapping programs that provided data for each question both years.
Findings
Degrees Offered
Among the 182 programs that reported the types of degrees offered by their unit, all but one (99.5%) offered a bachelor’s degree, 40.7% offered a professional master’s degree, 33.5% offered a research master’s degree, and 17.0% offered a PhD. Moreover, 9.9% offered a bachelor’s degree online, 15.4% offered a professional master’s degree online, and 3.8% offered a research master’s degree online. A few (6.6%) programs offered a professional master’s degree that could only be earned online. However, none of the programs offered a PhD online.
Enrollments and Degrees Granted
In terms of enrollments in these programs in fall 2015, among the 182 programs that reported enrollment data, 1.0% of undergraduate students were enrolled in an online degree program (n = 175 programs), 34.0% of professional master’s students were enrolled in an online degree program (n = 60 programs), and 0.6% (n = 46 programs) of research master’s students were enrolled in an online degree program. In terms of the number of degrees granted in these programs in the 2014-2015 academic year, 0.2% of undergraduate students earned an online degree (n = 141 programs), 16.2% of professional master’s students earned an online degree (n = 53 programs), and 8.1% of research master’s students earned an online degree (n = 37 programs).
As with previous years, overall enrollments in journalism and mass communication programs continued to decline. As shown in Figures 1 and 2, among the programs that reported enrollment data in both 2013 and 2015, undergraduate enrollments in fall 2015 decreased by 1.2%, while master’s enrollments decreased by 0.8%, and PhD enrollments stayed about the same with a very slight increase. However, among the programs that reported data on the number of degrees granted in both 2013 and 2015, the number of bachelor’s degrees granted in the 2014-2015 academic year in journalism and mass communication increased by 4.8%, while the number of master’s degrees increased by 4.8%, and the number of doctoral degrees granted increased by 8.0%.

Undergraduate enrollments and degrees granted for 2013 and 2015, same programs.

Graduate enrollments and degrees granted for 2013 and 2015, same programs.
Enrollments and Degrees Granted by Sequence Area
Program administrators were asked to report data on undergraduate enrollments and degrees granted by major sequences or areas of concentration. They were provided with a list of 25 sequences, but they also had the option to write in additional sequences that were not on the original list as well as classify students as “undecided/pre-major.” These sequences were later grouped into broader sequence areas, including journalism, electronic media and production, strategic communication, communication studies, and other. Among the 164 programs that reported sequence data, the majority offered sequences in journalism (83.5%) and strategic communication (80.0%), and another 48.2% offered sequences in electronic media and production.
Journalism and strategic communication sequences had the highest enrollments in 2015. Among the 128 programs that reported enrollment data by sequences, the largest number of enrollments was in strategic communication sequences (29,151 students) followed by journalism sequences (19,093 students). Moreover, among the programs that reported enrollment data by sequences in both 2013 and 2015, the number of undergraduate students in strategic communication sequences increased by 8.4% (n = 64 programs), whereas the number of students enrolled in journalism sequences decreased by 9.0% (n = 70 programs). In terms of enrollments by specific sequences, as shown in Figure 3, the number of undergraduate students enrolled in advertising increased by 3.8% and the number of undergraduate students enrolled in public relations increased by 4.4%. In contrast, the number of undergraduate students enrolled in journalism (undifferentiated) decreased by 16.3%, the number enrolled in news editorial/print journalism decreased by 13.9%, and the number enrolled in broadcast news/broadcast journalism decreased by 6.7%.
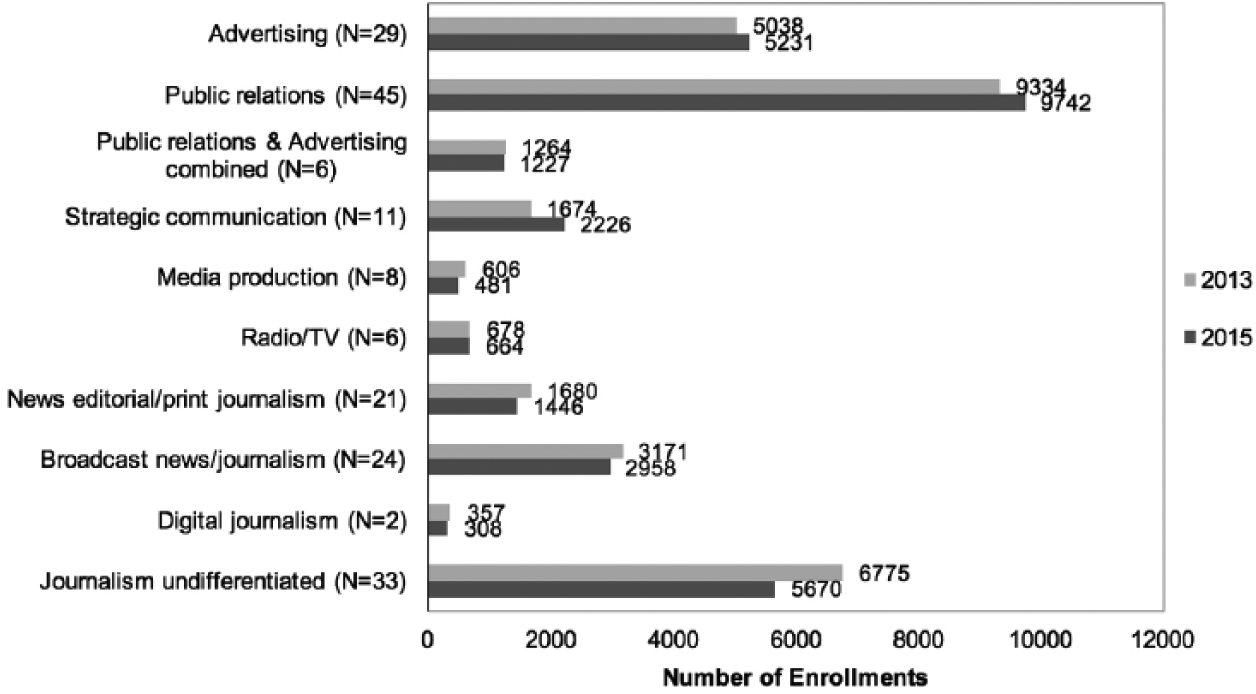
Undergraduate enrollments by sequences for 2013 and 2015, same programs.
The findings for degrees granted by sequence area generally mirrored the findings for enrollments by sequence area. Among the 116 programs that reported data on the number of degrees granted by sequences, the highest number of degrees granted was in strategic communication sequences (6,222 degrees) followed by journalism sequences (4,380 degrees). Moreover, among the programs that reported data on the number of degrees granted by sequences in both 2013 and 2015, the number of degrees granted in strategic communication sequences increased by 15.7% (n = 42 programs), whereas the number of degrees granted in journalism sequences decreased by 2.4% (n = 55 programs). In terms of degrees granted by specific sequences, as shown in Figure 4, the number of degrees granted in advertising increased by 3.3% and the number of degrees granted in public relations increased by 17.1%. The number of degrees granted in journalism (undifferentiated) increased by 2.8%, although the number of degrees granted in news editorial/print journalism decreased by 14.1% and those in broadcast news/broadcast journalism decreased by 3.6%.
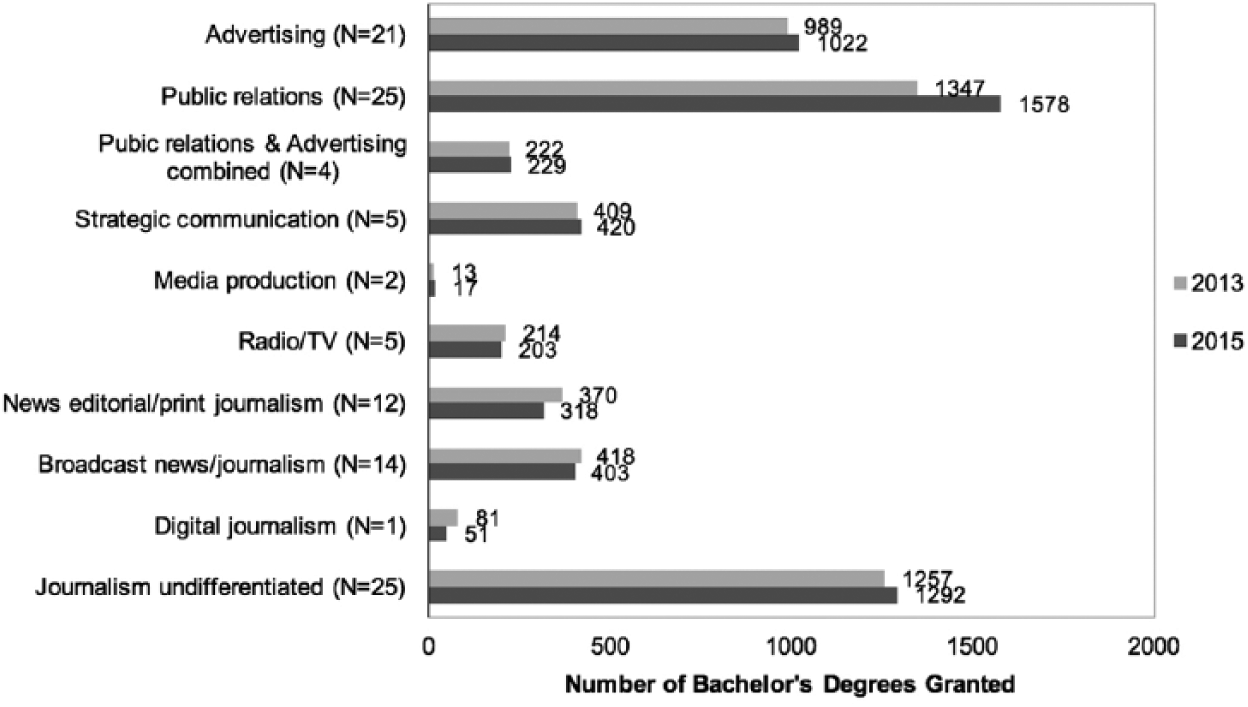
Bachelor’s degrees granted by specific sequences for 2013 and 2015, same programs.
Enrollments and Degrees Granted by Characteristics of Students
Women continue to comprise the majority—about two thirds—of journalism and mass communication students in fall 2015. In particular, among the programs that reported enrollment data by gender, women comprised 65.4% of undergraduate students (n = 109 programs), 71.6% of professional master’s students (n = 36 programs), 60.8% of research master’s students (n = 26 programs), and 60.4% of PhD students (n = 16 programs). Among the programs that reported enrollment data by gender in both 2013 and 2015, the percentage of female undergraduate students increased by 2.2% (from 63.6% to 65.8%; n = 74 programs) and the percentage of female master’s students increased by 3.1% (from 67.4% to 70.5%; n = 36 programs), while the percentage of female PhD students remained the same (60.7%; n = 9 programs).
Similarly, women earned about two thirds of the degrees granted in the 2014-2015 academic year. In particular, among the programs that reported data on the number of degrees granted by gender, women earned 66.1% of bachelor’s degrees granted (n = 94 programs), 67.4% of professional master’s degrees granted (n = 34 programs), 54% of research master’s degrees granted (n = 21 programs), and 64.4% of doctoral degrees granted (n = 14 programs). Moreover, among the programs that reported data on the number of degrees granted by gender in both 2013 and 2015, the percentage of bachelor’s degrees granted to women stayed about the same (from 67.1% to 67%; n = 54 programs), the percentage of master’s degrees decreased by 2.6% (from 69.3% to 66.7%; n = 22 programs), and the percentage of doctoral degrees increased by 5.7% (from 55.8% to 61.5%; n = 7 programs).
In terms of enrollments by race and ethnicity, among the programs that reported these data, minority students (non-White, U.S. citizens) comprised 33.7% of undergraduate students (n = 85 programs), 28.9% of professional master’s students (n = 30 programs), 24.2% of research master’s students (n = 21 programs), and 18.3% of PhD students (n = 15 programs). Among the programs that reported enrollment data by race/ethnicity in both 2013 and 2015, the percentage of ethnic/racial minority undergraduate students decreased by 2.8% (from 34.1% to 31.3%; n = 57 programs), whereas the percentage of minority master’s students increased by 1.1% (from 27.8% to 26.7%; n = 29 programs), and the percentage of minority PhD students increased by 1.3% (from 16.7% to 18%; n = 8 programs).
In terms of degrees granted by race and ethnicity, among the programs that reported these data, minority students earned 30.6% of bachelor’s degrees granted (n = 58 programs), 30.4% of professional master’s degrees granted (n = 24 programs), 22.2% of research master’s degrees granted (n = 14 programs), and 14.7% of doctoral degrees granted (n = 11 programs). Among the programs that reported data on the number of degrees granted by race/ethnicity in both 2013 and 2015, the percentage of bachelor’s degrees granted to minorities increased by 3.5% (from 23.8% to 27.3%; n = 34 programs) and the percentage of master’s degrees granted to minorities increased by 2.1% (from 27.7% to 29.8%; n = 21 programs), whereas the percentage of doctoral degrees granted to minorities decreased by 19% (from 31.5% to 12.5%; n = 7 programs). It is worth noting that, while the percentage of doctoral degrees granted to White students decreased as well (from 46.3% to 42.9%), the percentage of international students increased substantially (from 22.2% to 44.6%).
Curriculum and Student Development
In terms of the new items that were added to capture data on undergraduate curriculum and student development, program administrators were asked to indicate whether their undergraduate curriculum offers courses that focus primarily on the development of specific competencies and skills, whether their units have various types of student-run media, whether they require internship credit, whether they offer study abroad opportunities, and the number of courses in their curriculum that are being offered online.
Among the 144 programs that reported data pertaining to whether their undergraduate curriculum offers courses that focus primarily on the development of specific competencies and skills (see Figure 5), a majority of programs reported having undergraduate courses in their curriculum that focus primarily on media ethics (80.6%), visual storytelling (77.1%), web content production (63.2%), web layout and design (61.8%), media literacy (61.1%), and cross-cultural communication (56.9%).
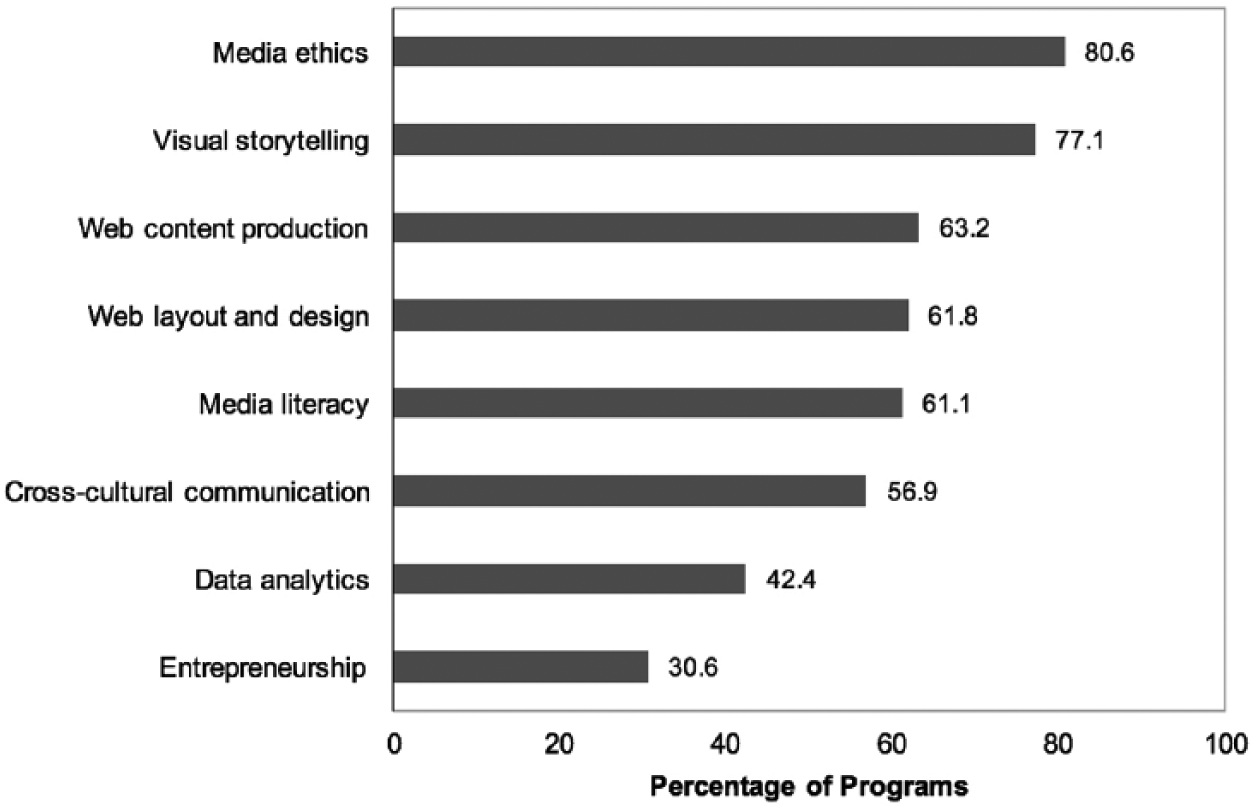
Percentage of programs (n = 144) that offer undergraduate courses focused primarily on the development of specific competencies or skills.
In terms of student-run media, program administrators were provided with a list of five types of student-run media, but they also had the option to write in additional student-run media that were not on the original list. Online publication/website was the most prominent instance of “other” student-run media, and as such it was added as an additional category. Among the 138 programs that reported such data, as shown in Figure 6, a majority of programs reported having a student-run newspaper (86.2%), radio station (63.8%), and TV station (55.8%). However, it is also worth noting that 45.7% reported having a student-run advertising or public relations agency.

Percentage of programs (n = 138) that have student-run media.
Among the 152 programs that offer internship credit, 38.2% require internship credit for students in all sequences, 17.1% require internship credit for students in some sequences but not others, and 44.7% offer internship credit but do not require it. Among the 115 programs that offer study abroad opportunities, 96.5% offer international study abroad opportunities and 53.9% offer domestic off-campus study abroad opportunities (e.g., study at another U.S. institution, faculty-led trips). Last, the average number of courses offered online was 6.97 (range = 1-25 courses; n = 97 programs).
Finances and Administration
Among the 144 programs that reported data on operating budget changes for the 2015-2016 academic year, 20.9% saw an increase in their operating budget, 23.6% saw a decrease in their operating budget, and 54.9% saw no change. Among the programs that reported operating budget data both in 2013 and 2015, as shown in Figure 7, the percentage of programs that saw an increase in their operating budget decreased by 5.3%, whereas the percentage of programs that saw a decrease in their operating budget increased by 11.8%.
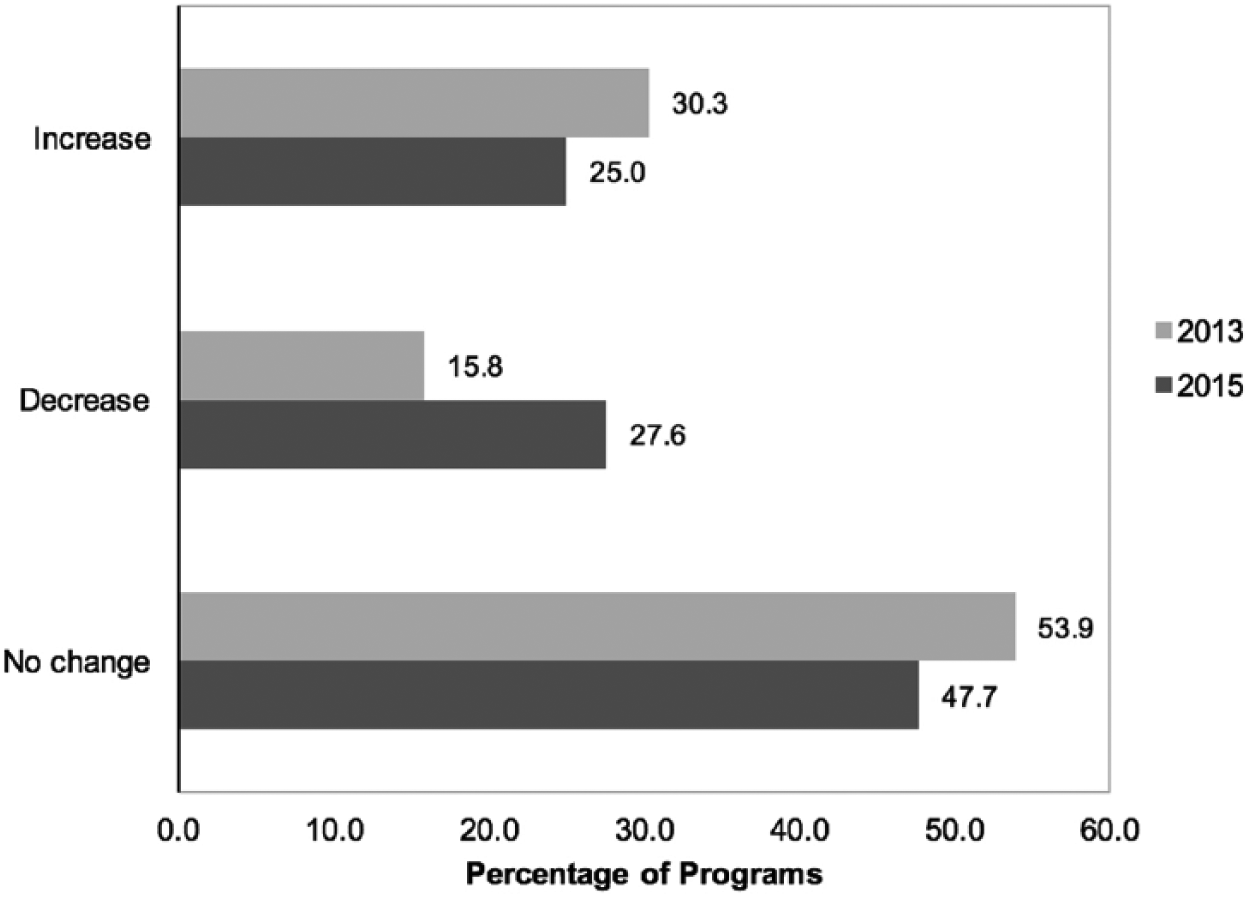
Percentage of programs that saw changes in their operating budget for 2013 and 2015, same programs (n = 76).
As with previous years, among the 148 programs that reported data on hiring freezes at their university, about eight in 10 programs reported no current faculty or staff hiring freezes. Among the programs that reported hiring freeze data both in 2013 and 2015, the percentage of programs that reported no hiring freezes decreased by 2.3%.
Finally, in terms of program changes during the 2014-2015 academic year, 25.2% added new sequences to their programs (n = 147 programs), whereas 9.0% eliminated sequences from their programs (n = 144 programs). In addition, 7.5% of programs combined with another unit on their campus (n = 144 programs).
Discussion
Consistent with recent years, we found a decrease in enrollment at the undergraduate and master’s levels. This continued trend is clearly concerning for the field of journalism and mass communication as a whole. But our findings are most alarming for journalism, where there was a substantial drop in the number of undergraduate students enrolled in journalism sequences, including journalism (undifferentiated), news editorial/print journalism, and broadcast news/broadcast journalism. Although this continued trend is not unexpected, the magnitude of these drops is certainly noteworthy. Reflecting on the 2013 Annual Survey of Journalism and Mass Communication Enrollments, Becker et al. (2014) concluded, “a focus on journalism as practiced in the past is not likely to attract student interest” (p. 364). This continues to hold true.
These findings underscore the increasing sentiment among college students that traditional journalism degrees are not particularly marketable. For many students, college is simply a means to an end—finding desirable employment (Steffen, 2014). This trend can only be expected to continue, as Generation Z students, who will soon comprise the majority of undergraduate students, are even more pragmatic and financially minded (Williams, 2015). One of the primary tasks for journalism and mass communication programs, therefore, will be to demonstrate the value and applicability of a journalism degree, as well as provide evidence of career opportunities in this field. For example, programs may benefit by continuing to evaluate and update their curriculum and embrace the converging media landscape where multimedia and cross-platform journalism have increasing relevance (Boudreaux, 2016).
To that end, our findings are not all bad news. Whereas traditional journalism enrollments continue to decline, we found a notable spike in strategic communication undergraduate enrollments. Public relations, in particular, appears to be thriving. This is evidence that today’s students may have an easier time seeing the applicability and viability of a strategic communication degree for employment.
Perhaps related to this increase in enrollment in strategic communication sequences is an increase in the number of women pursuing degrees in journalism and mass communication. The field of journalism and mass communication continues to attract more women than men—about two thirds of undergraduate students are women. Indeed, the gap between female and male students has only widened since 2013. Perhaps this growing disparity is related to the increasing dominance of strategic communication sequences—sequences that women are more likely than men to pursue (McMillan, 2016).
Additional survey results provide other reasons for optimism. Online courses appear to offer another area of opportunity for growth among journalism and mass communication programs. Almost three fourths of programs in our sample reported offering at least one undergraduate class online. Moreover, nearly one in 10 programs reported offering an online bachelor’s degree. Online classes are likely to continue to grow, and they are also likely to appeal to Generation Z students who increasingly seek out the opportunity to take classes online, both as digital natives and as individuals who are more practical and financially minded than millennials (Levit, 2015; Williams, 2015). These courses provide flexibility and have in mind the changing needs of today’s undergraduate students.
Perhaps most interesting is the growth in online degree programs, in particular the emergence of the online professional master’s degree. Not only are 15.4% of programs in our sample offering online professional master’s degrees, 6.6% are offering master’s degrees only online. In addition, a substantial portion (about one third) of professional master’s students is enrolled in online degree programs. These online and distance-learning programs are particularly valuable to those who have already entered the professional workplace but would like to pursue an advanced degree. Online opportunities are likely to become increasingly appealing as Generation Z students matriculate into higher education institutions and later enter the workforce while still pursuing graduate education.
Beyond offering more accessible and flexible courses and degree programs, there is additional evidence to suggest journalism and mass communication programs are starting to adapt to the times. Our findings on core competencies and skills suggest that many programs are offering courses that help develop the skill sets employers seek. Industry professionals have expressed interest in hiring individuals who have skills such as HTML coding, data analytics, digital design, new media literacy, visual storytelling, real-world problem solving, entrepreneurship, and diversity and cultural awareness (Bland, 2013; Heck, 2015; Stencel & Perry, 2016). To this end, a majority of programs reported teaching visual storytelling, web content production, web layout and design, media literacy, and cross-cultural communication. In addition, more than 30% of programs reported offering classes focused on data analytics and entrepreneurship.
Furthermore, in regard to the need for problem solving in the real world, most programs provide infrastructure for student-run media and offer internship credit. A majority of programs have student-run newspapers, radio stations, and TV stations, and more than a third have magazines and advertising or public relations agencies, but there is still room for growth with regard to the latter. Student-run agencies can provide an invaluable experience, helping to further develop students’ technical and analytical skills, thereby making them more desirable on the job market (Busch & Struthers, 2016). It was also notable that more than 10% of programs reported having student-run online publications or websites, which we expect will continue to become more prevalent. In addition, among the programs that indicated whether they offer internship credit opportunities, a majority of programs actually require internship credit, at least for some sequences.
The findings discussed above should be interpreted in light of the sample, which comprises only 182 of the 474 programs in the population. In addition, the Annual Survey of Journalism and Mass Communication Enrollments was not conducted in 2014, leaving a gap in the trends reported here. Finally, we are not yet able to report trends pertaining to the new items focused on curriculum and student development as they started with this iteration of the survey. As journalism and mass communication programs continue to find their way amid broad changes in the professional world and the academy, these new items should provide a valuable foundation for examining how programs continue to adapt and evolve.
Footnotes
Acknowledgements
Special thanks are given to the Association of Schools of Journalism and Mass Communication and Dr. Lee Becker for their helpful advice and feedback in preparing and conducting the survey. Special thanks are also given to the following Texas Tech University graduate students for their help in administering the survey: Georgia Ann Kapusta, Amber Krause, and Bailey Thompson.
Declaration of Conflicting Interests
The author(s) declared no potential conflicts of interest with respect to the research, authorship, and/or publication of this article.
Funding
The author(s) disclosed receipt of the following financial support for the research, authorship, and/or publication of this article: Funding for the 2015 Survey of Journalism and Mass Communication Enrollments was provided by the Association of Schools of Journalism and Mass Communication (principal sponsor) and the Association for Education in Journalism and Mass Communication (supporting sponsor).