




Abstract
This study examines reliability reporting in content analysis articles (N = 672) in three flagship communication journals. Data from 1985 to 2014 suggest improvements in reporting across time and also identify areas for additional improvement. Data show increased reporting of chance-corrected reliability coefficients and reporting reliability for all study variables, although increases were inconsistent among journals and the most recent time period showed slight declines. In general, the most often used coefficient was Scott’s Pi; however, Krippendorff’s Alpha was most used in the latest study period. Reporting of low reliability coefficients increased but then decreased most recently. Implications and areas for improvement are discussed.
Many scholars, editors, and manuscript reviewers would argue that failure to assess coding reliability is a “fatal flaw” in content analysis research. Establishing reliability helps readers evaluate the validity of data, as high reliability is a necessary, albeit insufficient, condition for validity, and provides a better basis for replicating a study (Riffe, Lacy, & Fico, 2014). There is evidence that reliability reporting may be improving. Lombard, Snyder-Duch, and Bracken (2002) and Snyder-Duch, Bracken, and Lombard (2001) found the percentage of studies assessing reliability was 69% for 200 content analysis articles indexed in Communication Abstracts during the 1994-1998 period. Riffe et al. (2014) reported that 74% of 80 Journalism & Mass Communication Quarterly (JMCQ) content analyses published between 1998 and 2004 provided reliability assessments. More recently, Lovejoy, Watson, Lacy, and Riffe (2014) found that 76% of 581 content analyses in JMCQ, Journal of Communication (JoC), and Communication Monographs (CM) reported coding reliability assessment of some kind.
However, even if these data points reflect a trend toward increased reliability reporting, the adequacy of the reporting may be problematic. To describe a study’s overall reliability, for example, one should report reliability statistics for each variable. However, Riffe et al.’s (2014) analysis of JMCQ found only 54% of studies provided test results for all variables “or at least provided the range of results for the relevant variables” (p. 122). Although their focus was primarily on reliability sampling procedures, Lovejoy et al. (2014) noted that only 27% of content analyses in their study included reliabilities for all study variables (only a third explicitly described the reliability sample). In addition, reports should include reliability coefficients that take chance agreement into consideration (Krippendorff, 2013a; Riffe et al., 2014). Yet, Riffe et al. found fewer than half (46%) of 1998-2004 JMCQ content analyses reported coefficients that correct for chance. Lovejoy et al. also found chance-corrected reliability coefficients in fewer than half (49%) of the content analyses they examined.
Although multiple studies have analyzed reporting of intercoder reliability in published content analyses (Feng, 2015; Lombard et al., 2002; Lovejoy et al., 2014; Pasadeos, Huhman, Standley, & Wilson, 1995; Riffe & Freitag, 1997; Riffe et al., 2014; Snyder-Duch et al., 2001), most were purely descriptive, using small samples, limited time periods, and limited numbers of journals. In addition, with one exception (Lovejoy et al., 2014), no published study examined changes in reliability reporting of published content analyses over time, and Lovejoy et al. (2014) examined reliability sampling procedures but did not characterize trends in reporting reliability coefficients for study variables, as will be presented in this study. The literature lacks an expansive, longitudinal examination of how reliability assessment is reported in major communication journals.
This study examines the recent history of reliability coefficient reporting in the three flagship journals of the Association for Education in Journalism and Mass Communication (AEJMC), the International Communication Association (ICA), and the National Communication Association (NCA). These journals arguably represent the highest standards of research in communication. The study uses a census of two journals and a representative sample of the other from 1985 to 2014 to assess recent and current reliability statistic reporting (e.g., percentage of simple agreement and reliability coefficients), acceptable level of agreement, and whether coefficients were reported for every variable in the study, as well as how reporting practices have changed over time. This investigation will illuminate trends in reliability reporting, identify reporting practices that may require remediation to enhance the scientific rigor of content analysis methodology, and may inform future conversations about what the field’s standards should be.
Literature Review
Agreement and Reliability Coefficients
Content analysis intercoder reliability assessments summarize the extent to which two or more coders, applying the same measurement tool (coding protocol) classify content units into the same categories. Such classification should employ trained coders applying a well-tested coding protocol with rules “that bind the researchers in the way they define and measure the content of interest” (Riffe et al., 2014, p. 98). Because of the importance or replication in social science, reliability must be vested in the protocol, which makes it possible for coders other than the original set to create reliable and valid data from the same protocol (Lacy, Watson, Riffe, & Lovejoy, 2015).
Assessments of reliability have ranged from percentages of observed agreement (e.g., a pair of coders made identical classifications in 90% of trials) or what is labeled “simple agreement,” to reliability coefficients that take into account the possibility of what represents false agreement among coders. The concept of “false agreement” merits comment. A false agreement is an agreement reached by coders that did not result from the application of a protocol by trained coders. Consider a content unit and a variable with categories A, B, and C. Although the protocol may clearly indicate that the unit should be classified as an “A,” it is possible for two coders to misapprehend or misapply the protocol and both misclassify it as a “C.” Their “agreement” is invalid according to the protocol, and thus false. It is an agreement that another set of coders probably would not reach because it resulted from something other than applying the protocol consistently. Zhao (2012) called this “erroneous agreement” but did not emphasized its connection to the protocol.
Holsti (1969) noted that simple agreement can overestimate reliability because as the number of coding categories for a variable declines, the likelihood increases that assignment of a content unit to the same category by coders could occur by “chance.” The use of the term “chance” is unfortunate because such false agreements are not necessarily the results of random behavior (Gwet, 2008; Riffe, Lacy, & Fico, 2005). Although false agreements could be due to chance decisions by coders when applying the protocol, coders rarely randomly assign content to categories within variables if protocols contain adequate coding instructions and sufficient training has occurred. False agreements are more likely to result from poor or limited training, the lack of a common frame of reference, language skill differences among coders, and so on (Riffe et al., 2014).
Moreover, such false agreements are more serious that disagreement errors because false agreements cannot be detected or differentiated from protocol-based agreements and because false agreements have a high probability of creating data with validity problems. The fact that they cannot be detected is the reason scholars have argued that reliability is not the same as agreement (Cohen, 1960; Gwet, 2014; Krippendorff, 2013a; Riffe et al., 2014; Scott, 1955) and why reliability measures must adjust for “expected agreement” or “chance.”
Although the present study and Feng’s (2015) data show continued use of simple agreement, most scholars agree that relying on simple agreement alone is inadequate for assessing reliability (Cohen, 1960; Gwet, 2014; Krippendorff, 2013a; Riffe et al., 2014; Scott, 1955). Zhao (2012) argued that simple agreement is a better measure of reliability than reliability coefficients that use probability for adjusting for false agreements. Some scholars have called for reporting simple agreement along with a reliability coefficient (Lacy et al., 2015; Riffe et al., 2014) as a way of providing more information to evaluate whether reliability is sufficient and to assist with replication.
Regardless of one’s position on reporting simple agreement, debate persists on which reliability coefficients are optimal (Gwet, 2008; Krippendorff, 2004b; Krippendorff, 2013b; Lombard, Snyder-Duch, & Bracken, 2004; Zhao, 2012; Zhao, Liu, & Deng, 2012). Existing reliability coefficients aim to estimate false agreement using either the distribution of agreements and/or disagreements to calculate “expected agreement,” which is supposed to adjust for false agreement. It is the variations in how the coefficients estimate this expected agreement, and the assumptions that go with these variations, that contribute to the debate as to which reliability coefficient is superior. Although as many as 18 “chance adjusted” coefficients (Zhao et al., 2012) have been used in content analysis studies, data presented below indicate that communication studies tend to report one of three coefficients—Scott’s (1955) pi, Cohen’s (1960) Kappa, and Krippendorff’s (1980) Alpha. Some scholars (Gwet, 2014; Zhao, 2012; Zhao et al., 2012) suggest these three are basically variations on the same formula.
However, Krippendorff (2013a) argued that Alpha is a more useful coefficient than others because it adjusts for small sample sizes and can be used with more than two coders and all levels of measurement (nominal, ordinal, interval, and ratio). He criticized Kappa as being insensitive to small sample sizes and for how its expected disagreements are calculated, and noted that Kappa will be higher than Alpha when the marginal sums of the contingency tables are unequal. He summarized the difference: “K overestimates reliability when coders have unequal proclivities for coding categories” (Krippendorff, 2013a, p. 304). However, when the coders’ “proclivities” are equal, Kappa and Alpha are roughly the same. Zhao et al. (2012) argued that Alpha favors small samples and, compared with other coefficients, creates smaller reliability coefficients, all else being equal, as sample sizes increases. Krippendorff (2013a) responded that Alpha corrects for biases that exist in coefficients such as pi when samples are smaller.
Another controversy involves Alpha, Pi, and Kappa and the fact that they can produce very low coefficients even when levels of simple agreement are high (Feng, 2015; Gwet, 2008; Zhao et al., 2012), which can occur when data distributions are skewed (e.g., most of the coded units are in one category; see Riffe et al., 2014). Krippendorff (2013b) labeled this “insufficient variation” (p. 319), writing that such data “. . . cannot be correlated with anything either, their analytical meanings are largely void, and they cannot convey sufficient information from the analyzed text to the research question” (p. 320).
That conclusion seems to ignore the fact that there have been, and will continue to be, populations with skewed distributions of categories that are nonetheless important to study. For example, Robinson and Anderson (2006) studied portrayal of older characters in animated children’s television. Only 8% of characters were older and of these 107 characters, only1% were African American. The authors reported simple agreement to assess reliability. Monk-Turner, Heiserman, Johnson, Cotton, and Jackson (2010) found only 5% of primetime TV characters were Hispanic and fewer than 2% were Asian American. As with Robinson and Anderson, the article reported only simple agreement. The authors do not report why they did not provide chance-corrected reliability coefficients, but it may be because of the skewed distribution phenomenon.
Addressing the phenomenon, Potter and Levine-Donnerstein (1999) argued that expected agreement should be calculated by using the normal approximation to the binomial distribution (rather than using the formulas for Pi, Alpha, and Kappa). However, this approach does not address any role of the protocol in disagreements and false agreements.
More recently, Gwet (2008, 2014) developed coefficient AC1 for interrater agreement in health diagnoses. He reasoned that not all decisions are of equal difficulty, and AC1 divides decisions into hard-to-score and easy-to-score. Gwet (2014) found that AC1 results in coefficients that are lower than simple agreement but higher than Alpha, Kappa, and Pi. Krippendorff (2013b) has criticized AC1 as difficult to interpret, a charge echoed by Ejima, Aihara, and Nishiura (2013).
If one accepts the need to adjust for false agreements, it appears that among the most commonly used coefficients, Alpha has advantages over Pi and Kappa but that AC1 can provide a possible substitute when skewed data distributions result in simple agreements that are significantly larger than the reliability coefficients. However, determining whether AC1 is an acceptable general replacement for Alpha, Kappa, and Pi is beyond the scope of this study. Gwet (2008, 2014) has run Monte Carlo studies comparing coefficients, and Zhao (2012) ran an experiment using lengths of lines to test coder agreement. However, these studies have not included the use of content protocols to guide coding of symbolic content. The call for further empirical study (Zhao, 2012) should be taken up by scholars. Until such studies help resolve the debate, we agree with Riffe et al. (2014) and Lacy et al. (2015) that articles report Alpha, simple agreement, and AC1 when data are skewed. Because the argument against Alpha, Pi, and Kappa is that they tend to underestimate “true” reliability (Gwet, 2014; Zhao, 2012; Zhao et al., 2012), using a more “strict” measure, such as Alpha, helps to guard against confirmation bias in content analysis.
Number of Variables
Even researchers who report reliability occasionally do so in problematic ways. Feng (2015) examined articles in four journals between 1980 and 2011, including JMCQ and JoC: “(S)ome presented reliability for each variable while some just gave one single value by collapsing variables into one. Some of them did not report an exact value, but a range” (p. 8). In a study of 1998-2004 content analyses in JMCQ, Riffe et al. (2014) found “only 54% of the studies provided the test results for all variables or at least provided the range of results for the relevant variables” (p. 122).
Reporting an “average” or range of coefficients is problematic because variables with low levels of reliability can be “masked” (Riffe et al., 2014). Consider a reported average of .85 among three Scott’s pi coefficients of .85 + .85 + .85 would generally be acceptable, but an average based on pi coefficients of .95 + .95 + .65 includes one problem variable. Hiding variables with weak reliability prevents reviewers and readers from properly evaluating the reliability and, therefore, validity of individual variables, as reliability is a necessary precursor of validity.
More practically, replication in research requires that researchers be able to evaluate each of the measures used originally. If the same measures are used, reliability coefficients from the original study can help clarify variation in results between the original and the replication. Just as publication of questionnaire data that measure latent variables requires reporting of each scale’s reliability (e.g., Cronbach’s Alpha), a similar standard should apply for content analysis variables.
Acceptable Reliability Levels
But if one chooses Scott’s pi, Krippendorff’s Alpha, Cohen’s Kappa, or another content analysis reliability coefficient, how high is “high enough”? This is not an easy question because different types of content variables fall on a continuum from easy to difficult. But coding difficulty is a function of a variety of factors (Riffe et al., 2014). These include the nature of the variable (e.g., valence toward a person or classifying content units into categories such as topic), the quality of the content (e.g., adherence to grammar and syntax standards), the quality of the protocol (e.g., adequate guidance for coders), and the quality of coder training (e.g., coders’ ability to apply the protocol consistently).
Riffe et al. (2014) divided content units into physical and meaning. The former involve “mechanical” measurement of discrete units such as minutes, square inches, and numbers of television programs. “Meaning” content units carry semantic meanings, such as types of sources quoted in a news article or tone toward a candidate. Measuring physical units is straightforward and should yield high levels of reliability (e.g., higher than .90). Meaning units, some of which involve counting, can vary in difficulty to a greater degree than physical units.
However, the fact that coding differs from one variable to the next does not automatically call for lower minimum levels of reliability for some variables. First, the difficulty of coding certain types of variables can be compensated for by improving the protocol or better coder training. Second, the generally accepted levels (discussed below) are in fact not particularly high. As Krippendorff (2004a) said,
Even a cutoff point of α = .80—meaning only 80% of the data are coded or transcribed to a degree better than chance—is a pretty low standard by comparison to standards used in engineering, architecture, and medical research. (p. 242)
But what should be the minimum acceptable levels for reliability coefficients? Some scholars offer tentative guidelines. Wimmer and Dominick (2003) estimated that most published content analyses report coefficients of .75 or above when using pi or Alpha. Riffe et al. (2005) recommended reliabilities in the .80-.90 range because most published content analyses they examined reported .80 or higher. Neuendorf (2002) described the Riffe, Lacy, and Fico (1998) .80-.90 prescription as “a relatively high standard” (p. 143).
Kaid and Wadsworth (1989) noted that “researchers can usually be satisfied with coefficients over +.85, while those below +.80 should be suspect” (p. 209). Yet, Krippendorff (1980) described a study in which he reported variables with Alphas above .80 and in which he used Alphas between .67 and .8 “for drawing highly tentative and cautious conclusions,” a rule of thumb that “might serve as a guideline elsewhere” (p. 147).
Riffe et al. (2005) stated that their .80-.90 range also is “appropriate for Scott’s Pi with nominal data and a large sample” (p. 151). But Wimmer and Dominick (2003) suggested .75 as the minimum for pi and Alpha. Popping (1988) called for minimum values of .80 for Kappa though Bannerjee, Capozzoli, McSweeney, and Sinha (1999) proposed a minimum Kappa of .75.
Having reviewed various coefficients, Neuendorf (2002) concluded that simple agreement levels of 90% or higher are absolutely acceptable and simple agreement levels of 80% or higher should be acceptable for most variables; chance-corrected statistics, such as Pi and Kappa, “are afforded a more liberal criterion” (p. 143).
Although these “rules of thumb” (Neuendorf, 2002, p. 143) may be useful and easily remembered, they clearly acknowledge and accept a certain amount of unreliability and, therefore, error, in coding—80% is not, obviously, 100%, and .8 is not 1.0. As with all scholarly rules of thumb, research needs to examine the relationship between reliability levels and the validity of conclusions from the data. At what reliability level does the conclusion drawn from the data create invalid conclusions?
Research Questions
Six research questions were proposed, exploring the frequency and type of reliability assessment in content analyses of communication content published in three leading communication research journals. For each research question, variations across journals and time periods will be evaluated.
Method
A content analysis was used to systematically examine representative samples of issues of three major communication research journals drawn from a 30-year period (1985-2014): CM, published on behalf of the NCA; JoC, published for the ICA; and JMCQ, a journal of the AEJMC. All publish quarterly issues, although JoC expanded to six issues a year in 2011 and include multiple articles in each issue. As flagship journals for the largest three communication associations, these journals likely carry research of high quality, if not the highest quality. Limiting the study to these three also made the coding manageable.
Each sampled issue of the three journals was screened by two coders to determine which articles qualified as content analysis, using the following four criteria:
At least some data analyzed for the article were obtained by examining existing content (mediated or interpersonal) or content created specifically in response to experimental stimuli. Other noncontent data can be used in the article, and it still is classified as a content analysis article (e.g., an agenda-setting study matching content data with survey data).
The content must be divided into discrete measurement units to assign numbers for quantitative analysis (i.e., a historical, legal, or qualitative study, or essay, based on a reading of all texts that include a key term, is not a content analysis).
The content data do not have to have been collected by author(s) for the article to count as a content analysis article (e.g., analyses of previously collected content data would qualify).
The content analysis must deal with the assignment of data based on meaning of the symbols. For example, a study that measures the square inches of “city” content on a website would qualify because the content being measured is defined by the meaning associated with the names of particular cities. Measurement of all advertising space or text space in a newspaper is independent of meaning and would not be a content analysis.
Initial examination of the articles thus identified revealed that JMCQ carried a considerably larger number of content analysis articles than the other journals. Thus, while all content analysis articles from CM (n = 153) and JoC (n = 193) in the 30 years were included, two issues per each of the 30 years were randomly selected from JMCQ, with the 60 issues yielding 326 JMCQ content analysis articles.
The reliability of the identification screening was tested. The 60 sampled issues of JMCQ included 985 total articles. Krippendorff’s Alpha was .92 (simple agreement = 97%) for inclusion of JMCQ’s 326 content analyses, .83 (simple agreement = 95%) for JoC’s 193 content analyses (from 1,233 total articles), and .88 (simple agreement = 96%) for CM’s 153 content analyses (from 708 total articles).
The 1985-2014 period represented years during which three major content analysis texts (Krippendorff, 1980, 2004a, 2013a; Neuendorf, 2002; Riffe et al., 1998, 2005, 2014) were introduced and/or revised. All three encourage use of reliability coefficients that consider chance agreement. Krippendorff’s first edition was published in 1980, but because texts are not universally adopted immediately, 1985 was selected as the starting point. Reliability in content analyses was examined through 2014 to provide data on the most current practices.
A coding protocol and variable definitions (available on the JMCQ website) were refined through several rounds of training, practice sessions, and test coding by three of the study’s authors on randomly selected articles not used in the study but drawn from the three journals. After protocol modifications, two coders (one author who helped develop the protocol and one author who did not) performed three pilot checks (n = 20, 17, and 10 articles, respectively), again using randomly selected articles from all three target journals not in the sample; simple agreement exceeded 82% for all variables in all three pilot tests, a level deemed sufficient to begin coding the sample.
Then, the same two coders each independently coded half the 672 sampled study articles, with articles stratified by journal and randomly assigned. To assess intercoder reliability of the protocol for the actual study sample, the two coders double-coded 114 articles randomly chosen (JMCQ = 50, JoC = 38, CM = 26) on the basis of the Lacy and Riffe (1996) formula for reliability sample size (assuming 95% probability and a 90% agreement level in the population). Final reliability coefficients were judged to be acceptable with all variables above .85 chance-corrected coefficient (Kaid & Wadsworth, 1989; Neuendorf, 2002; Riffe et al., 2005) and are reported below. To illustrate the similarities discussed above between three commonly cited chance-corrected reliability coefficients, we present reliability using Alpha, Pi, and Kappa. In addition, we include simple agreement reliability figures.
Simple agreement reported (Alpha = .860, Pi = .859, Kappa = .860, simple agreement = 93.0%): Was a simple agreement reliability coefficient reported in the article? Simple agreement is sometimes called “Holsti’s formula” or “Holsti’s reliability coefficient.” If the term reliability coefficient was used without a specific label (Scott’s Pi, Krippendorff’s Alpha, etc.), it was coded as simple agreement.
Type of reliability measure (Alpha = .886, Pi = .885, Kappa = .886, simple agreement = 92.1%): Were coefficients reported that correct for chance and which (Scott’s Pi, Krippendorff’s Alpha, Cohen’s Kappa, Gwet’s γ, Benini’s β, Guttman’s ρ, etc.) was reported for the “final” (nontraining, nonpilot) reliability test? These coefficients had to be explicitly identified by name or by an explanation of how chance agreement and the coefficient were calculated.
Reliability coefficients reported for all study variables (Alpha = .852, Pi = .851, Kappa = .851, simple agreement = 90.4%): Was a reliability coefficient reported for each variable (in the text, tables, endnotes, footnotes, or appendixes)? Variables that involve transcription, such as title, page number, date, and so on, did not have to have a reliability measure reported, but all variables that involve the meaning of symbols did.
Levels of reported reliability coefficients (Alpha = .917, Pi = .917, Kappa = .917, simple agreement = 93.9%): What was the lowest chance-corrected reliability coefficient reported? If only one reliability coefficient was reported, this was recorded as the lowest coefficient. For analysis, these values were recoded into mutually exclusive categories (e.g., lowest reported coefficient was <.70, was between .70 and .79, or was ≥.80, etc.).
Fewer than 6% of all articles reported Pearson product–moment correlations as reliability statistics. Krippendorff (2013a) argued that tests of association, such as Pearson’s r, are not equivalent to tests of agreement. Correlations can be fairly high and still have a high percentage of actual disagreements. For example, if two coders analyze 10 content items using a 5-point scale, it is possible to have zero agreement but a 1.0 Pearson’s correlation because a correlation deals with consistent patterns in data and not agreement. However, Riffe et al. (2014) argued that correlations can be appropriate with physical variables, such as number of words, sentences, or paragraphs, that are “mechanical” in their recording, and did not involve interpreting symbolic meaning. Because the appropriateness of using correlation was not always obvious in the study articles, it was treated as a reliability coefficient in some of the analysis, which admittedly represents a liberal interpretation of its use as a reliability coefficient.
Data Analysis
To analyze the trend across time and by journal, the percentage of articles that contained a given variable (type of reliability coefficient, etc.) was calculated for each year and journal. To answer all research questions except
Visual examination of the data did not suggest curvilinear relationships between time and any dependent variable, though sample size precluded formal tests of these relationships (e.g., quadratic or cubic effects of publication year). To account for variability in the number of content analysis articles in a given journal per year, we conducted all regression analyses controlling for this variable and results were unchanged (data not reported). We thus report findings from univariate OLS regression for
The data were tested for violations of regression assumptions. First, all variables had skewness of less than 1, except for percentage of articles with coefficients below .7, and percentage with one or more coefficients between .7 and .79. Both had one outlier case (defined as more than 3 standard deviations from the mean); the outliers were reassigned the value of the largest case below 3 standard deviations from the mean. The skewness measure became 1.09 for coefficients between .7 and .79 and 1.37 for coefficients below .7. The data met all other tests.
Because years were used, Durbin–Watson tests were run for the regression equations. The Durbin–Watson coefficients for each regression, identified here by the dependent variable in each, were the percentages of (a) articles with reliability coefficients—1.29, (b) articles with coefficients reported for each variable—1.44, (c) articles with one or more coefficients below .7—1.76, and (d) articles with one or more coefficients between .7 and .79—1.83. The lower limit for a regression with n = 90 and three independent variables was 1.59 and the upper limit was 1.73 (Mansfield, 1987). There are no negative autocorrelations, but we cannot reject the null hypotheses that Variables 1 and 2 do not have slight positive autocorrelations.
These variations from normality for two variables and autocorrelation for two dependent variables are not major concerns. First, regression is robust for minor violations of assumptions (Chatterjee & Price, 1977). Second, assumptions about both normality and autocorrelation concern biased estimation of parameters (Bowerman, O’Connell, & Dickey, 1986). The coefficient estimates for the sample are not affected. Given that the sample was taken from 84% of the total journal issues during this period (308/368), the part correlations from the regression equation will be interpreted as suggestive for further study.
Results

Linear trend of articles reporting simple agreement by year and journal.
Percentage of Articles Reporting Reliability by 5-Year Strata and Journal.
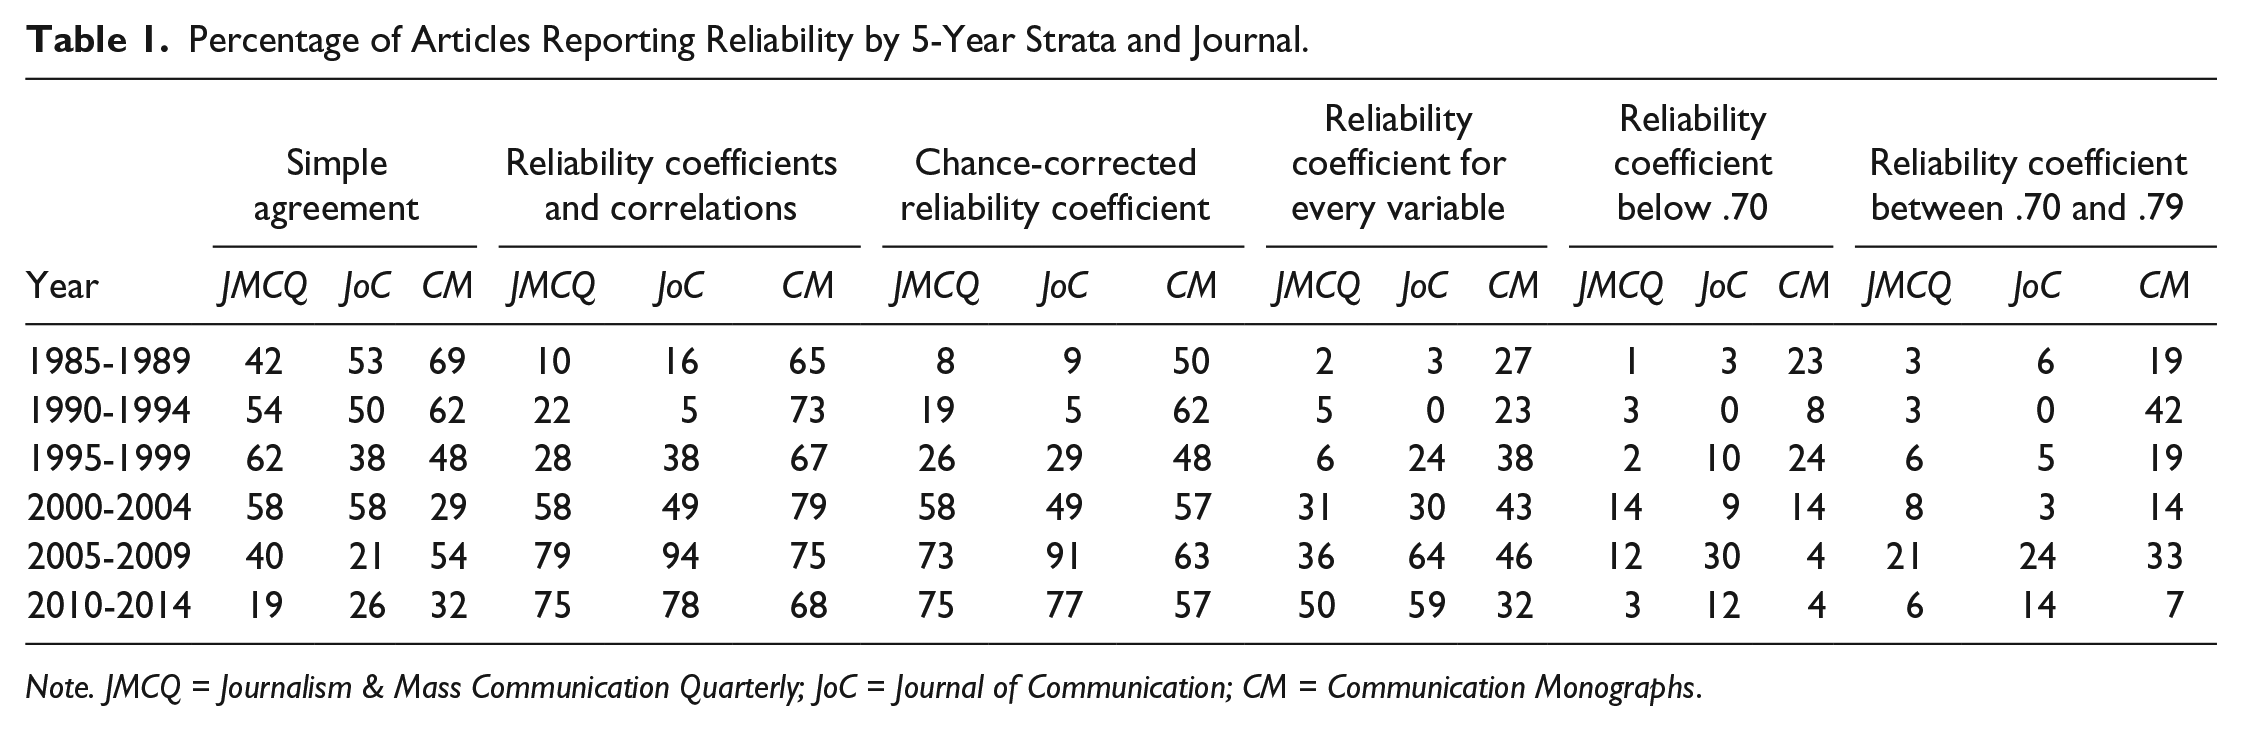
Note. JMCQ = Journalism & Mass Communication Quarterly; JoC = Journal of Communication; CM = Communication Monographs.
In fact, Figure 2 and data in columns 2 and 3 of Table 1 examine reporting of reliability coefficients during the 30-year period, further addressing
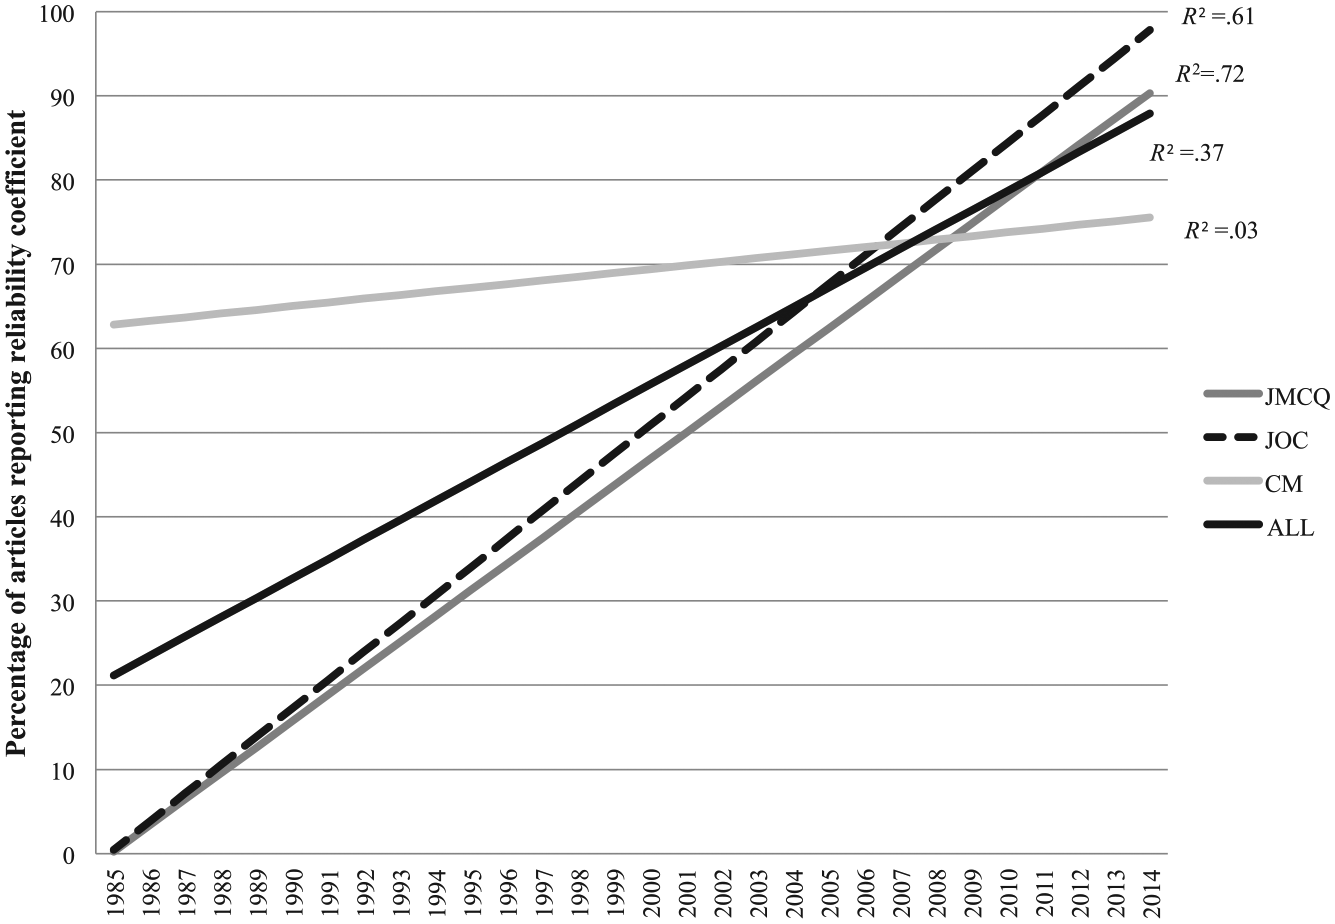
Linear trend of articles reporting reliability coefficient by year and journal.
By comparing columns 2 and 3, it becomes evident that most of the correlations used for reliability were found in CM. The percentage of CM articles during the most recent period (2010-2014) with coefficients when correlations were included equaled 68%, but when the correlations were dropped, the percentage with coefficients equaled only 57%. This pattern was clear throughout the 30 years. Few of the JMCQ and JoC articles used correlations. The researchers did not anticipate such a high concentration of correlations in one journal and did not code for whether the variables using correlations were physical or meaning units. This finding warrants additional study.
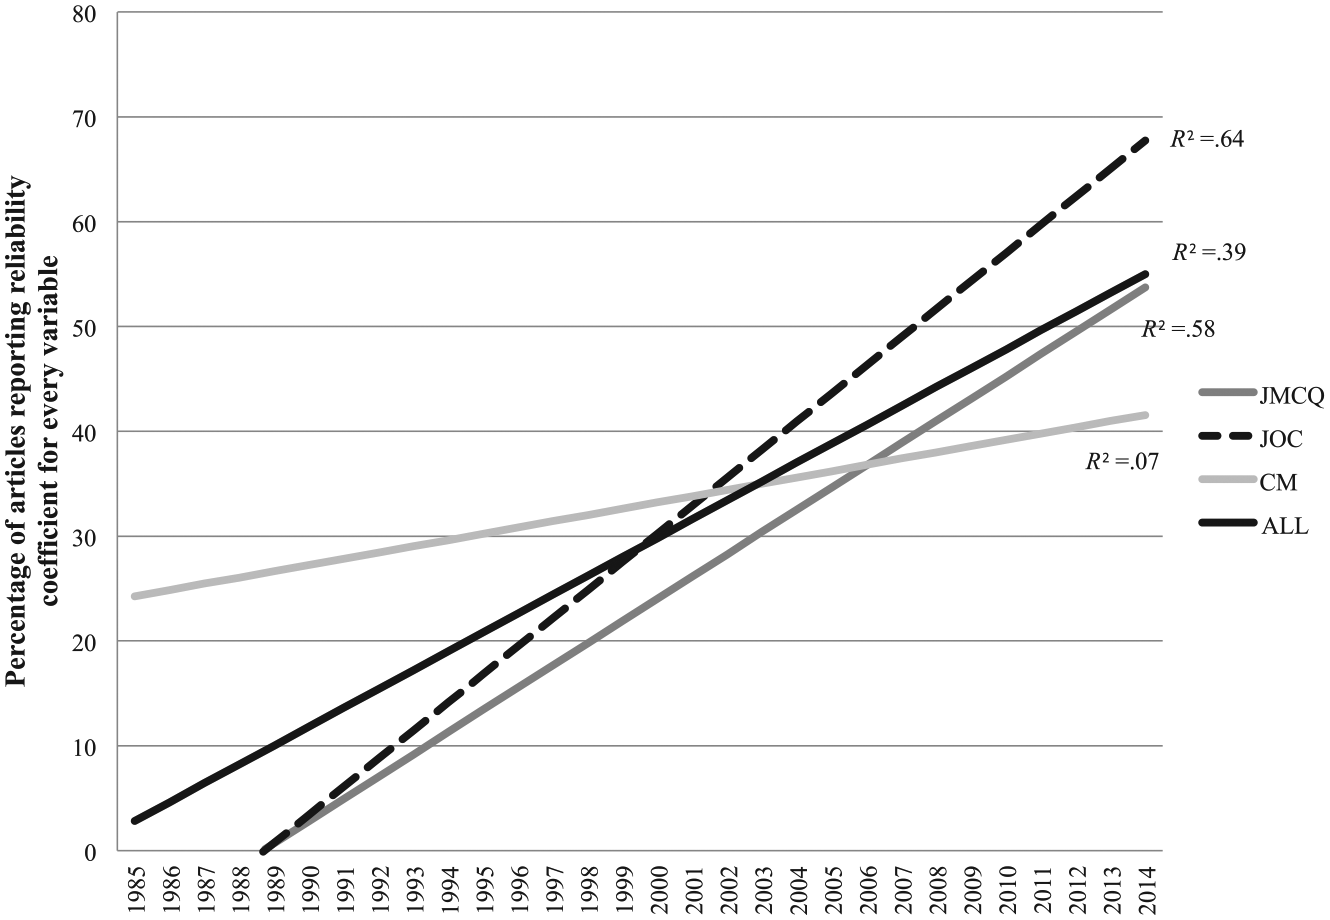
Linear trend of articles reporting reliability coefficient for every variable by year and journal.
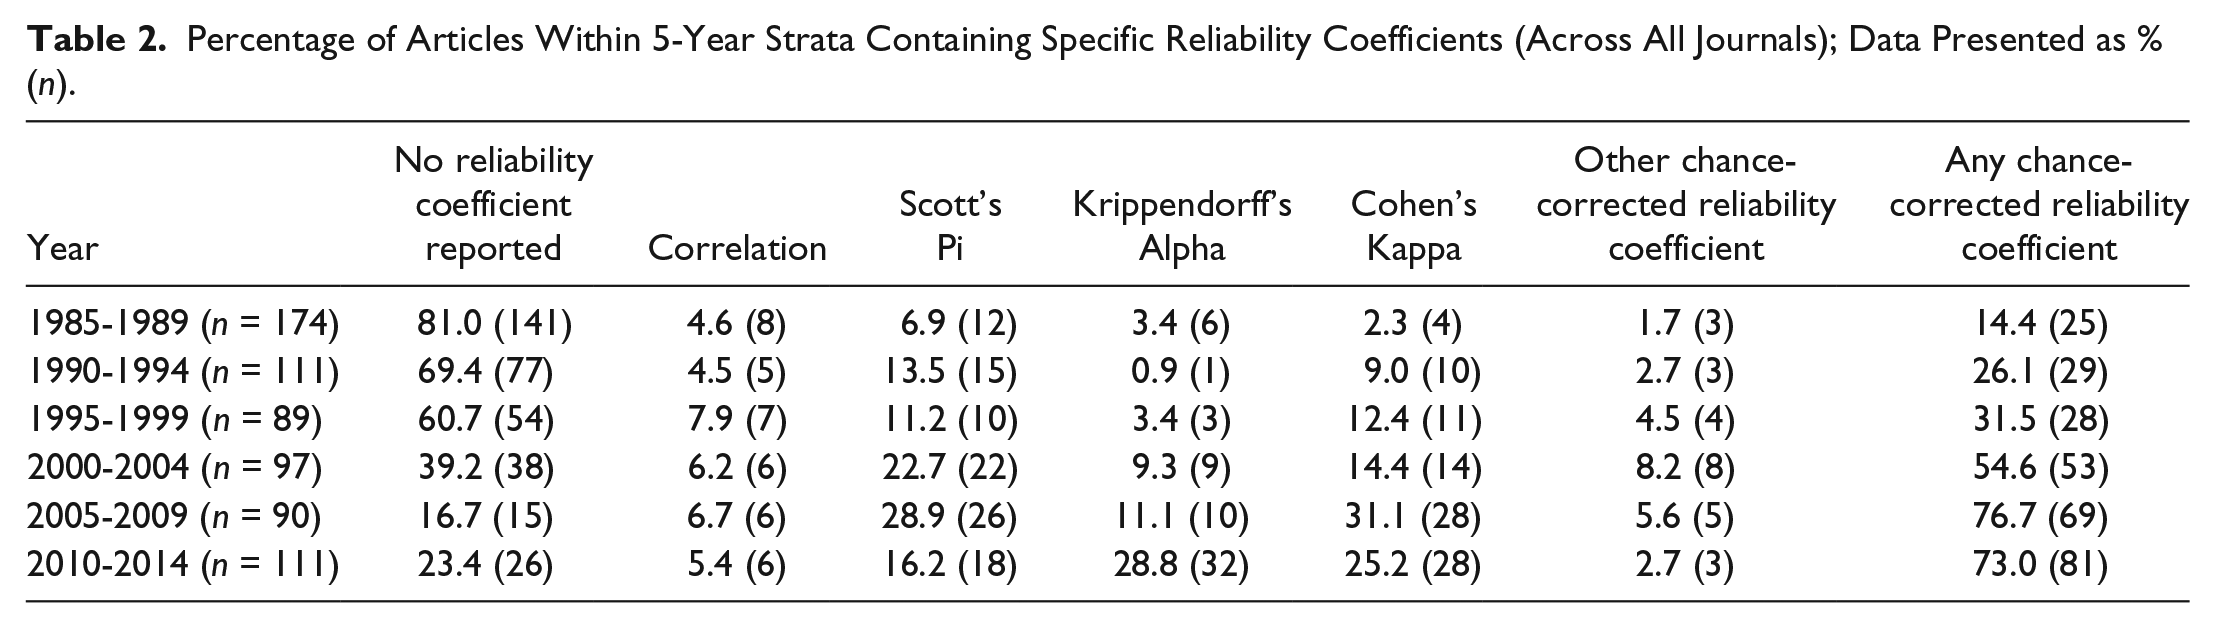
Percentage of Articles Within 5-Year Strata Containing Specific Reliability Coefficients (Across All Journals); Data Presented as % (n).
Because scholars (Kaid & Wadsworth, 1989; Popping, 1988; Riffe et al., 2005) suggest that reliability coefficients below .80 can be problematic,

Linear trend of articles reporting reliability coefficients between .70 and .79 by year and journal.
In summary, the three journals contained a modest percentage of articles with problematic reliability coefficients between .7 and .79, although with considerable variance. These reporting practices across all journals appeared to peak from 2005 to 2009. No journal, however, exhibited growth in the percentage of such articles over time.

Linear trend of articles reporting reliability coefficients below .70 by year and journal.
Part Correlations and Unstandardized Regression Coefficients for Independent Variables Associated With Percentage of Articles With a Given Reliability Characteristic (n = 90).
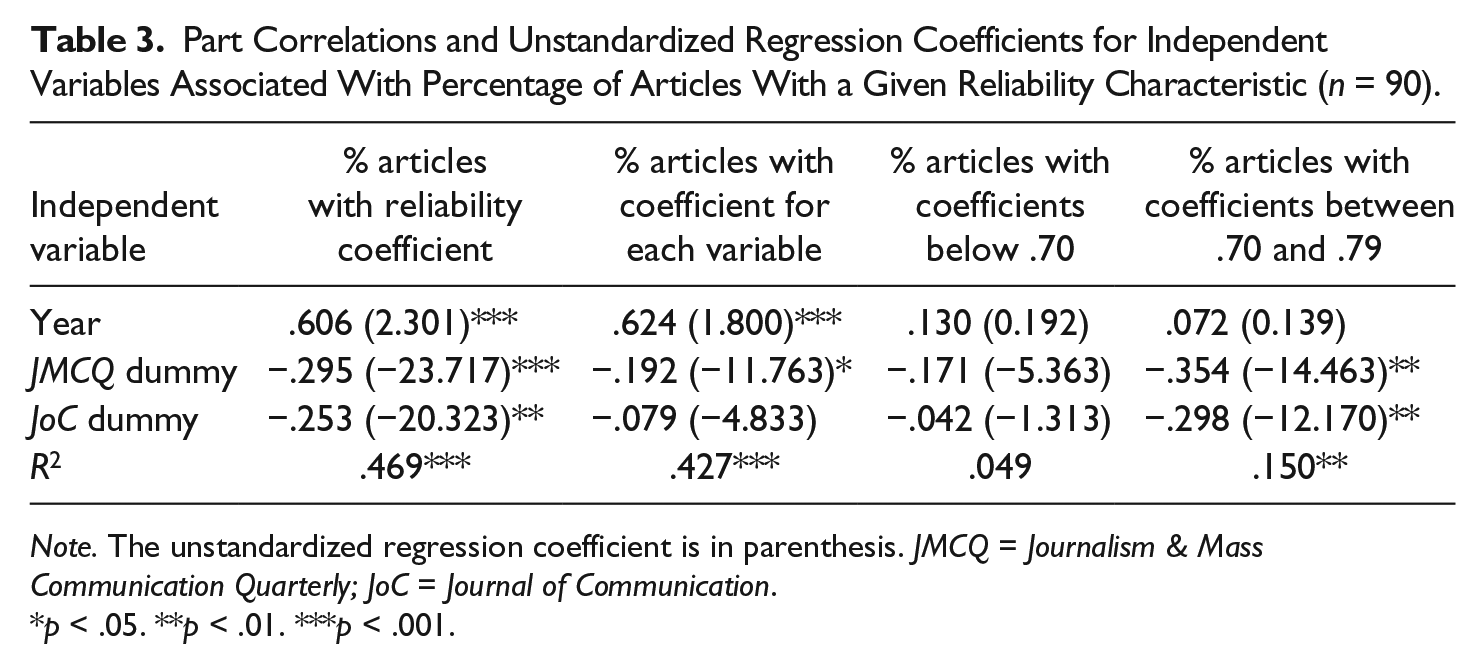
Note. The unstandardized regression coefficient is in parenthesis. JMCQ = Journalism & Mass Communication Quarterly; JoC = Journal of Communication.
p < .05. **p < .01. ***p < .001.
Journal was also related to the percentage of articles reporting reliability coefficients and the percentage of articles reporting coefficients for all study variables. After controlling for publication year, JMCQ, relative to CM, published a lower percentage of (a) articles that reported reliability coefficients (semipartial = −.295, p < .001), (b) articles that reported coefficients for each study variable (semipartial = −.192, p = .021), and (c) articles with coefficients ranging from .70 to .79 (semipartial = −.354, p = .001). Similar patterns, but slightly smaller associations, were found with JoC. Relative to CM and after controlling for publication year, JoC published a smaller percentage of articles that (a) reported reliability coefficients (semipartial = −.253, p = .002) and (b) reported reliability coefficients between .70 and .79 (semipartial = −.298, p = .004).
Discussion
This content analysis of content analyses investigated reporting of coding reliability coefficients in the flagship journals of the three largest communication associations (AEJMC, NCA, and ICA). Data not only suggest improvements in reporting across time, but also identify areas for additional improvement. On the positive side, the percentage of articles in the journals that reported reliability coefficients suggests that reporting chance-corrected reliability coefficients should continue to improve with time.
However, the rate of increase varied across the study period, and by the 2010-2014 period, 23% of the JMCQ articles, 25% of the JoC articles, and 32% of the CM articles did not include a chance-corrected reliability coefficient, though content analysis reference works published during this study’s 30-year time frame suggest that every content analysis reliability check should use chance-corrected coefficients (Krippendorff, 2004a, 2013a; Lacy & Riffe, 1993; Neuendorf, 2002; Riffe et al., 1998, 2005, 2014).
The relatively extensive use of Pearson’s product–moment correlation within CM articles raises some concerns. Krippendorff (2013a) rejected the use of correlations. Riffe et al. (2014) argued that it is acceptable when physical units such as minutes and square inches are coded. Exploring the type of variable evaluated with correlations was beyond the scope of these data.
In addition, the percentage of articles not reporting a reliability coefficient for each variable was worrisome, even though the percentage doing so increased during the 30 years. During 2010-2014, only 50% of JMCQ articles, 59% of JoC articles, and 32% of CM articles reported reliability coefficients for each variable. Failure to report a reliability figure for each variable may allow findings that may be tenuous—due to low reliability on a given variable—to appear stronger than they are. In addition, future researchers may erroneously replicate variables that did not reach acceptable levels of reliability but were “masked” by an average or range of coefficients. Reliability reporting for each variable is essential in identifying valid analyses and warrants table or endnote space, at minimum.
While the reporting of chance-corrected reliability coefficients increased during this 30-year time period, the use of Pi, Kappa, and Alpha varied across time. The most often used coefficient during the 2010-2014 period was Krippendorff’s Alpha (28.8% of the articles) and the second was Cohen’s Kappa with 25.2%. However, use of pi declined during the 2005-2014 period from 28.9% to 16.2%. The growth of Alpha may reflect its flexibility and the fact that an SPSS macro was published to make calculation easier.
Although the presentation of data differed between this study and Feng’s (2015), the descriptive results of the studies are generally consistent. However, while Feng referred to trends across time, he did not provide statistical analyses of those trends, nor did he provide statistical analyses of variation among journals.
As reporting of reliability coefficients increased, the reporting of simple agreement declined. However, during the 30 years, 36% of the JMCQ articles, 28% of the JoC articles, and 18% of the CM articles used only simple agreement to assess reliability. It is likely that some of these articles, as may be the case with two studies cited above (Monk-Turner et al., 2010; Robinson & Anderson, 2006), reported simple agreement because they involved the skewed distribution phenomenon. Exploring this relationship could yield an explanation, but not all articles report enough information to evaluate them.
Regression analyses showed a fairly strong positive relationship between year and reporting reliability coefficients and between year and reporting coefficients for each variable: As time passed, reporting became better. However, the increase was not consistent among journals. With CM as the reference group, JMCQ and JoC were slightly less likely to report reliability coefficients and one for each variable when controlling for time. Because the regression equations for these two content variables accounted for less than 50% of the variance, there are other variables that would play a role in predicting the dependent variables.
Of particular interest is the reporting of reliability coefficients with low reliability. Although there is no consensus about what level of reliability is acceptable, most texts suggest that coefficients greater than .8 are acceptable, that coefficients between .7 and .79 might be acceptable with reservations, and that coefficients below .7 should be used with extreme caution. On the basis of those guidelines, data from this study raise some concern. The percentage of articles reporting at least one chance-corrected coefficient smaller than .7 increased until 2010-2014, during which the percentage dropped considerably for JMCQ and JoC, although 12% of the JoC articles during this period had variables below .7. JMCQ had a slight negative relationship. In other words, JMCQ was less likely to publish articles with coefficients this low. This study could not detect the factors influencing the decline, but second editions of the Krippendorff (2004a) and Riffe et al. (2005) text were published before this period and both caution against use of variables with reliability below .7.
There also was an increase in the percentage of articles per year reporting coefficients between .7 and .79. The regression equation using year and two journal dummy variables accounted for 15% of variance in reporting coefficients between .7 and .79. Time was not an important variable for predicting this percentage, but the percentage declined for JMCQ and JoC compared with CM even after controlling for year. The percentage for CM remained in double digits during the period until the final 5 years (2010-2014). It varied from a high of 42% in 1990-1994 to a low of 7% in 2010-2014.
Overall, the reporting of reliability coefficients improved during the 30-year period. However, further improvement is warranted. Every content analysis article should include chance-corrected reliability coefficients for every variable included in the analysis. The use of low-level reliability coefficients needs further study to determine whether these lower levels of reliability represented truly exploratory research or a lack of diligence on the part of reviewers.
Of course, data from the present analysis cannot explain the changes found here, or how authors used particular variables in data analyses. However, the four regression equations showed that reporting a reliability coefficient and reporting a coefficient for each variable was predicted better by year than by journal, but predicting the presence of low reliability variables was predicted better by journal than by year. These results and the R2 levels suggest a study examining the causes behind reporting levels would be useful in improving reliability reporting.
The variations in use of reliability coefficients found across journals suggest two possible explanations, nature of content and training, although neither can be tested with these data. The variations might represent different levels of difficulty in coding audience-oriented communication versus interpersonal communication. Content created to serve the public usually follows routines for information gathering and models for presenting that information. For example, news writers apply a limited number of writing styles and structures, which provides a uniformity of content not found in written responses to experimental treatments. JMCQ primarily deals with public media more than JoC, which runs more articles about public media than does CM. These patterns reflect the research interests of members of the three associations.
A corollary of this argument is that variations in research training between communication doctoral programs and media/information programs could explain some of the variation among the journals. Scholarly articles and texts used in content analysis classes would typically be taken from the journals from the faculty members’ associations. As a result, the use of a particular coefficient is encouraged from one generation of scholar to another. The time period in which a scholar trained also might play a role. Older scholars might be less likely to use Alpha than scholars who graduated during the past 5 or 10 years.
In addition, the parameters for the time period suggest a possibility. The years were selected because of the publication of three content analysis texts. The adoption of any or all of these texts may have contributed to standardizing procedures in reporting reliability.
Another interesting result was the growth in the use of Krippendorff’s Alpha. Its use increased considerably from only 3.4% in 1985-1989 to 28.8% in 2010-2014. This may reflect the growing use of Krippendorff’s text, the argument by Hayes and Krippendorff (2007a) for its adoption as the omnibus coefficient, and the availability of an SPSS macro (Hayes & Krippendorff, 2007b) and online calculator (Freelon, 2013) to calculate Alpha.
As with all studies, this one has limitations. First, it involves only three journals. One would expect that the flagship journals for the largest communication associations would represent the best research, but this is itself an empirical question. If it is true that these journals publish high-quality research, what are the reporting practices of the proliferation of specialized communication journals? How do these practices relate to journals’ reputation and impact? Second, the sample included only communication journals. Other social sciences might vary in how they report reliability. This study assumes standards of reporting (both procedures and levels) that may not be universally accepted, an assumption that also suggests future study. A survey of scholars and teachers of content analysis about appropriate standards would help explain these results.
Footnotes
Declaration of Conflicting Interests
The author(s) declared no potential conflicts of interest with respect to the research, authorship, and/or publication of this article.
Funding
The author(s) received no financial support for the research, authorship, and/or publication of this article.
