
Abstract
Despite extensive research in product placement, little research has examined how different consumer groups respond to product placement. The present study aims to fill this gap, employing cluster analysis to segment U.S. consumers according to cognitive and attitudinal responses they have developed to advertising in general. Analyzing a nationally representative sample of U.S. adults (N = 21,944), this study identified five clusters. The clusters reflect varying responses to product placement on television and in movies, as well as distinct demographic and media usage profiles. These findings are discussed from the perspective of consumer socialization and marketplace social intelligence.
Keywords
Ever since Proctor & Gamble first introduced soap opera sponsorship in the 1930s, product placement has continued to grow as a distinct and effective tool for brand promotion (Newell, Salmon, & Chang, 2006). According to a recent report, worldwide expenditures for product placement totaled US$8.25 billion in 2012, up 11.7% from the previous year (PQ Media, 2012). The United States had the largest share of global product placement expenditures that year, totaling US$4.75 billion, with the market’s volume projected to grow further worldwide.
Product placement refers to the practice of incorporating a brand or a product into entertainment media content for a commercial purpose (Karrh, 1998). By placing a product in the context of a program, product placement promotes a brand and enriches the content’s plot and realism. Accordingly, consumers respond to products placed in the media content with less skepticism or irritation than to other advertising messages. This is especially true when the product is closely aligned with the content (Cowley & Barron, 2008).
Research has been conducted to assess the effects of product placement on the audience and explore the various psychological and social constructs by which such effects occur. Balasubramanian, Karrh, and Patwardhan (2006) proposed four conceptual components that frame how consumers respond to product placement: execution factors (e.g., priming), individual factors (e.g., attitudes toward the placement), processing factors (e.g., conscious/unconscious processing), and outcomes of the product placements (e.g., brand recognition, recall, attitudes changes, purchase intention). Various factors in those four components have been examined, but the role of individual characteristics has not been thoroughly examined, with a handful of exceptions (e.g., DeLorme & Reid, 1999; Gregorio & Sung, 2010), and these have not examined how groups of individuals who share similar perceptions respond differently to product placement.
The consumer socialization literature suggests that consumers learn, adjust, and reinforce their beliefs throughout their life, and such beliefs place them into socially identifiable groups with homogeneous perceptions (Moschis, 1987). This view implies that consumer groups, if segmented according to their socialization outcomes, would show idiosyncratic but homogeneous responses to product placement. The current study specifically focuses on general perceptions about advertising as consumer socialization outcomes, based on the idea that an individual’s general perceptions, beliefs, and attitudes toward advertising in general account for responses to a specific type of ad (Lutz, 1985). This objective calls for a nationally representative sample to be able to generalize the segmentation results. The lack of such a nationally representative sample has served as a limitation on most studies that have examined individual factors, whether applying qualitative (e.g., DeLorme & Reid, 1999; Gould & Gupta, 2006; La Pastina, 2001) or quantitative (e.g., Matthes, Wirth, Schemer, & Kissling, 2011) approaches. Even quantitative studies have mostly examined a college student sample or other types of convenient sampling, and therefore lack generalizability, rendering their implications insufficient.
The current study aims to contribute to product placement research largely in two respects. First, this is the first study that examines how segmented consumers respond to product placement according to their socialization outcomes, particularly their general perceptions of advertising. Second, this study used a nationally representative sample, which is especially important for consumer segmentation research. The study will further look at the demographic and media usage profiles of consumer segments with varying responses to advertising. For this purpose, this study analyzes a nationally representative sample (N = 22,348) provided by Experian Simmons (2016).
Literature Review
Consumer Socialization and Social Intelligence
During the lifelong process of consumer socialization, consumers gain skills, abilities, knowledge, and attitudes associated with adaptive functioning in marketplace interactions (Ward, 1974). Throughout the socialization process, consumers consistently develop, change, and reinforce their beliefs and behaviors about various marketplace events (Brim, 1968; Moschis, 1987; Smith & Moschis, 1984). The consumer socialization process is largely supported by two theories (Gregorio & Sung, 2010). Based on Jean Piaget’s view, the cognitive development model explains consumer socialization by primarily focusing on internal cognitive-psychological developments in childhood (Moschis, 1987). The second approach is based on the social learning theory, which focuses on the role of external environment and sources in consumer socialization. The social learning mechanism is facilitated via social interactions with various marketplace players such as friends, family members, and media (Bush, Smith, & Martin, 1999; Moschis & Churchill, 1978). Through the process, consumers accumulate marketplace knowledge and develop patterns in responding to advertising in general, which in turn influences their assessment of particular marketing activities (Bush et al., 1999).
Socialization improves consumer social intelligence in the marketplace. Wright (2002) proposed that throughout their lifetime, consumers develop marketplace social intelligence that allows them to actively cope with various marketplace events. As a subdomain of marketplace social intelligence, Friestad and Wright (1994) proposed that consumers develop intuitive knowledge about how persuasion works over the course of their lives. This social intelligence enables people to actively interpret various persuasion attempts such as advertising, resulting in positively or negatively evaluating the attempts. Persuasion knowledge is associated with various psychological aspects of persuasion, including attention, cognition, memory, beliefs, attitudes, and intent (Boush, Friestad, & Rose, 1994), all of which significantly influence consumer reactions to persuasion. Studies have found that marketing attempts are less likely to be effective on those having greater persuasion knowledge, because persuasion knowledge tends to spur skepticism and resistance to persuasion (Nelson & Ham, 2012; Obermiller & Spangenberg, 1998). This is especially so when the ulterior intention of the persuasion attempt is disclosed (Wei, Fischer, & Main, 2008). Persuasion knowledge, in this regard, is a significant socialization outcome for the purpose of investigating product placement effects because the placement is not always recognized as a persuasion tactic (Cowley & Barron, 2008).
According to the consumer socialization literature, socialization variables locate individuals in a socially identifiable group in which the members are likely to have homogeneous perceptions (Moschis, 1987). The literature therefore suggests that U.S. consumers can be segmented into homogeneous groups according to socialization outcomes, particularly cognitive and attitudinal characteristics associated with advertising, and that such groups will show distinct responses to product placement.
Accessibility of Product-Related Information
A body of literature on cognitive and consumer psychology suggests that consumer response to marketplace events depends on the accessibility of brand information in their memory. The spreading activation theory of memory (Anderson, 1976) posits that consumer memory consists of units of information interconnected via pathways. This view further notes that when an information unit is activated through subsequent exposure to similar information, the state of arousal can spread through pathways to associated memory elements, making them more accessible, hence easier to recognize and retrieve (Anderson, 1983).
Higgins, King, and Marvin (1982) proposed that when individuals are repeatedly exposed to certain stimuli over time, such information is accessible long-term in their memory. Research further shows that such chronically accessible information later shapes consumer cognitive and behavioral responses to incoming stimuli (Bargh, Lombardi, & Higgins, 1988; Bransford & Stein, 1984). This view proposes that when advertising-prompted information about products is accessible long-term in a consumer’s memory, consumers will be more likely to notice and remember brands that they encounter in various circumstances. Supporting the view, research shows that consumers with more knowledge about a product domain learn (Srull, 1983) and categorize (Alba & Hutchinson, 1987) new product information better than less knowledgeable consumers.
The literature on the effects of selective attention similarly suggests that individuals are more likely to process and retain incoming information when similar information is highly accessible in their memory (Johnston & Dark, 1986). This view implies that when product information is chronically accessible in one’s memory, consumers are more likely to process and retain product-related information. This suggests a connection between memory accessibility and responses to product placement. Therefore, accessibility of brand-related memories will be a positive predictor of consumer recognition of products placed on television shows and in movies.
The literature also suggests that accessibility of product memory shapes consumer judgments on product placement. Research on familiarity effects proposes that individuals tend to prefer objects to the extent that those objects are familiar to them (Zajonc, 1968). A great amount of research provides robust empirical support for this effect (Bornstein, 1989). In consumer research, Fang, Singh, and Ahluwalia (2007) found that individuals exposed to banner ads while reading an article on the computer were more likely to rate similar banner ads favorably than did those who did not have such exposure. This body of research indicates that accessibility of product-related information in the consumer memory will be a determinant of their attitudes and purchase intentions toward products placed in the media. Therefore, the current study will examine the role that accessibility of product-related information plays in clustering U.S. consumers, and how such groups respond to product placement differently.
Personal Beliefs About Advertising in General: Informational and Entertainment Value
Consumer beliefs about advertising are associated with their overall response to advertising in general (Pollay & Mittal, 1993). Attitudes toward advertising are rooted in multiple dimensions such as perceptions about the value of information in advertising, the economic effects of advertising, the value of artistic enjoyment, consumer materialism, and regulations over advertising (Durand & Lambert, 1985; Osmonbekov, Gregory, & Xie, 2009; J. T. Russell & Lane, 1993; Shavitt, Lowrey, & Haefner, 1998). Pollay and Mittal (1993) argued that attitudes toward advertising consist of seven dimensions, which vary across individuals. Among those dimensions, we are concerned about consumer perceptions of the value of product information and pleasure/hedonism in advertising. Product information delivered through advertising allows consumers to have greater knowledge and optimizes the outcomes of their marketplace interactions, whereas the pleasure/hedonism factor relates to the personal tendency to think that advertising is enjoyable, providing an entertaining and fun experience. Overall, when consumers perceive advertising to be informative and/or entertaining, they are more likely to have favorable attitudes toward it.
Researchers have been interested in how attitudes toward advertising influence consumer behavior. One of the consistent findings is that general attitudes are significantly associated with attitudes toward specific ads (Dutta-Bergman, 2006; Lutz, 1985). Consumers with more favorable attitudes toward advertising are likely to perceive an individual advertisement as more enjoyable, acceptable, and informative (Lutz, 1985). James and Kover (1992) also found that overall positive attitudes toward advertising influence consumer involvement with a specific advertisement. Overall, consumers’ general perceptions of advertising’s informative and pleasure/hedonic values are critical factors, as they shape the effects of an individual commercial message including product placement. Considering that consumer attitudes toward advertising play a pivotal role in their responses to product placement, it will be important to examine how consumer beliefs concerning advertising’s information and entertainment values play a role in segmenting U.S. consumers, and how the identified segments differently respond to product placement.
Dislike of Advertising
In Why Liking Matters, Walker and Dubitsky (1994) proposed that liking an ad is a valid indicator that shapes ad attitudes. In response to television advertising, ad-liking was significantly and positively correlated with other advertising effect measures: Ads that people liked were inherently more effective, eliciting more favorable attitudes toward the ad and the advertised brand. Bergkvist and Rossiter (2008) also found that ad likability was a significant predictor of brand attitudes, arguing that it is the single best copy test scale to measure advertising campaign results. Brown and Stayman (1992), in their meta-analysis, identified that ad likability measures the same constructs as attitudes toward the ad, immediately influencing beliefs in and attitudes toward a brand (MacKenzie & Lutz, 1989).
On the flip side of the ad-liking coin, consumers also dislike advertising as a result of marketplace socialization. Consumers dislike advertising when it interrupts program watching, is overly repetitive, or is irritating (Aaker & Bruzzone, 1985; Barnes & Dotson, 1990). Some consumers who are alienated from society also tend to dislike advertising (Durand & Lambert, 1985). In general, consumers in the United States are more sensitive to the negative social influences of advertising, such as advertising’s potential to generate unnecessary demand (Andrew, 1989; Bauer & Greyer, 1968; Reid & Soley, 1982). Consumer persuasion knowledge and resulting skepticism toward advertising would result in their disliking advertising that they perceive to be manipulative or to contain a message with a commercial purpose (Nelson & Ham, 2012; Wei et al., 2008). This is particularly so in product placement such that the placement effect is significantly mitigated when persuasion intention is disclosed (e.g., van Reijmersdal, 2016). Alwitt and Prabhaker (1994) argued that such advertising dislike is not a general tendency but rather is an individual characteristic generated by a combination of personal reasons (e.g., advertising is irritating) and demographic characteristics (e.g., age). Therefore, it is important to explore how individual dislike of advertising differs across U.S. consumers, and how such differences are associated with responses to product placement.
Demographic and Media Usage Profiles
In addition to social-psychological variables, social structural variables such as demographic characteristics affect consumer responses to advertising and product placement (Gregorio & Sung, 2010). In terms of gender, female consumers are slightly more negative toward advertising than male consumers (Dutta-Bergman, 2006; Shavitt et al., 1998). In terms of ethnicity, African Americans and other non-Caucasians tend to be more positive toward advertising than Caucasians (Bush et al., 1999; Nelson & McLeod, 2005; Shavitt et al., 1998; Soley & Reid, 1983; Yoon, 1995). Regarding other demographics, consumers who are older, have higher income, and are more educated are more negative toward advertising than those who are younger, with lower income, and less educated (Alwitt & Prabhaker, 1994; Dutta-Bergman, 2006; Shavitt et al., 1998).
As to product placement, studies have identified females as more concerned about product placement than males (Brennan, Rosenberger, & Hementera, 2004; Gupta & Gould, 1997; McKechnie & Zhou, 2003); non-Caucasians as more positive toward product placement than Caucasians (Nelson & McLeod, 2005); and older people as generally more apathetic toward the product placement (Schmoll, Hafer, Hilt, & Reilly, 2006). Gregorio and Sung (2010) identified consumer product placement attitudes to significantly differ by age (the young were more negative), education (the higher educated were more negative), but not by income level. Moreover, they found that behavior (e.g., using and trying a placed product) varied by age (younger people were more likely to engage in these behaviors), education (the higher educated were more likely), and income (those with higher incomes were more likely).
The media is a significant socialization agent, and affects consumer beliefs about and attitudes toward ad placement (Gregorio & Sung, 2010). Consumer socialization, in fact, occurs in part through mere exposure to mass media (e.g., Moschis & Churchill, 1978; Moschis & Moore, 1979; Smith & Moschis, 1984). The amount of media exposure is positively associated with young adults’ cognition and attitudes toward advertising, and consumption behavior (Bush et al., 1999; John, 1999; Mangleburg & Bristol, 1998; Mascarenhas & Higby, 1993; Moschis & Churchill, 1978; N. Singh, Chao, & Kwon, 2006). The amount of product placement exposure, operationalized by general movie watching frequency, has been positively associated with attitudes of movie viewers toward, and their behavior with respect to, product placement. Researchers have found that the more movies American, Chinese, Australian, and European college students watch, the more likely they are to have positive attitudes toward and engage in favorable behaviors regarding product placement (Brennan et al., 2004; Gould, Gupta, & Grabner-Kräuter, 2000; Gupta & Gould, 1997; McKechnie & Zhou, 2003). Another study found the same to be true of American adults (Gregorio & Sung, 2010). Considering the roles of demographic and media usage variables identified in the literature, the current study will explore how consumer clusters differ in their demographic characteristics and media usage profiles.
Consumer Responses to Product Placement
Research has been conducted to assess the effects of product placement on the audience and explore the psychological mechanisms by which such effects occur. While various constructs have been examined in diverse contexts, according to Balasubramanian et al. (2006), overall product placement effects can be categorized according to three criteria: cognition (e.g., recognition, recall), affect (e.g., attitudes), and conation (e.g., purchase intent).
As to cognitive outcomes, studies have shown that product placement increases explicit memory in terms of recognition, recall, and salience of the placed brands (Babin & Carder, 1996; Baker & Crawford, 1995; Johnstone & Dodd, 2000; Karrh, 1994; Nelson, 2002). Product placements are also processed unconsciously, increasing implicit memory (see Yang, Roskos-Ewoldsen, Dinu, & Arpan, 2006), but these memories cannot be verbalized (Synott, 1991). Thus, our study focuses on recognition and recall as measures of consciously processed memories that consumers can retain long-term.
As to affective outcomes, studies have shown mixed results. C. A. Russell (2002), for instance, found significant attitudinal changes toward the placed brand even when recognition was low; whereas Karrh (1994) showed no brand attitude changes when people remembered the placed brand well. A significant factor in the effects of placement is consumers’ persuasion knowledge. Studies have found that the effects of product placement vary depending on consumer recognition of a commercial intent because product placement is not always recognized as a persuasion tactic (Cowley & Barron, 2008; van Reijmersdal, 2016). Persuasion knowledge, as consumer social intelligence, plays a pivotal role in recognizing such a hidden commercial intent, resulting in mitigating the effects of product placement. Thus, the current study will examine how different consumer clusters respond to product placement when they recognize a commercial intent.
Last, as to conative effects, only a few studies have shown that product placement is positively related to a behavioral intent. Baker and Crawford (1995) reported higher purchase intention when participants viewed placed brands. Morton and Friedman (2002) showed that a viewer’s belief about product placement in movies was a significant predictor of product usage behaviors. Recently, Gregorio and Sung (2010) found that behavioral intention for the placed brand was related to socialization factors such as demographics and peers. However, no studies have examined how general perception of advertising was related to product placement responses. Overall, therefore, we are interested in how different consumer groups, segmented according to general perception of advertising, show varied responses across cognition (recognition, recall), affect (attitudes-dislike when recognizing commercial intent), and conations (intent to try and purchase placed products). Our overall research model is shown in Figure 1.
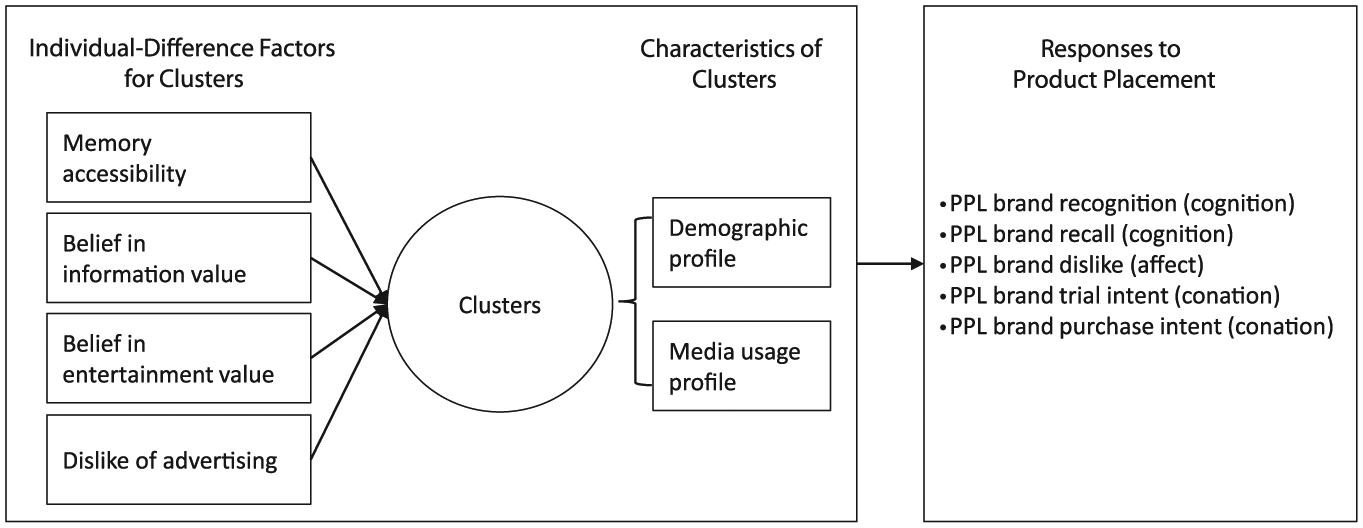
Conceptual model of the research.
Method
Experian Simmons
The 2010 data from the Experian Simmons National Consumer Study (Experian Simmons, 2016) were utilized to investigate the research objectives. NCS data have been primarily used by industry professionals for the purpose of informing their strategies for defining target consumers; constructing their demographic, psychographic, and product usage profiles; and selecting media outlets for advertising campaigns. A group of researchers have also recently used the data for scholarly inquiries regarding consumer-related issues, such as consumer beliefs and attitudes about affluent lifestyles (Harmon, 2001), opinions about healthier diets (Hoy & Childers, 2012), and beliefs about and behavioral responses to green marketing (Park & Lee, 2014).
The NCS provides nationally representative data for a wide range of consumer beliefs, attitudes, and behaviors about products, lifestyles, and marketing communications. NCS data are based on a probability sample of 24,463 U.S. individuals age 18 or older. Experian Simmons produces the sample through stratified sampling, using income and geographic characteristics to construct the strata (Palit, 2007). Considering that it is crucial to use a representative sample in cluster analysis (Hair, Anderson, Tatham, & Black, 2010), NCS data form an appropriate sample for the current study. Due to missing values for the four clustering variables (accessibility, information value, entertainment value, dislike of advertising), the final sample size was reduced to 21,944.
NCS data were accessed through an online-based platform named Simmons Oneview, which only provides aggregate data: Data obtained through the platform only show the frequency distribution of the total sample’s responses to a question. In this form, researchers can only run a few descriptive statistics with the data. To overcome this limitation, Park and Hoy (2015) developed a unique method of reconstructing individual-level data for up to six variables per analysis from aggregate NCS data. The current study employs this method to reconstruct an individual-level dataset to examine the research objectives.
Measures
Measures for the four clustering variables were obtained from the NCS booklet. Respondents marked answers on a 5-point scale (1 = disagree a lot, 2 = disagree, 3 = neither agree nor disagree, 4 = agree, 5 = agree a lot) to indicate their general beliefs and attitudes regarding advertising. The statements were (a) “I remember advertised products when I am shopping,” measuring accessibility of product information (M = 2.92, SD = 1.12); (b) “Advertising helps me learn about the products companies offer,” measuring belief in advertising’s value as a source of information (M = 3.37, SD = 1.04); (c) “I expect advertising to be entertaining,” measuring belief in advertising’s hedonistic value, or its value as a source of entertainment (M = 3.29, SD = 1.08); and (d) “I don’t like advertising in general,” measuring dislike of advertising (M = 3.31, SD = 1.11).
Respondents also rated responses on a 5-point scale (1 = disagree a lot, 2 = disagree, 3 = neither agree nor disagree, 4 = agree, 5 = agree a lot) concerning product placement in television and movie. The items were (a) “When I watch television/movie, I often notice brand name products used as part of the set (recognition),” (b) “After I watch my favorite TV show/movie, I can remember the brand name products the characters were using during the show (recall),” (c) “I hate seeing brand name products in TV shows/movies if they are placed for commercial purposes (dislike by persuasion knowledge),” (d) “When I see a character using a brand name I never tried before in TV show/movie, I am likely to try it (trial intent),” and (e) “When I’m in a store or online and I see a brand name product I recognize from a TV show/movie, I’m more likely to buy it than its competitor (purchase intent).” Respondents also answered demographic questions—gender, age, employment, marital status, education, household income, and race. Finally, respondents rated their television and movie usage.
Clustering Approach
The purpose of cluster analysis is to classify respondents into distinct segments, such that individuals within groups share similar characteristics with respect to a range of measured criteria, commonly referred to as “clustering variables,” whereas members across different groups are dissimilar in terms of such criteria (Hair et al., 2010). Among various approaches in cluster analysis, the current study employed a combination of the hierarchical and k-means methods. Because there is no single, universally agreed-upon method of conducting cluster analysis, researchers often use the two most commonly used methods (i.e., hierarchical and k-means) and compare the results to obtain a valid and stable clustering solution (e.g., Punj & Stewart, 1983; J. Singh, 1990).
In the starting hierarchical step, the Ward’s (1974) method was used with the squared Euclidean distance equation, as recommended in prior research (e.g., Punj & Stewart, 1983; J. Singh, 1990). The hierarchical method was used to yield a range of possible clustering solutions with different numbers of clusters. For each clustering solution, the centroids, defined as the mean values for the four clustering variables, were obtained for each cluster. For example, for the three-cluster solution, the mean values of the four clustering variables were obtained for each of the three clusters. The same process was repeated for the other clustering solutions. Then for each clustering solution, a k-means method was used to produce the same number of clusters with their center anchored around the centroids identified in the hierarchical clustering step, so that the results from the two methods are comparable. Last, the results from the two methods were compared for the purpose of optimizing the solution.
The following four criteria were considered to produce the optimum solution: (a) minimum within-group heterogeneity; (b) size of the resulting segments; (c) membership agreement between the two steps, referring to the percentage of individuals classified into the same segment across the two clustering methods; and (d) theoretical interpretability and practical significance. These criteria have been commonly used in consumer (Hiu, Siu, Wang, & Chang, 2001; Park & Lee, 2014), health behavior (Silk, Weiner, & Parrott, 2005), and communication research (Lambe & Reineke, 2009).
Results
Cluster Analysis
In the first step, responses to the clustering variables were analyzed with a hierarchical cluster analysis, and two-cluster to seven-cluster solutions were initially obtained. An examination of agglomeration coefficients, a summary measure of within-group homogeneity (i.e., similarities) for a given clustering solution, revealed that three-cluster to seven-cluster solutions might be appropriate. The purpose of the second step was to further examine the three-cluster to seven-cluster solutions. For this purpose, a k-means cluster analysis was conducted with a 10-iteration limit, using centroids for each solution identified in the hierarchical procedure as initial cluster centers.
The results of the two clustering procedures were cross-examined to compute membership agreement (i.e., the percentage of individuals that are classified into the same groups between the two clustering approaches). The five-cluster solution possessed the highest membership stability, showing 82.62% of respondents grouped in the same segments across the two methods. The other solutions had varying levels of agreement (e.g., 72.69% for three clusters, 80.35% for four clusters, 82.62% for five clusters, 82.22% for six clusters, and 81.73 for seven clusters). After carefully investigating the five solutions, the five-cluster solution was judged to be the most theoretically interpretable, practically significant, and reliable with a relatively high rate of membership agreement.
Table 1 summarizes the means and standard deviations for the five identified groups with respect to the clustering variables. The table shows a few noticeable patterns. First, Cluster 1 and Cluster 2 possessed largely negative views and responses toward advertising. Cluster 1, in specific, showed general consumer apathy toward advertising, as reflected in mean ratings on all four segmentation criteria that were significantly lower than the midpoint of the 5-point scale (ps < .01) or of the sample means (ps < .01). This group, representing 23.9% of the sample (n = 5,243), is generally not very concerned about advertising. Cluster 2, representing 23.8% of the sample (n = 5,214), showed highly negative views and responses toward advertising. Their mean rating on ad dislike was the highest across all clusters (M = 4.17). Mean ratings on the other three variables, in addition, were significantly lower than the midpoint of the 5-point scale (ps < .01) or of the sample mean (ps < .01). While similar, these two groups showed noticeable differences in that Cluster 1 had a higher mean rating on accessibility (p < .01) and a lower mean rating on ad dislike (p < .01) compared with Cluster 2. In fact, Cluster 1’s mean rating on ad dislike was even lower than the sample mean score (p < .01). Therefore, we identified Cluster 2 as the group least favorable to advertising and hence named it the Negative group. Cluster 1 was the next least favorable group to advertising and was named the Apathetic group.
Means and Standard Deviations of the Five Clusters.

Note. Cluster 1: Apathetic group; Cluster 2: Negative group; Cluster 3: Information Value group; Cluster 4: Entertainment Value group; Cluster 5: Ambivalent group.
Second, Clusters 3 and 4 were largely positive toward advertising. These two groups had mean ratings on accessibility, information value belief, and entertainment value belief that were significantly higher than the midpoint of the scale (ps < .01) as well as the sample means (ps < .01). However, there were noticeable differences between the two groups in that Cluster 4 (18.7%; n = 4,094) had the highest mean rating in entertainment value belief (M = 4.39 vs. 4.07; ps < .01) while Cluster 3 (10.5%; n = 2,371) was significantly more favorable in light of information value belief (M = 4.36 vs. 4.09; ps < .01). In fact, despite its overall positive responses, Cluster 4 had a significantly higher mean rating on ad dislike than the sample mean or the midpoint of the scale (ps < .01), whereas Cluster 3 had a lower mean rating for ad dislike than all other groups (ps < .01). Based on these findings, Cluster 3 was identified as the Information Value group, and Cluster 4 as the Entertainment Value group.
Last, Cluster 5 (22.9%; n = 5,022) was identified as the Ambivalent group, as it showed mixed responses across the four criteria. Its mean ratings on accessibility and information value belief were higher than the midpoint of the scale or the sample mean (ps < .01). However, the group’s views in light of entertainment value belief and ad dislike were lower than either the sample mean or the midpoint of the scale (ps < .01).
Demographic and Media Usage Profiles
To profile the demographic characteristics of the five segments, respondents’ cluster membership was cross-tabulated with each of the demographic descriptors, and a measure of association was obtained. The results indicated that the five groups significantly differed in the demographic backgrounds of its group members, including gender (χ2 = 57.50, df = 4, p < .01), age (χ2 = 223.87, df = 4, p < .01), education (χ2 = 444.99, df = 4, p < .01), ethnicity (χ2 = 411.70, df = 12, p < .01), household income (χ2 = 206.51, df = 4, p < .01), marital status (χ2 = 92.73, df = 4, p < .01), and employment status (χ2 = 38.45, df = 8, p < .01). The distribution of demographic groups within the five clusters is summarized in Table 2.
Demographic Profiles of the Four Clusters.
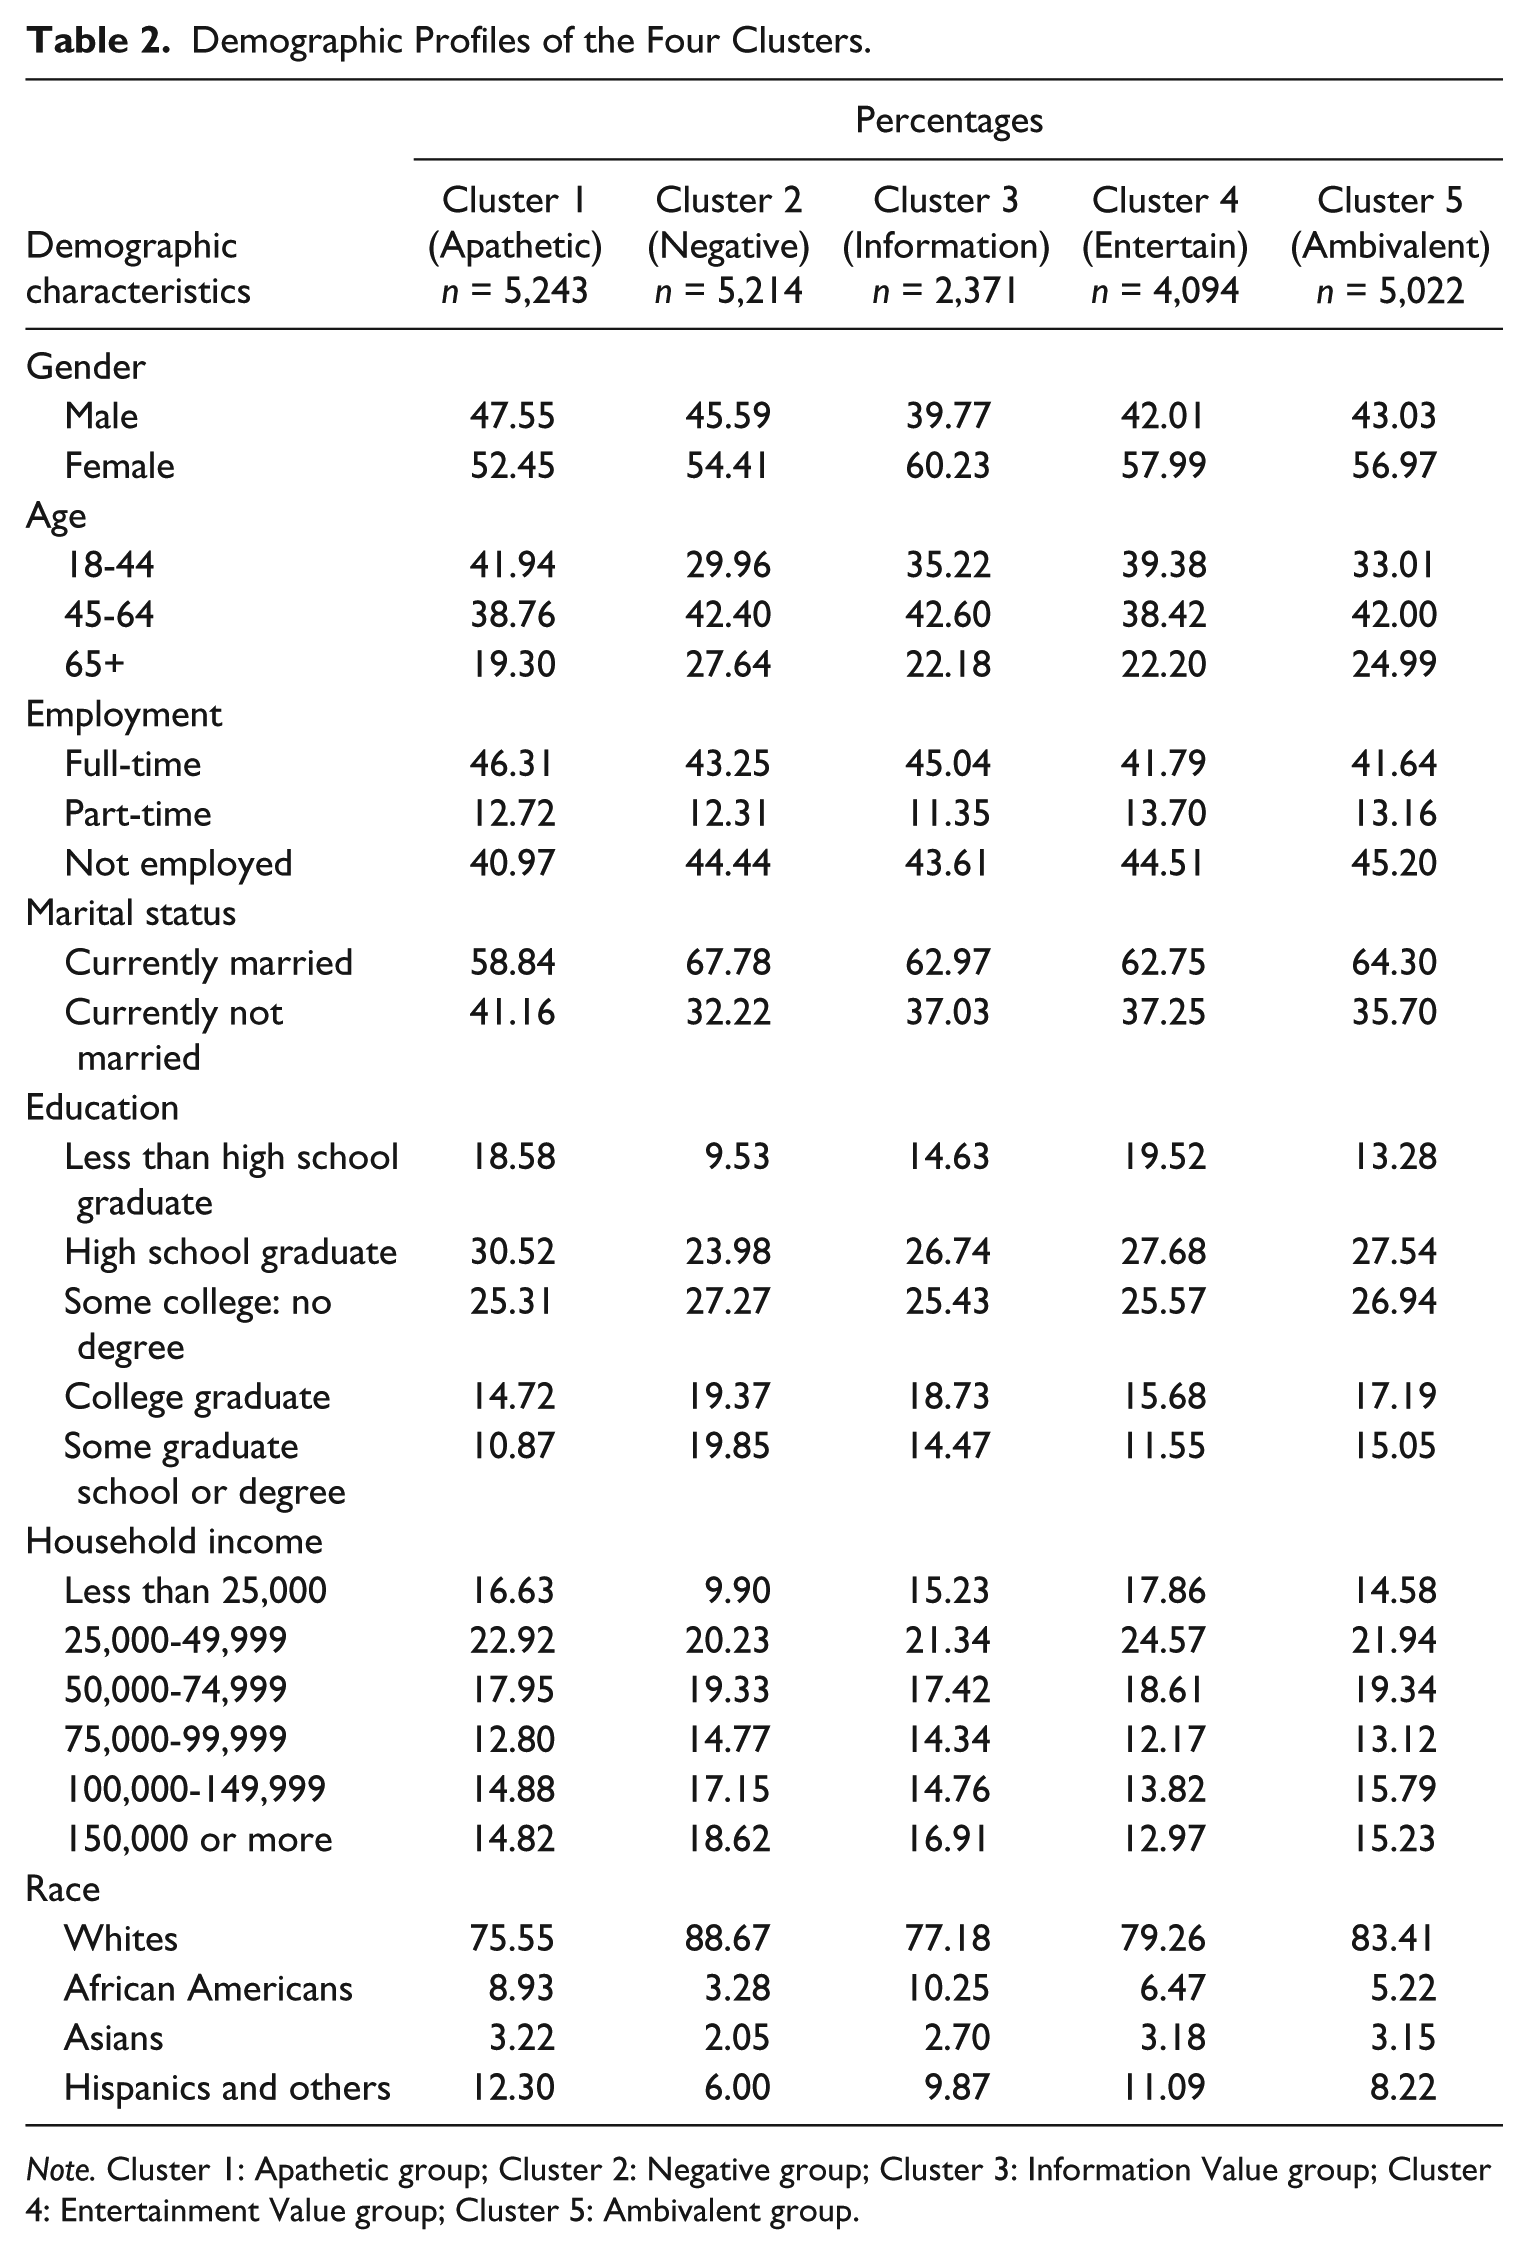
Note. Cluster 1: Apathetic group; Cluster 2: Negative group; Cluster 3: Information Value group; Cluster 4: Entertainment Value group; Cluster 5: Ambivalent group.
For major electronic media types, the NCS data put respondents into five groups referred to as “quintiles.” The first of such quintiles points to the heaviest users. The fifth represents the lightest. For the three timeframes of television watching, including prime time, early and late fringe hours, and all day, cluster membership was cross-tabulated with quintile membership. The clusters significantly differed in consumption of prime-time television (χ2 = 181.65, df = 4, p < .01), early and late fringe television (χ2 = 95.21, df = 4, p < .01), and general television watching (χ2 = 181.18, df = 4, p < .01). The clusters also differed in the number of movies watched in the last 30 days, F(4, 8316) = 16.39, p < .01. The distribution of media quintiles in the five clusters is presented in Table 3.
Media Usage Profiles of the Five Clusters.
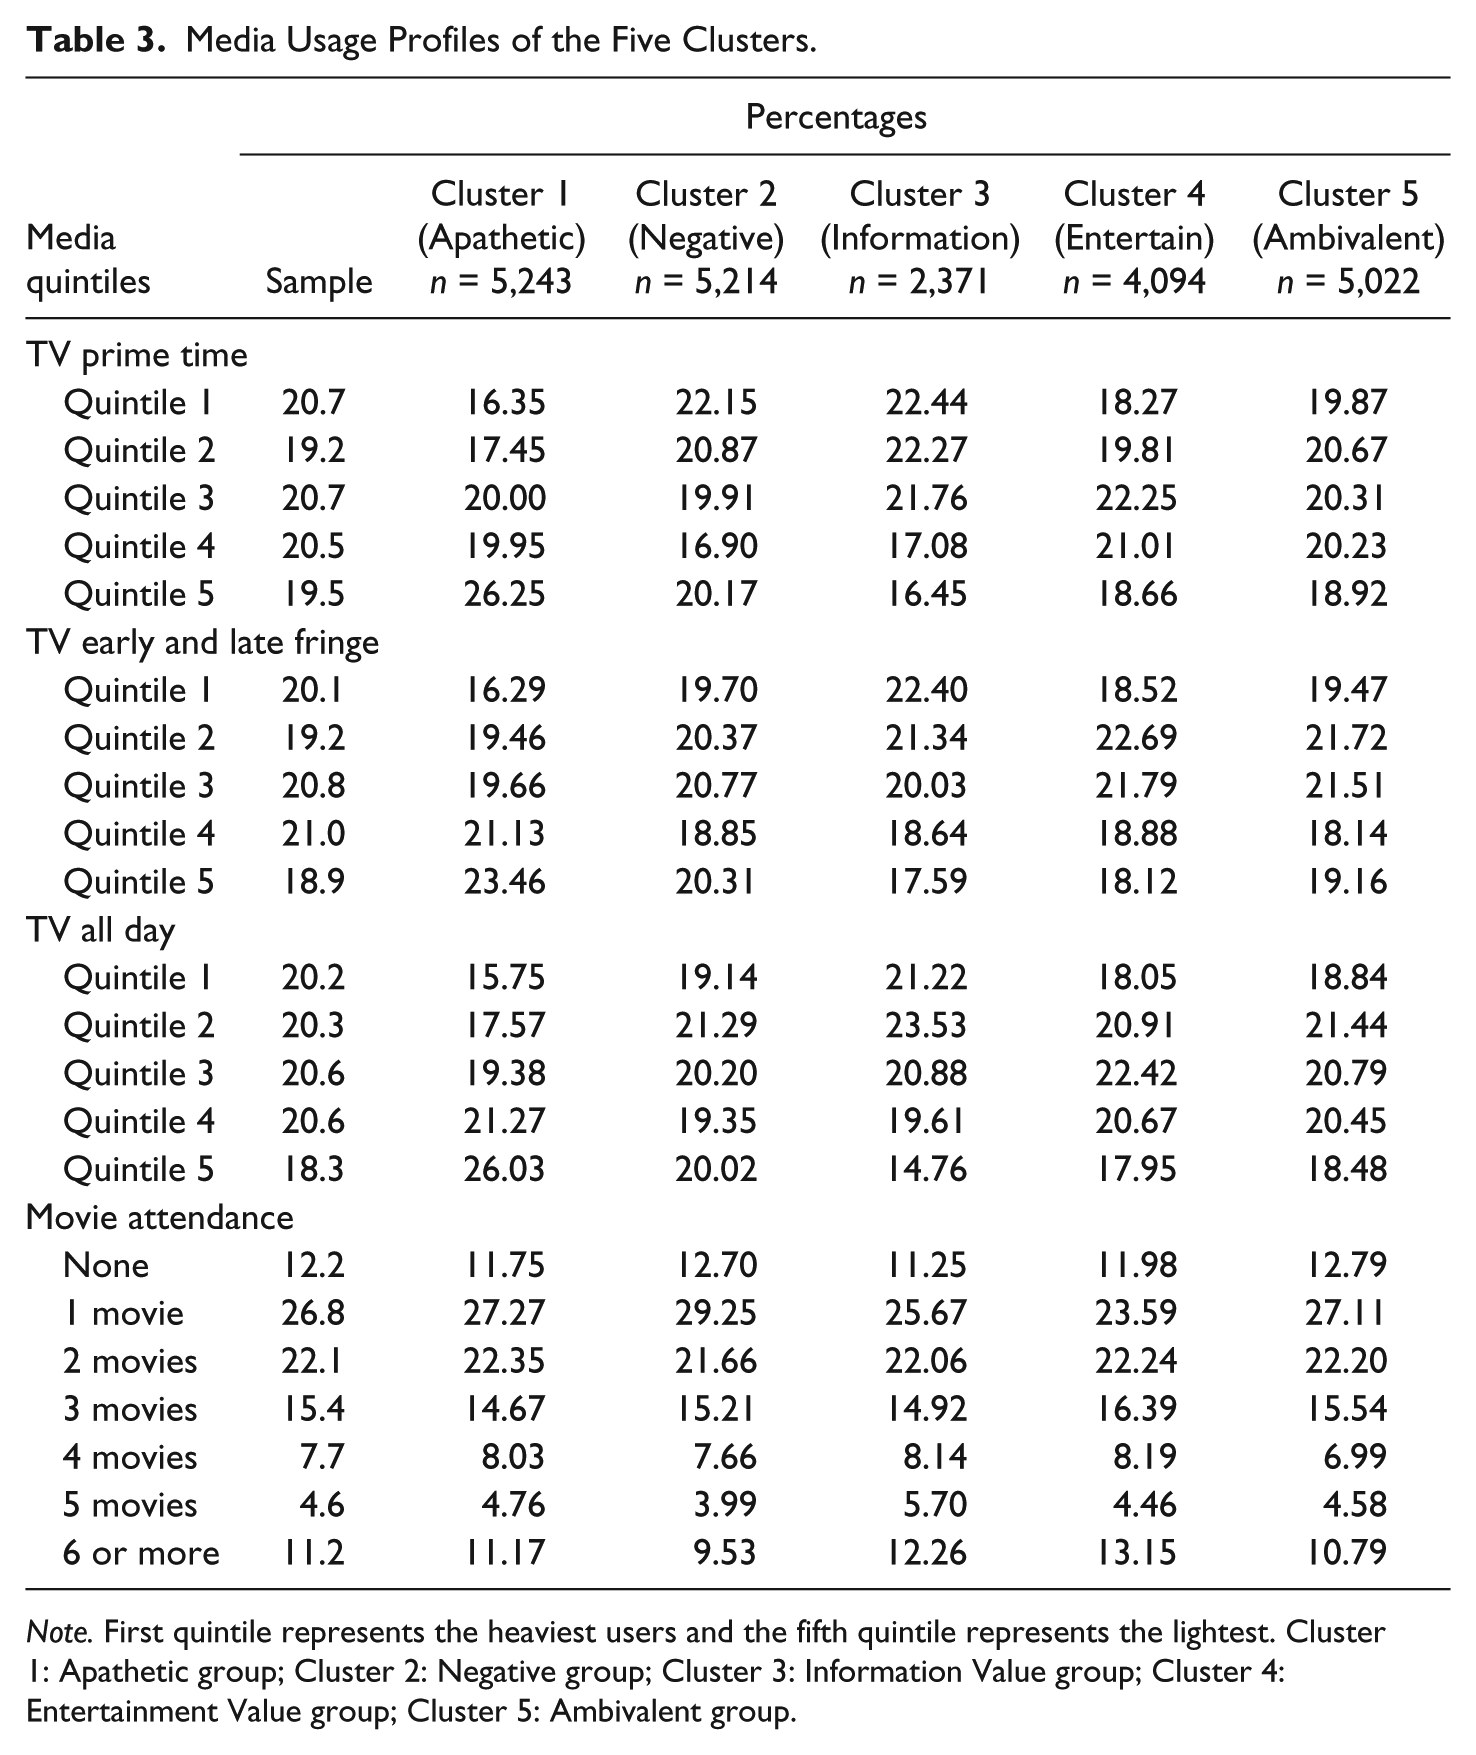
Note. First quintile represents the heaviest users and the fifth quintile represents the lightest. Cluster 1: Apathetic group; Cluster 2: Negative group; Cluster 3: Information Value group; Cluster 4: Entertainment Value group; Cluster 5: Ambivalent group.
Young adults (aged 18-44) represented 41.94% of Cluster 1 (Apathetic group), but other clusters had a lower percentage of this age group (29.96% for Cluster 2—Negative group, 35.22% for Cluster 3—Information Value group, 39.38% for Cluster 4—Entertainment Value group, and 33.01% for Cluster 5—Ambivalent group). Education also seemed to be a critical factor in that individuals without any college experience represented 49.10% of Cluster 1 (Apathetic group), whereas they made up 33.51% of Cluster 2 (Negative group), 41.37% of Cluster 3 (Information Value group), 47.20% of Cluster 4 (Entertainment Value group), and 40.82% of Cluster 5 (Ambivalent group). Cluster 1 (Apathetic group) also included a lower percentage (52.45%) of females than other groups (54.41% for Cluster 2, the Negative group; 60.23% for Cluster 3, the Information Value group; 57.99% for Cluster 4, the Entertainment Value group; and 56.97% for Cluster 5, the Ambivalent group). In terms of media usage, this cluster contained the highest proportion of light television viewers (i.e., Quintiles 4 and 5 combined) for prime time (46.20%), early and late fringe time (44.59%), and all periods combined (47.30%).
Other trends reflected more subtle differences. Cluster 2 (Negative group) was more aged than other groups (above 45: 70.04%), and included the second fewest females (54.41%) and the most Caucasian consumers (88.67%). Education was another critical factor in this cluster. Cluster 2 (Negative group) was the most educated group, including the highest percentage of graduate school degrees (19.86%) and college graduates (19.37%). This group had the highest income level (US$100,000 ~ US$149,999: 17.15%; more than US$150,000: 18.62%). In addition, this cluster was most likely to watch television in prime time (22.15% for Quintile 1). The same was true when all viewing periods were combined (19.14% for Quintile 1—television all day, and 21.29% for Quintile 2—television all day).
Cluster 3 (Information Value group) included the highest percentage of females (60.23%) and African Americans (10.25%), the second highest income level (US$100,000 ~ US$149,999: 14.76%; more than US$150,000: 16.91%), and the second highest education level (college graduates and at least some graduate school education: 33.20% total) behind Cluster 2 (Negative group). In terms of media usage, this cluster contained the highest proportion of heavy viewers (i.e., Quintiles 1 and 2 combined) in prime time (44.71%), early and late fringe time (43.74%), all periods combined (44.75%), and movies (12.26% more than 6 times over the past 3 months).
Cluster 4 (Entertainment Value group) included the second highest proportion of females (57.99%), the second highest proportion of young adults (18-44: 39.38%), and least educated (19.52% of the group had less than a high school education; 27.68% were high school graduates). The media usage profile for this cluster appeared to be average, except that it contained a relatively high percentage of heavy movie watchers (13.15% for more than 6 times in the past 3 months).
Responses to Product Placement in Television
The practical significance and predictive validity of the five-cluster solution were examined by comparing the segments in light of their responses to product placement in television and movies. For this inquiry, the five items representing responses to product placement were selected from the NCS booklet, with all items measured on a 5-point scale (1 = disagree a lot, 3 = neither agree nor disagree, 5 = agree a lot). The items were analyzed with a one-way ANOVA. Cluster membership was entered as the sole independent factor. Follow-up mean comparisons were conducted with the Bonferroni method. Table 4 reports the descriptive statistics for the five items across the five clusters in the case of product placement in television, whereas Table 5 shows those for product placement in movies (see Tables 4 and 5).
Responses to Product Placement in Television.

Note. Cluster 1: Apathetic group; Cluster 2: Negative group; Cluster 3: Information Value group; Cluster 4: Entertainment Value group; Cluster 5: Ambivalent group. PK = persuasion knowledge.
Responses to Product Placement in Movies.
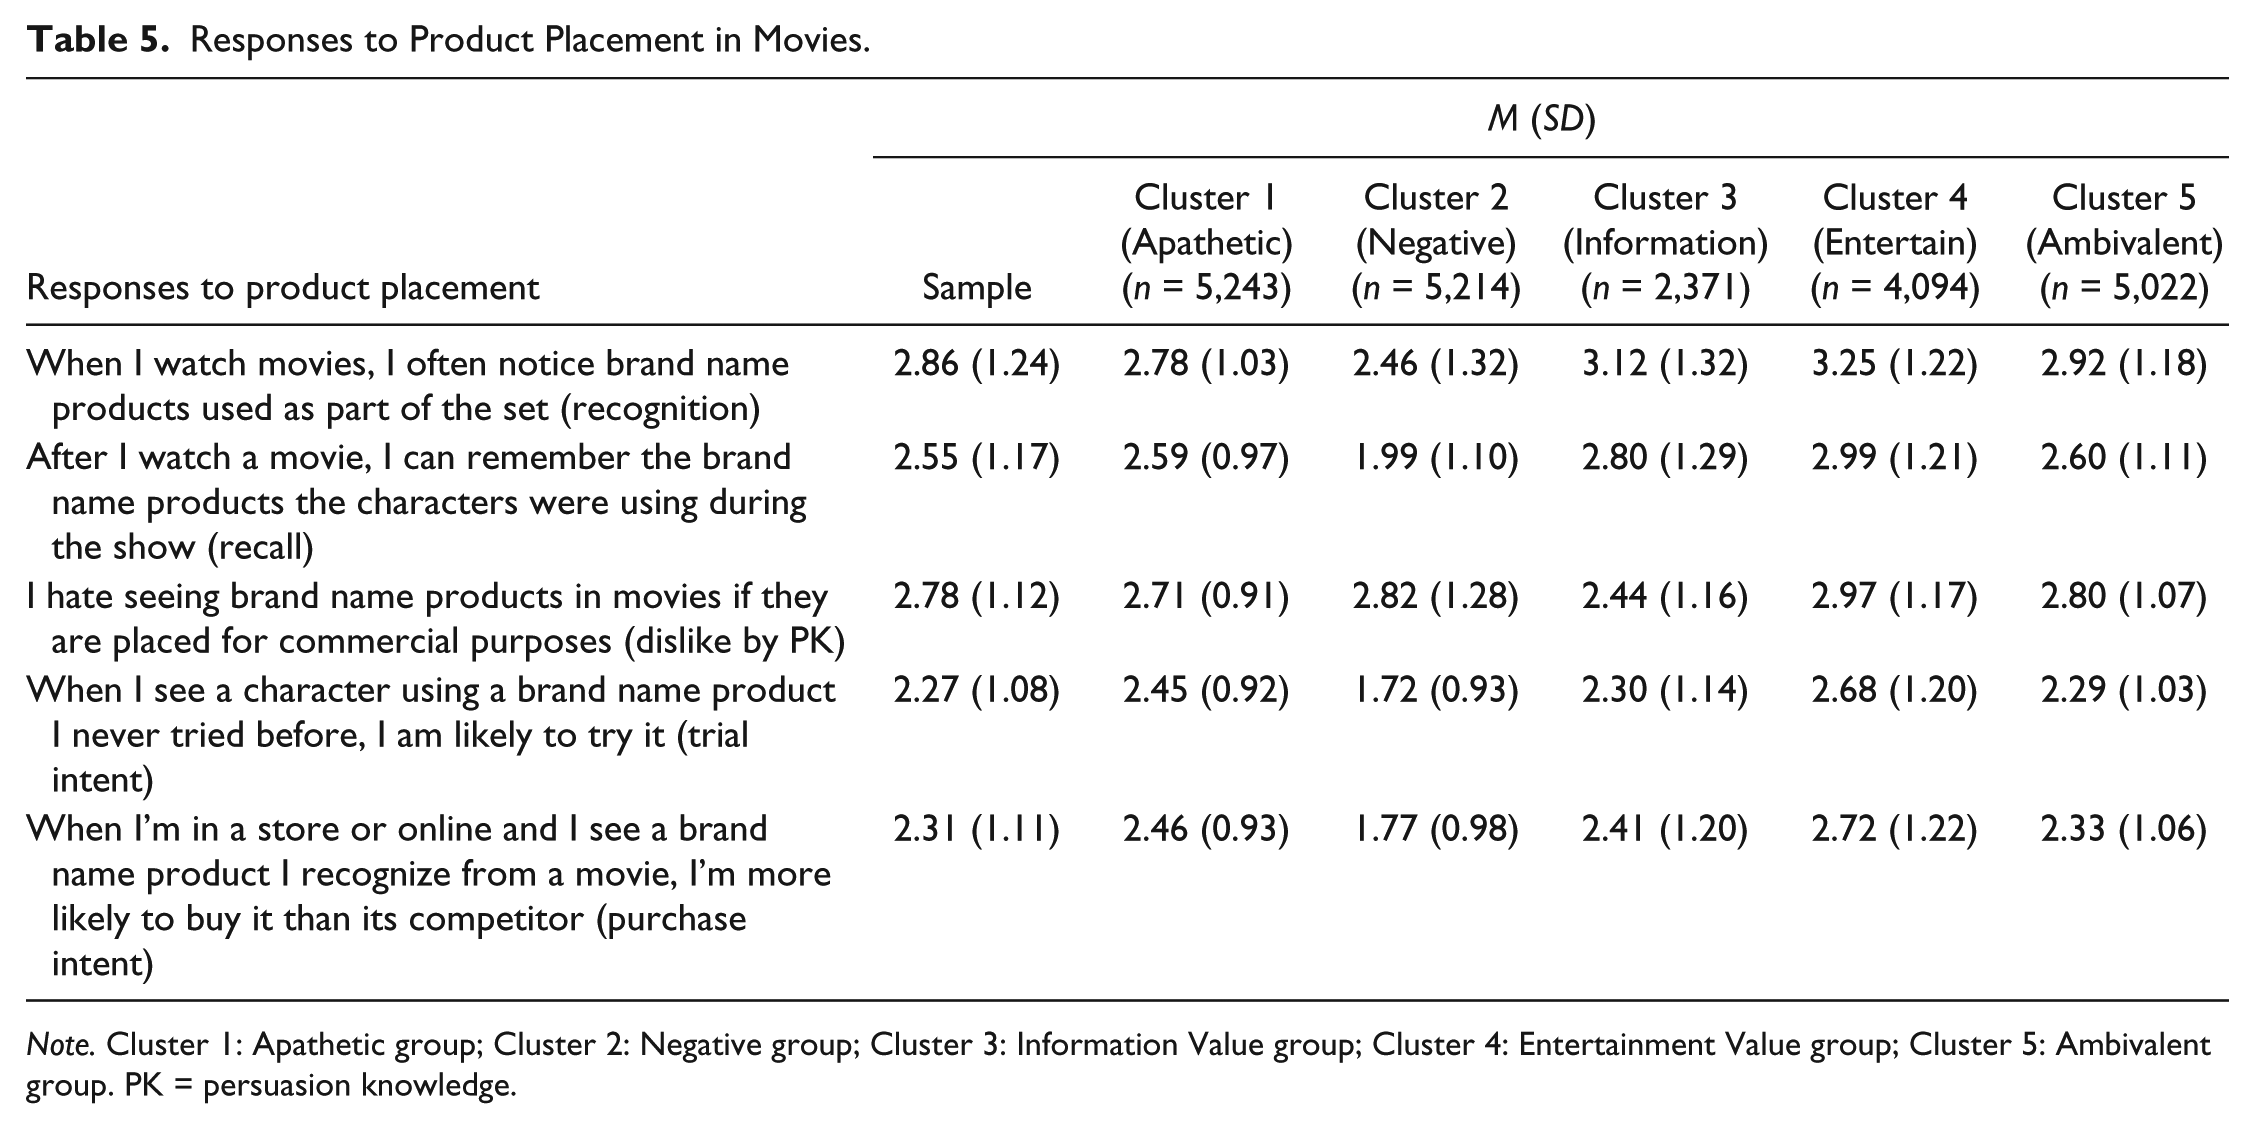
Note. Cluster 1: Apathetic group; Cluster 2: Negative group; Cluster 3: Information Value group; Cluster 4: Entertainment Value group; Cluster 5: Ambivalent group. PK = persuasion knowledge.
The ANOVA results indicated that the mean differences across clusters were statistically significant for the five television-related items (ps < .01). Specifically, the results revealed that Clusters 3 (Information Value group) and 4 (Entertainment Value group) had more positive responses to product placement in television than the other clusters, especially in recall and recognition. Cluster 4 (Entertainment Value group) had the most favorable mean rating across most positive measures, as they were the most likely to recognize (M = 3.54) and recall (M = 3.11) brands placed in the program, and the most likely to try (M = 2.73) and to purchase (M = 2.86) the placed brands. The group’s responses to the four positive measures were significantly higher than those of other groups (ps < .01). Cluster 3 (Information Value group), another positive group toward advertising, ranked the second highest in recognition (M = 3.45) and recall (M = 2.88), and the lowest in ad dislike (M = 2.46). Their responses to trial (M = 2.33) and purchase intent (M = 2.51) were not as favorable.
Conversely, Cluster 2 (Negative group) showed the least positive responses toward product placement, representing the second highest dislike (M = 2.91). Their mean scores for the other four positive measures were significantly lower than those of the four other groups (ps < .01). Cluster 1 (Apathetic group) members were less likely to recognize (M = 2.96) and recall (M = 2.65) brands placed on a television program compared with Cluster 3, the Information Value group (ps < .01), but showed the second highest ratings in trial (M = 2.48) and purchase intent (M = 2.51). Cluster 5 (Ambivalent group) showed mixed responses with its mean rating ranked third of the five groups for the majority of measures.
Overall, Cluster 4 (Entertainment Value group) had the most favorable mean ratings across most measures, interestingly including dislike. While this cluster rated the highest across most positive measures, there was no single cluster that ranked second highest across all measures. Cluster 3 (Information Value group) was the second highest in recognition and recall, whereas Cluster 1 (Apathetic group) was the second highest in trial intent and purchase intent. However, Cluster 2 (Negative group) ranked mostly below average across the measures and ranked the second highest in the dislike measure, behind Cluster 4 (Entertainment Value group).
Responses to Product Placement in Movies
The responses of the five clusters regarding product placement in movies were also compared. The five items representing responses to product placement in movies were analyzed with a one-way ANOVA. Cluster membership was the sole independent factor, and follow-up mean comparisons were conducted with Bonferroni’s method (see Tables 4 and 5).
The overall mean differences among the five clusters were significant for all five movie-related items (ps < .01). Post hoc comparisons between group means led to further insights. The results of post hoc comparisons for movie-related measures were similar to those for television measures. As Table 5 shows, Clusters 3 (Information group) and 4 (Entertainment Value group) exhibited more favorable responses to the placement in movies than the other three groups, while Cluster 5 (Ambivalent group) was the middle group. Cluster 4 (Entertainment Value group) showed the highest mean scores across the five measurements. The group’s means for the four positive measures (M = 3.25 for recognition, M = 2.99 for recall, M = 2.68 for trial intent, M = 2.72 for purchase intent) were significantly higher than those of other groups (ps < .01). Cluster 3 (Entertainment Value group) represented the next most positive responses in recognition (M = 3.12) and recall (M = 2.80), and the group’s mean dislike by PK score was the lowest of all groups (M = 2.44). However, the responses of Cluster 3 (Entertainment Value group) for trial intent (M = 2.30) and purchase intent (M = 2.41) were not as impressive. Cluster 1 (Apathetic group) showed the second most positive responses in trial intent (M = 2.45) and purchase intent (M = 2.46). Cluster 2 (Negative group) was the least favorable segment, with the lowest mean ratings for recognition (M = 2.46), recall (M = 1.99), trial intent (M = 1.72), and purchase intent (M = 1.77). The results were overall similar to the case of television. The group’s mean ratings for the favorable response measures were significantly lower than those of the other four groups (ps < .01).
Discussion
One would expect significant differences in American consumer responses to product placement, as different groups of Americans are socialized differently. As a result, American consumers differ in their general perceptions and attitudes toward advertising, and we would expect these differences to be reflected in different demographic and media usage profiles. Will the distinct groups who share similar perceptions about advertising respond differently to product placement? The results of this study suggest that they do.
Using a nationally representative sample of U.S. adults, the present study identified five distinct clusters of U.S. consumers based on their accessibility to product information in memory, belief in the value of advertising as sources of information and entertainment, and their dislike of advertising. Overall, segments of the population represented by these clusters show distinct responses to product placement as expected: (a) cognition: groups with more accessible memory of placed products (Cluster 3—Information Value group, and Cluster 4—Entertainment Value group) showed higher brand recognition and recall, but groups with less memory accessibility showed lower brand recognition and recall (Cluster 1—Apathetic group and Cluster 2—Negative group); (b) affect: groups that were more negative (ad dislike) toward advertising (Cluster 2—Negative group and Cluster 4—Entertainment Value group) also showed highly negative attitudes toward product placement; and (c) conation: the group assigning the most entertainment value to advertising (Cluster 4—Entertainment Value group) showed higher behavioral intentions than others in terms of wanting to try or use the products. We discuss each cluster’s response to product placement based on the framework of consumer socialization variables.
First, Cluster 1, the Apathetic group, is least likely to recognize brands placed in media content, except for Cluster 2 (Negative group). The fact that this cluster has the highest proportion of young adults may suggest that young people are watching less and less television; they are accordingly less likely to have sufficient accessibility of brand-related memories and are less likely to recognize brands placed in television programs, consistent with the activation theory of memory (Anderson, 1976). This group also shows below-average scores for placed brand dislike even when they recognize commercial intent (persuasion knowledge). We interpret that these results may stem from their overall apathetic attitudes, particularly the less negative advertising attitudes (ad dislike). Among those in Cluster 1 who are not negative toward advertising, the response to product placement is also not so negative even when persuasion intent is recognized. Studies in the Persuasion Knowledge Model (Friestad & Wright, 1994) have shown that the persuasion effect is mitigated when consumers recognize commercial intent; but we argue that such effect would vary by target consumer socialization outcomes. Overall, the product placement effect is quite minimal among those in the Apathetic cluster.
Second, Cluster 2, the Negative group, represented the least positive responses to product placement. Similar to Cluster 1 (Apathetic group), this group showed low memory accessibility, accordingly low recognition and recall. Different from the Cluster 1 (Apathetic group), however, this group revealed the lowest behavioral intention to try and purchase the products, suggesting that their negative ad attitudes were significantly reflected in their lowest behavioral intentions. Demographically, this cluster represented the most educated, the most Caucasians, and the highest income groups. These results are partly consistent with previous studies in that the more educated (Gregorio & Sung, 2010) and Caucasians as opposed to non-Caucasians (Nelson & McLeod, 2005) have been found to be more negative to product placement. Our results are not consistent in the case of income, as we show that high income is related to low placed product recognition, recall, and behavioral intent, while previous research showed no variation in product placement based on income (Gregorio & Sung, 2010). In addition, our findings show that consumers in this cluster are most likely to watch prime-time television and more likely to watch all day than the other clusters. This result is the opposite of a previous study that found that increased media consumption would increase positive attitudes and behaviors regarding placed brands (Gregorio & Sung, 2010).
Third, Cluster 3, the Information Value group, showed the lowest negativity, and indeed considerable positivity, toward product placement. Consumers who have higher accessibility of the memory of placed products and who assign higher informational value to advertising are likely to recognize and remember the product placement quite well. Interestingly, however, this group’s behavioral intentions (trial and purchase) were not very strong, though above average, compared with other clusters. Assuming that most product placements simply expose brands in the context of a television program or movie, we conclude that people who are concerned about the information value of advertising are not sufficiently motivated to try or to buy the placed products based on simple recognition and recall of the placed brands, in the absence of information about the brands. Consistent with this group’s least negative attitude toward advertising, they were the least negative group toward placed brands when they recognized a commercial purpose (persuasion knowledge was elicited). Demographically, more African Americans are included in this group. Given that African Americans are more positive than Caucasians toward advertising (Bush et al., 1999), this ethnic skew makes sense in terms of this group’s lowest ad-dislike score.
Fourth, Cluster 4, the Entertainment Value group, was highly positive toward product placement across all measures: They were the most likely to recognize, recall, try, and buy placed brands. This result makes sense given the fact that this group showed the highest memory accessibility and entertainment value belief, and the second highest belief in the information value of advertising following Cluster 3 (Information Value group). Interestingly, however, this cluster also showed the highest dislike of placed brands when recognizing commercial intent. Combined with Cluster 3 (Information Value group), we interpret these results to mean that recognition of commercial intent (persuasion knowledge) negatively relates to attitudes only when the general perception of advertising is also negative. Demographically, Cluster 4 (Entertainment Value group) includes a greater number of consumers who are female and less educated than any other group except for the Cluster 1 (Apathetic group). Given that this shows less educated people to be generally less concerned about product placement, this result does not confirm previous studies.
Cluster 5, the Ambivalent group, showed average scores across all measures. Compared with the other groups, this group represented average-level perceptions and intentions regarding the effectiveness of product placement. This result is consistent with this group’s general perceptions and attitudes toward advertising.
Finally, consumers in the clusters showed almost identical responses across television and movies. Our findings showed that although consumers in each cluster exhibited different characteristics, the responses of any particular cluster to product placement were not different with respect to products placed on television shows versus movies.
Implications for Academic Researchers
The findings of the current study show that consumer responses to product placement reflect distinct consumer socialization outcomes. In particular, individual cognitive and attitudinal perceptions about advertising are socialization outcomes that define various segments of the consumer population (segmentation), and how the various segments respond differently to product placement.
We extend previous product placement research in a more group-oriented or social factor-focused approach. While understanding overall responses of American consumers to product placement is important, it is also meaningful to know how different social groups respond in practice, particularly those who share analogous cognitive and attitudinal perspectives about advertising. Applying a consumer socialization frame, the present study underscores the importance of segmenting the population into distinct groups that can be taken into account when implementing increasingly important marketing communications tools. Many studies have proved that individual-difference factors were significant antecedents to the effectiveness of product placement in strengthening brands and increasing product sales, but this is the first research that has done so based on nationally representative data.
We also are the first to propose that different consumer segments based on socialization variables involving different general perceptions about advertising respond differently toward product placement, and these distinct responses reflect each segment’s demographic and media usage profile. Gregorio and Sung (2010) found a significant relationship between consumer socialization through peer communication, demographic variables, and media usage, on one hand, and responsiveness to product placement, on the other. We confirm their results using a nationally representative sample, and extend their results by using cluster analysis to segment consumers according to consumer socialization variables involving general perceptions of advertising, and then show a relationship between these variables and consumer responses to product placement. Consumer responses to product placement are not solely associated with social structural and agent variables, but rather are associated with a combination of social and individual variables, as argued by Alwitt and Prabhaker (1994). Our results confirm that individual attitudes toward advertising are explained by a combination of demographic variables and individual factors.
Methodologically, this study applied a new analytic method using Experian Simmons data in the context of the effects of product placement. Experian Simmons generates the sample by stratified sampling, using income and geographic data to construct the strata. Using nationally representative data is particularly important in cluster analysis (Hair et al., 2010) and in research on the impact of individual factors on product placement. Despite the limitations of measurement validity, using representative data will add to the value of the study.
Implications for Industry Practitioners
In practical terms, marketers should consider the unique characteristics that we have identified in various consumer segments when they employ product placement as a marketing communication tool. For example, when a marketer’s target audience is similar to Cluster 2, consumers with a low propensity to recognize brands and strong negative attitudes toward advertising in general, they should be aware that the effects of product placement will be minimized. Cluster 4, however, would be the most lucrative target audience for product placement, particularly with entertaining television programs and movies. If the programs or movies where brands or products are placed are not sufficiently fun or entertaining, however, the higher negative attitudes of this cluster could weaken the effect of product placement.
Furthermore, the increasingly popular, integrated marketing communication perspective suggests that while advertising and product placement have their unique benefits, the effect can be maximized when all types of marketing communications are integrated well. An important but unexamined question in this regard is how practitioners can strategically allocate their product placement funds when product placement is integrated with advertising, to maximize its effectiveness. This study can inform such decisions with identification of consumer segments with different perceptions and attitudes about advertising in general and how these segments react differently to product placement.
Limitations and Future Study
Experian Simmons data include some methodological limitations. First, although Park and Hoy (2015) developed a way to deconstruct the aggregate-level data into an individual-level dataset, the method permits no more than six variables in a single analysis. This restricted our ability to examine other potentially important measures as segmentation criteria. Future researchers may look through Simmons Oneview to identify other potentially relevant measures, and investigate their contribution in the clustering process.
Second, as Park and Hoy (2015) noted, Simmons data are based on self-reporting. This means that the validity of the data depends on the survey respondents’ ability to recall their past behavior and give accurate self-assessments of the ways they are influenced by marketing attempts. Product placement can be processed not only consciously but also unconsciously (Yang et al., 2006), but the self-reported survey method limits measuring implicit memory. While previous survey-based studies have been subject to the same limitations in product placement research (e.g., Gregorio & Sung, 2010), this should be considered in future studies. As with most survey data, it is also possible that the responses to our survey might have been affected by the social desirability bias, “where respondents report behavior they perceive as acceptable and not their actual behavior” (Brooks, 1988, p. 388). Considering that individuals are more likely to be influenced by marketing attempts to the extent that they do not recognize such influences (Friestad & Wright, 1994), future researchers are encouraged to explore alternative approaches such as experimentation to further investigate the effects of product placement. Simmons data also use single-item measures. We believe that the series of limitations inherent in the Simmons database can be counterbalanced by the desirable features of its sample, such as its size and generalizability. Future researchers may address these limitations with primary data.
Third, we used data collected in 2010 and released in 2011. Current consumer perceptions may not be identical to those of consumers when the data were collected. However, consumers’ socialization takes time, and does not easily change in only a few years. Thus, it does not seem problematic to apply the results of this study today.
Last, the Simmons data appear to have a marginal proportion of missing values. The sample size of the 2010 NCS was 24,463, but among them 21,944 respondents completed all four clustering variables. Considering that a representative sample is critical in cluster analysis, a 10.30% attrition rate may be a limitation to be noted.
Future study can address such limitations to obtain more reliable and valid results on how American consumers vary by their socialization, and subsequently respond to product placement in different ways. Besides the four factors we analyzed concerning general perceptions about advertising, future studies can examine other criteria to run cluster analysis. Different clusters, segmented by different outcomes of consumer socialization, may reveal diverse and interesting responses to product placement.
Footnotes
Declaration of Conflicting Interests
The author(s) declared no potential conflicts of interest with respect to the research, authorship, and/or publication of this article.
Funding
The author(s) received no financial support for the research, authorship, and/or publication of this article.