
Abstract
Although research shows that there is a correlation between political interest and news media use, whether there are reciprocal effects between political interest and news media use remain unsettled. To remedy this and go beyond previous research, this study seeks to investigate the reciprocal relationship between political interest and TV news use (a) across elections, (b) across election periods and a nonelection period, and (c) comparing public service and commercial TV news. Using four representative panel surveys, findings show that there is a reciprocal relationship between political interest and watching public service but not commercial TV news.
From a democratic perspective, one of the most important aspects of citizen attitudes toward politics and society is political interest. As shown by numerous studies, “political interest is typically the most powerful predictor of political behaviors that make democracy work” (Prior, 2010, p. 747). This includes following the news, with research consistently showing a positive relationship between political interest and news media use (Delli Carpini, 2004). As media environments have transformed into high-choice media environments, characterized by greater media abundance than ever (Prior, 2007; Van Aelst et al., 2017), several studies also suggest that political interest has become a more important predictor of news media use than it used to be (Hopmann, Wonneberger, Shehata, & Höijer, 2016; Prior, 2007; Strömbäck, Djerf-Pierre, & Shehata, 2013). Despite the democratic importance of political interest and news media use, there are, however, only few studies focusing on the reciprocal effects between political interest and news media use, that is, whether political interest influences news media use, which in turn influences political interest.
Three exceptions are Strömbäck and Shehata (2010), Boulianne (2011), and Kruikemeier and Shehata (2017). All these find some reciprocal relationships between political interest and news media use, but also differences across media types. With respect to TV news, still the most important source of news in Europe and the United States (European Commission, 2016; Gottfried & Shearer, 2017), the findings are furthermore not consistent. Although Strömbäck and Shehata (2010) found some reciprocal effects between political interest and TV news use, Boulianne (2011) found an effect of political interest on TV news use but not vice versa, and Kruikemeier and Shehata (2017) found that the effects of political interest on TV news use were stronger than the other way around. Whether there are reciprocal effects between political interest and TV news thus remains unsettled.
One key distinction in this context is between public service and commercial TV. By public service TV, we refer to not-for-profit broadcasting, regulated by, but independent from, the government, which fully or in part is funded by the government and/or license fees (Cushion, 2012). In recent years, a number of studies have shown not only that public service and commercial TV differ in terms of their supply of news and current affairs, but also that the effects of watching news on these types of channels differ. For example, research has shown that media systems with strong public service TV are characterized by, among other things, a greater supply of political information, greater opportunity structures for political news exposure, and citizens being more informed about hard news (Aalberg & Curran, 2012; Aarts & Semetko, 2003; Curran et al., 2014; Esser et al., 2012; Fraile & Iyengar, 2014). There is also some, if limited, evidence suggesting a stronger relationship between political interest and exposure to public service TV news compared with commercial TV news (Strömbäck & Shehata, 2010). Thus, it might be the case that the relationship between political interest and watching TV news differs depending on whether people watch public service or commercial TV news.
In light of previous research, several questions thus remain unanswered. First, whether there are reciprocal effects between political interest and TV news use is unclear. Second, it is unclear whether it makes a difference if people watch commercial or public service TV news. Third, most studies on the relationship between political interest and TV news use have been done in the context of election campaigns. As election campaigns are atypical, it is unclear whether findings hold during nonelection periods.
Against this background, the purpose of this study is to investigate the reciprocal relationship between political interest and TV news use (a) across elections, (b) across election periods and a nonelection period, and (c) comparing commercial and public service TV news. Empirically, the study uses four panel surveys done in Sweden during the election campaigns in 2010 and 2014 and a nonelection period between 2014 and 2016. By doing this, we will provide the most comprehensive test of the reciprocal effects between political interest and TV news exposure hitherto.
News Media Use and Political Interest
As political interest is such a powerful predictor of political behavior (Prior, 2010; Verba, Schlozman, & Brady, 1995), the relationship between political interest and news media use should be of key interest to anyone interested in political behavior more generally. Despite this, there are not many studies focusing on the causal and/or reciprocal effects between news media use and political interest. In most cases, political interest is used as a control variable, and while several studies show correlations between news media use and political interest (Curran et al., 2014; Wolfsfeld, Yarchi, & Samuel-Azran, 2016), correlations do not prove causation.
Conceptually, political interest has been defined as “the degree to which politics arouses a citizen’s curiosity” (van Deth, 1990, p. 278) or “the intrinsic motivation to engage in politics” (Shani, 2009, p. 59). Following such definitions, political interest is distinct from political behavior. Although behavioral dimensions of political engagement may be outcomes of a strong interest in politics, such behaviors are driven by other factors as well. As an intrinsic motivation, interest in politics is also distinct from extrinsic motivations to engage in politics, such as group pressures and feelings of civic duty (Ryan & Decci, 2000; Shehata & Amnå, 2017), which may exert a significant influence on participatory behaviors. Psychologists further distinguish between situational (state) and dispositional (trait) interest (Hidi & Renninger, 2006; Prior, 2010). Although situational interest is more short-term, volatile, and determined by immediate factors related to a particular context, dispositional interest can gradually develop out of an emerging interest and become a more stable individual trait (Hidi & Renninger, 2006). Finally, it is important to note that political interest captures a general orientation toward politics, compared with attitudes toward more specific issues. As such, interest in politics is likely to be less susceptible to fluctuation than interest in particular issues.
Theoretically, positive correlations between news media use and political interest may reflect three different routes of influence. First, political interest might influence the extent to which people follow the news. In such cases, correlations between political interest and news media use reflect a selection effect where those already politically interested seek out the news. Second, following the news media might influence political interest. In such cases, positive correlations between political interest and news media use reflect a media effect where those who follow the news get more interested in politics. Third, the effects might run in both directions, with political interest influencing news media use which, in turn, influences political interest. In such cases, the media effect is transactional in the sense that “the media effect is also the cause of its change” (Valkenburg & Peter, 2013, p. 223).
Following the reinforcing spirals model (RSM) developed by Slater (2007, 2015), the most likely scenario is that the relationship between political interest and news media use is dynamic and that “media use serves as both an outcome variable and a predictor variable” (Slater, 2015, p. 372). In a media environment characterized by media abundance, personal preferences cannot but influence people’s media use (Knobloch-Westerwick, 2014; Luskin, 1990; Prior, 2007), even though habitual and situational factors also matter (Wonneberger, Schoenbach, & van Meurs, 2011). Hence, some selection effects are inevitable. At the same time, research on agenda setting and framing, among other theories, has shown that media can have an impact on people’s cognitions, attitudes, and opinions (Arendt & Matthes, 2014; Maurer, 2014). Although personal preferences are likely to influence people’s media use, it is thus also likely to influence their preferences. Media use should hence be conceived of as an integral part of the processes through which people’s cognitions, attitudes, opinions, and preferences are formed.
In this context, it should be noted that the idea of a reciprocal relationship between political interest and news media use is not new. Already in the The People’s Choice study, Lazarsfeld, Berelson, and Gaudet (1948) suggested a reciprocal process between exposure to campaign communication and voter interest over the course of an election campaign. This finding was replicated in the Elmira study, noting that the “appetite grows by what it feeds on” (Berelson, Lazarsfeld, & McPhee, 1954, p. 246), and in later studies (Asp, 1986; Weaver, Graber, McCombs, & Eyal, 1981). Important to note though is that these studies focused on campaign interest rather than general political interest—attitudes that are strongly related, yet distinct. Most importantly, campaign interest may be more situational than general interest in politics, and thereby more open to social influences (Weaver et al., 1981).
To disentangle whether correlations between political interest and news media use reflect selection effects, media effects or reinforcing spirals, requires access to longitudinal data. To date, there are, however, only three studies using panel data to investigate the reciprocal relationship between political interest and news media use. In the first, Strömbäck and Shehata (2010) used a panel study in the context of the 2006 Swedish election to investigate the relationships between political interest and (a) attention to political news and (b) news media exposure. In terms of attention to political news, they found both lagged and synchronous effects between political interest and attention to political news, but also that selection effects were stronger than the media effects. In terms of exposure to various news media, among other things they found effects of political interest on exposure to public service TV news programs, and some media effects from exposure to one (of the two) public service TV news programs, but no effects related to watching commercial TV news.
In the second study, Boulianne (2011) used panel data from the American National Election Studies (ANES) in 2008 to investigate how “the relationship of political interest and media use depends on the type of media use.” Her findings showed that political interest in the first wave had an impact on watching TV news but not on reading online or print news in the second wave, while use of online news and print news but not TV news had an impact on political interest in the third wave. Focusing on TV, Boulianne (2011) thus concluded, “Television news is the medium of choice for those citizens who are already interested in politics more than a method for stimulating political interest” (p. 157).
In the most recent study, Kruikemeier and Shehata (2017) used a panel study among adolescents in Sweden to investigate whether there are reciprocal relationships between traditional news media and online news consumption and political engagement, where one of the indicators of political engagement was political interest. Using cross-lagged structural equation modeling, they found that “reciprocal effects are evident only with respect to newspapers” (p. 229). With respect to TV news, political interest had an effect but not the other way around, that is, they found selection effects but no media effects.
Importantly, although political interest is partly influenced by situational factors, such as ongoing election campaigns, research suggests that political interest is quite stable once people have reached the early 20s of their age (Neundorf, Smets, & García-Albacete, 2013; Prior, 2010; Russo & Stattin, 2017; Shehata & Amnå, 2017). News media use may, however, be more variable and subject to situational determinants, although habitual factors also matter. Thus, even though there is a reciprocal relationship between political interest and news media use, the effect of political interest on news media use may be stronger than vice versa. Against this background, our first hypotheses are as follows:
In essence, what we expect is that there will be a reciprocal relationship between political interest and TV news use, but also that the selection effect addressed by
All TV News Might Not Be Created Equal: The Impact of Public Service
Although the hypotheses above pertain to all kinds of TV news, it might be the case that there is a reciprocal relationship between political interest for some but not other kinds of TV news. A key distinction in this context is between commercial and public service TV news. During recent years, a number of studies have shown that media systems with strong public service TV are characterized by a greater supply of political information and greater opportunity structures for exposure to political news (Esser et al., 2012), but also citizens being better informed about hard news (Aalberg et al., 2013; Fraile & Iyengar, 2014; Soroka et al., 2013). There are also a number of studies showing that public service TV news tend to provide more hard news (Iyengar et al., 2010; Reinemann, Stanyer, & Scherr, 2017), more issue-framed rather than game-framed news (Aalberg, de Vreese, & Strömbäck, 2017; Aalberg, Strömbäck, & de Vreese, 2012), more international news (Aalberg et al., 2013), and less interpretive news (Salgado, Strömbäck, Aalberg, & Esser, 2017) than commercial TV news. Research also suggests stronger knowledge effects from watching public service than commercial TV news (Strömbäck, 2017). One 16-country study thus concludes that “Public service broadcasting is good for news performance, provided that the public broadcaster has the necessary financial and political autonomy from power holders” (de Vreese et al., 2017, p. 178; see also Aalberg & Curran, 2012; Cushion, 2012; Nielsen, Fletcher, Sehl, & Levy, 2016).
Taken together, this suggests that the effects of political interest on TV news use and vice versa can be expected to be stronger for public service than for commercial TV news. First, it might be assumed that public service TV news has a reputation for focusing more on hard political news than commercial TV news, leading those who are politically interested to select public service rather than commercial TV news (selection effect). Second, as news performance usually is better in public service than commercial TV news, watching these might have a stronger impact on political interest than watching commercial TV news (media effect). Largely consistent with such a scenario, Strömbäck and Shehata (2010) found that political interest had an impact on watching public service but not commercial TV news. They also found effects from watching one of the two public service TV news programs on political interest, but not from watching commercial TV news. Similar results were found by Curran et al. (2014), using cross-sectional data. Based on this, we hypothesize the following:
What these hypotheses suggest is that there is a reciprocal relationship between political interest and public service but not commercial TV news use. If so, that would be consistent with the “dual effects hypothesis” proposed by Aarts and Semetko (2003), with the effects of watching TV news contingent on what kind of TV news people are watching.
The Contingencies of the Relationship Between Political Interest and TV News Use
Thus far we have assumed that the relationship between political interest and TV news use is independent of political context, but that is not self-evident. That holds particularly true with respect to the distinction between election and nonelection periods. It is well known that election periods are atypical in a number of respects, ranging from how intensively parties campaign (Johnson, 2016) to how the media cover elections (Strömbäck & Kaid, 2008) and how mobilized citizens are politically (Norris, 2006), and that might influence the relationship between political interest and news media use.
It is less clear, however—and no research directly pertaining to—how the relationship between political interest and TV news use might differ between election periods and nonelection periods. To explore this, and thereby also to test the robustness of the results, we ask the following two research questions:
Case Selection, Methodology, and Data
Empirically, this study focuses on the case of Sweden. To give a short introduction to the Swedish case, since the 1990s, Sweden has a dual broadcasting system with both public service and commercial TV broadcasting. There are only three regular TV news programs at the national level. Two of these (Rapport and Aktuellt) are broadcast by public service TV channels, whereas the third (TV4 Nyheterna) is broadcast by the commercial channel TV4 (Strömbäck & Nord, 2008). Although media use has undergone major changes during the last decade, watching TV news is still the most common form of news media use in Sweden (Oscarsson & Bergström, 2017; Shehata & Strömbäck, 2018). According to the national SOM surveys and in terms of regular news use, in 2016, 48% watched national news on public service whereas 39% read a morning newspaper in print, 34% watched national news on commercial TV4, 33% read a tabloid online, 29% listened to public service radio news, and 24% read a morning newspaper online (Oscarsson & Bergström, 2017).
To test the hypotheses and answer the research questions above, this study will make use of four panel studies. Two were done during the 2010 election campaign, one during the 2014 election campaign, and one during the nonelection period between 2014 and 2016. Below, we will describe each panel survey, before detailing our measures and analytical strategy.
The 2010 Panel Surveys
During the 2010 Swedish national election campaign, two panel surveys with different samples were done. Both samples were drawn using stratified probability sampling from a database of approximately 28,000 citizens from the polling firm Synovate’s pool of web survey participants. The participants included in this pool are recruited continuously using both random digit dialing and mail surveys based on random probability samples. Approximately 5% of those who are initially contacted and invited agree to be part of this pool of respondents. The pool is largely representative for the Swedish population in terms of sociodemographic factors.
The four-wave panel study is based on a stratified probability sample of 4,010 respondents aged 18 to 74 years from this pool, stratified by gender, age, county size, political interest, and Internet use, so as to be as representative of the Swedish population aged 18 to 74 years as possible. Respondents were asked to complete an online survey 4 times during the months leading up to the election. Wave 1 of the panel took place in May (May 3-20), Wave 2 in mid-June (June 14-23), Wave 3 in mid-August (August 16-23), and Wave 4 the week after Election Day (September 20-27). 1,413 respondents participated in all four waves, resulting in a total cooperation rate of 35%.
The two-wave panel study was conducted to mirror the last two waves of the four-wave study in terms of timing and question wording. A stratified probability sample of 1,912 pool members was drawn based on gender, age, county size, political interest, and Internet use. The first wave was done in mid-August (August 16-23) whereas the second wave took place the week after Election Day (September 20-27). Approximately 68% participated in Wave 1 in August, and of those 1,305 respondents, 75% also completed the September questionnaire—yielding a total cooperation rate of 51%. 1
The 2014 Panel Survey
The sample for the 2014 four-wave Election study was drawn using stratified probability sampling from a database of approximately 35,000 citizens from the polling firm Novus’s pool of Web survey participants. The participants in this pool are recruited continuously using random digit dialing. Approximately 7.8% of those who are initially contacted and invited agree to be part of this pool of respondents. The pool is largely representative for the population in terms of sociodemographic characteristics. A sample of 6,897 respondents aged 18 to 75 years was invited to take part in the first panel wave. Only those who completed the first wave of the survey (52%) were invited to take part in the following three waves. The first wave was done in April (April 11-22), Wave 2 in late May and early June (May 26-June 4), Wave 3 6 weeks before the national election (August 1-13), and Wave 4 the week after Election Day (September 15-24). 2,281 respondents participated in all four waves, yielding a total cooperation rate of 33%. 2
The 2014-2016 Panel Survey
The three-wave non-election study is based on an identical sampling procedure as the 2014 Election study, using the same pool of respondents. A new sample of 7,652 respondents was invited to take part in the first wave of the study in November 2014 (November 13-25). The second wave was conducted 1 year later (November 12-24, 2015), whereas the third wave was conducted 2 years after the first wave (November 10-22, 2016). Those who completed the survey (51%) in the first wave were invited to participate in subsequent waves. 2,254 respondents participated in all three waves, yielding a total cooperation rate of 29%. 3
Measures and Data Analyses
One major strength of our research design is that the key variables—TV news exposure and political interest—are measured identically across the four panel studies. This enables a direct comparison and sensitivity test across elections and contexts.
Political interest is measured using the standard item “In general, how interested are you in politics,” with response categories ranging from 1 (not at all interested) to 4 (very interested). Although using a single-item to measure political interest is not optimal, it is a rather standard procedure in political science (Prior, 2010). The specific item used here is also very similar to measures in the European social survey (ESS) and the world values survey (WVS). Exposure to TV news is based on a battery of items following the question “During the last week, how many days did you watch the following news programs on radio or television?” In this study, we will use the responses with respect to the national news programs on TV, that is, Aktuellt (SVT, public service), Rapport (SVT, public service), and TV4 Nyheterna (TV4, commercial). The response alternatives—reverse coded—were “daily” (6), “5-6 days a week” (5), “3-4 days a week” (4), “1-2 days a week” (3), “more seldom” (2) and “never” (1). In our analyses, exposure to the public service news shows was combined into an averaged index (Wave 1 Pearson’s r = .79-.81 across the four panel studies).
Given the nature of our data and our interest in the reciprocal effects between TV news exposure and political interest, we estimate a series of autoregressive cross-lagged models using structural equation modeling (Acock, 2013; Finkel, 1995). Apart from enabling an identical analytic procedure across the four panel studies irrespective of the number of panel waves available, such an approach has several advantages. The inclusion of a lagged dependent variable not only enables analyses of how each predictor is related to changes in the dependent variables over time, but it is also a way of accounting for (omitted) factors that are assumed to influence this variable at a previous stage. Thereby, the lagged dependent variable functions as a “catch-all” control variable capturing both political interest and TV news exposure up until the previous panel wave. The cross-lagged effects indicate the presence of mutual influence between the two variables over time. As both political interest and TV news exposure are ordinal-level variables, we also estimate all cross-lagged models using generalized structural equation modeling with an ologit specification for each equation. Finally, to address
Results
In this section, we will present our findings, focusing on the cross-lagged effects from a series of structural equation models. For the sake of simplicity, the main results are shown in figures, but full tables from each structural equation are available in the appendix.
Political Interest and General TV News
We start by addressing

Cross-lagged effects between TV news and political interest (2010 election study).
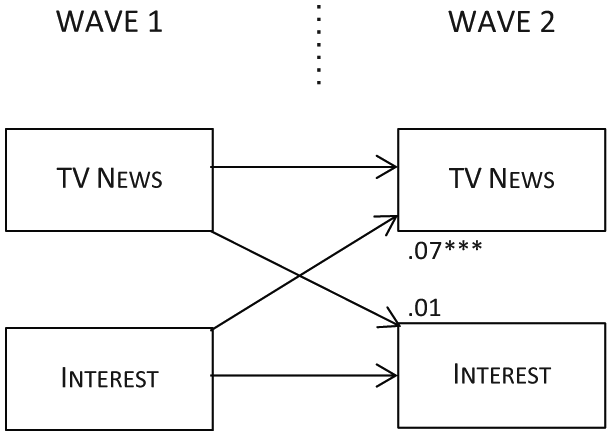
Cross-lagged effects between TV news and political interest (2010 two-wave election study).
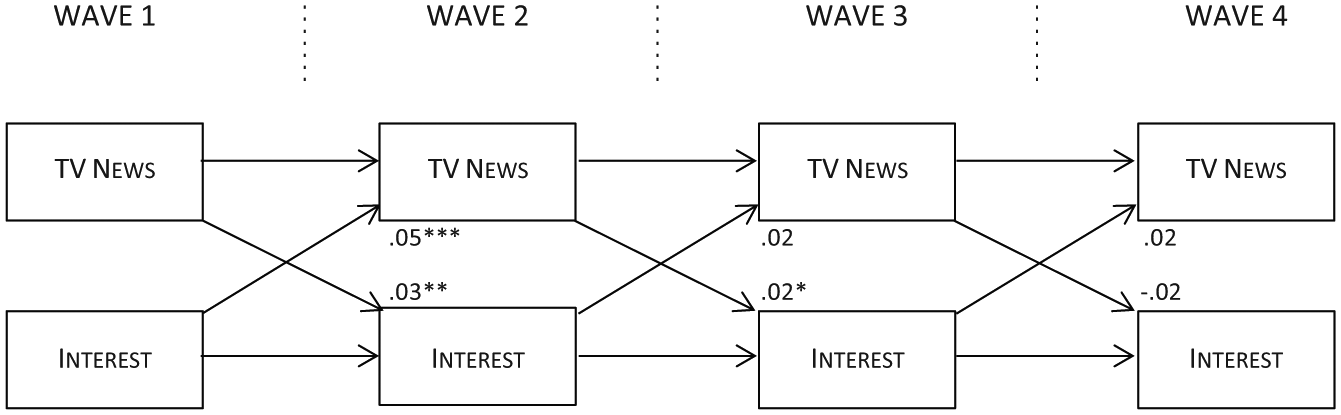
Cross-lagged effects between TV news and political interest (2014 election study).
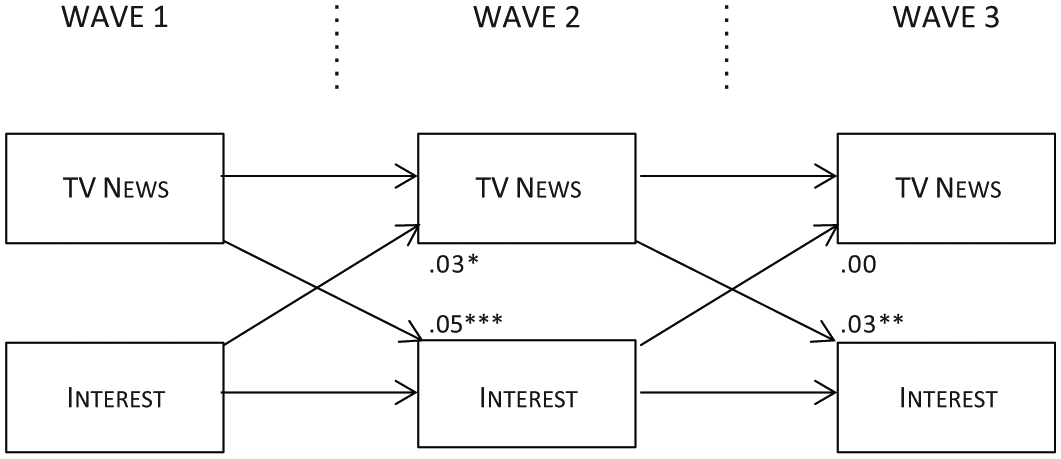
Cross-lagged effects between TV news and political interest (nonelection study).
Taken together, the results show a somewhat scattered pattern of reciprocal effects, with a total of five significant selection effects and five media effects—yielding some, but not complete, support to
Tests of Differences in Coefficients for Selection and Media Effects.
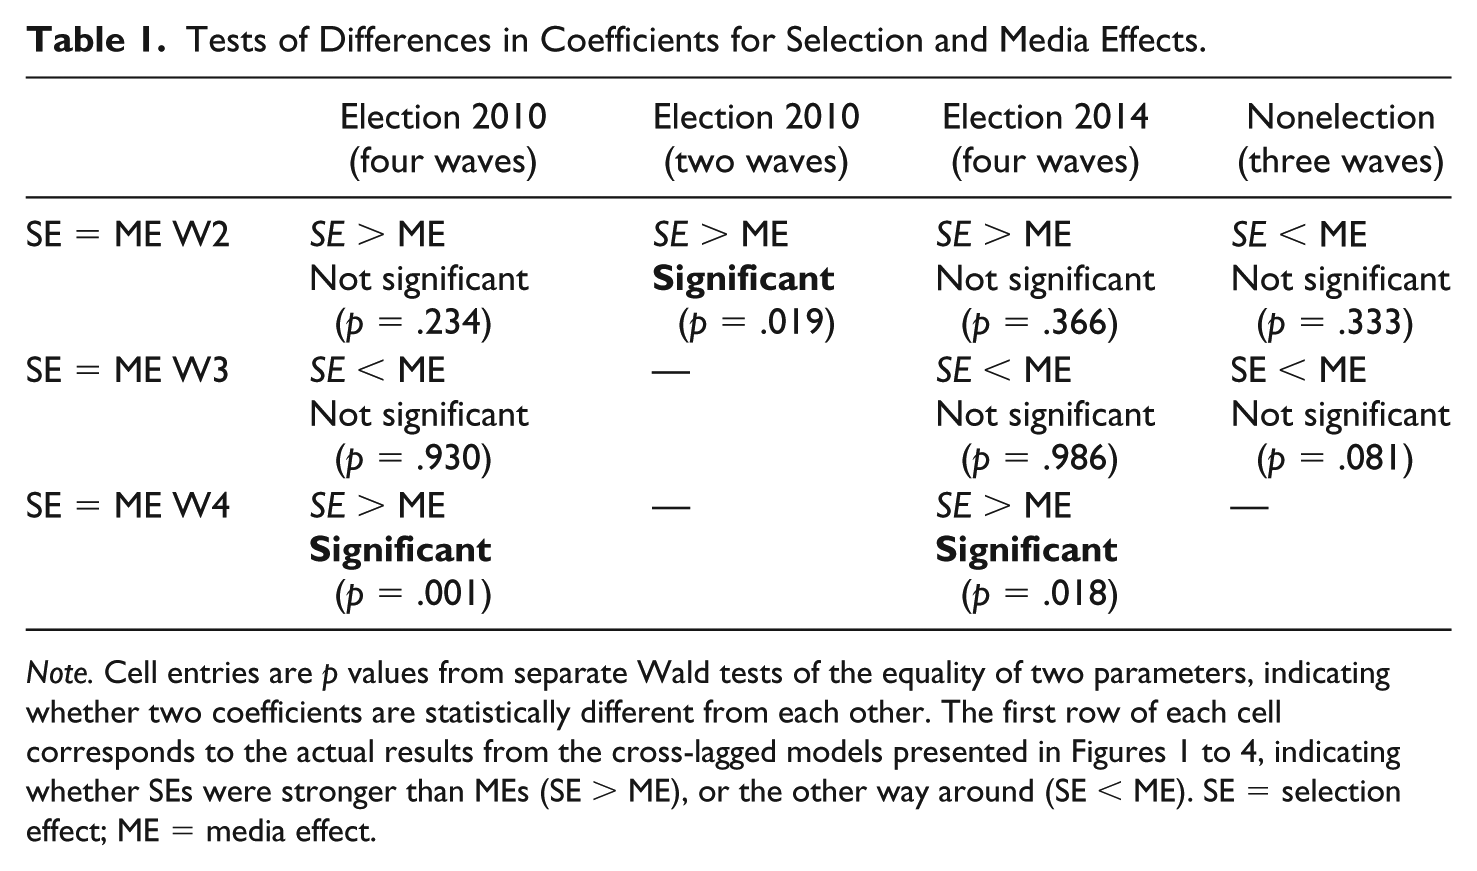
Note. Cell entries are p values from separate Wald tests of the equality of two parameters, indicating whether two coefficients are statistically different from each other. The first row of each cell corresponds to the actual results from the cross-lagged models presented in Figures 1 to 4, indicating whether SEs were stronger than MEs (SE > ME), or the other way around (SE < ME). SE = selection effect; ME = media effect.
Political Interest, Public Service, and Commercial TV News
Turning to
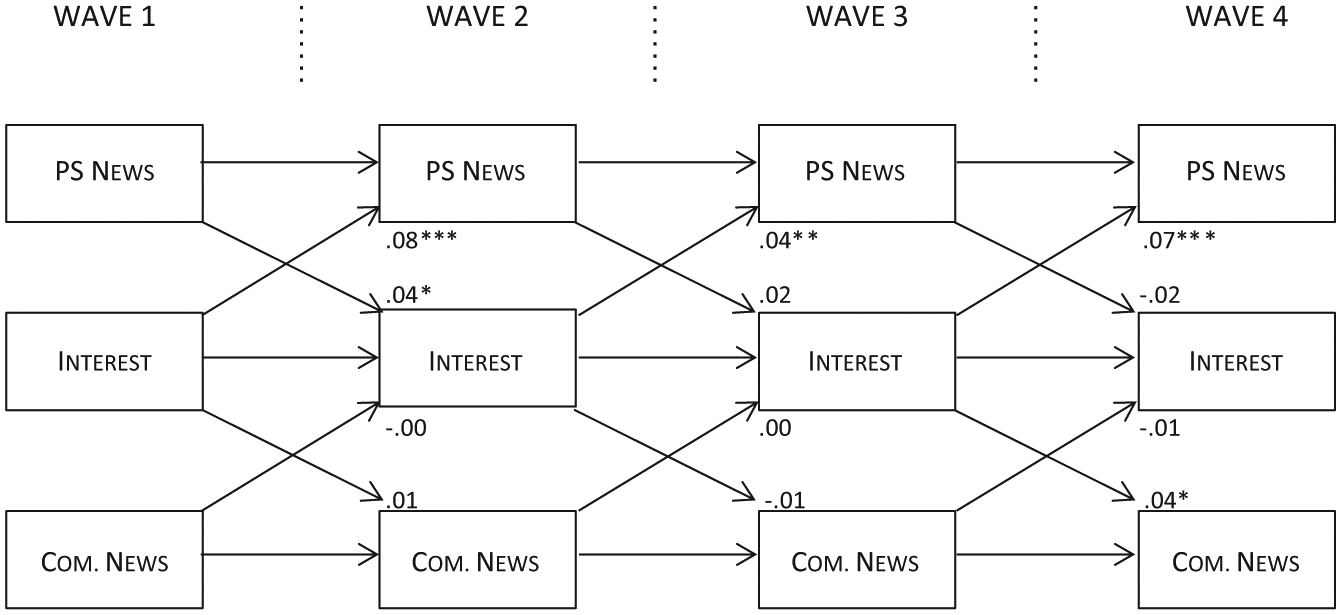
Cross-lagged effects between TV news and political interest (2010 four-wave election study).
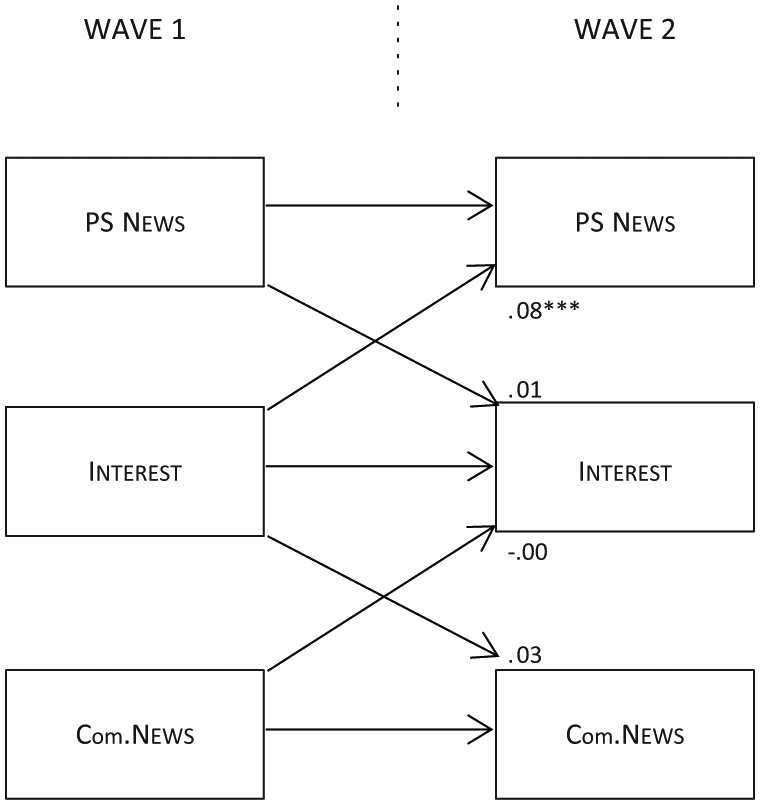
Cross-lagged effects between TV news and political interest (2010 two-wave election study).
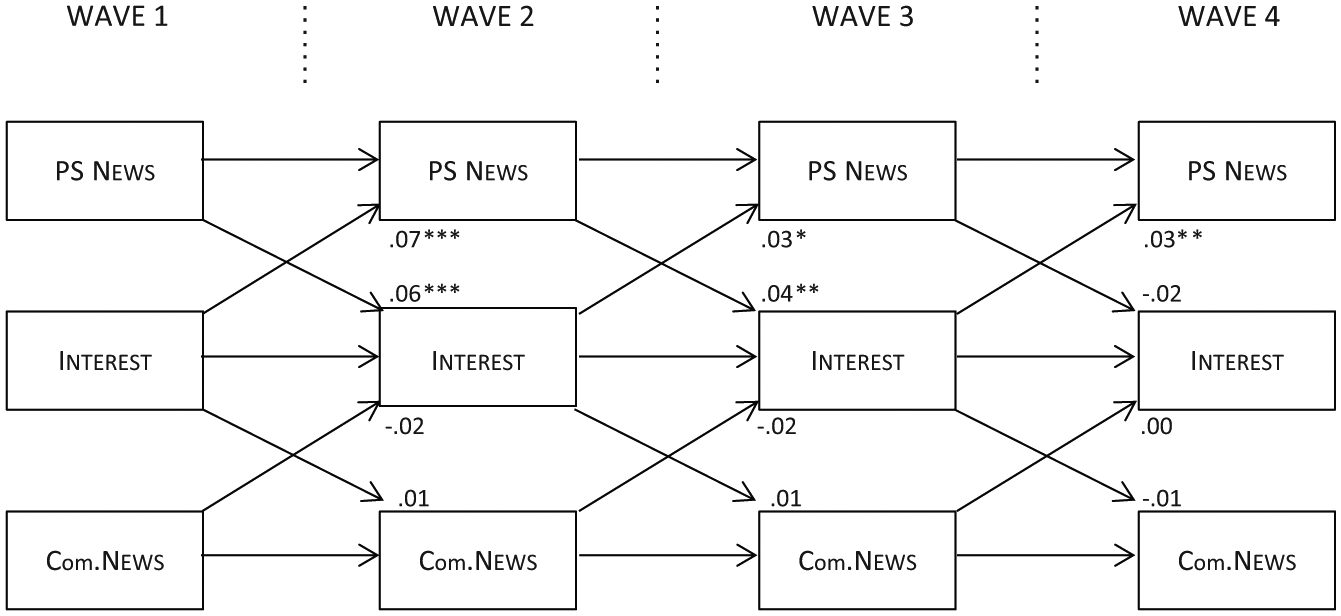
Cross-lagged effects between TV news and political interest (2014 election study).
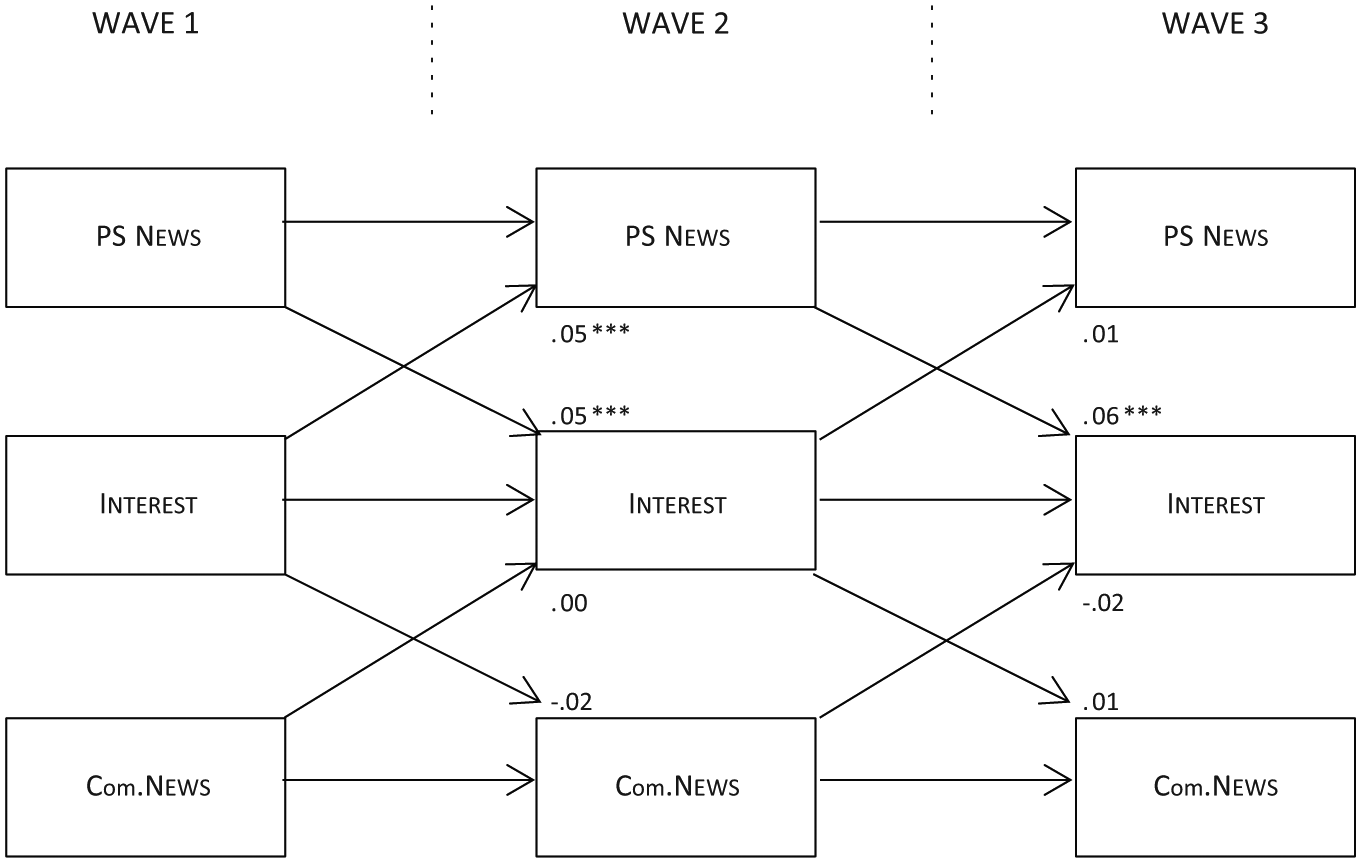
Cross-lagged effects between TV news and political interest (nonelection study).
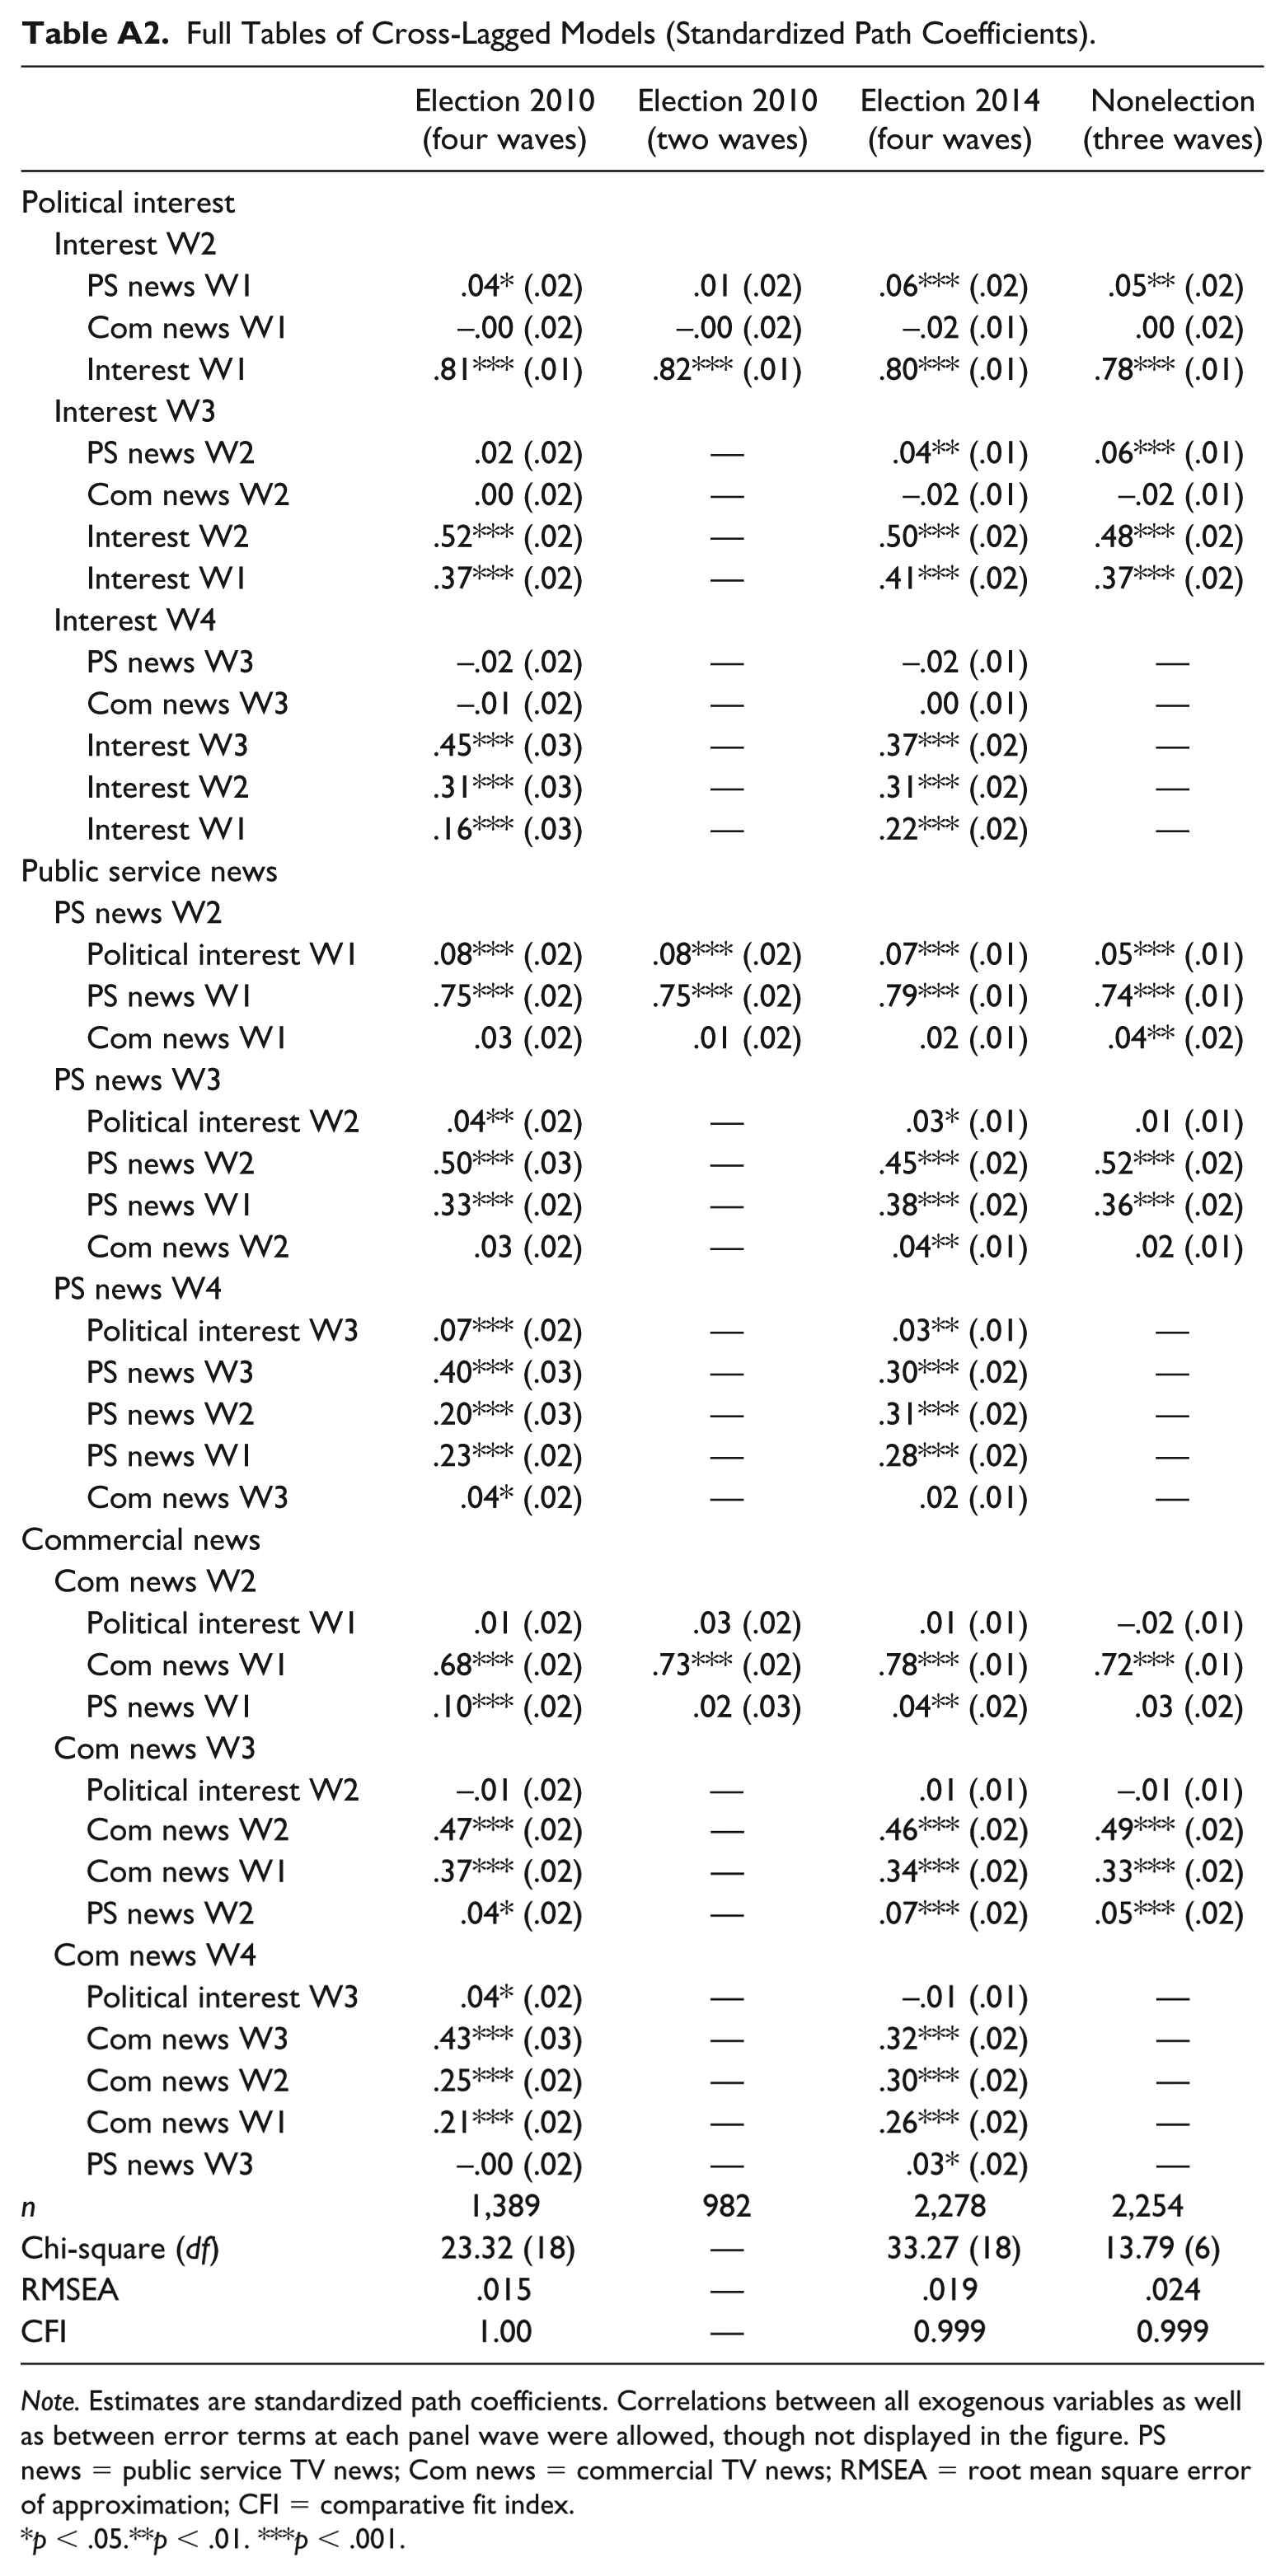
Figure 5 displays findings from the four-wave 2010 Election panel survey, showing a consistent set of selection effects running from political interest to public service TV news (bWave1–Wave2 = 0.08, p < .001; bWave2–Wave3 = 0.04, p < .01; bWave3–Wave4 = 0.07, p < .001), but only one case of reverse influences on political interest (bWave1–Wave2 = 0.04, p < .05). Very little appear to be going on with respect to commercial TV news, however—apart from one positive effect going from political interest to news exposure in the last panel wave (bWave3–Wave4 = 0.04, p < .05). Figure 6 replicates these analyses using the 2010 two-wave election campaign panel study. As can be seen, only one significant effect is detectable, with political interest being positively related to public service TV news exposure (bWave1–Wave2 = 0.08, p < .001) but not the other way around. Turning to the four-wave 2014 election study, the results (Figure 7) show that there is a positive and consistent effect of political interest on watching public service TV news (bWave1–Wave2 = 0.07, p < .001; bWave2–Wave3 = 0.03, p < .05; bWave3–Wave4 = 0.03, p < .01), as well as a positive effect of public service news on political interest across two out of the three tests (bWave1–Wave2 = 0.06, p < .001; bWave2–Wave3 = 0.04, p < .01). Again, however, none of the effects between political interest and commercial TV news are statistically significant. Finally, this pattern is largely replicated in the three-wave nonelection study (Figure 8). Across the three waves, there is a consistent positive effect of public service TV news exposure on political interest (bWave1–Wave2 = 0.05, p < .01; bWave2–Wave3 = 0.06, p < .001) and some, but less consistent, evidence of reversed influence from political interest to public service TV news (bWave1–Wave2 = 0.05, p < .001; bWave2–Wave3 = 0.01, p > .05). None of the effects between political interest and commercial TV news exposure are significant, however. 5
In sum, across panel studies, the results suggest that there are reciprocal effects between political interest and public service TV news exposure, but not when it comes to commercial TV news. To provide a formal test of
Tests of Differences in Coefficients for Public Service and Commercial News.
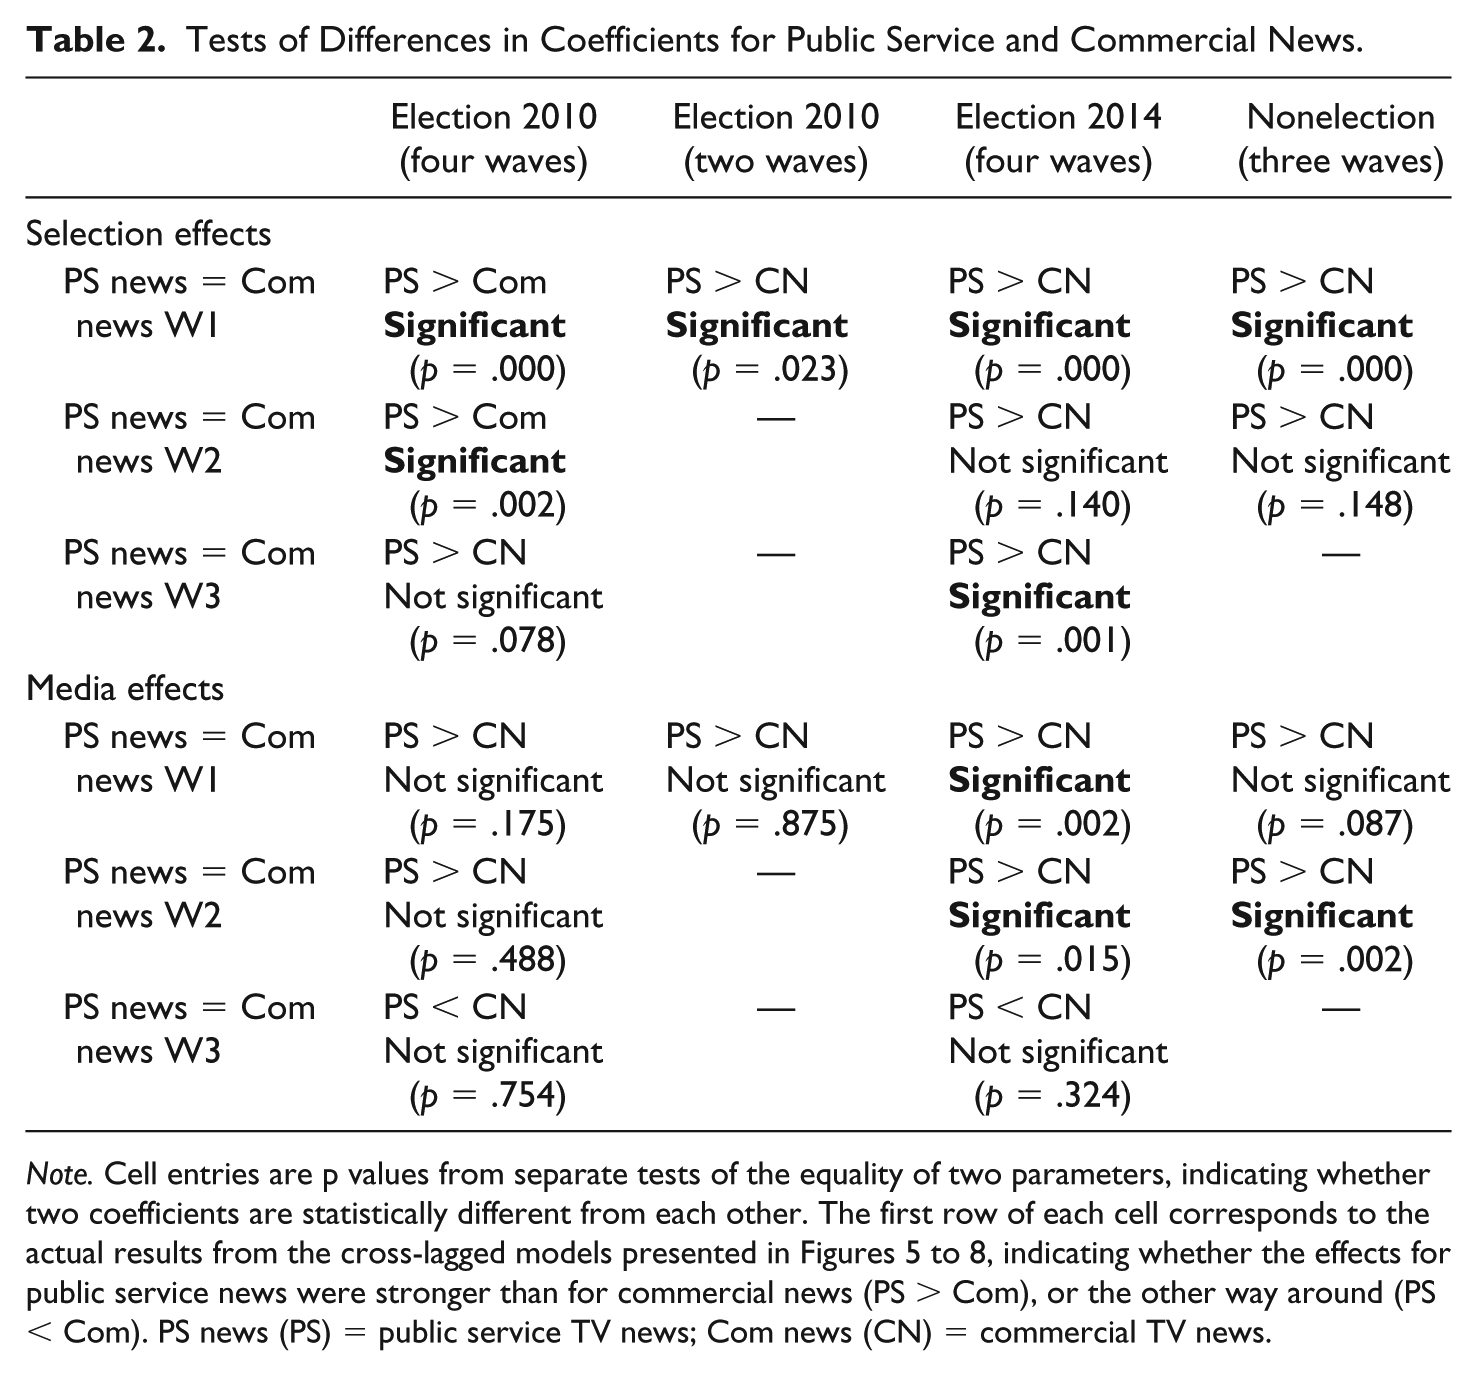
Note. Cell entries are p values from separate tests of the equality of two parameters, indicating whether two coefficients are statistically different from each other. The first row of each cell corresponds to the actual results from the cross-lagged models presented in Figures 5 to 8, indicating whether the effects for public service news were stronger than for commercial news (PS > Com), or the other way around (PS < Com). PS news (PS) = public service TV news; Com news (CN) = commercial TV news.
Using a similar approach, we also tested whether selection effects were statistically more consistent than media effects across the cross-lagged models (not displayed). In total, eight significant selection effects were found in the original models but only five significant media effects. A series of tests of differences revealed that selection effects were significantly stronger than the corresponding media effects in four cases, whereas the opposite was true in one case. The results thereby suggest that the effect of political interest on news exposure is somewhat more consistent than the reversed effect (partly supporting
Conclusion and Discussion
Although there is convincing evidence that there is a positive relationship between political interest and news media use, based on previous research, it has not been clear what the relationship between political interest and news media use actually signifies. On one hand, positive correlations could reflect a selection effect, whereby those who are politically interested turn to the news media to learn about the latest from the world of politics. On the other hand, such correlations could also reflect a media effect, according to which news media use increases political interest. Alternatively, both mechanisms may be at work, producing a virtuous circle of reinforcing influences between political interest and news media use (Norris, 2000; Slater, 2015).
Based on this, the present study has aimed at contributing to the literature on the relationship between political interest and news media use in three distinct ways. First, in line with calls for more research integrating selection and media effects (Lecheler & de Vreese, 2017), we have sought to disentangle the reciprocal relationship between TV news exposure and political interest using several multiwave panel studies conducted in both election and nonelection settings. Second, following research on differences between broadcasting systems and types of TV channels, we have sought to analyze the differential role of public service and commercial TV news in terms of the reciprocal relationship between political interest and news exposure. Third, we have investigated whether our findings are sensitive to context, and more specifically between election periods and nonelection periods.
In sum, the findings suggest that public service TV makes a difference. Across panel studies and cross-lagged models, all the mutual reinforcement between news exposure and political interest that takes place occurs for public service TV news only. Although we find some evidence for general effects of TV news (
These findings have several important implications. First, they suggest that all TV news is not created equal. This finding is consistent with Aarts and Semetko’s (2003) findings, and underlines the importance of not making statements about the effects of political interest or other motivations on TV news use in general or of using TV news in general on political interest or other motivations. Second, although selection effects were more common than media effects, considering that political interest is “extremely stable” (Prior, 2010, p. 757), it is noteworthy that we found several media effects on political interest. This indicates that news media—in this case public service TV—can have an impact on motivations that, from a democratic perspective, are desirable. Third, and related to the more general discussion about “virtuous circles”—suggesting media have positive democratic influences—and “media malaise”—suggesting media have negative democratic influences—(Cappella & Jamieson, 1997; Norris, 2000; Strömbäck & Shehata, 2010), our findings suggest that a virtuous circle is at work with respect to public service broadcasting. Important to note though is that we did not find any evidence of negative effects on political interest from watching commercial TV news. Fourth, and more problematic, the reciprocal relationships between political interest and watching public service but not commercial TV news suggest that we might be facing increasing gaps in political interest and TV news use over time. This holds particularly true in light of the transformation to high choice media environments, as research suggests that increasing media choice results in individual motivations—such as political interest—becoming more important predictors of news media use (Prior, 2007; Strömbäck et al., 2013). As both political interest and news media use are related to several political attitudes and behaviors that from a democratic perspective are desirable, including political knowledge and participation (Aalberg & Curran, 2012; Aarts & Semetko, 2003; Soroka et al., 2013), the extent to which people watch public service versus commercial TV news is likely to have an impact on the development towards democracies “divided between the involved and the uninvolved” (Aarts & Semetko, 2003, p. 778).
Although this study has provided the most comprehensive tests of the relationship between political interest and TV news so far, a few shortcomings should be noted. First, despite being very common, measuring political interest with a single survey item is not optimal. The ordinal scale also minimizes the amount of variation over time, which could be reflected in a higher level of stability than more fine-grained measurements would show. Second, while panel surveys significantly improve our abilities to make causal claims by enabling analyses over time, they do not solve the problem of causality. To address the issue of causality more compellingly, experimental data would be needed. Here, it is also worth noting that although the panel studies presented here are significantly stronger in terms of external validity than experiments, our surveys still suffer from some of the biases that typically plague panel studies. In particular, citizens with higher education and political interest are to some extent overrepresented in the final samples—which may have an influence on the findings. Although it is likely that such biases affect point estimates of specific news media uses and political interest among the population, it is less clear to what extent the reciprocal influences uncovered by our findings are affected. The fact that we have significant variation in our samples on important variables may be more important in this regard. Third, a major strength of this study is the ability to assess the sensitivity of our findings across multiple panel studies in general, and between an election and nonelection period in particular. It should be noted, however, that perfectly matched comparisons between these settings were not possible, because the studies may vary along multiple dimensions beyond the specific election versus nonelection context—including the longer time lags between panel waves, potential period effects, and so on. Still, the very similar pattern of findings clearly suggest that the reciprocal processes are not to be confined to a specific contextual setting, but appear to be part of a more general process. As such, our ability to go beyond the election context significantly strengthens our confidence in the findings.
Footnotes
Appendix
Full Tables of Cross-Lagged Models (Standardized Path Coefficients).
| Election 2010 |
Election 2010 |
Election 2014 |
Nonelection |
|
|---|---|---|---|---|
| Political interest | ||||
| Interest W2 | ||||
| PS news W1 | .04* (.02) | .01 (.02) | .06*** (.02) | .05** (.02) |
| Com news W1 | −.00 (.02) | −.00 (.02) | −.02 (.01) | .00 (.02) |
| Interest W1 | .81*** (.01) | .82*** (.01) | .80*** (.01) | .78*** (.01) |
| Interest W3 | ||||
| PS news W2 | .02 (.02) | — | .04** (.01) | .06*** (.01) |
| Com news W2 | .00 (.02) | — | −.02 (.01) | −.02 (.01) |
| Interest W2 | .52*** (.02) | — | .50*** (.02) | .48*** (.02) |
| Interest W1 | .37*** (.02) | — | .41*** (.02) | .37*** (.02) |
| Interest W4 | ||||
| PS news W3 | −.02 (.02) | — | −.02 (.01) | — |
| Com news W3 | −.01 (.02) | — | .00 (.01) | — |
| Interest W3 | .45*** (.03) | — | .37*** (.02) | — |
| Interest W2 | .31*** (.03) | — | .31*** (.02) | — |
| Interest W1 | .16*** (.03) | — | .22*** (.02) | — |
| Public service news | ||||
| PS news W2 | ||||
| Political interest W1 | .08*** (.02) | .08*** (.02) | .07*** (.01) | .05*** (.01) |
| PS news W1 | .75*** (.02) | .75*** (.02) | .79*** (.01) | .74*** (.01) |
| Com news W1 | .03 (.02) | .01 (.02) | .02 (.01) | .04** (.02) |
| PS news W3 | ||||
| Political interest W2 | .04** (.02) | — | .03* (.01) | .01 (.01) |
| PS news W2 | .50*** (.03) | — | .45*** (.02) | .52*** (.02) |
| PS news W1 | .33*** (.02) | — | .38*** (.02) | .36*** (.02) |
| Com news W2 | .03 (.02) | — | .04** (.01) | .02 (.01) |
| PS news W4 | ||||
| Political interest W3 | .07*** (.02) | — | .03** (.01) | — |
| PS news W3 | .40*** (.03) | — | .30*** (.02) | — |
| PS news W2 | .20*** (.03) | — | .31*** (.02) | — |
| PS news W1 | .23*** (.02) | — | .28*** (.02) | — |
| Com news W3 | .04* (.02) | — | .02 (.01) | — |
| Commercial news | ||||
| Com news W2 | ||||
| Political interest W1 | .01 (.02) | .03 (.02) | .01 (.01) | −.02 (.01) |
| Com news W1 | .68*** (.02) | .73*** (.02) | .78*** (.01) | .72*** (.01) |
| PS news W1 | .10*** (.02) | .02 (.03) | .04** (.02) | .03 (.02) |
| Com news W3 | ||||
| Political interest W2 | −.01 (.02) | — | .01 (.01) | −.01 (.01) |
| Com news W2 | .47*** (.02) | — | .46*** (.02) | .49*** (.02) |
| Com news W1 | .37*** (.02) | — | .34*** (.02) | .33*** (.02) |
| PS news W2 | .04* (.02) | — | .07*** (.02) | .05*** (.02) |
| Com news W4 | ||||
| Political interest W3 | .04* (.02) | — | −.01 (.01) | — |
| Com news W3 | .43*** (.03) | — | .32*** (.02) | — |
| Com news W2 | .25*** (.02) | — | .30*** (.02) | — |
| Com news W1 | .21*** (.02) | — | .26*** (.02) | — |
| PS news W3 | −.00 (.02) | — | .03* (.02) | — |
| n | 1,389 | 982 | 2,278 | 2,254 |
| Chi-square (df) | 23.32 (18) | — | 33.27 (18) | 13.79 (6) |
| RMSEA | .015 | — | .019 | .024 |
| CFI | 1.00 | — | 0.999 | 0.999 |
Note. Estimates are standardized path coefficients. Correlations between all exogenous variables as well as between error terms at each panel wave were allowed, though not displayed in the figure. PS news = public service TV news; Com news = commercial TV news; RMSEA = root mean square error of approximation; CFI = comparative fit index.
p < .05.**p < .01. ***p < .001.
Declaration of Conflicting Interests
The author(s) declared no potential conflicts of interest with respect to the research, authorship, and/or publication of this article.
Funding
The author(s) disclosed receipt of the following financial support for the research, authorship, and/or publication of this article: This research was supported by the Axel and Margaret Ax: son Johnson Foundation.